Cities with the Highest Percentage of Population with a Degree in Liberal Arts and History in Pennsylvania
RELATED REPORTS & OPTIONS
Liberal Arts and History
Pennsylvania
Compare Cities
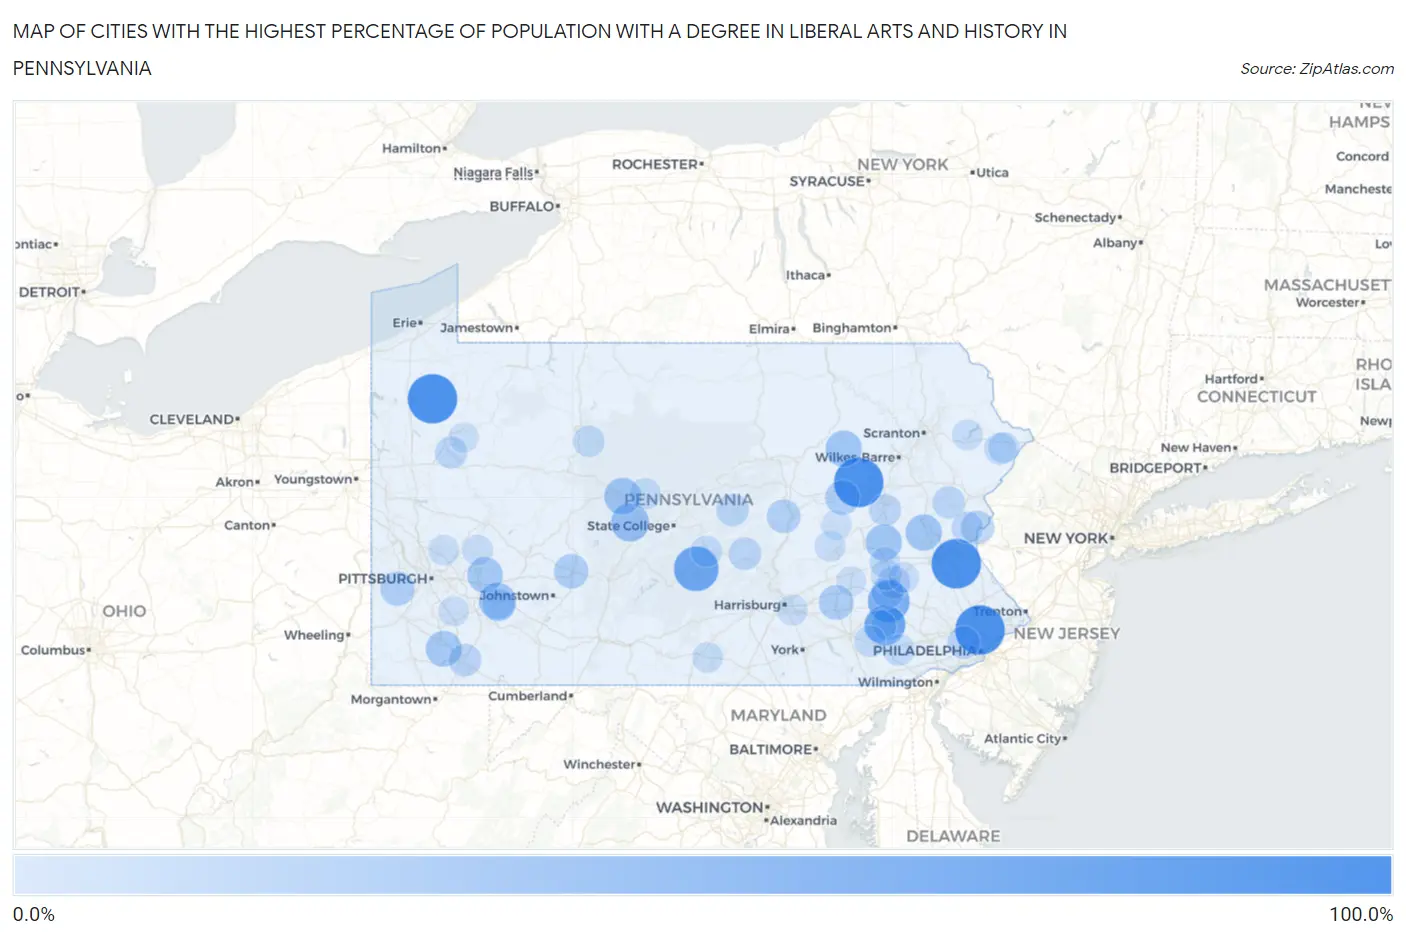
Map of Cities with the Highest Percentage of Population with a Degree in Liberal Arts and History in Pennsylvania
0.0%
100.0%
Cities with the Highest Percentage of Population with a Degree in Liberal Arts and History in Pennsylvania
| City | % Graduates | vs State | vs National | |
| 1. | Desales University | 100.0% | 4.6%(+95.4)#1 | 4.9%(+95.1)#4 |
| 2. | Arcadia University | 100.0% | 4.6%(+95.4)#2 | 4.9%(+95.1)#5 |
| 3. | Guys Mills | 100.0% | 4.6%(+95.4)#3 | 4.9%(+95.1)#50 |
| 4. | Mill Run | 100.0% | 4.6%(+95.4)#4 | 4.9%(+95.1)#53 |
| 5. | Foundryville | 100.0% | 4.6%(+95.4)#5 | 4.9%(+95.1)#56 |
| 6. | Longfellow | 78.6% | 4.6%(+74.0)#6 | 4.9%(+73.7)#110 |
| 7. | Aaronsburg Cdp Washington County | 76.5% | 4.6%(+71.9)#7 | 4.9%(+71.6)#114 |
| 8. | Pennwyn | 66.7% | 4.6%(+62.1)#8 | 4.9%(+61.8)#137 |
| 9. | Goodville | 60.5% | 4.6%(+55.9)#9 | 4.9%(+55.6)#172 |
| 10. | Sandy Ridge | 50.0% | 4.6%(+45.4)#10 | 4.9%(+45.1)#244 |
| 11. | Misericordia University | 49.0% | 4.6%(+44.4)#11 | 4.9%(+44.1)#281 |
| 12. | St Vincent College | 46.1% | 4.6%(+41.5)#12 | 4.9%(+41.2)#299 |
| 13. | Larke | 45.5% | 4.6%(+40.8)#13 | 4.9%(+40.6)#307 |
| 14. | Bigler | 44.6% | 4.6%(+39.9)#14 | 4.9%(+39.7)#311 |
| 15. | Jamison City | 42.9% | 4.6%(+38.2)#15 | 4.9%(+38.0)#334 |
| 16. | Mckeansburg | 42.9% | 4.6%(+38.2)#16 | 4.9%(+38.0)#339 |
| 17. | Slatedale | 42.7% | 4.6%(+38.1)#17 | 4.9%(+37.9)#344 |
| 18. | Republic | 41.1% | 4.6%(+36.5)#18 | 4.9%(+36.2)#365 |
| 19. | Slickville | 40.0% | 4.6%(+35.4)#19 | 4.9%(+35.1)#376 |
| 20. | Hazen | 37.5% | 4.6%(+32.9)#20 | 4.9%(+32.6)#421 |
| 21. | Quentin | 36.5% | 4.6%(+31.9)#21 | 4.9%(+31.6)#448 |
| 22. | Mainville | 35.7% | 4.6%(+31.1)#22 | 4.9%(+30.8)#469 |
| 23. | Revloc | 35.3% | 4.6%(+30.7)#23 | 4.9%(+30.4)#475 |
| 24. | Midway | 34.3% | 4.6%(+29.7)#24 | 4.9%(+29.5)#503 |
| 25. | Cranesville Borough | 33.8% | 4.6%(+29.2)#25 | 4.9%(+28.9)#511 |
| 26. | S N P J Borough | 33.3% | 4.6%(+28.7)#26 | 4.9%(+28.5)#564 |
| 27. | Kratzerville | 32.4% | 4.6%(+27.8)#27 | 4.9%(+27.6)#581 |
| 28. | Churchtown | 31.4% | 4.6%(+26.8)#28 | 4.9%(+26.6)#614 |
| 29. | Martins Creek | 31.2% | 4.6%(+26.6)#29 | 4.9%(+26.4)#616 |
| 30. | Wheatland Borough | 30.4% | 4.6%(+25.8)#30 | 4.9%(+25.5)#646 |
| 31. | Newport Borough | 30.2% | 4.6%(+25.6)#31 | 4.9%(+25.4)#650 |
| 32. | Fort Fetter | 29.8% | 4.6%(+25.2)#32 | 4.9%(+24.9)#666 |
| 33. | Walnutport Borough | 29.2% | 4.6%(+24.6)#33 | 4.9%(+24.3)#689 |
| 34. | Union Dale Borough | 28.6% | 4.6%(+24.0)#34 | 4.9%(+23.7)#719 |
| 35. | Hostetter | 27.7% | 4.6%(+23.1)#35 | 4.9%(+22.9)#750 |
| 36. | Abbottstown Borough | 27.6% | 4.6%(+23.0)#36 | 4.9%(+22.8)#756 |
| 37. | Haverford College | 27.6% | 4.6%(+23.0)#37 | 4.9%(+22.7)#757 |
| 38. | East Uniontown | 27.5% | 4.6%(+22.9)#38 | 4.9%(+22.6)#763 |
| 39. | Spartansburg Borough | 27.3% | 4.6%(+22.7)#39 | 4.9%(+22.4)#773 |
| 40. | East Salem | 27.3% | 4.6%(+22.7)#40 | 4.9%(+22.4)#776 |
| 41. | Temple | 26.9% | 4.6%(+22.3)#41 | 4.9%(+22.0)#794 |
| 42. | Carlisle Barracks | 26.8% | 4.6%(+22.2)#42 | 4.9%(+21.9)#800 |
| 43. | Blue Ball | 26.7% | 4.6%(+22.1)#43 | 4.9%(+21.8)#804 |
| 44. | Effort | 26.5% | 4.6%(+21.9)#44 | 4.9%(+21.6)#818 |
| 45. | Woodward | 26.5% | 4.6%(+21.9)#45 | 4.9%(+21.6)#820 |
| 46. | Shenandoah Borough | 26.5% | 4.6%(+21.9)#46 | 4.9%(+21.6)#821 |
| 47. | Kennerdell | 25.8% | 4.6%(+21.2)#47 | 4.9%(+20.9)#857 |
| 48. | Colony Park | 25.7% | 4.6%(+21.0)#48 | 4.9%(+20.8)#862 |
| 49. | Kelayres | 25.5% | 4.6%(+20.9)#49 | 4.9%(+20.7)#867 |
| 50. | Sadsburyville | 25.2% | 4.6%(+20.6)#50 | 4.9%(+20.3)#880 |
| 51. | Millersburg Borough | 25.2% | 4.6%(+20.6)#51 | 4.9%(+20.3)#881 |
| 52. | Mcveytown Borough | 24.6% | 4.6%(+20.0)#52 | 4.9%(+19.7)#936 |
| 53. | Belfast | 23.7% | 4.6%(+19.1)#53 | 4.9%(+18.8)#979 |
| 54. | Elizabethville Borough | 23.6% | 4.6%(+19.0)#54 | 4.9%(+18.8)#987 |
| 55. | Conashaugh Lakes | 23.6% | 4.6%(+19.0)#55 | 4.9%(+18.7)#988 |
| 56. | Kersey | 23.4% | 4.6%(+18.8)#56 | 4.9%(+18.6)#1,002 |
| 57. | Orbisonia Borough | 23.1% | 4.6%(+18.5)#57 | 4.9%(+18.2)#1,025 |
| 58. | Pomeroy | 22.9% | 4.6%(+18.3)#58 | 4.9%(+18.0)#1,037 |
| 59. | Highland Park | 22.6% | 4.6%(+18.0)#59 | 4.9%(+17.7)#1,054 |
| 60. | Gordonville | 22.6% | 4.6%(+18.0)#60 | 4.9%(+17.7)#1,058 |
| 61. | Sunbrook | 22.2% | 4.6%(+17.6)#61 | 4.9%(+17.4)#1,090 |
| 62. | Utica Borough | 22.2% | 4.6%(+17.6)#62 | 4.9%(+17.4)#1,093 |
| 63. | Worthville Borough | 22.2% | 4.6%(+17.6)#63 | 4.9%(+17.4)#1,100 |
| 64. | Grassflat | 22.1% | 4.6%(+17.4)#64 | 4.9%(+17.2)#1,108 |
| 65. | Georgetown Cdp Lancaster County | 22.0% | 4.6%(+17.4)#65 | 4.9%(+17.2)#1,109 |
| 66. | Chicora Borough | 22.0% | 4.6%(+17.4)#66 | 4.9%(+17.1)#1,110 |
| 67. | Sunrise Lake | 21.6% | 4.6%(+17.0)#67 | 4.9%(+16.8)#1,131 |
| 68. | Hamorton | 21.6% | 4.6%(+17.0)#68 | 4.9%(+16.7)#1,134 |
| 69. | Eau Claire Borough | 21.4% | 4.6%(+16.8)#69 | 4.9%(+16.6)#1,153 |
| 70. | Ford City Borough | 20.5% | 4.6%(+15.9)#70 | 4.9%(+15.6)#1,225 |
| 71. | Richlandtown Borough | 20.4% | 4.6%(+15.8)#71 | 4.9%(+15.6)#1,233 |
| 72. | Bressler | 20.4% | 4.6%(+15.8)#72 | 4.9%(+15.5)#1,235 |
| 73. | Wallenpaupack Lake Estates | 20.4% | 4.6%(+15.8)#73 | 4.9%(+15.5)#1,238 |
| 74. | Scalp Level Borough | 20.4% | 4.6%(+15.8)#74 | 4.9%(+15.5)#1,240 |
| 75. | Dauberville | 20.4% | 4.6%(+15.7)#75 | 4.9%(+15.5)#1,248 |
| 76. | Hyde Park | 20.1% | 4.6%(+15.5)#76 | 4.9%(+15.2)#1,256 |
| 77. | Terre Hill Borough | 20.0% | 4.6%(+15.4)#77 | 4.9%(+15.1)#1,261 |
| 78. | Cross Keys | 20.0% | 4.6%(+15.4)#78 | 4.9%(+15.1)#1,268 |
| 79. | Hop Bottom Borough | 20.0% | 4.6%(+15.4)#79 | 4.9%(+15.1)#1,280 |
| 80. | Barkeyville Borough | 20.0% | 4.6%(+15.4)#80 | 4.9%(+15.1)#1,285 |
| 81. | Hegins | 19.9% | 4.6%(+15.2)#81 | 4.9%(+15.0)#1,314 |
| 82. | West Hamburg | 19.7% | 4.6%(+15.1)#82 | 4.9%(+14.8)#1,322 |
| 83. | Fayetteville | 19.5% | 4.6%(+14.9)#83 | 4.9%(+14.7)#1,335 |
| 84. | Penn Borough | 19.5% | 4.6%(+14.9)#84 | 4.9%(+14.6)#1,337 |
| 85. | Bairdford | 19.2% | 4.6%(+14.6)#85 | 4.9%(+14.4)#1,366 |
| 86. | Walnuttown | 19.0% | 4.6%(+14.4)#86 | 4.9%(+14.2)#1,391 |
| 87. | Leechburg Borough | 18.7% | 4.6%(+14.0)#87 | 4.9%(+13.8)#1,432 |
| 88. | Collinsburg | 18.6% | 4.6%(+14.0)#88 | 4.9%(+13.7)#1,438 |
| 89. | New Galilee Borough | 18.2% | 4.6%(+13.6)#89 | 4.9%(+13.3)#1,486 |
| 90. | Wellersburg Borough | 18.2% | 4.6%(+13.6)#90 | 4.9%(+13.3)#1,498 |
| 91. | Shickshinny Borough | 17.9% | 4.6%(+13.3)#91 | 4.9%(+13.1)#1,521 |
| 92. | Rome Borough | 17.9% | 4.6%(+13.3)#92 | 4.9%(+13.1)#1,522 |
| 93. | Loretto Borough | 17.8% | 4.6%(+13.1)#93 | 4.9%(+12.9)#1,548 |
| 94. | Ehrenfeld Borough | 17.6% | 4.6%(+13.0)#94 | 4.9%(+12.8)#1,561 |
| 95. | Atlas | 17.5% | 4.6%(+12.9)#95 | 4.9%(+12.6)#1,574 |
| 96. | Mount Wolf Borough | 17.4% | 4.6%(+12.8)#96 | 4.9%(+12.5)#1,585 |
| 97. | Mount Aetna | 17.4% | 4.6%(+12.8)#97 | 4.9%(+12.5)#1,594 |
| 98. | Cleona Borough | 17.4% | 4.6%(+12.8)#98 | 4.9%(+12.5)#1,607 |
| 99. | Modena Borough | 17.3% | 4.6%(+12.7)#99 | 4.9%(+12.4)#1,616 |
| 100. | Seneca | 17.1% | 4.6%(+12.5)#100 | 4.9%(+12.2)#1,643 |
Common Questions
What are the Top 10 Cities with the Highest Percentage of Population with a Degree in Liberal Arts and History in Pennsylvania?
Top 10 Cities with the Highest Percentage of Population with a Degree in Liberal Arts and History in Pennsylvania are:
#1
100.0%
#2
100.0%
#3
100.0%
#4
100.0%
#5
78.6%
#6
66.7%
#7
60.5%
#8
50.0%
#9
46.1%
#10
44.6%
What city has the Highest Percentage of Population with a Degree in Liberal Arts and History in Pennsylvania?
DeSales University has the Highest Percentage of Population with a Degree in Liberal Arts and History in Pennsylvania with 100.0%.
What is the Percentage of Population with a Degree in Liberal Arts and History in the State of Pennsylvania?
Percentage of Population with a Degree in Liberal Arts and History in Pennsylvania is 4.6%.
What is the Percentage of Population with a Degree in Liberal Arts and History in the United States?
Percentage of Population with a Degree in Liberal Arts and History in the United States is 4.9%.