Zip Codes with the Highest Percentage of Population with a Degree in Liberal Arts and History in Long Beach, CA
RELATED REPORTS & OPTIONS
Liberal Arts and History
Long Beach
Compare Zip Codes
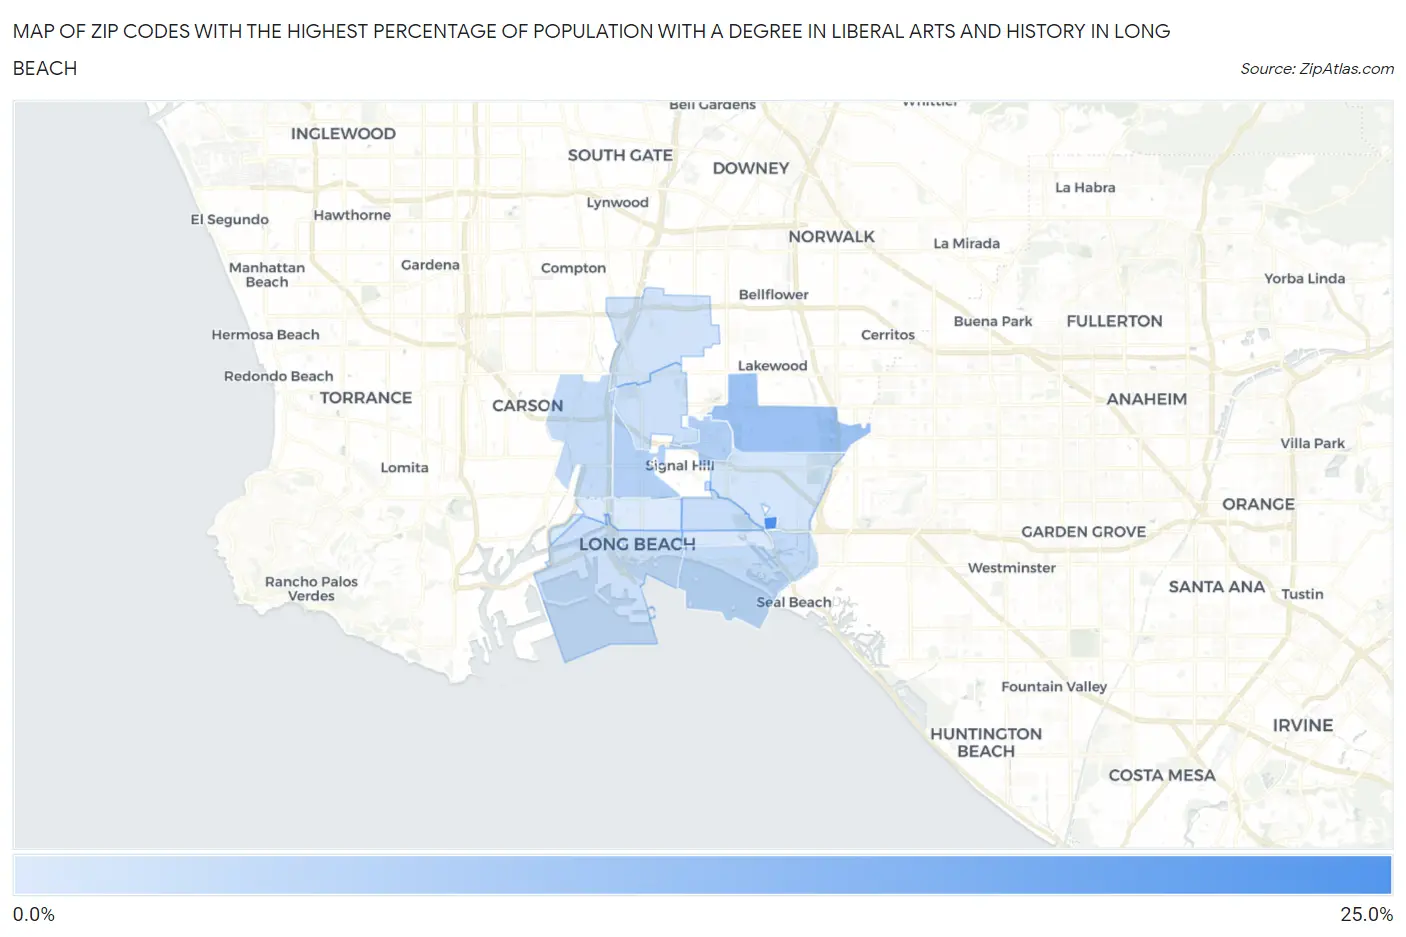
Map of Zip Codes with the Highest Percentage of Population with a Degree in Liberal Arts and History in Long Beach
4.0%
20.7%
Zip Codes with the Highest Percentage of Population with a Degree in Liberal Arts and History in Long Beach, CA
| Zip Code | % Graduates | vs State | vs National | |
| 1. | 90822 | 20.7% | 5.5%(+15.2)#62 | 4.9%(+15.8)#817 |
| 2. | 90808 | 10.8% | 5.5%(+5.34)#186 | 4.9%(+5.97)#2,627 |
| 3. | 90806 | 8.4% | 5.5%(+2.91)#338 | 4.9%(+3.54)#4,432 |
| 4. | 90803 | 6.7% | 5.5%(+1.20)#591 | 4.9%(+1.82)#6,952 |
| 5. | 90810 | 6.7% | 5.5%(+1.19)#593 | 4.9%(+1.81)#6,980 |
| 6. | 90804 | 6.1% | 5.5%(+0.628)#713 | 4.9%(+1.25)#8,199 |
| 7. | 90807 | 5.7% | 5.5%(+0.247)#803 | 4.9%(+0.871)#9,181 |
| 8. | 90802 | 5.6% | 5.5%(+0.077)#838 | 4.9%(+0.701)#9,637 |
| 9. | 90805 | 5.3% | 5.5%(-0.197)#911 | 4.9%(+0.427)#10,448 |
| 10. | 90815 | 4.9% | 5.5%(-0.568)#990 | 4.9%(+0.056)#11,564 |
| 11. | 90814 | 4.6% | 5.5%(-0.933)#1,062 | 4.9%(-0.309)#12,754 |
| 12. | 90813 | 4.0% | 5.5%(-1.51)#1,184 | 4.9%(-0.889)#14,856 |
1
Common Questions
What are the Top 10 Zip Codes with the Highest Percentage of Population with a Degree in Liberal Arts and History in Long Beach, CA?
Top 10 Zip Codes with the Highest Percentage of Population with a Degree in Liberal Arts and History in Long Beach, CA are:
What zip code has the Highest Percentage of Population with a Degree in Liberal Arts and History in Long Beach, CA?
90822 has the Highest Percentage of Population with a Degree in Liberal Arts and History in Long Beach, CA with 20.7%.
What is the Percentage of Population with a Degree in Liberal Arts and History in Long Beach, CA?
Percentage of Population with a Degree in Liberal Arts and History in Long Beach is 6.3%.
What is the Percentage of Population with a Degree in Liberal Arts and History in California?
Percentage of Population with a Degree in Liberal Arts and History in California is 5.5%.
What is the Percentage of Population with a Degree in Liberal Arts and History in the United States?
Percentage of Population with a Degree in Liberal Arts and History in the United States is 4.9%.