Cities with the Highest Percentage of Population with a Degree in Liberal Arts and History in Georgia
RELATED REPORTS & OPTIONS
Liberal Arts and History
Georgia
Compare Cities
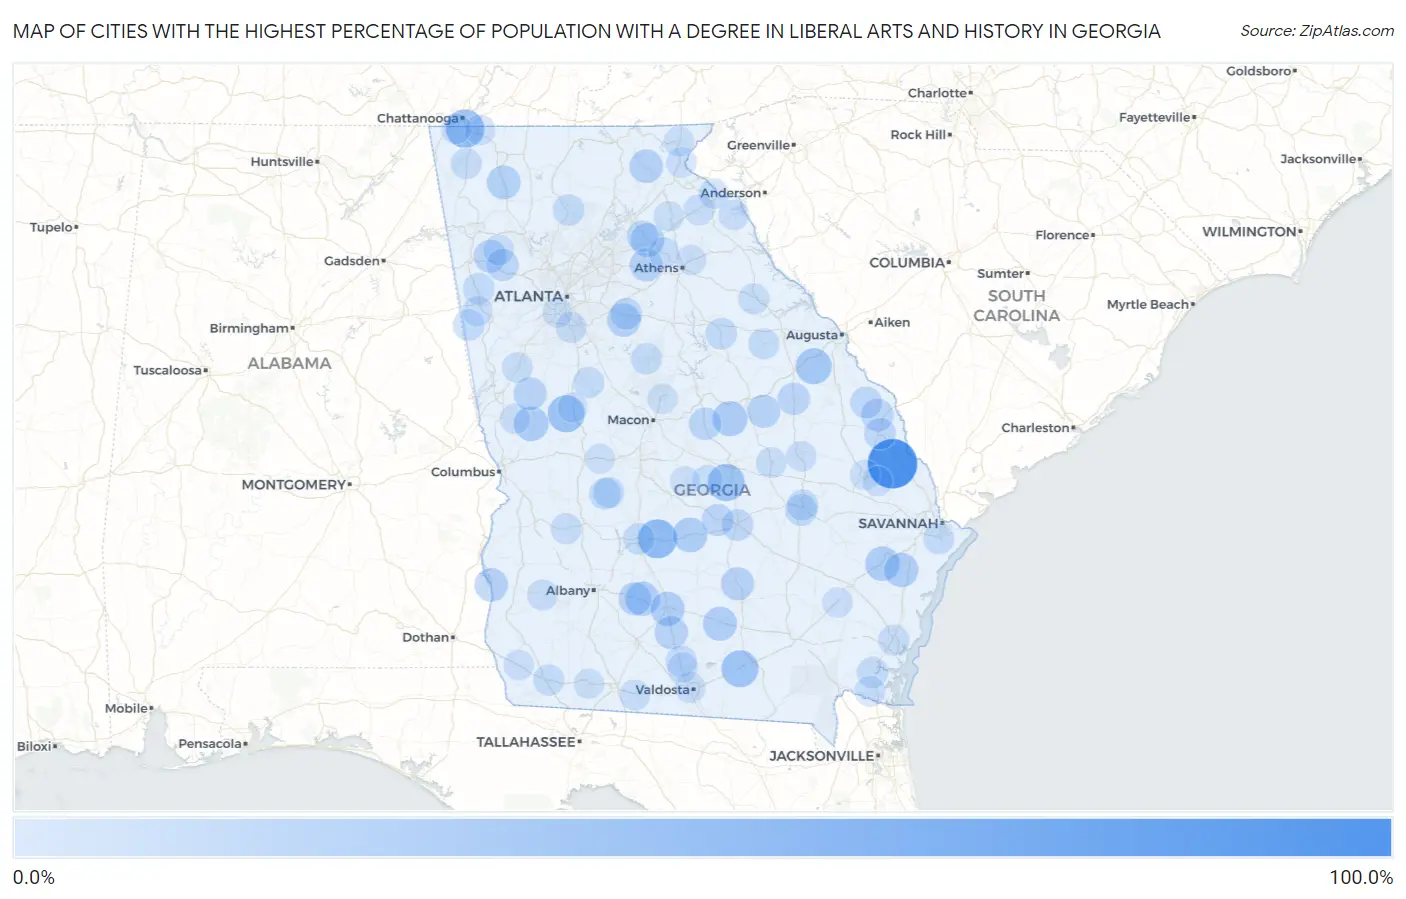
Map of Cities with the Highest Percentage of Population with a Degree in Liberal Arts and History in Georgia
0.0%
100.0%
Cities with the Highest Percentage of Population with a Degree in Liberal Arts and History in Georgia
| City | % Graduates | vs State | vs National | |
| 1. | Crescent | 100.0% | 4.1%(+95.9)#1 | 4.9%(+95.1)#7 |
| 2. | Oliver | 100.0% | 4.1%(+95.9)#2 | 4.9%(+95.1)#20 |
| 3. | Seville | 50.0% | 4.1%(+45.9)#3 | 4.9%(+45.1)#271 |
| 4. | Dixie | 47.5% | 4.1%(+43.4)#4 | 4.9%(+42.6)#286 |
| 5. | Rossville | 46.9% | 4.1%(+42.8)#5 | 4.9%(+42.0)#292 |
| 6. | Rentz | 41.2% | 4.1%(+37.1)#6 | 4.9%(+36.3)#363 |
| 7. | Sunset Village | 40.5% | 4.1%(+36.4)#7 | 4.9%(+35.6)#371 |
| 8. | Du Pont | 40.0% | 4.1%(+35.9)#8 | 4.9%(+35.1)#382 |
| 9. | Keysville | 35.5% | 4.1%(+31.4)#9 | 4.9%(+30.6)#472 |
| 10. | Milstead | 35.2% | 4.1%(+31.0)#10 | 4.9%(+30.3)#479 |
| 11. | Oconee | 30.8% | 4.1%(+26.6)#11 | 4.9%(+25.9)#630 |
| 12. | Walthourville | 29.5% | 4.1%(+25.4)#12 | 4.9%(+24.7)#674 |
| 13. | Abbeville | 29.4% | 4.1%(+25.3)#13 | 4.9%(+24.5)#677 |
| 14. | Shiloh | 29.4% | 4.1%(+25.3)#14 | 4.9%(+24.5)#678 |
| 15. | Riceboro | 27.8% | 4.1%(+23.7)#15 | 4.9%(+22.9)#744 |
| 16. | Sumner | 27.8% | 4.1%(+23.7)#16 | 4.9%(+22.9)#747 |
| 17. | Willacoochee | 27.0% | 4.1%(+22.9)#17 | 4.9%(+22.1)#789 |
| 18. | Unionville | 26.9% | 4.1%(+22.8)#18 | 4.9%(+22.1)#790 |
| 19. | Berry College | 26.1% | 4.1%(+22.0)#19 | 4.9%(+21.2)#835 |
| 20. | Pendergrass | 25.5% | 4.1%(+21.3)#20 | 4.9%(+20.6)#870 |
| 21. | Resaca | 25.4% | 4.1%(+21.2)#21 | 4.9%(+20.5)#876 |
| 22. | Sautee Nacoochee | 24.2% | 4.1%(+20.1)#22 | 4.9%(+19.4)#950 |
| 23. | Porterdale | 23.8% | 4.1%(+19.7)#23 | 4.9%(+18.9)#971 |
| 24. | Fort Gaines | 23.6% | 4.1%(+19.5)#24 | 4.9%(+18.8)#986 |
| 25. | Lenox | 23.3% | 4.1%(+19.2)#25 | 4.9%(+18.5)#1,011 |
| 26. | Broxton | 22.6% | 4.1%(+18.5)#26 | 4.9%(+17.7)#1,055 |
| 27. | Poulan | 22.5% | 4.1%(+18.4)#27 | 4.9%(+17.6)#1,065 |
| 28. | Russell | 22.4% | 4.1%(+18.3)#28 | 4.9%(+17.5)#1,069 |
| 29. | Echols County Consolidated Government | 22.4% | 4.1%(+18.3)#29 | 4.9%(+17.5)#1,070 |
| 30. | Riddleville | 22.2% | 4.1%(+18.1)#30 | 4.9%(+17.4)#1,096 |
| 31. | Aragon | 21.7% | 4.1%(+17.6)#31 | 4.9%(+16.9)#1,126 |
| 32. | Greenville | 21.3% | 4.1%(+17.2)#32 | 4.9%(+16.5)#1,168 |
| 33. | Hiltonia | 20.4% | 4.1%(+16.3)#33 | 4.9%(+15.5)#1,234 |
| 34. | Axson | 19.8% | 4.1%(+15.7)#34 | 4.9%(+14.9)#1,317 |
| 35. | Irwinton | 19.5% | 4.1%(+15.4)#35 | 4.9%(+14.6)#1,339 |
| 36. | Louisville | 19.0% | 4.1%(+14.9)#36 | 4.9%(+14.2)#1,389 |
| 37. | Braswell | 18.4% | 4.1%(+14.3)#37 | 4.9%(+13.5)#1,458 |
| 38. | Smarr | 18.2% | 4.1%(+14.1)#38 | 4.9%(+13.3)#1,489 |
| 39. | Chauncey | 17.9% | 4.1%(+13.7)#39 | 4.9%(+13.0)#1,533 |
| 40. | Sardis | 17.1% | 4.1%(+12.9)#40 | 4.9%(+12.2)#1,648 |
| 41. | Mcrae Helena | 16.7% | 4.1%(+12.5)#41 | 4.9%(+11.8)#1,693 |
| 42. | Santa Claus | 16.7% | 4.1%(+12.5)#42 | 4.9%(+11.8)#1,738 |
| 43. | Sylvania | 16.4% | 4.1%(+12.3)#43 | 4.9%(+11.6)#1,778 |
| 44. | Hickox | 16.2% | 4.1%(+12.1)#44 | 4.9%(+11.3)#1,815 |
| 45. | Oxford | 16.1% | 4.1%(+12.0)#45 | 4.9%(+11.2)#1,837 |
| 46. | White Plains | 16.0% | 4.1%(+11.9)#46 | 4.9%(+11.1)#1,856 |
| 47. | Oglethorpe | 15.7% | 4.1%(+11.5)#47 | 4.9%(+10.8)#1,915 |
| 48. | Nelson | 15.6% | 4.1%(+11.5)#48 | 4.9%(+10.7)#1,931 |
| 49. | Buchanan | 15.6% | 4.1%(+11.4)#49 | 4.9%(+10.7)#1,934 |
| 50. | Cordele | 15.4% | 4.1%(+11.2)#50 | 4.9%(+10.5)#1,992 |
| 51. | Talmo | 15.0% | 4.1%(+10.9)#51 | 4.9%(+10.1)#2,048 |
| 52. | Bowdon | 14.9% | 4.1%(+10.8)#52 | 4.9%(+10.0)#2,064 |
| 53. | Monticello | 14.5% | 4.1%(+10.4)#53 | 4.9%(+9.62)#2,150 |
| 54. | Woodbine | 14.4% | 4.1%(+10.3)#54 | 4.9%(+9.57)#2,164 |
| 55. | Montezuma | 14.4% | 4.1%(+10.3)#55 | 4.9%(+9.53)#2,172 |
| 56. | Cecil | 14.3% | 4.1%(+10.2)#56 | 4.9%(+9.41)#2,213 |
| 57. | Bainbridge | 13.6% | 4.1%(+9.50)#57 | 4.9%(+8.75)#2,432 |
| 58. | Lyons | 13.6% | 4.1%(+9.45)#58 | 4.9%(+8.71)#2,435 |
| 59. | Warrenton | 13.3% | 4.1%(+9.21)#59 | 4.9%(+8.46)#2,500 |
| 60. | Vernonburg | 13.2% | 4.1%(+9.03)#60 | 4.9%(+8.29)#2,568 |
| 61. | Milner | 13.1% | 4.1%(+8.99)#61 | 4.9%(+8.24)#2,577 |
| 62. | Plains | 12.9% | 4.1%(+8.73)#62 | 4.9%(+7.98)#2,657 |
| 63. | Dock Junction | 12.9% | 4.1%(+8.73)#63 | 4.9%(+7.98)#2,660 |
| 64. | Taylorsville | 12.7% | 4.1%(+8.57)#64 | 4.9%(+7.83)#2,704 |
| 65. | Washington | 12.7% | 4.1%(+8.54)#65 | 4.9%(+7.79)#2,708 |
| 66. | Arcade | 12.6% | 4.1%(+8.47)#66 | 4.9%(+7.72)#2,729 |
| 67. | Morgan | 12.5% | 4.1%(+8.37)#67 | 4.9%(+7.63)#2,752 |
| 68. | Remerton | 12.4% | 4.1%(+8.25)#68 | 4.9%(+7.50)#2,827 |
| 69. | Jonesboro | 12.2% | 4.1%(+8.08)#69 | 4.9%(+7.33)#2,883 |
| 70. | Wildwood | 12.1% | 4.1%(+7.95)#70 | 4.9%(+7.20)#2,938 |
| 71. | Adrian | 11.9% | 4.1%(+7.78)#71 | 4.9%(+7.03)#3,014 |
| 72. | Grantville | 11.9% | 4.1%(+7.73)#72 | 4.9%(+6.98)#3,036 |
| 73. | Carnesville | 11.8% | 4.1%(+7.69)#73 | 4.9%(+6.95)#3,054 |
| 74. | Lafayette | 11.7% | 4.1%(+7.61)#74 | 4.9%(+6.87)#3,096 |
| 75. | Boston | 11.5% | 4.1%(+7.41)#75 | 4.9%(+6.67)#3,167 |
| 76. | Kingsland | 11.5% | 4.1%(+7.33)#76 | 4.9%(+6.59)#3,204 |
| 77. | Swainsboro | 11.3% | 4.1%(+7.19)#77 | 4.9%(+6.45)#3,263 |
| 78. | Indian Springs | 11.0% | 4.1%(+6.90)#78 | 4.9%(+6.16)#3,412 |
| 79. | Iron City | 10.7% | 4.1%(+6.59)#79 | 4.9%(+5.84)#3,575 |
| 80. | Tallulah Falls | 10.7% | 4.1%(+6.59)#80 | 4.9%(+5.84)#3,577 |
| 81. | Hull | 10.7% | 4.1%(+6.59)#81 | 4.9%(+5.84)#3,579 |
| 82. | Mount Zion | 10.6% | 4.1%(+6.48)#82 | 4.9%(+5.73)#3,634 |
| 83. | Hartwell | 10.6% | 4.1%(+6.44)#83 | 4.9%(+5.69)#3,658 |
| 84. | Pine Mountain | 10.5% | 4.1%(+6.33)#84 | 4.9%(+5.58)#3,734 |
| 85. | Chester | 10.4% | 4.1%(+6.32)#85 | 4.9%(+5.58)#3,736 |
| 86. | Clayton | 10.3% | 4.1%(+6.18)#86 | 4.9%(+5.44)#3,807 |
| 87. | Gumlog | 10.2% | 4.1%(+6.10)#87 | 4.9%(+5.35)#3,854 |
| 88. | Screven | 10.2% | 4.1%(+6.08)#88 | 4.9%(+5.33)#3,862 |
| 89. | Cairo | 10.2% | 4.1%(+6.05)#89 | 4.9%(+5.31)#3,877 |
| 90. | Lookout Mountain | 10.1% | 4.1%(+6.00)#90 | 4.9%(+5.26)#3,900 |
| 91. | Hahira | 10.1% | 4.1%(+5.99)#91 | 4.9%(+5.24)#3,910 |
| 92. | Homer | 10.1% | 4.1%(+5.99)#92 | 4.9%(+5.24)#3,913 |
| 93. | Statesboro | 10.0% | 4.1%(+5.88)#93 | 4.9%(+5.13)#3,960 |
| 94. | Ellerslie | 9.9% | 4.1%(+5.79)#94 | 4.9%(+5.05)#4,043 |
| 95. | Gray | 9.8% | 4.1%(+5.63)#95 | 4.9%(+4.88)#4,133 |
| 96. | Reynolds | 9.6% | 4.1%(+5.49)#96 | 4.9%(+4.74)#4,242 |
| 97. | College Park | 9.5% | 4.1%(+5.34)#97 | 4.9%(+4.60)#4,350 |
| 98. | Brooklet | 9.5% | 4.1%(+5.33)#98 | 4.9%(+4.59)#4,355 |
| 99. | Cochran | 9.3% | 4.1%(+5.15)#99 | 4.9%(+4.40)#4,486 |
| 100. | Hannahs Mill | 9.3% | 4.1%(+5.13)#100 | 4.9%(+4.39)#4,495 |
Common Questions
What are the Top 10 Cities with the Highest Percentage of Population with a Degree in Liberal Arts and History in Georgia?
Top 10 Cities with the Highest Percentage of Population with a Degree in Liberal Arts and History in Georgia are:
#1
100.0%
#2
50.0%
#3
46.9%
#4
41.2%
#5
40.5%
#6
40.0%
#7
35.5%
#8
30.8%
#9
29.5%
#10
29.4%
What city has the Highest Percentage of Population with a Degree in Liberal Arts and History in Georgia?
Oliver has the Highest Percentage of Population with a Degree in Liberal Arts and History in Georgia with 100.0%.
What is the Percentage of Population with a Degree in Liberal Arts and History in the State of Georgia?
Percentage of Population with a Degree in Liberal Arts and History in Georgia is 4.1%.
What is the Percentage of Population with a Degree in Liberal Arts and History in the United States?
Percentage of Population with a Degree in Liberal Arts and History in the United States is 4.9%.