Meridian, CA Map & Demographics
Meridian Map
Meridian Overview
$28,268
PER CAPITA INCOME
$58,056
AVG FAMILY INCOME
$50,917
AVG HOUSEHOLD INCOME
0.50
INEQUALITY / GINI INDEX
376
TOTAL POPULATION
231
MALE POPULATION
145
FEMALE POPULATION
159.31
MALES / 100 FEMALES
62.77
FEMALES / 100 MALES
31.1
MEDIAN AGE
3.4
AVG FAMILY SIZE
2.7
AVG HOUSEHOLD SIZE
141
LABOR FORCE [ PEOPLE ]
49.3%
PERCENT IN LABOR FORCE
7.8%
UNEMPLOYMENT RATE
Meridian Zip Codes
Meridian Area Codes
Income in Meridian
Income Overview in Meridian
Per Capita Income in Meridian is $28,268, while median incomes of families and households are $58,056 and $50,917 respectively.
| Characteristic | Number | Measure |
| Per Capita Income | 376 | $28,268 |
| Median Family Income | 94 | $58,056 |
| Mean Family Income | 94 | $98,798 |
| Median Household Income | 141 | $50,917 |
| Mean Household Income | 141 | $79,077 |
| Income Deficit | 94 | $0 |
| Wage / Income Gap (%) | 376 | 0.00% |
| Wage / Income Gap ($) | 376 | 100.00¢ per $1 |
| Gini / Inequality Index | 376 | 0.50 |
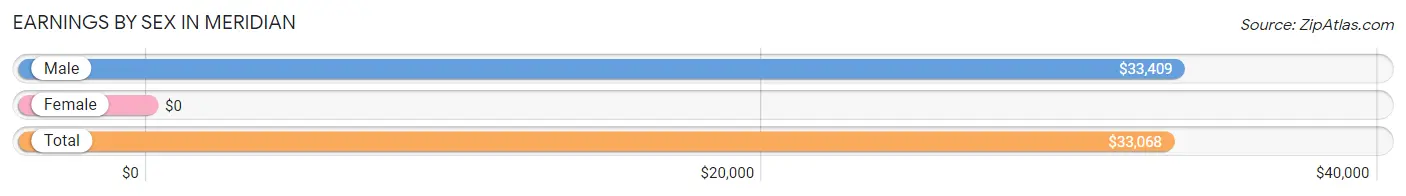
Earnings by Sex in Meridian
| Sex | Number | Average Earnings |
| Male | 98 (68.5%) | $33,409 |
| Female | 45 (31.5%) | $0 |
| Total | 143 (100.0%) | $33,068 |
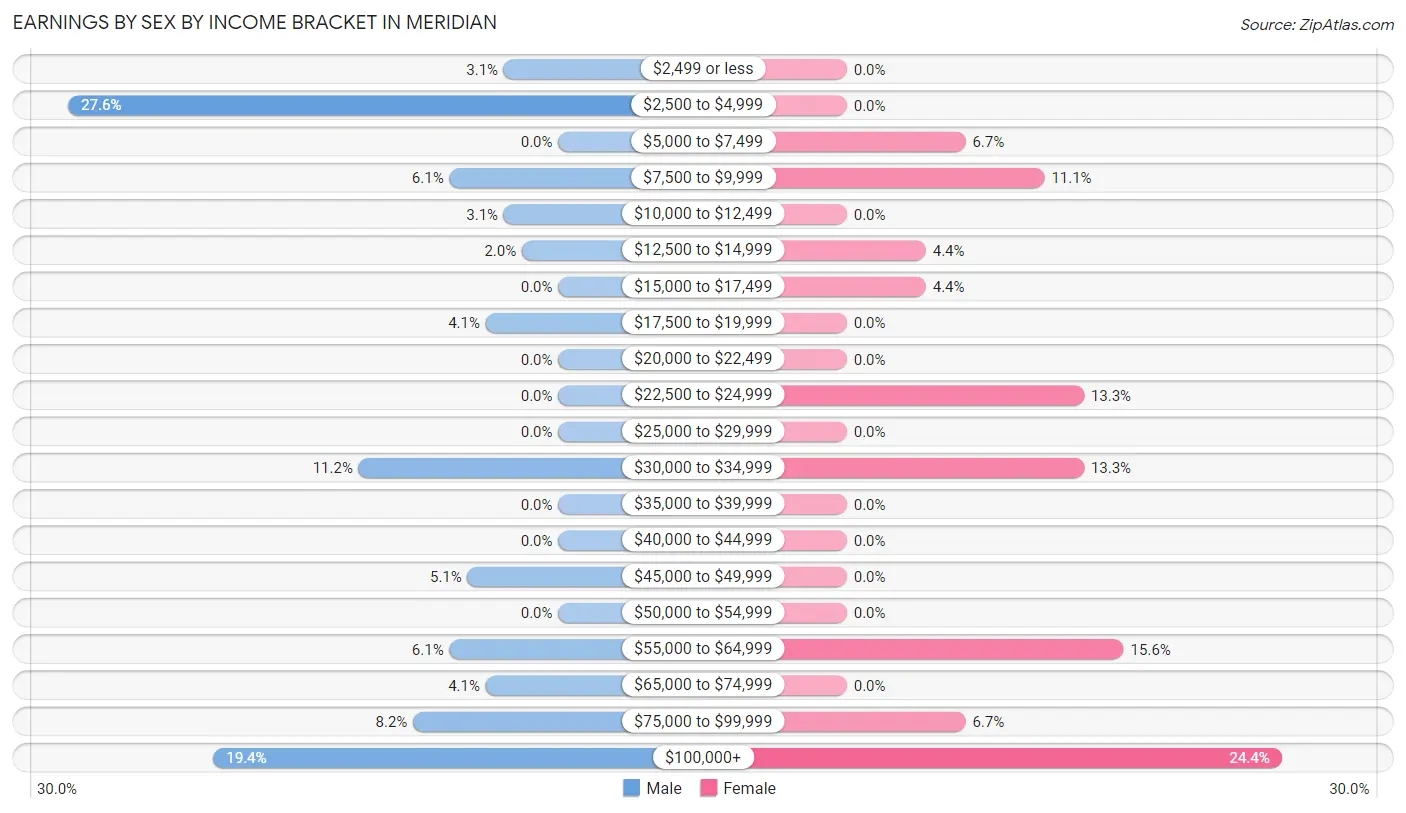
Earnings by Sex by Income Bracket in Meridian
The most common earnings brackets in Meridian are $2,500 to $4,999 for men (27 | 27.6%) and $100,000+ for women (11 | 24.4%).
| Income | Male | Female |
| $2,499 or less | 3 (3.1%) | 0 (0.0%) |
| $2,500 to $4,999 | 27 (27.6%) | 0 (0.0%) |
| $5,000 to $7,499 | 0 (0.0%) | 3 (6.7%) |
| $7,500 to $9,999 | 6 (6.1%) | 5 (11.1%) |
| $10,000 to $12,499 | 3 (3.1%) | 0 (0.0%) |
| $12,500 to $14,999 | 2 (2.0%) | 2 (4.4%) |
| $15,000 to $17,499 | 0 (0.0%) | 2 (4.4%) |
| $17,500 to $19,999 | 4 (4.1%) | 0 (0.0%) |
| $20,000 to $22,499 | 0 (0.0%) | 0 (0.0%) |
| $22,500 to $24,999 | 0 (0.0%) | 6 (13.3%) |
| $25,000 to $29,999 | 0 (0.0%) | 0 (0.0%) |
| $30,000 to $34,999 | 11 (11.2%) | 6 (13.3%) |
| $35,000 to $39,999 | 0 (0.0%) | 0 (0.0%) |
| $40,000 to $44,999 | 0 (0.0%) | 0 (0.0%) |
| $45,000 to $49,999 | 5 (5.1%) | 0 (0.0%) |
| $50,000 to $54,999 | 0 (0.0%) | 0 (0.0%) |
| $55,000 to $64,999 | 6 (6.1%) | 7 (15.6%) |
| $65,000 to $74,999 | 4 (4.1%) | 0 (0.0%) |
| $75,000 to $99,999 | 8 (8.2%) | 3 (6.7%) |
| $100,000+ | 19 (19.4%) | 11 (24.4%) |
| Total | 98 (100.0%) | 45 (100.0%) |
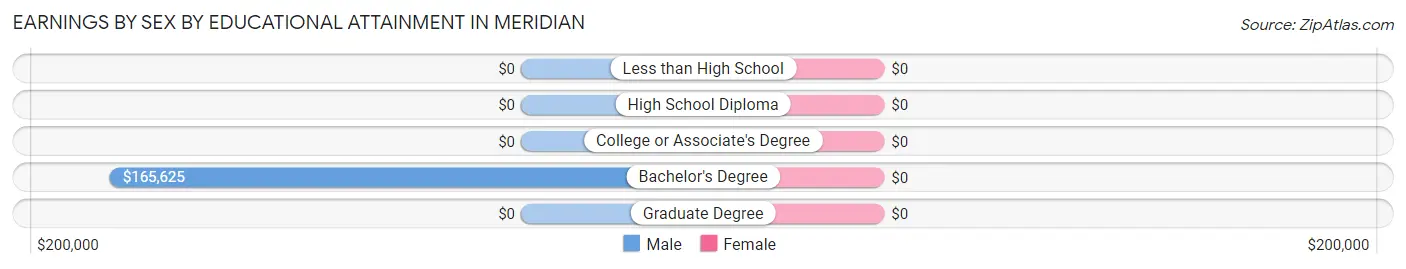
Earnings by Sex by Educational Attainment in Meridian
| Educational Attainment | Male Income | Female Income |
| Less than High School | - | - |
| High School Diploma | - | - |
| College or Associate's Degree | - | - |
| Bachelor's Degree | $165,625 | $0 |
| Graduate Degree | - | - |
| Total | $46,500 | $55,714 |
Family Income in Meridian
Family Income Brackets in Meridian
According to the Meridian family income data, there are 33 families falling into the $50,000 to $74,999 income range, which is the most common income bracket and makes up 35.1% of all families.
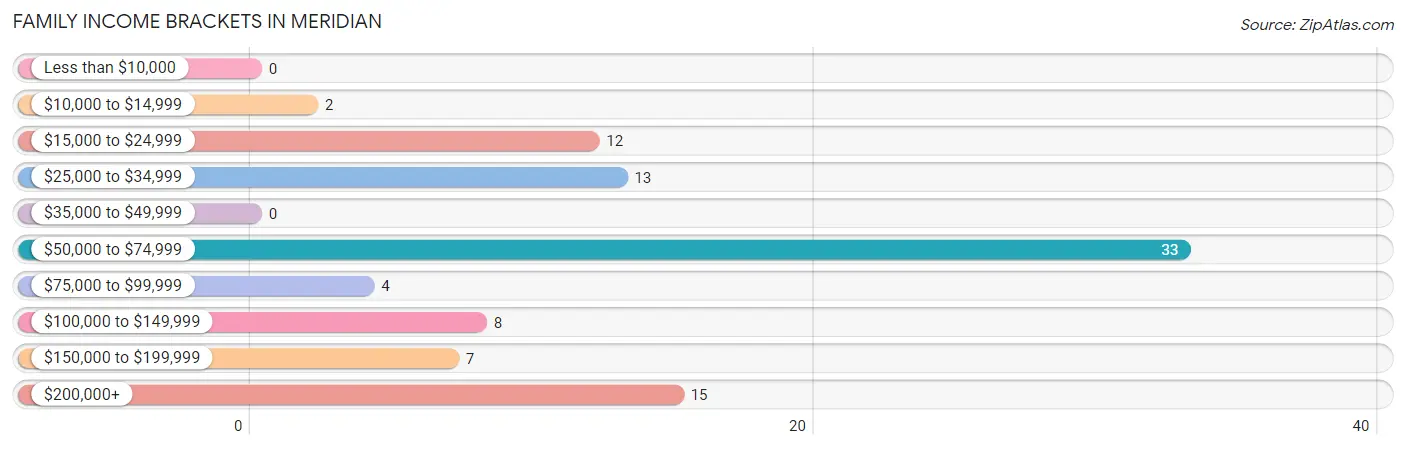
| Income Bracket | # Families | % Families |
| Less than $10,000 | 0 | 0.0% |
| $10,000 to $14,999 | 2 | 2.1% |
| $15,000 to $24,999 | 12 | 12.8% |
| $25,000 to $34,999 | 13 | 13.8% |
| $35,000 to $49,999 | 0 | 0.0% |
| $50,000 to $74,999 | 33 | 35.1% |
| $75,000 to $99,999 | 4 | 4.3% |
| $100,000 to $149,999 | 8 | 8.5% |
| $150,000 to $199,999 | 7 | 7.4% |
| $200,000+ | 15 | 16.0% |
Family Income by Famaliy Size in Meridian
3-person families (12 | 12.8%) account for the highest median family income in Meridian with $250,001 per family, while 3-person families (12 | 12.8%) have the highest median income of $83,334 per family member.
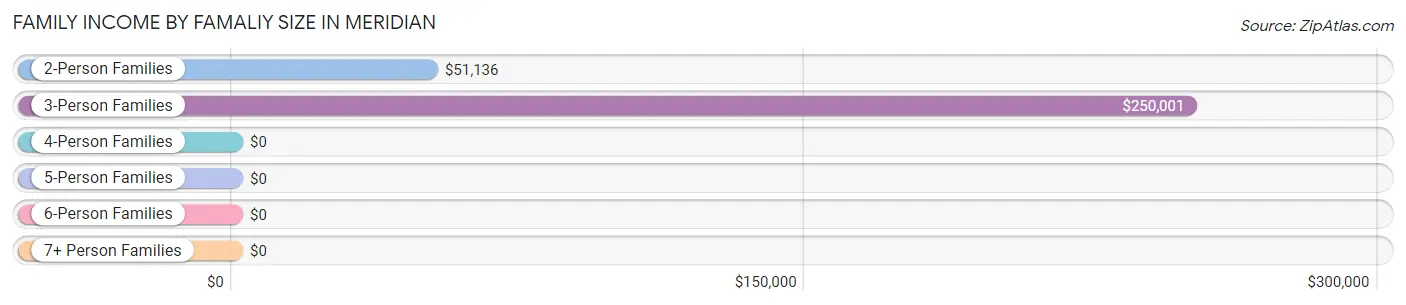
| Income Bracket | # Families | Median Income |
| 2-Person Families | 38 (40.4%) | $51,136 |
| 3-Person Families | 12 (12.8%) | $250,001 |
| 4-Person Families | 38 (40.4%) | $0 |
| 5-Person Families | 2 (2.1%) | $0 |
| 6-Person Families | 4 (4.3%) | $0 |
| 7+ Person Families | 0 (0.0%) | $0 |
| Total | 94 (100.0%) | $58,056 |
Family Income by Number of Earners in Meridian
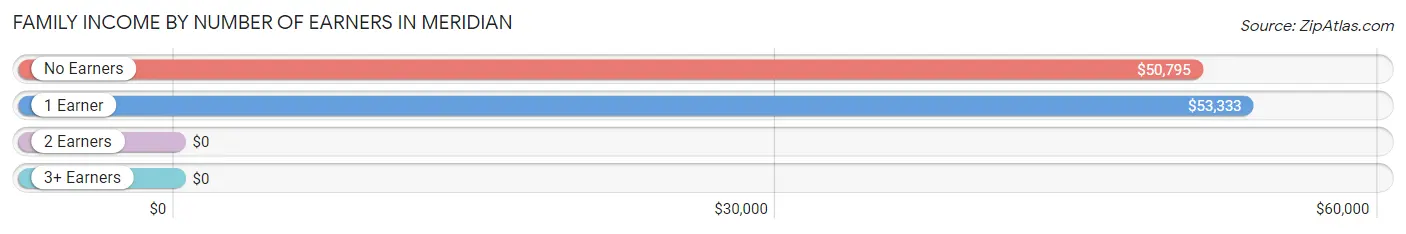
| Number of Earners | # Families | Median Income |
| No Earners | 19 (20.2%) | $50,795 |
| 1 Earner | 38 (40.4%) | $53,333 |
| 2 Earners | 28 (29.8%) | $0 |
| 3+ Earners | 9 (9.6%) | $0 |
| Total | 94 (100.0%) | $58,056 |
Household Income in Meridian
Household Income Brackets in Meridian
With 35 households falling in the category, the $50,000 to $74,999 income range is the most frequent in Meridian, accounting for 24.8% of all households. In contrast, only 6 households (4.3%) fall into the $75,000 to $99,999 income bracket, making it the least populous group.
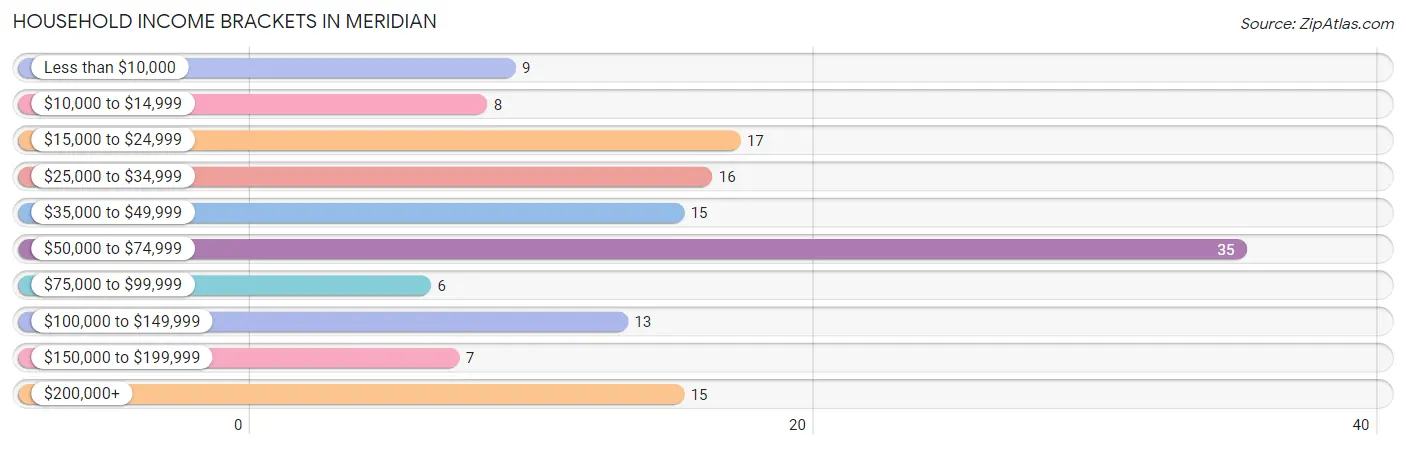
| Income Bracket | # Households | % Households |
| Less than $10,000 | 9 | 6.4% |
| $10,000 to $14,999 | 8 | 5.7% |
| $15,000 to $24,999 | 17 | 12.1% |
| $25,000 to $34,999 | 16 | 11.3% |
| $35,000 to $49,999 | 15 | 10.6% |
| $50,000 to $74,999 | 35 | 24.8% |
| $75,000 to $99,999 | 6 | 4.3% |
| $100,000 to $149,999 | 13 | 9.2% |
| $150,000 to $199,999 | 7 | 5.0% |
| $200,000+ | 15 | 10.6% |
Household Income by Householder Age in Meridian
The median household income in Meridian is $50,917, with the highest median household income of $58,194 found in the 45 to 64 years age bracket for the primary householder. A total of 75 households (53.2%) fall into this category. Meanwhile, the 15 to 24 years age bracket for the primary householder has the lowest median household income of $0, with 7 households (5.0%) in this group.
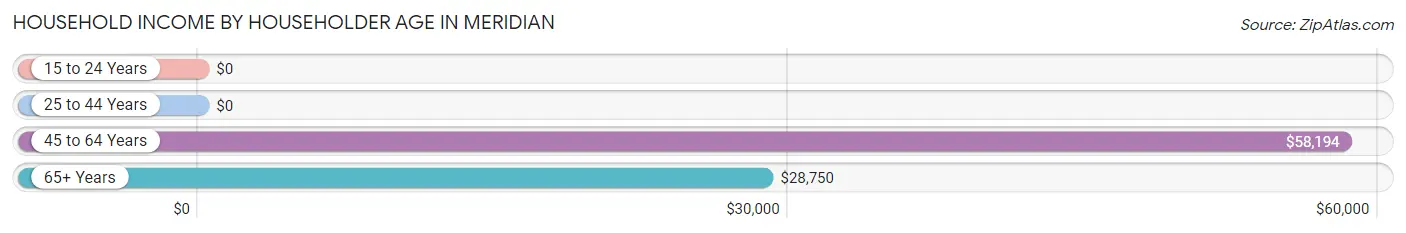
| Income Bracket | # Households | Median Income |
| 15 to 24 Years | 7 (5.0%) | $0 |
| 25 to 44 Years | 38 (27.0%) | $0 |
| 45 to 64 Years | 75 (53.2%) | $58,194 |
| 65+ Years | 21 (14.9%) | $28,750 |
| Total | 141 (100.0%) | $50,917 |
Poverty in Meridian
Income Below Poverty by Sex and Age in Meridian
With 10.4% poverty level for males and 17.2% for females among the residents of Meridian, 45 to 54 year old males and 25 to 34 year old females are the most vulnerable to poverty, with 5 males (33.3%) and 12 females (85.7%) in their respective age groups living below the poverty level.
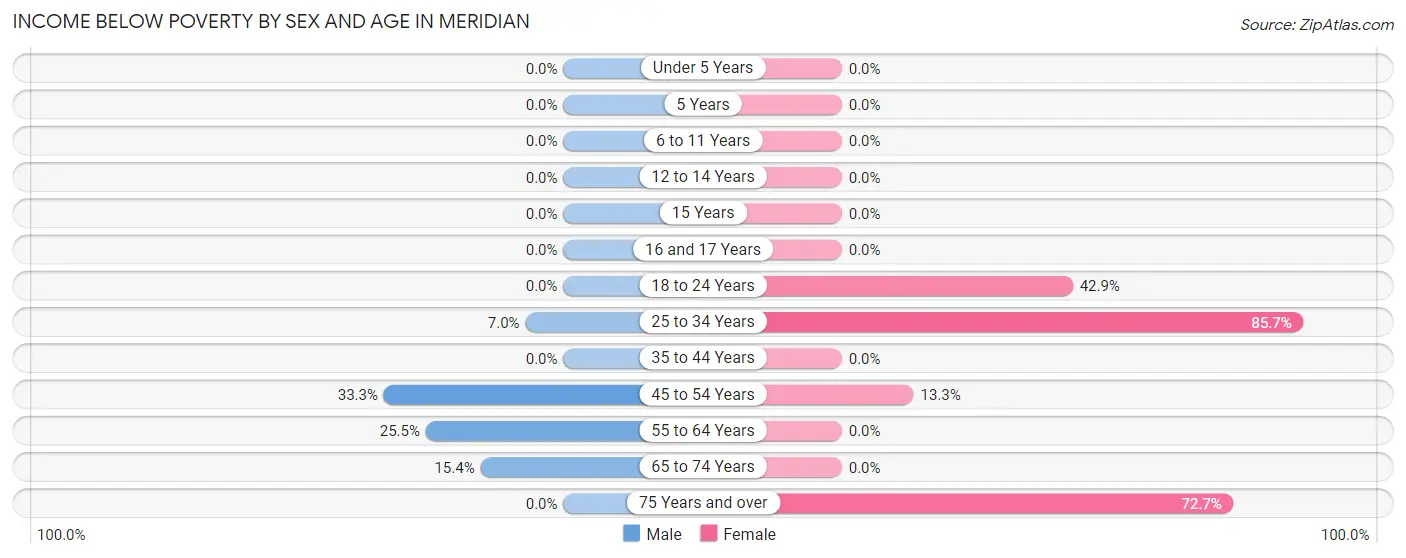
| Age Bracket | Male | Female |
| Under 5 Years | 0 (0.0%) | 0 (0.0%) |
| 5 Years | 0 (0.0%) | 0 (0.0%) |
| 6 to 11 Years | 0 (0.0%) | 0 (0.0%) |
| 12 to 14 Years | 0 (0.0%) | 0 (0.0%) |
| 15 Years | 0 (0.0%) | 0 (0.0%) |
| 16 and 17 Years | 0 (0.0%) | 0 (0.0%) |
| 18 to 24 Years | 0 (0.0%) | 3 (42.9%) |
| 25 to 34 Years | 5 (7.0%) | 12 (85.7%) |
| 35 to 44 Years | 0 (0.0%) | 0 (0.0%) |
| 45 to 54 Years | 5 (33.3%) | 2 (13.3%) |
| 55 to 64 Years | 12 (25.5%) | 0 (0.0%) |
| 65 to 74 Years | 2 (15.4%) | 0 (0.0%) |
| 75 Years and over | 0 (0.0%) | 8 (72.7%) |
| Total | 24 (10.4%) | 25 (17.2%) |
Income Above Poverty by Sex and Age in Meridian
According to the poverty statistics in Meridian, males aged under 5 years and females aged under 5 years are the age groups that are most secure financially, with 100.0% of males and 100.0% of females in these age groups living above the poverty line.
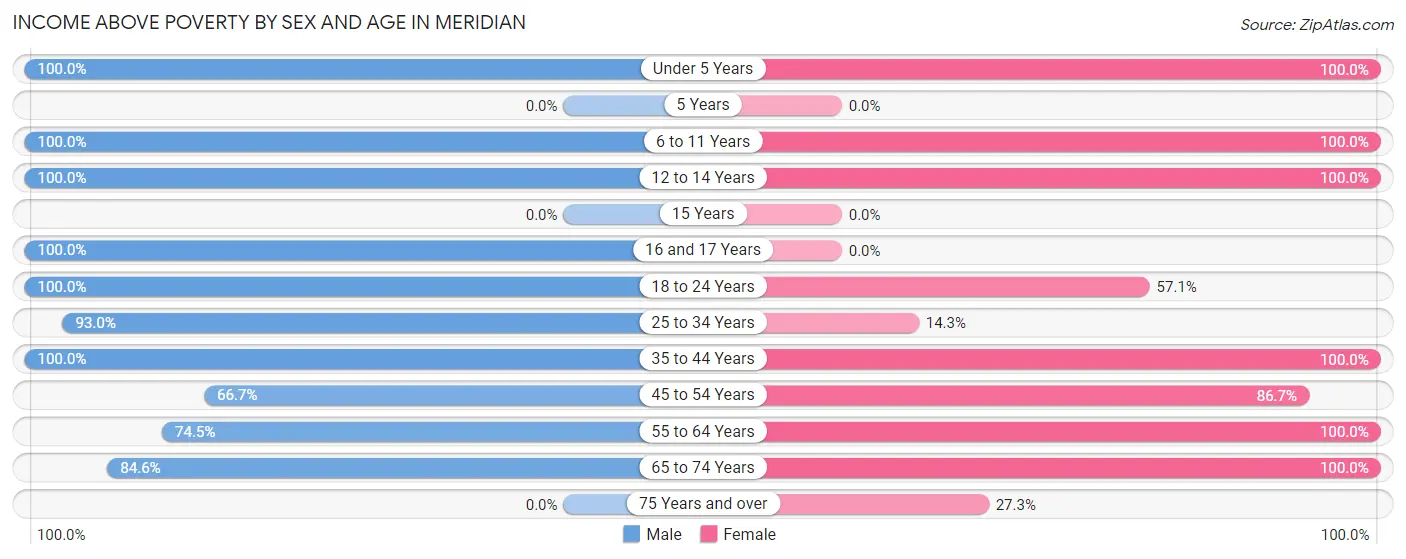
| Age Bracket | Male | Female |
| Under 5 Years | 17 (100.0%) | 35 (100.0%) |
| 5 Years | 0 (0.0%) | 0 (0.0%) |
| 6 to 11 Years | 15 (100.0%) | 5 (100.0%) |
| 12 to 14 Years | 8 (100.0%) | 10 (100.0%) |
| 15 Years | 0 (0.0%) | 0 (0.0%) |
| 16 and 17 Years | 5 (100.0%) | 0 (0.0%) |
| 18 to 24 Years | 17 (100.0%) | 4 (57.1%) |
| 25 to 34 Years | 66 (93.0%) | 2 (14.3%) |
| 35 to 44 Years | 23 (100.0%) | 10 (100.0%) |
| 45 to 54 Years | 10 (66.7%) | 13 (86.7%) |
| 55 to 64 Years | 35 (74.5%) | 25 (100.0%) |
| 65 to 74 Years | 11 (84.6%) | 13 (100.0%) |
| 75 Years and over | 0 (0.0%) | 3 (27.3%) |
| Total | 207 (89.6%) | 120 (82.8%) |
Income Below Poverty Among Married-Couple Families in Meridian
The poverty statistics for married-couple families in Meridian show that 4.8% or 3 of the total 62 families live below the poverty line. Families with no children have the highest poverty rate of 9.7%, comprising of 3 families. On the other hand, families with 1 or 2 children have the lowest poverty rate of 0.0%, which includes 0 families.
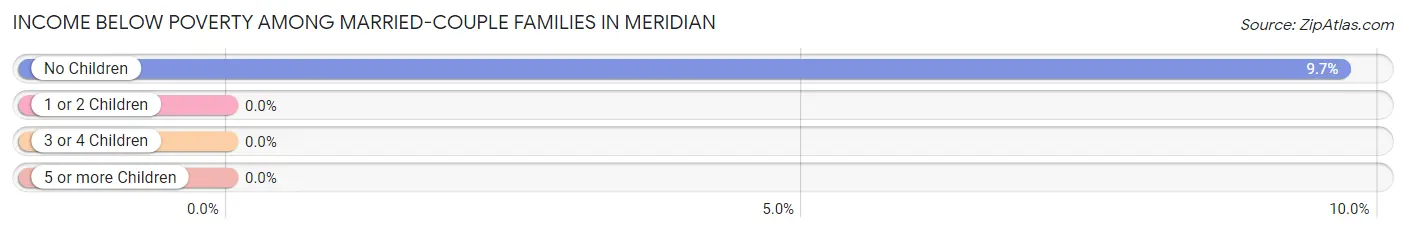
| Children | Above Poverty | Below Poverty |
| No Children | 28 (90.3%) | 3 (9.7%) |
| 1 or 2 Children | 25 (100.0%) | 0 (0.0%) |
| 3 or 4 Children | 6 (100.0%) | 0 (0.0%) |
| 5 or more Children | 0 (0.0%) | 0 (0.0%) |
| Total | 59 (95.2%) | 3 (4.8%) |
Income Below Poverty Among Single-Parent Households in Meridian
According to the poverty data in Meridian, 20.0% or 6 single-father households and 100.0% or 2 single-mother households are living below the poverty line. Among single-father households, those with no children have the highest poverty rate, with 6 households (35.3%) experiencing poverty. Likewise, among single-mother households, those with no children have the highest poverty rate, with 2 households (100.0%) falling below the poverty line.
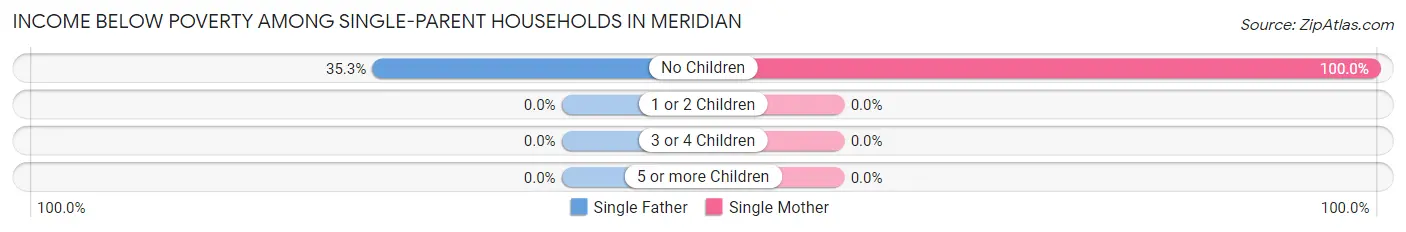
| Children | Single Father | Single Mother |
| No Children | 6 (35.3%) | 2 (100.0%) |
| 1 or 2 Children | 0 (0.0%) | 0 (0.0%) |
| 3 or 4 Children | 0 (0.0%) | 0 (0.0%) |
| 5 or more Children | 0 (0.0%) | 0 (0.0%) |
| Total | 6 (20.0%) | 2 (100.0%) |
Income Below Poverty Among Married-Couple vs Single-Parent Households in Meridian
The poverty data for Meridian shows that 3 of the married-couple family households (4.8%) and 8 of the single-parent households (25.0%) are living below the poverty level. Within the married-couple family households, those with no children have the highest poverty rate, with 3 households (9.7%) falling below the poverty line. Among the single-parent households, those with no children have the highest poverty rate, with 8 household (42.1%) living below poverty.
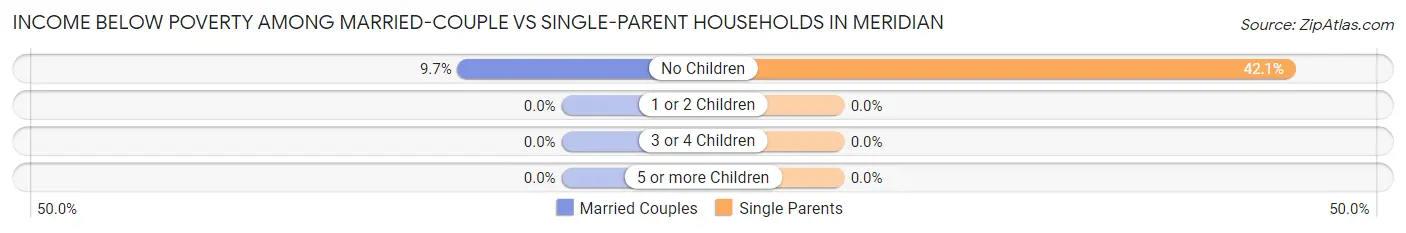
| Children | Married-Couple Families | Single-Parent Households |
| No Children | 3 (9.7%) | 8 (42.1%) |
| 1 or 2 Children | 0 (0.0%) | 0 (0.0%) |
| 3 or 4 Children | 0 (0.0%) | 0 (0.0%) |
| 5 or more Children | 0 (0.0%) | 0 (0.0%) |
| Total | 3 (4.8%) | 8 (25.0%) |
Race in Meridian
The most populous races in Meridian are White / Caucasian (256 | 68.1%), Some other Race (94 | 25.0%), and Hispanic or Latino (73 | 19.4%).
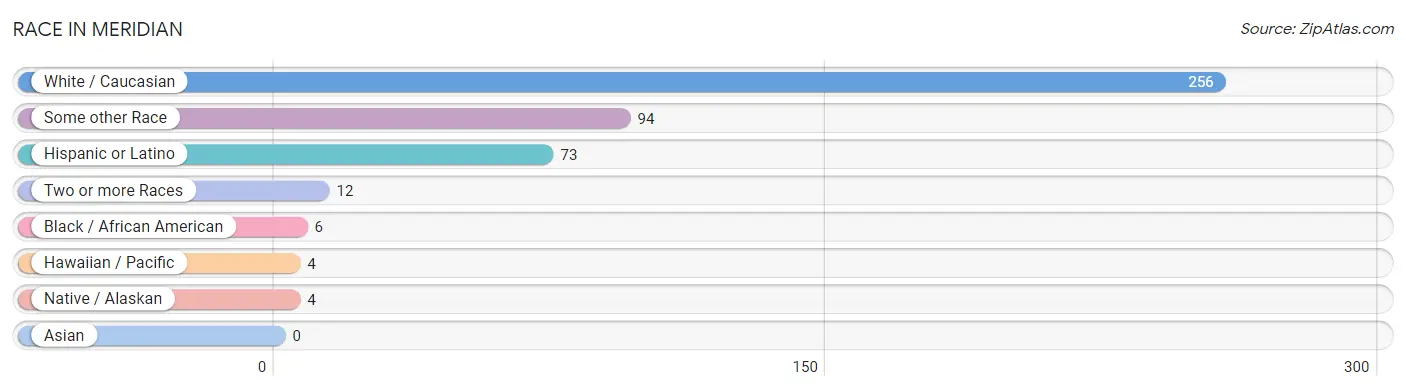
| Race | # Population | % Population |
| Asian | 0 | 0.0% |
| Black / African American | 6 | 1.6% |
| Hawaiian / Pacific | 4 | 1.1% |
| Hispanic or Latino | 73 | 19.4% |
| Native / Alaskan | 4 | 1.1% |
| White / Caucasian | 256 | 68.1% |
| Two or more Races | 12 | 3.2% |
| Some other Race | 94 | 25.0% |
| Total | 376 | 100.0% |
Ancestry in Meridian
The most populous ancestries reported in Meridian are Danish (66 | 17.5%), Mexican (60 | 16.0%), English (52 | 13.8%), Czechoslovakian (48 | 12.8%), and Irish (24 | 6.4%), together accounting for 66.5% of all Meridian residents.
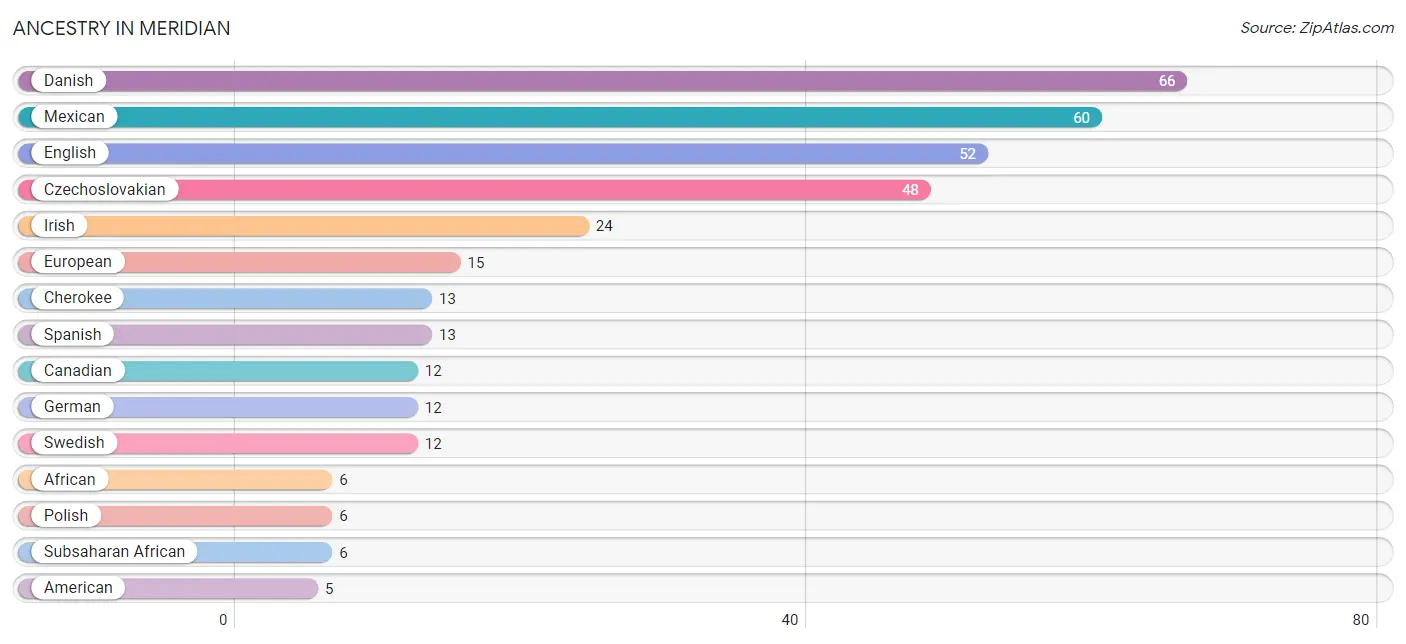
| Ancestry | # Population | % Population |
| African | 6 | 1.6% |
| American | 5 | 1.3% |
| Canadian | 12 | 3.2% |
| Cherokee | 13 | 3.5% |
| Czechoslovakian | 48 | 12.8% |
| Danish | 66 | 17.5% |
| Eastern European | 3 | 0.8% |
| English | 52 | 13.8% |
| European | 15 | 4.0% |
| German | 12 | 3.2% |
| Greek | 2 | 0.5% |
| Irish | 24 | 6.4% |
| Italian | 4 | 1.1% |
| Mexican | 60 | 16.0% |
| Northern European | 2 | 0.5% |
| Polish | 6 | 1.6% |
| Samoan | 4 | 1.1% |
| Scotch-Irish | 4 | 1.1% |
| Scottish | 5 | 1.3% |
| Spanish | 13 | 3.5% |
| Subsaharan African | 6 | 1.6% |
| Swedish | 12 | 3.2% |
| Ute | 3 | 0.8% |
| Welsh | 2 | 0.5% | View All 24 Rows |
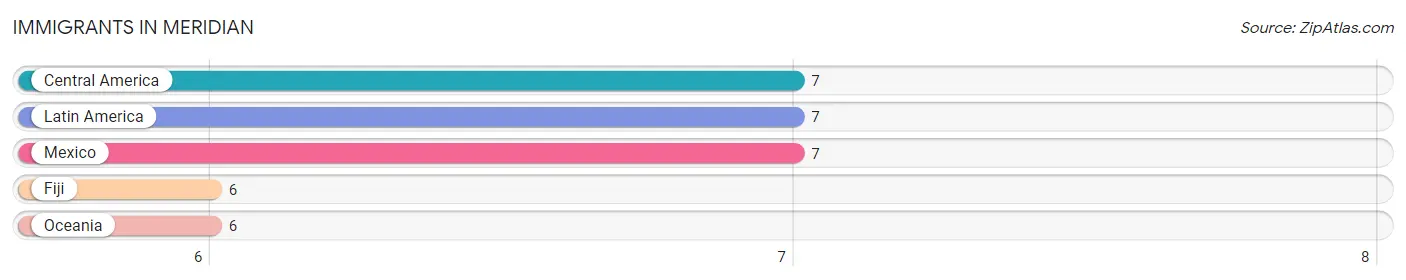
Immigrants in Meridian
The most numerous immigrant groups reported in Meridian came from Central America (7 | 1.9%), Latin America (7 | 1.9%), Mexico (7 | 1.9%), Fiji (6 | 1.6%), and Oceania (6 | 1.6%), together accounting for 8.8% of all Meridian residents.
| Immigration Origin | # Population | % Population |
| Central America | 7 | 1.9% |
| Fiji | 6 | 1.6% |
| Latin America | 7 | 1.9% |
| Mexico | 7 | 1.9% |
| Oceania | 6 | 1.6% | View All 5 Rows |
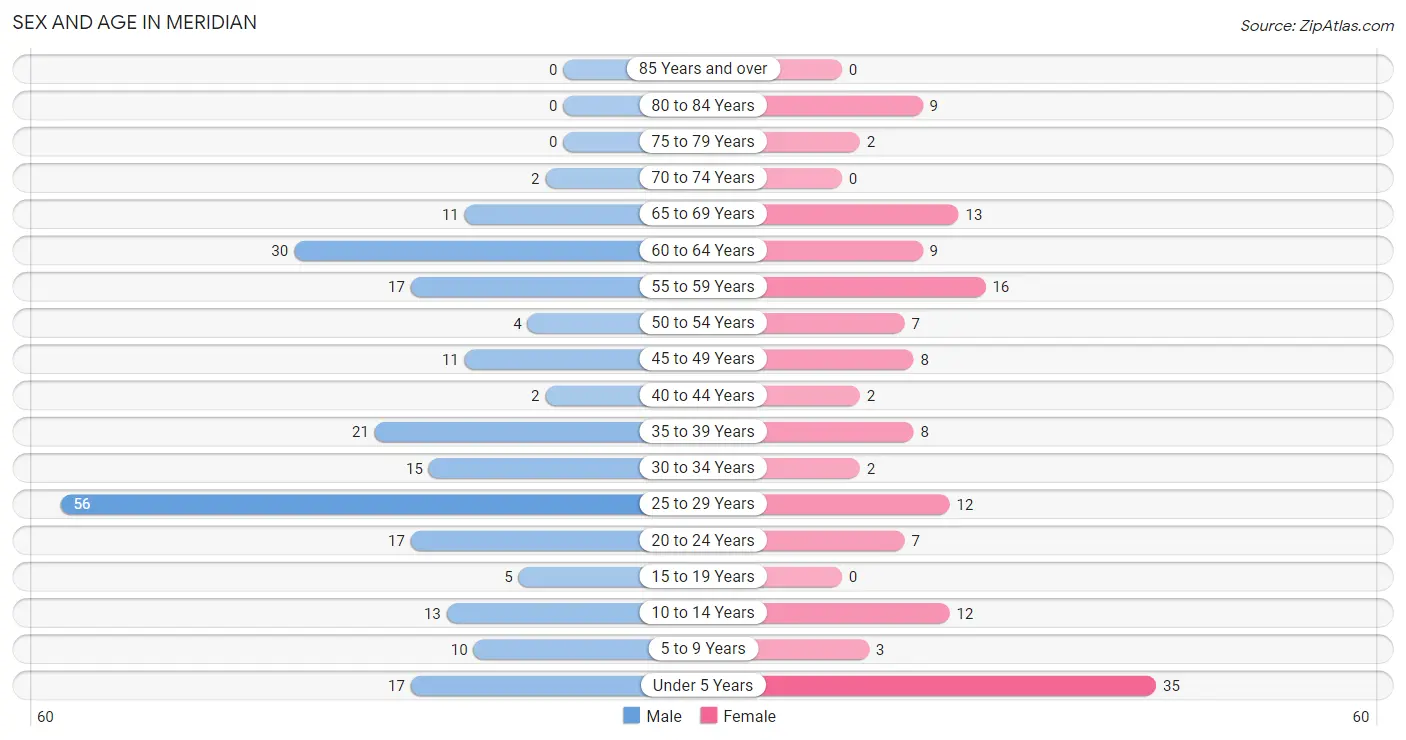
Sex and Age in Meridian
Sex and Age in Meridian
The most populous age groups in Meridian are 25 to 29 Years (56 | 24.2%) for men and Under 5 Years (35 | 24.1%) for women.
| Age Bracket | Male | Female |
| Under 5 Years | 17 (7.4%) | 35 (24.1%) |
| 5 to 9 Years | 10 (4.3%) | 3 (2.1%) |
| 10 to 14 Years | 13 (5.6%) | 12 (8.3%) |
| 15 to 19 Years | 5 (2.2%) | 0 (0.0%) |
| 20 to 24 Years | 17 (7.4%) | 7 (4.8%) |
| 25 to 29 Years | 56 (24.2%) | 12 (8.3%) |
| 30 to 34 Years | 15 (6.5%) | 2 (1.4%) |
| 35 to 39 Years | 21 (9.1%) | 8 (5.5%) |
| 40 to 44 Years | 2 (0.9%) | 2 (1.4%) |
| 45 to 49 Years | 11 (4.8%) | 8 (5.5%) |
| 50 to 54 Years | 4 (1.7%) | 7 (4.8%) |
| 55 to 59 Years | 17 (7.4%) | 16 (11.0%) |
| 60 to 64 Years | 30 (13.0%) | 9 (6.2%) |
| 65 to 69 Years | 11 (4.8%) | 13 (9.0%) |
| 70 to 74 Years | 2 (0.9%) | 0 (0.0%) |
| 75 to 79 Years | 0 (0.0%) | 2 (1.4%) |
| 80 to 84 Years | 0 (0.0%) | 9 (6.2%) |
| 85 Years and over | 0 (0.0%) | 0 (0.0%) |
| Total | 231 (100.0%) | 145 (100.0%) |
Families and Households in Meridian
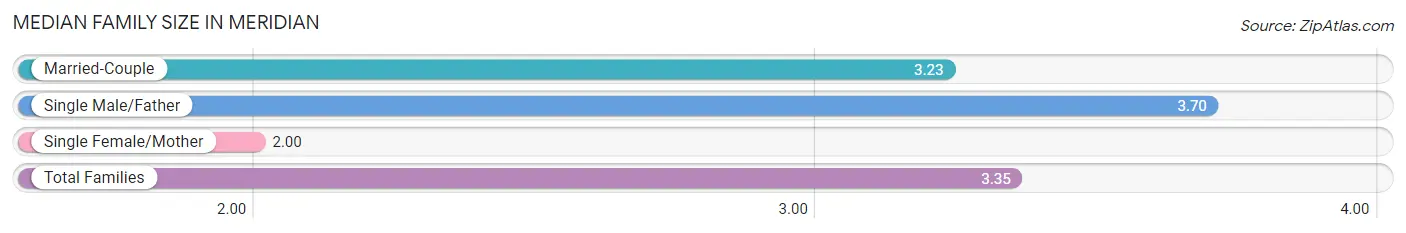
Median Family Size in Meridian
The median family size in Meridian is 3.35 persons per family, with single male/father families (30 | 31.9%) accounting for the largest median family size of 3.7 persons per family. On the other hand, single female/mother families (2 | 2.1%) represent the smallest median family size with 2.00 persons per family.
| Family Type | # Families | Family Size |
| Married-Couple | 62 (66.0%) | 3.23 |
| Single Male/Father | 30 (31.9%) | 3.70 |
| Single Female/Mother | 2 (2.1%) | 2.00 |
| Total Families | 94 (100.0%) | 3.35 |
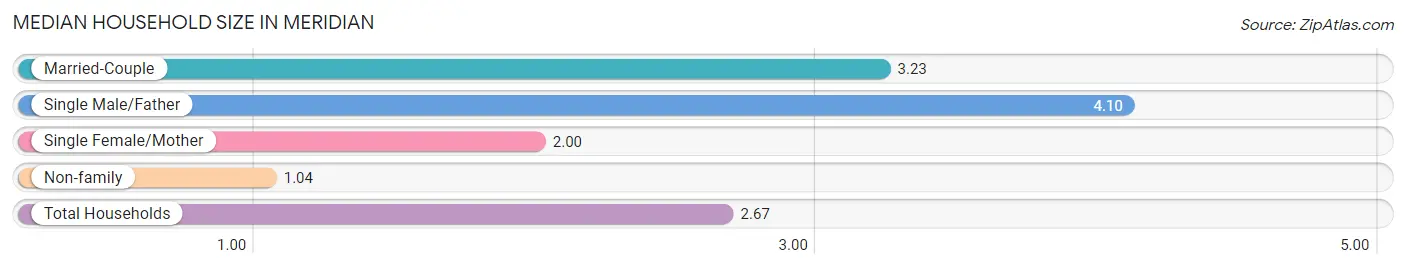
Median Household Size in Meridian
The median household size in Meridian is 2.67 persons per household, with single male/father households (30 | 21.3%) accounting for the largest median household size of 4.1 persons per household. non-family households (47 | 33.3%) represent the smallest median household size with 1.04 persons per household.
| Household Type | # Households | Household Size |
| Married-Couple | 62 (44.0%) | 3.23 |
| Single Male/Father | 30 (21.3%) | 4.10 |
| Single Female/Mother | 2 (1.4%) | 2.00 |
| Non-family | 47 (33.3%) | 1.04 |
| Total Households | 141 (100.0%) | 2.67 |
Household Size by Marriage Status in Meridian
Out of a total of 141 households in Meridian, 94 (66.7%) are family households, while 47 (33.3%) are nonfamily households. The most numerous type of family households are 2-person households, comprising 38, and the most common type of nonfamily households are 1-person households, comprising 45.
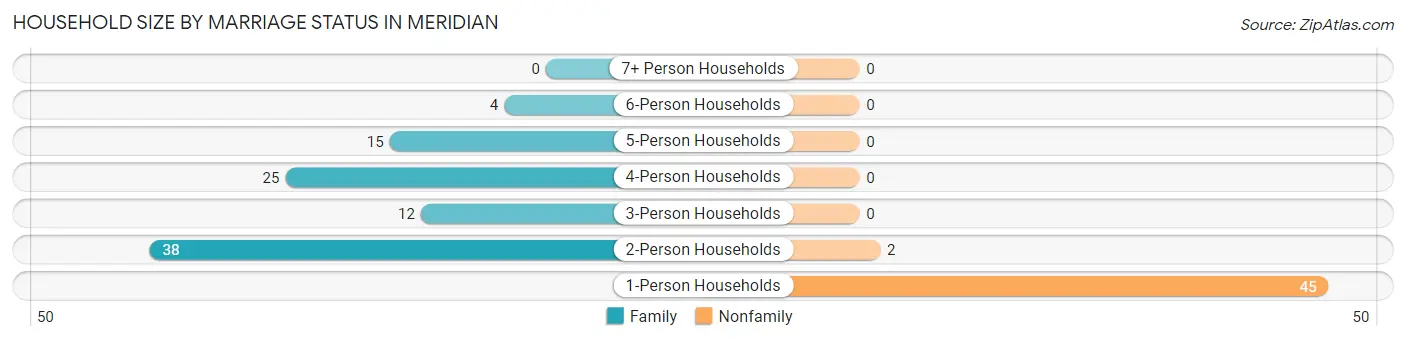
| Household Size | Family Households | Nonfamily Households |
| 1-Person Households | - | 45 (31.9%) |
| 2-Person Households | 38 (27.0%) | 2 (1.4%) |
| 3-Person Households | 12 (8.5%) | 0 (0.0%) |
| 4-Person Households | 25 (17.7%) | 0 (0.0%) |
| 5-Person Households | 15 (10.6%) | 0 (0.0%) |
| 6-Person Households | 4 (2.8%) | 0 (0.0%) |
| 7+ Person Households | 0 (0.0%) | 0 (0.0%) |
| Total | 94 (66.7%) | 47 (33.3%) |
Female Fertility in Meridian
Fertility by Age in Meridian
Average fertility rate in Meridian is 333.0 births per 1,000 women. Women in the age bracket of 35 to 50 years have the highest fertility rate with 500.0 births per 1,000 women. Women in the age bracket of 35 to 50 years acount for 69.2% of all women with births.
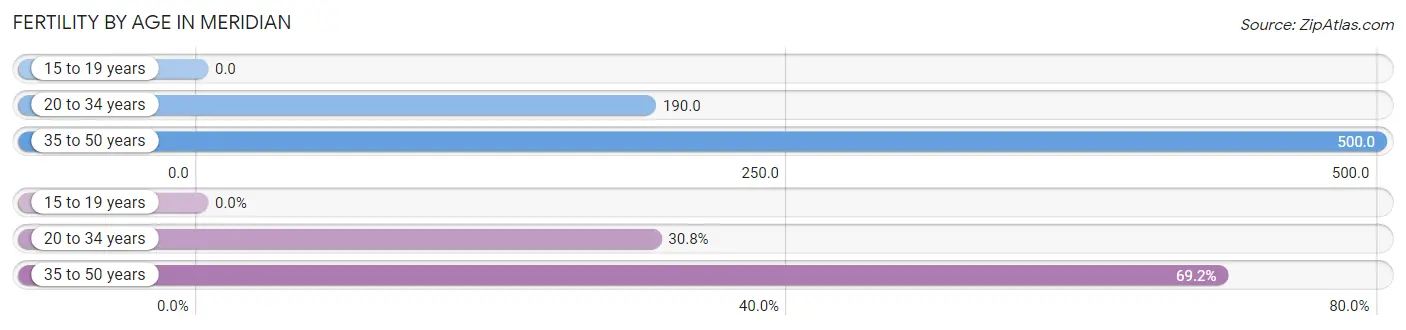
| Age Bracket | Women with Births | Births / 1,000 Women |
| 15 to 19 years | 0 (0.0%) | 0.0 |
| 20 to 34 years | 4 (30.8%) | 190.0 |
| 35 to 50 years | 9 (69.2%) | 500.0 |
| Total | 13 (100.0%) | 333.0 |
Fertility by Age by Marriage Status in Meridian
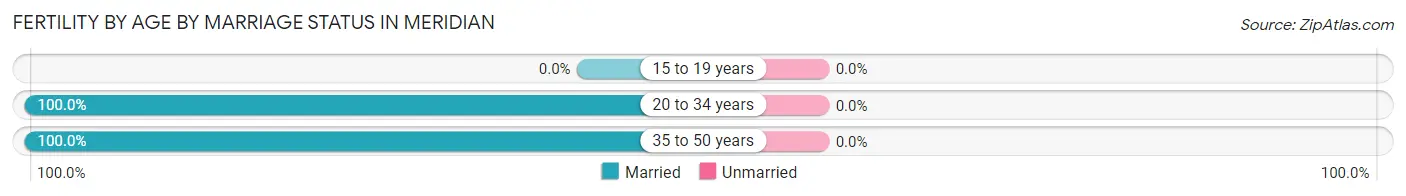
| Age Bracket | Married | Unmarried |
| 15 to 19 years | 0 (0.0%) | 0 (0.0%) |
| 20 to 34 years | 4 (100.0%) | 0 (0.0%) |
| 35 to 50 years | 9 (100.0%) | 0 (0.0%) |
| Total | 13 (100.0%) | 0 (0.0%) |
Fertility by Education in Meridian
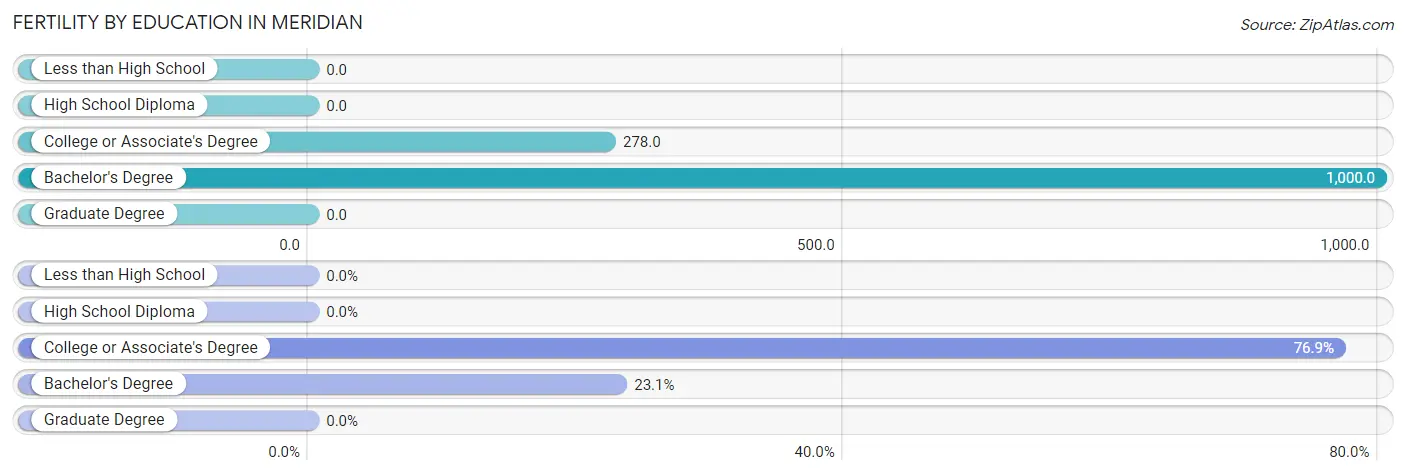
| Educational Attainment | Women with Births | Births / 1,000 Women |
| Less than High School | 0 (0.0%) | 0.0 |
| High School Diploma | 0 (0.0%) | 0.0 |
| College or Associate's Degree | 10 (76.9%) | 278.0 |
| Bachelor's Degree | 3 (23.1%) | 1,000.0 |
| Graduate Degree | 0 (0.0%) | 0.0 |
| Total | 13 (100.0%) | 333.0 |
Fertility by Education by Marriage Status in Meridian
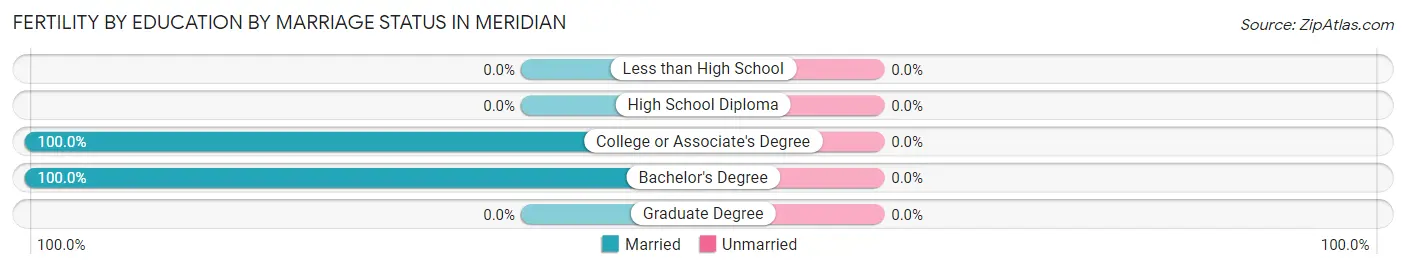
| Educational Attainment | Married | Unmarried |
| Less than High School | 0 (0.0%) | 0 (0.0%) |
| High School Diploma | 0 (0.0%) | 0 (0.0%) |
| College or Associate's Degree | 10 (100.0%) | 0 (0.0%) |
| Bachelor's Degree | 3 (100.0%) | 0 (0.0%) |
| Graduate Degree | 0 (0.0%) | 0 (0.0%) |
| Total | 13 (100.0%) | 0 (0.0%) |
Employment Characteristics in Meridian
Employment by Class of Employer in Meridian
Among the 111 employed individuals in Meridian, private company employees (44 | 39.6%), local government employees (19 | 17.1%), and not-for-profit organizations (15 | 13.5%) make up the most common classes of employment.
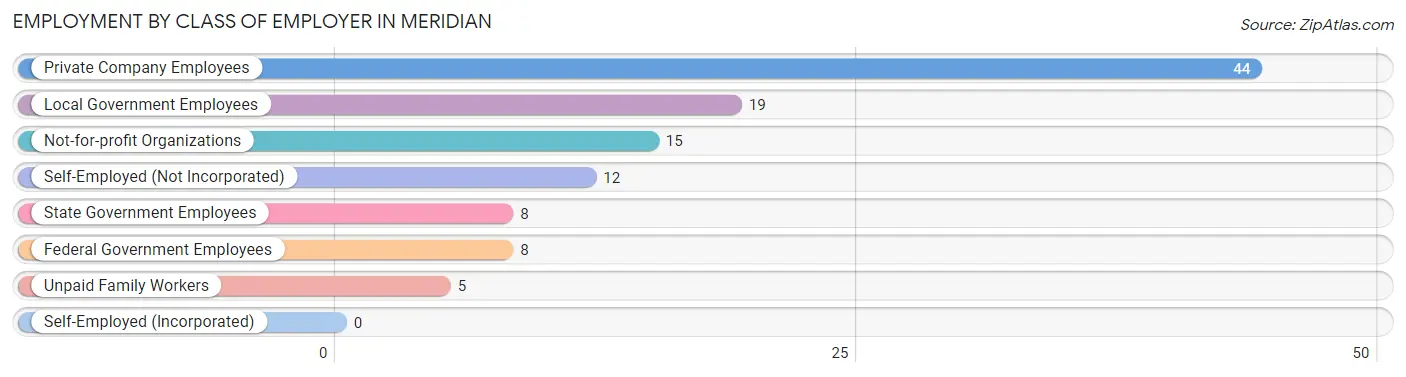
| Employer Class | # Employees | % Employees |
| Private Company Employees | 44 | 39.6% |
| Self-Employed (Incorporated) | 0 | 0.0% |
| Self-Employed (Not Incorporated) | 12 | 10.8% |
| Not-for-profit Organizations | 15 | 13.5% |
| Local Government Employees | 19 | 17.1% |
| State Government Employees | 8 | 7.2% |
| Federal Government Employees | 8 | 7.2% |
| Unpaid Family Workers | 5 | 4.5% |
| Total | 111 | 100.0% |
Employment Status by Age in Meridian
According to the labor force statistics for Meridian, out of the total population over 16 years of age (286), 49.3% or 141 individuals are in the labor force, with 7.8% or 11 of them unemployed. The age group with the highest labor force participation rate is 30 to 34 years, with 100.0% or 17 individuals in the labor force. Within the labor force, the 20 to 24 years age range has the highest percentage of unemployed individuals, with 25.0% or 5 of them being unemployed.
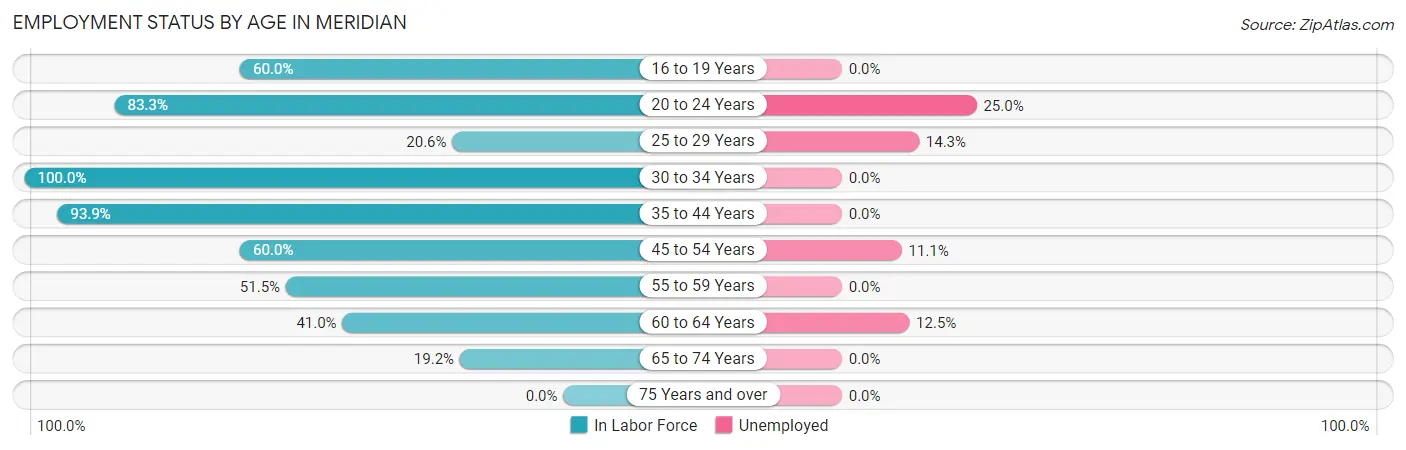
| Age Bracket | In Labor Force | Unemployed |
| 16 to 19 Years | 3 (60.0%) | 0 (0.0%) |
| 20 to 24 Years | 20 (83.3%) | 5 (25.0%) |
| 25 to 29 Years | 14 (20.6%) | 2 (14.3%) |
| 30 to 34 Years | 17 (100.0%) | 0 (0.0%) |
| 35 to 44 Years | 31 (93.9%) | 0 (0.0%) |
| 45 to 54 Years | 18 (60.0%) | 2 (11.1%) |
| 55 to 59 Years | 17 (51.5%) | 0 (0.0%) |
| 60 to 64 Years | 16 (41.0%) | 2 (12.5%) |
| 65 to 74 Years | 5 (19.2%) | 0 (0.0%) |
| 75 Years and over | 0 (0.0%) | 0 (0.0%) |
| Total | 141 (49.3%) | 11 (7.8%) |
Employment Status by Educational Attainment in Meridian
According to labor force statistics for Meridian, 51.4% of individuals (113) out of the total population between 25 and 64 years of age (220) are in the labor force, with 5.3% or 6 of them being unemployed. The group with the highest labor force participation rate are those with the educational attainment of college / associate degree, with 72.0% or 59 individuals in the labor force. Within the labor force, individuals with college / associate degree education have the highest percentage of unemployment, with 6.8% or 4 of them being unemployed.
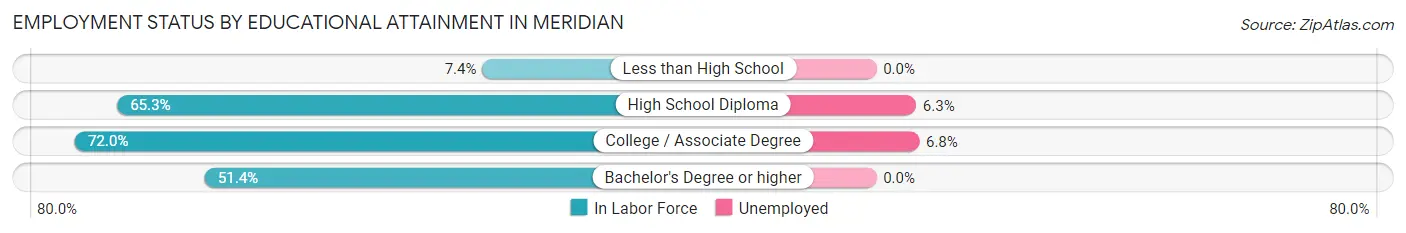
| Educational Attainment | In Labor Force | Unemployed |
| Less than High School | 4 (7.4%) | 0 (0.0%) |
| High School Diploma | 32 (65.3%) | 3 (6.3%) |
| College / Associate Degree | 59 (72.0%) | 6 (6.8%) |
| Bachelor's Degree or higher | 18 (51.4%) | 0 (0.0%) |
| Total | 113 (51.4%) | 12 (5.3%) |
Employment Occupations by Sex in Meridian
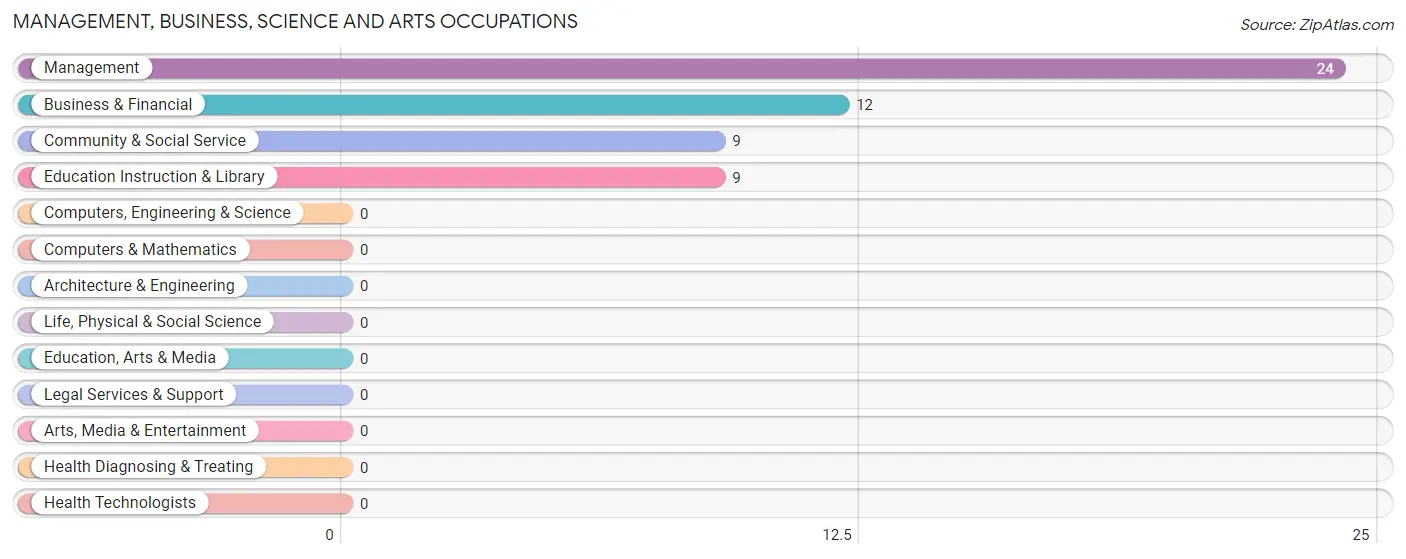
Management, Business, Science and Arts Occupations
The most common Management, Business, Science and Arts occupations in Meridian are Management (24 | 18.5%), Business & Financial (12 | 9.2%), Community & Social Service (9 | 6.9%), and Education Instruction & Library (9 | 6.9%).
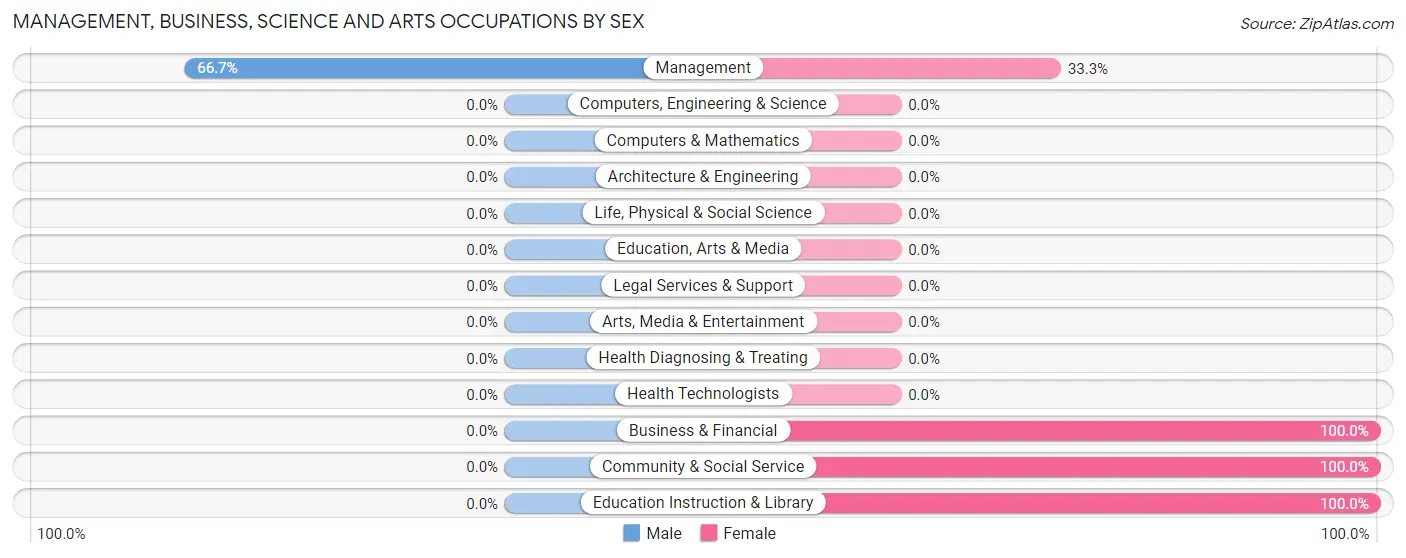
Management, Business, Science and Arts Occupations by Sex
| Occupation | Male | Female |
| Management | 16 (66.7%) | 8 (33.3%) |
| Business & Financial | 0 (0.0%) | 12 (100.0%) |
| Computers, Engineering & Science | 0 (0.0%) | 0 (0.0%) |
| Computers & Mathematics | 0 (0.0%) | 0 (0.0%) |
| Architecture & Engineering | 0 (0.0%) | 0 (0.0%) |
| Life, Physical & Social Science | 0 (0.0%) | 0 (0.0%) |
| Community & Social Service | 0 (0.0%) | 9 (100.0%) |
| Education, Arts & Media | 0 (0.0%) | 0 (0.0%) |
| Legal Services & Support | 0 (0.0%) | 0 (0.0%) |
| Education Instruction & Library | 0 (0.0%) | 9 (100.0%) |
| Arts, Media & Entertainment | 0 (0.0%) | 0 (0.0%) |
| Health Diagnosing & Treating | 0 (0.0%) | 0 (0.0%) |
| Health Technologists | 0 (0.0%) | 0 (0.0%) |
| Total (Category) | 16 (35.6%) | 29 (64.4%) |
| Total (Overall) | 91 (70.0%) | 39 (30.0%) |
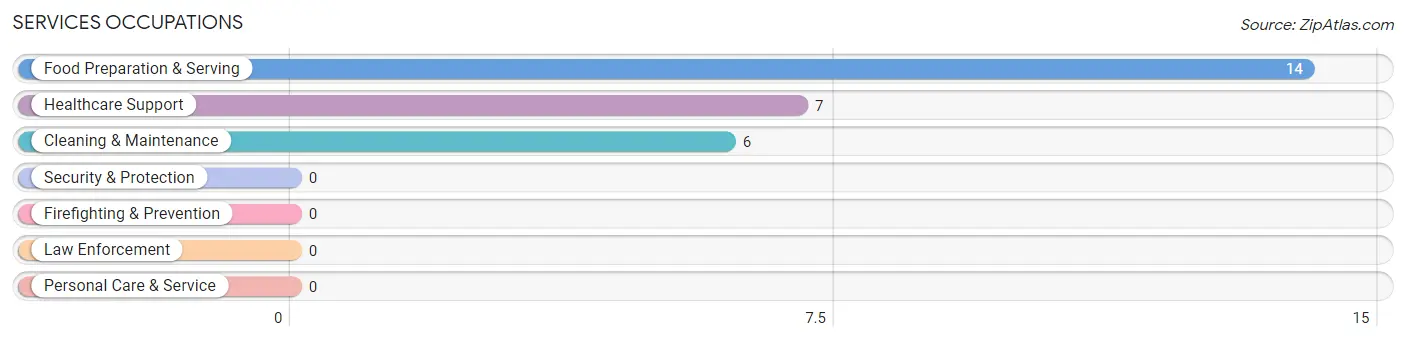
Services Occupations
The most common Services occupations in Meridian are Food Preparation & Serving (14 | 10.8%), Healthcare Support (7 | 5.4%), and Cleaning & Maintenance (6 | 4.6%).
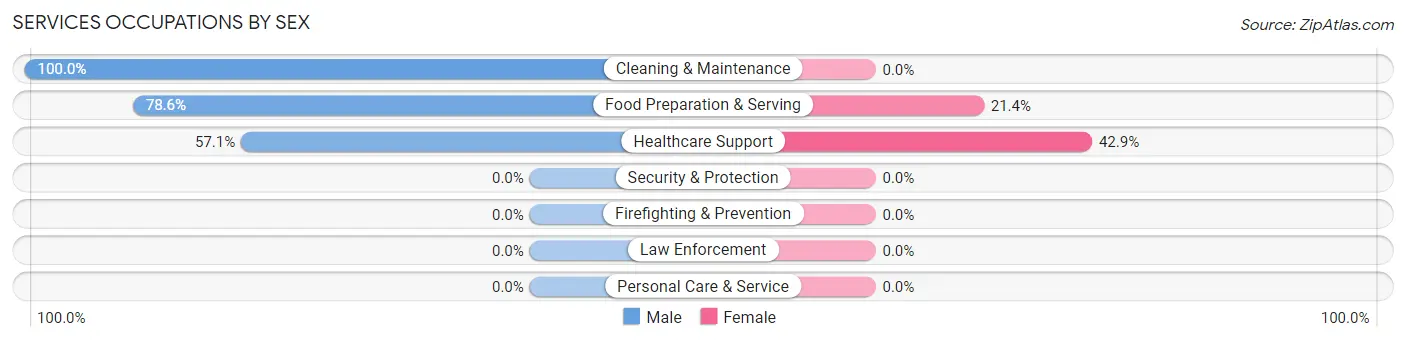
Services Occupations by Sex
Within the Services occupations in Meridian, the most male-oriented occupations are Cleaning & Maintenance (100.0%), Food Preparation & Serving (78.6%), and Healthcare Support (57.1%), while the most female-oriented occupations are Healthcare Support (42.9%), and Food Preparation & Serving (21.4%).
| Occupation | Male | Female |
| Healthcare Support | 4 (57.1%) | 3 (42.9%) |
| Security & Protection | 0 (0.0%) | 0 (0.0%) |
| Firefighting & Prevention | 0 (0.0%) | 0 (0.0%) |
| Law Enforcement | 0 (0.0%) | 0 (0.0%) |
| Food Preparation & Serving | 11 (78.6%) | 3 (21.4%) |
| Cleaning & Maintenance | 6 (100.0%) | 0 (0.0%) |
| Personal Care & Service | 0 (0.0%) | 0 (0.0%) |
| Total (Category) | 21 (77.8%) | 6 (22.2%) |
| Total (Overall) | 91 (70.0%) | 39 (30.0%) |
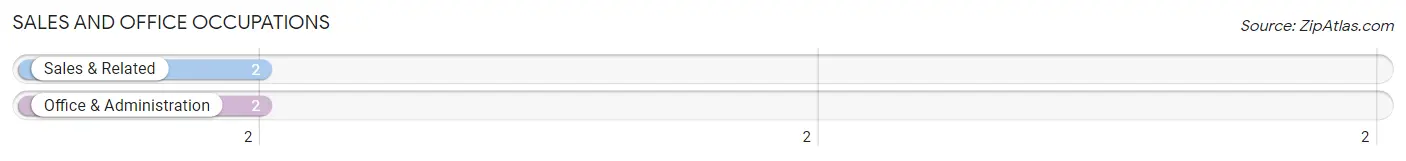
Sales and Office Occupations
The most common Sales and Office occupations in Meridian are Sales & Related (2 | 1.5%), and Office & Administration (2 | 1.5%).
Sales and Office Occupations by Sex
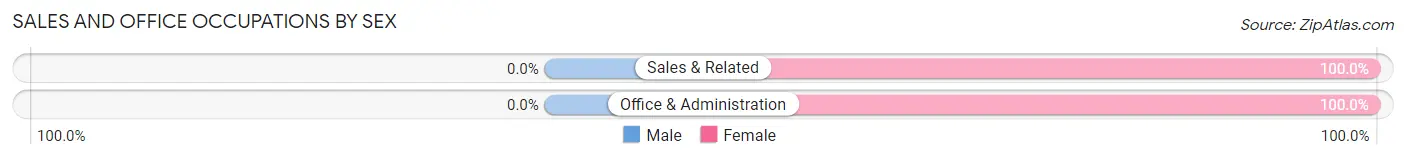
| Occupation | Male | Female |
| Sales & Related | 0 (0.0%) | 2 (100.0%) |
| Office & Administration | 0 (0.0%) | 2 (100.0%) |
| Total (Category) | 0 (0.0%) | 4 (100.0%) |
| Total (Overall) | 91 (70.0%) | 39 (30.0%) |
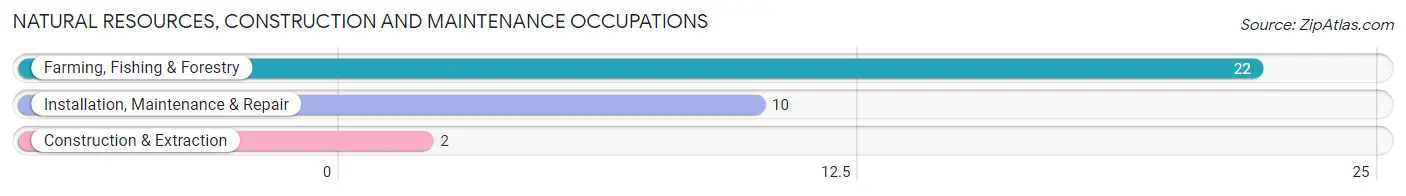
Natural Resources, Construction and Maintenance Occupations
The most common Natural Resources, Construction and Maintenance occupations in Meridian are Farming, Fishing & Forestry (22 | 16.9%), Installation, Maintenance & Repair (10 | 7.7%), and Construction & Extraction (2 | 1.5%).
Natural Resources, Construction and Maintenance Occupations by Sex
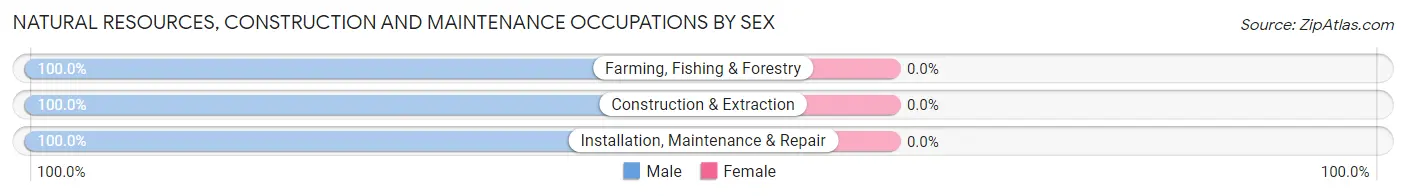
| Occupation | Male | Female |
| Farming, Fishing & Forestry | 22 (100.0%) | 0 (0.0%) |
| Construction & Extraction | 2 (100.0%) | 0 (0.0%) |
| Installation, Maintenance & Repair | 10 (100.0%) | 0 (0.0%) |
| Total (Category) | 34 (100.0%) | 0 (0.0%) |
| Total (Overall) | 91 (70.0%) | 39 (30.0%) |
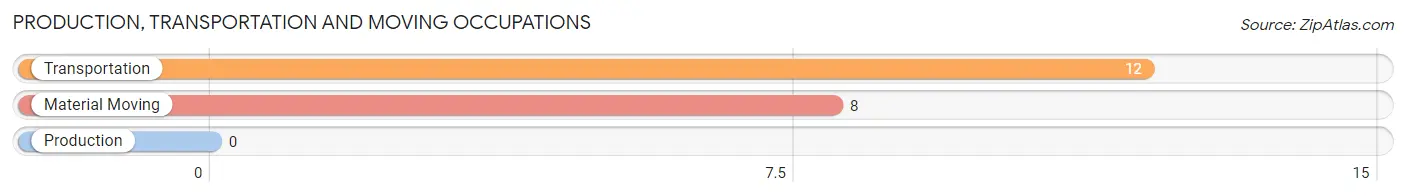
Production, Transportation and Moving Occupations
The most common Production, Transportation and Moving occupations in Meridian are Transportation (12 | 9.2%), and Material Moving (8 | 6.1%).
Production, Transportation and Moving Occupations by Sex
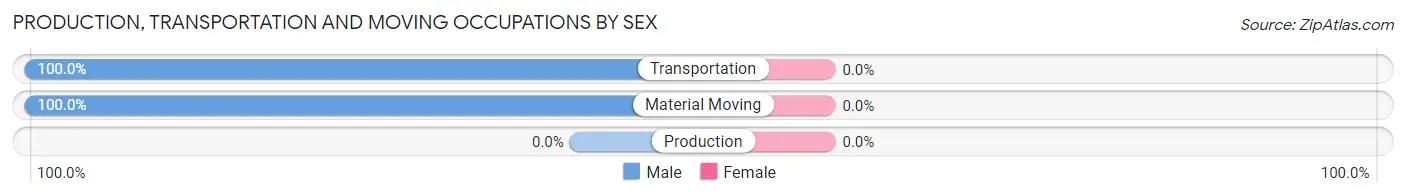
| Occupation | Male | Female |
| Production | 0 (0.0%) | 0 (0.0%) |
| Transportation | 12 (100.0%) | 0 (0.0%) |
| Material Moving | 8 (100.0%) | 0 (0.0%) |
| Total (Category) | 20 (100.0%) | 0 (0.0%) |
| Total (Overall) | 91 (70.0%) | 39 (30.0%) |
Employment Industries by Sex in Meridian
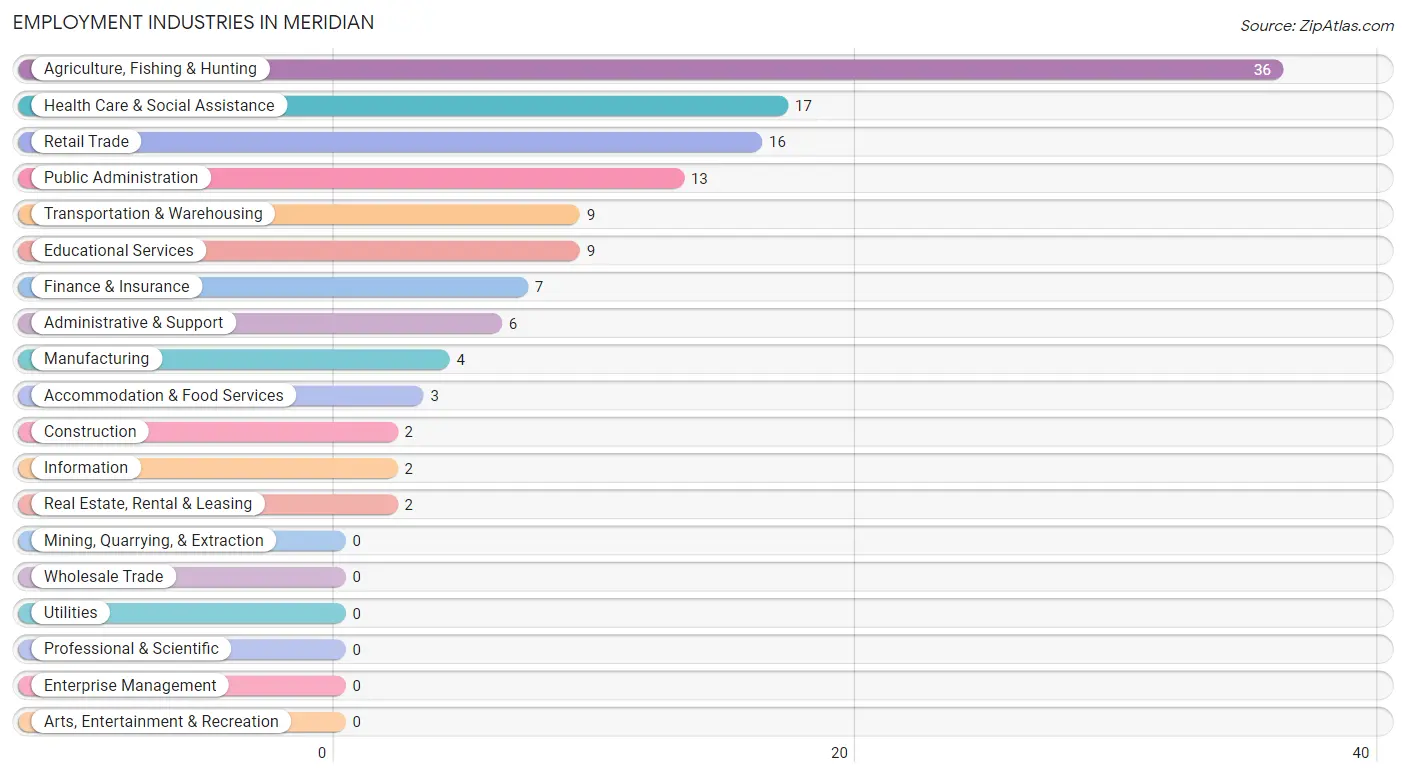
Employment Industries in Meridian
The major employment industries in Meridian include Agriculture, Fishing & Hunting (36 | 27.7%), Health Care & Social Assistance (17 | 13.1%), Retail Trade (16 | 12.3%), Public Administration (13 | 10.0%), and Transportation & Warehousing (9 | 6.9%).
Employment Industries by Sex in Meridian
The Meridian industries that see more men than women are Agriculture, Fishing & Hunting (100.0%), Construction (100.0%), and Manufacturing (100.0%), whereas the industries that tend to have a higher number of women are Finance & Insurance (100.0%), Real Estate, Rental & Leasing (100.0%), and Educational Services (100.0%).
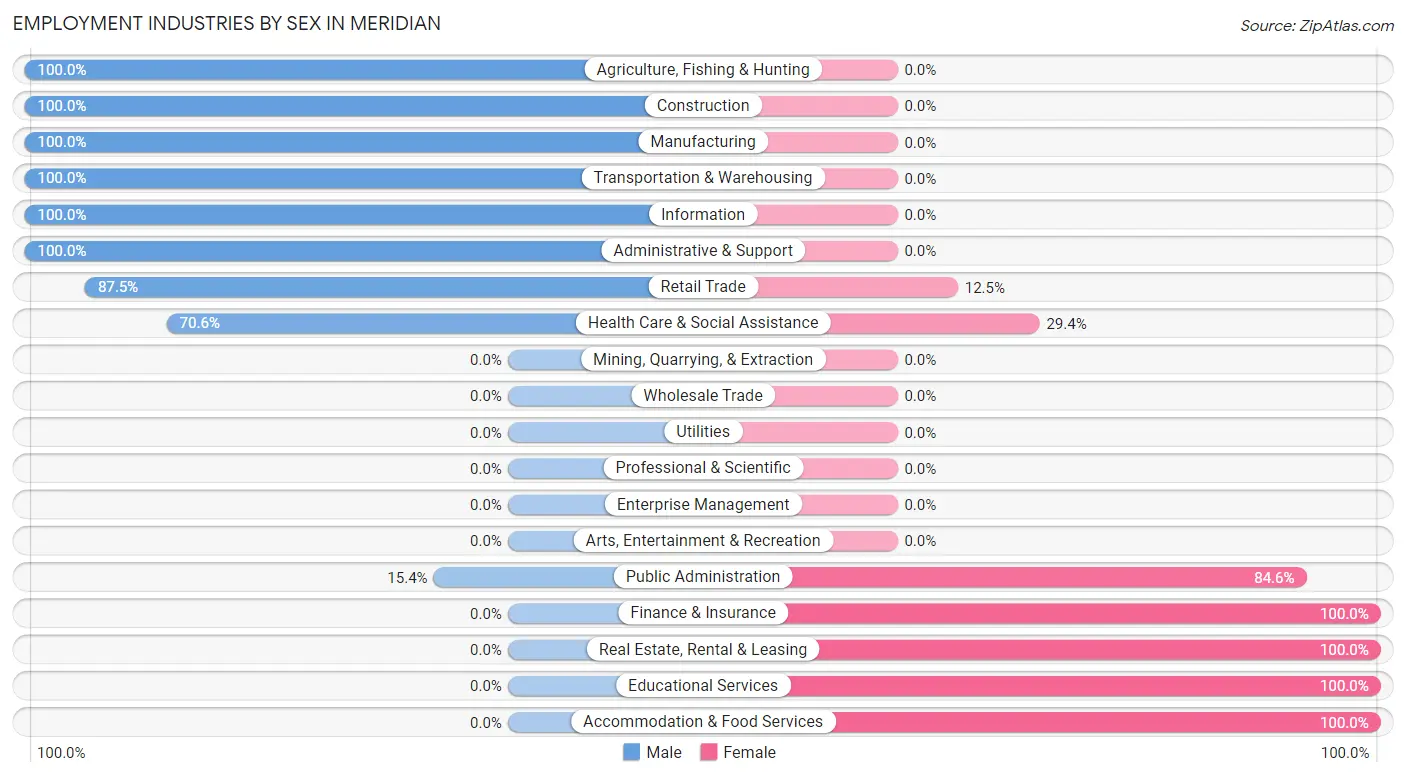
| Industry | Male | Female |
| Agriculture, Fishing & Hunting | 36 (100.0%) | 0 (0.0%) |
| Mining, Quarrying, & Extraction | 0 (0.0%) | 0 (0.0%) |
| Construction | 2 (100.0%) | 0 (0.0%) |
| Manufacturing | 4 (100.0%) | 0 (0.0%) |
| Wholesale Trade | 0 (0.0%) | 0 (0.0%) |
| Retail Trade | 14 (87.5%) | 2 (12.5%) |
| Transportation & Warehousing | 9 (100.0%) | 0 (0.0%) |
| Utilities | 0 (0.0%) | 0 (0.0%) |
| Information | 2 (100.0%) | 0 (0.0%) |
| Finance & Insurance | 0 (0.0%) | 7 (100.0%) |
| Real Estate, Rental & Leasing | 0 (0.0%) | 2 (100.0%) |
| Professional & Scientific | 0 (0.0%) | 0 (0.0%) |
| Enterprise Management | 0 (0.0%) | 0 (0.0%) |
| Administrative & Support | 6 (100.0%) | 0 (0.0%) |
| Educational Services | 0 (0.0%) | 9 (100.0%) |
| Health Care & Social Assistance | 12 (70.6%) | 5 (29.4%) |
| Arts, Entertainment & Recreation | 0 (0.0%) | 0 (0.0%) |
| Accommodation & Food Services | 0 (0.0%) | 3 (100.0%) |
| Public Administration | 2 (15.4%) | 11 (84.6%) |
| Total | 91 (70.0%) | 39 (30.0%) |
Education in Meridian
School Enrollment in Meridian
The most common levels of schooling among the 57 students in Meridian are middle school (17 | 29.8%), college / undergraduate (12 | 21.0%), and graduate / professional (12 | 21.0%).
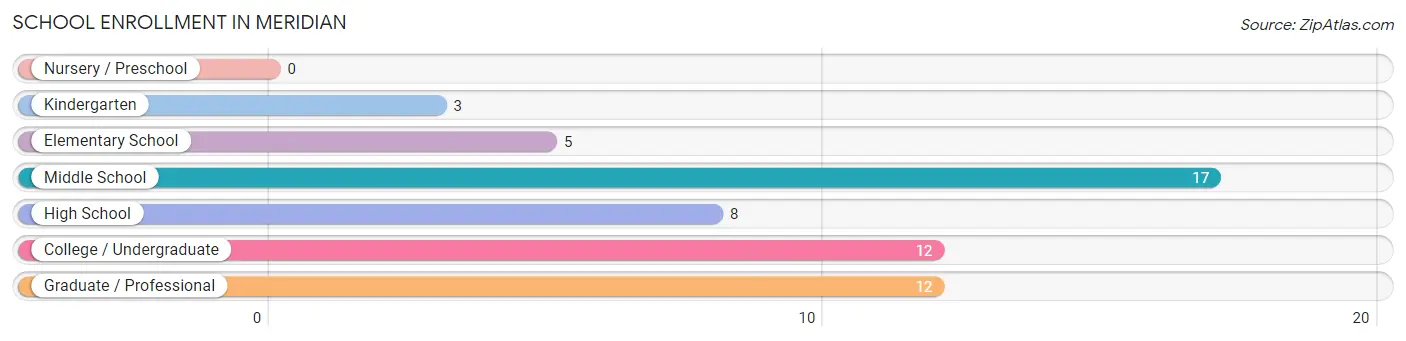
| School Level | # Students | % Students |
| Nursery / Preschool | 0 | 0.0% |
| Kindergarten | 3 | 5.3% |
| Elementary School | 5 | 8.8% |
| Middle School | 17 | 29.8% |
| High School | 8 | 14.0% |
| College / Undergraduate | 12 | 21.0% |
| Graduate / Professional | 12 | 21.0% |
| Total | 57 | 100.0% |
School Enrollment by Age by Funding Source in Meridian
Out of a total of 57 students who are enrolled in schools in Meridian, 4 (7.0%) attend a private institution, while the remaining 53 (93.0%) are enrolled in public schools. The age group of 10 to 14 year olds has the highest likelihood of being enrolled in private schools, with 4 (18.2% in the age bracket) enrolled. Conversely, the age group of 3 to 4 year olds has the lowest likelihood of being enrolled in a private school, with 3 (100.0% in the age bracket) attending a public institution.
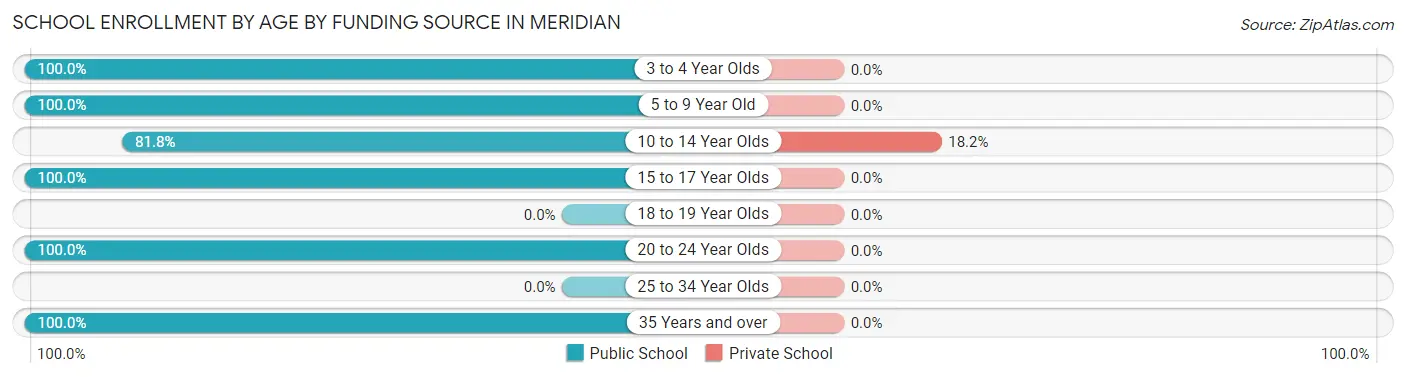
| Age Bracket | Public School | Private School |
| 3 to 4 Year Olds | 3 (100.0%) | 0 (0.0%) |
| 5 to 9 Year Old | 3 (100.0%) | 0 (0.0%) |
| 10 to 14 Year Olds | 18 (81.8%) | 4 (18.2%) |
| 15 to 17 Year Olds | 5 (100.0%) | 0 (0.0%) |
| 18 to 19 Year Olds | 0 (0.0%) | 0 (0.0%) |
| 20 to 24 Year Olds | 15 (100.0%) | 0 (0.0%) |
| 25 to 34 Year Olds | 0 (0.0%) | 0 (0.0%) |
| 35 Years and over | 9 (100.0%) | 0 (0.0%) |
| Total | 53 (93.0%) | 4 (7.0%) |
Educational Attainment by Field of Study in Meridian
Bio, nature & agricultural (12 | 28.6%), liberal arts & history (9 | 21.4%), education (7 | 16.7%), arts & humanities (5 | 11.9%), and business (4 | 9.5%) are the most common fields of study among 42 individuals in Meridian who have obtained a bachelor's degree or higher.
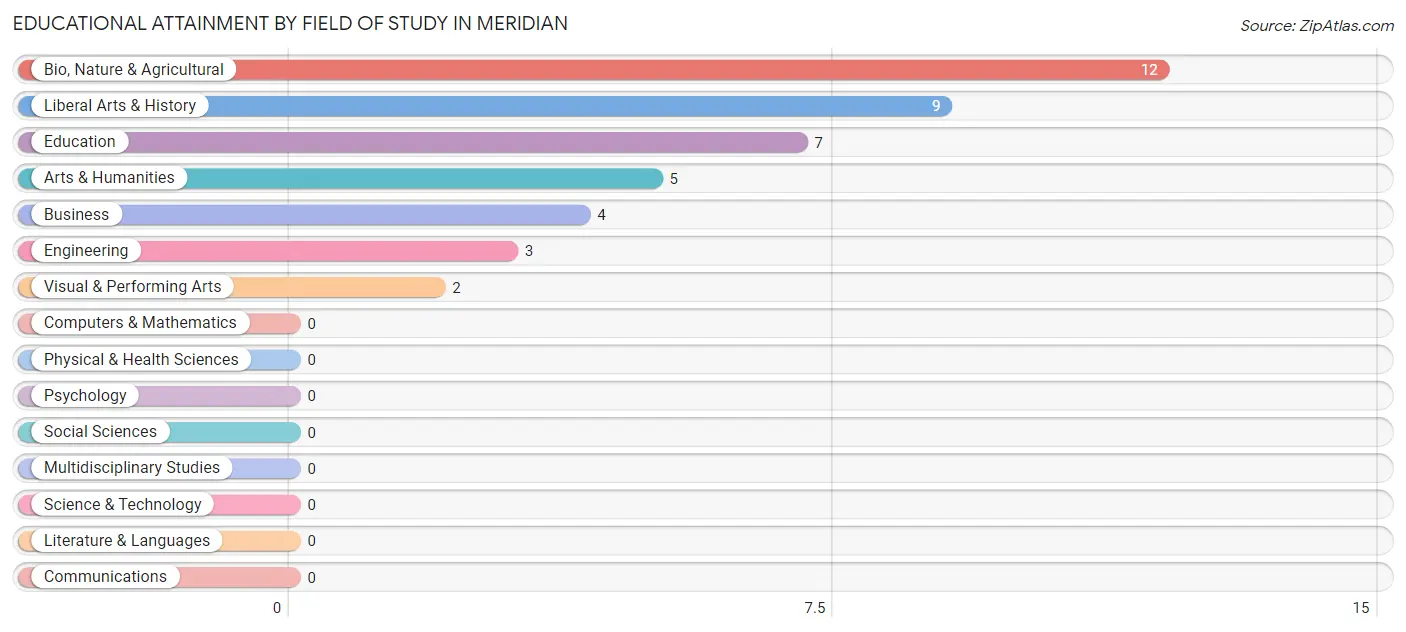
| Field of Study | # Graduates | % Graduates |
| Computers & Mathematics | 0 | 0.0% |
| Bio, Nature & Agricultural | 12 | 28.6% |
| Physical & Health Sciences | 0 | 0.0% |
| Psychology | 0 | 0.0% |
| Social Sciences | 0 | 0.0% |
| Engineering | 3 | 7.1% |
| Multidisciplinary Studies | 0 | 0.0% |
| Science & Technology | 0 | 0.0% |
| Business | 4 | 9.5% |
| Education | 7 | 16.7% |
| Literature & Languages | 0 | 0.0% |
| Liberal Arts & History | 9 | 21.4% |
| Visual & Performing Arts | 2 | 4.8% |
| Communications | 0 | 0.0% |
| Arts & Humanities | 5 | 11.9% |
| Total | 42 | 100.0% |
Transportation & Commute in Meridian
Vehicle Availability by Sex in Meridian
The most prevalent vehicle ownership categories in Meridian are males with 2 vehicles (34, accounting for 47.2%) and females with 2 vehicles (8, making up 87.2%).
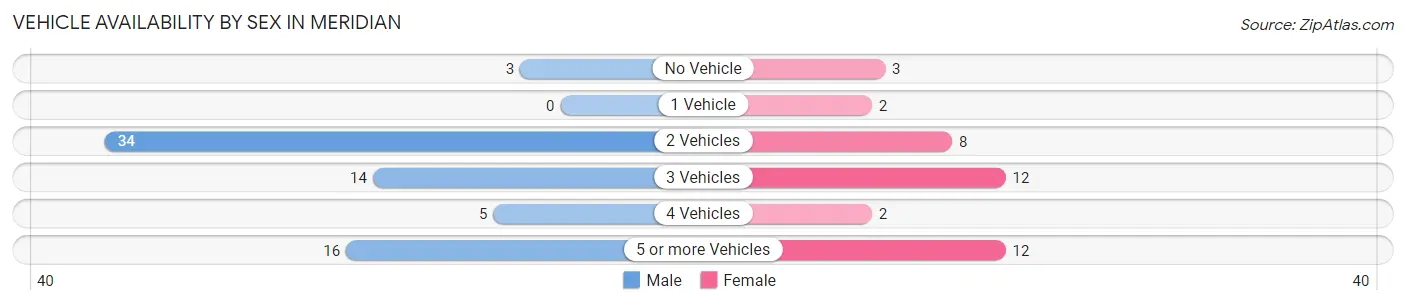
| Vehicles Available | Male | Female |
| No Vehicle | 3 (4.2%) | 3 (7.7%) |
| 1 Vehicle | 0 (0.0%) | 2 (5.1%) |
| 2 Vehicles | 34 (47.2%) | 8 (20.5%) |
| 3 Vehicles | 14 (19.4%) | 12 (30.8%) |
| 4 Vehicles | 5 (6.9%) | 2 (5.1%) |
| 5 or more Vehicles | 16 (22.2%) | 12 (30.8%) |
| Total | 72 (100.0%) | 39 (100.0%) |
Commute Time in Meridian
The most frequently occuring commute durations in Meridian are 15 to 19 minutes (18 commuters, 17.5%), 5 to 9 minutes (17 commuters, 16.5%), and 20 to 24 minutes (16 commuters, 15.5%).
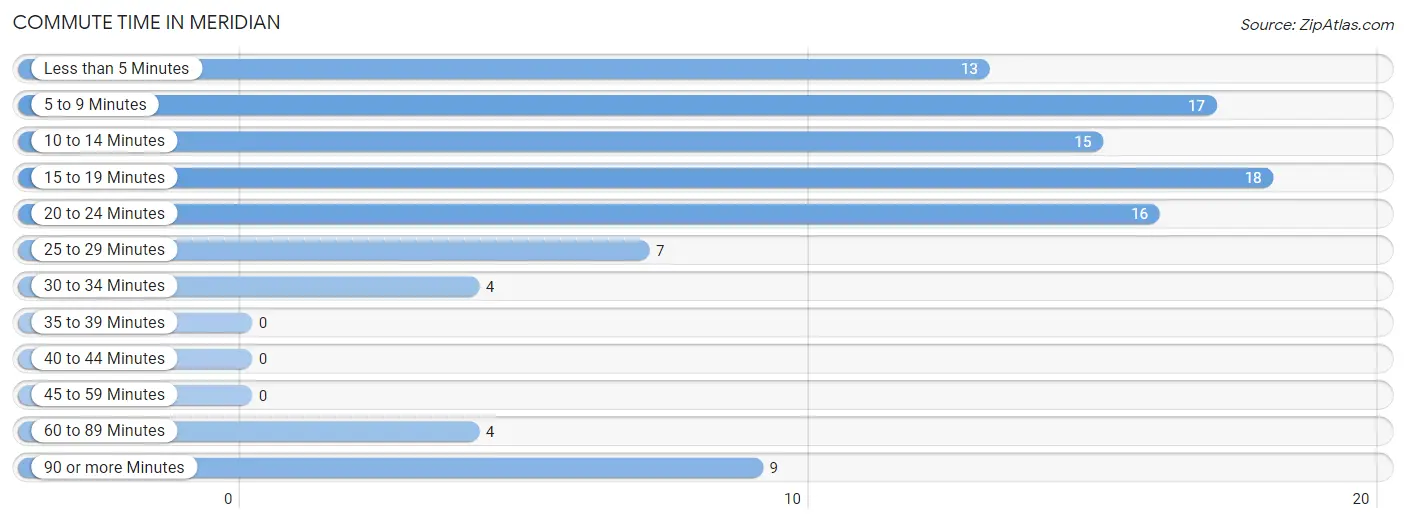
| Commute Time | # Commuters | % Commuters |
| Less than 5 Minutes | 13 | 12.6% |
| 5 to 9 Minutes | 17 | 16.5% |
| 10 to 14 Minutes | 15 | 14.6% |
| 15 to 19 Minutes | 18 | 17.5% |
| 20 to 24 Minutes | 16 | 15.5% |
| 25 to 29 Minutes | 7 | 6.8% |
| 30 to 34 Minutes | 4 | 3.9% |
| 35 to 39 Minutes | 0 | 0.0% |
| 40 to 44 Minutes | 0 | 0.0% |
| 45 to 59 Minutes | 0 | 0.0% |
| 60 to 89 Minutes | 4 | 3.9% |
| 90 or more Minutes | 9 | 8.7% |
Commute Time by Sex in Meridian
The most common commute times in Meridian are 10 to 14 minutes (15 commuters, 22.4%) for males and 15 to 19 minutes (9 commuters, 25.0%) for females.
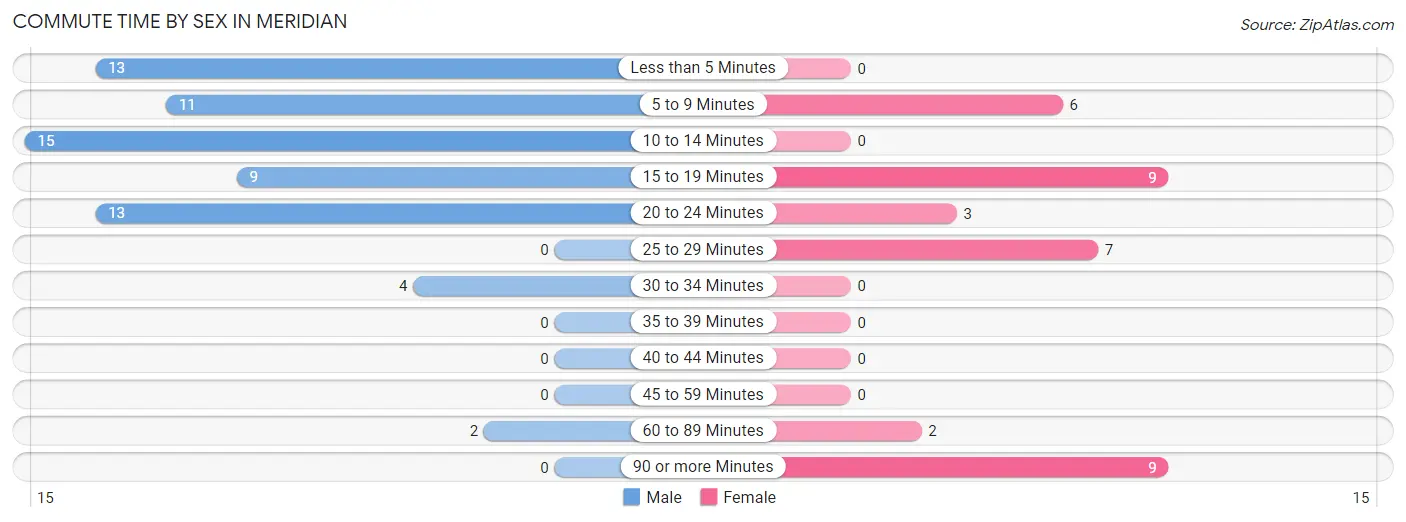
| Commute Time | Male | Female |
| Less than 5 Minutes | 13 (19.4%) | 0 (0.0%) |
| 5 to 9 Minutes | 11 (16.4%) | 6 (16.7%) |
| 10 to 14 Minutes | 15 (22.4%) | 0 (0.0%) |
| 15 to 19 Minutes | 9 (13.4%) | 9 (25.0%) |
| 20 to 24 Minutes | 13 (19.4%) | 3 (8.3%) |
| 25 to 29 Minutes | 0 (0.0%) | 7 (19.4%) |
| 30 to 34 Minutes | 4 (6.0%) | 0 (0.0%) |
| 35 to 39 Minutes | 0 (0.0%) | 0 (0.0%) |
| 40 to 44 Minutes | 0 (0.0%) | 0 (0.0%) |
| 45 to 59 Minutes | 0 (0.0%) | 0 (0.0%) |
| 60 to 89 Minutes | 2 (3.0%) | 2 (5.6%) |
| 90 or more Minutes | 0 (0.0%) | 9 (25.0%) |
Time of Departure to Work by Sex in Meridian
The most frequent times of departure to work in Meridian are 7:30 AM to 7:59 AM (18, 26.9%) for males and 6:30 AM to 6:59 AM (8, 22.2%) for females.
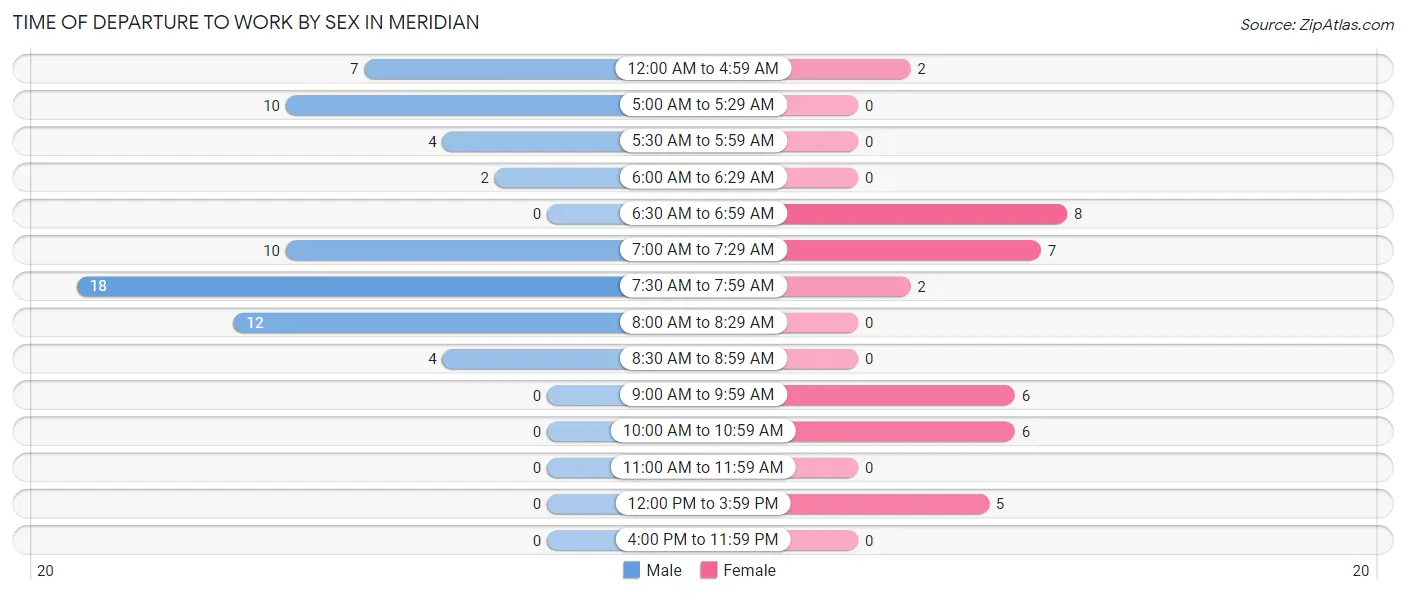
| Time of Departure | Male | Female |
| 12:00 AM to 4:59 AM | 7 (10.4%) | 2 (5.6%) |
| 5:00 AM to 5:29 AM | 10 (14.9%) | 0 (0.0%) |
| 5:30 AM to 5:59 AM | 4 (6.0%) | 0 (0.0%) |
| 6:00 AM to 6:29 AM | 2 (3.0%) | 0 (0.0%) |
| 6:30 AM to 6:59 AM | 0 (0.0%) | 8 (22.2%) |
| 7:00 AM to 7:29 AM | 10 (14.9%) | 7 (19.4%) |
| 7:30 AM to 7:59 AM | 18 (26.9%) | 2 (5.6%) |
| 8:00 AM to 8:29 AM | 12 (17.9%) | 0 (0.0%) |
| 8:30 AM to 8:59 AM | 4 (6.0%) | 0 (0.0%) |
| 9:00 AM to 9:59 AM | 0 (0.0%) | 6 (16.7%) |
| 10:00 AM to 10:59 AM | 0 (0.0%) | 6 (16.7%) |
| 11:00 AM to 11:59 AM | 0 (0.0%) | 0 (0.0%) |
| 12:00 PM to 3:59 PM | 0 (0.0%) | 5 (13.9%) |
| 4:00 PM to 11:59 PM | 0 (0.0%) | 0 (0.0%) |
| Total | 67 (100.0%) | 36 (100.0%) |
Housing Occupancy in Meridian
Occupancy by Ownership in Meridian
Of the total 141 dwellings in Meridian, owner-occupied units account for 76 (53.9%), while renter-occupied units make up 65 (46.1%).
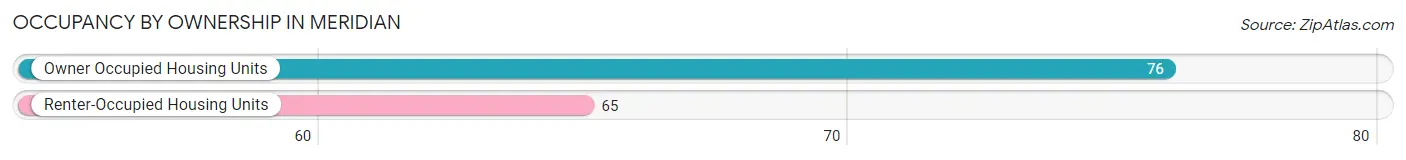
| Occupancy | # Housing Units | % Housing Units |
| Owner Occupied Housing Units | 76 | 53.9% |
| Renter-Occupied Housing Units | 65 | 46.1% |
| Total Occupied Housing Units | 141 | 100.0% |
Occupancy by Household Size in Meridian
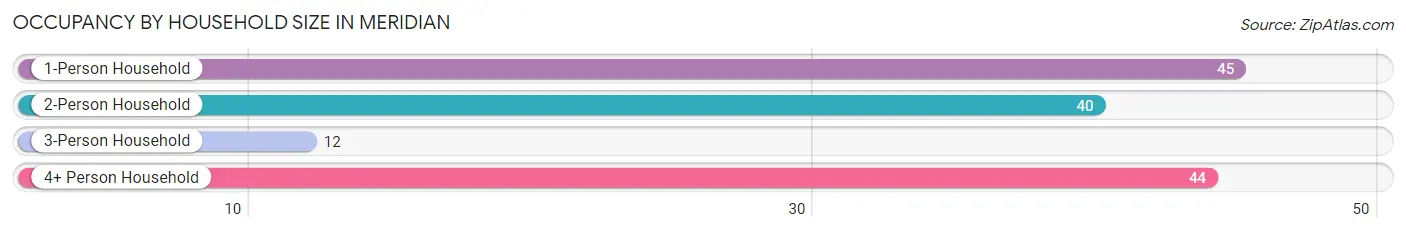
| Household Size | # Housing Units | % Housing Units |
| 1-Person Household | 45 | 31.9% |
| 2-Person Household | 40 | 28.4% |
| 3-Person Household | 12 | 8.5% |
| 4+ Person Household | 44 | 31.2% |
| Total Housing Units | 141 | 100.0% |
Occupancy by Ownership by Household Size in Meridian
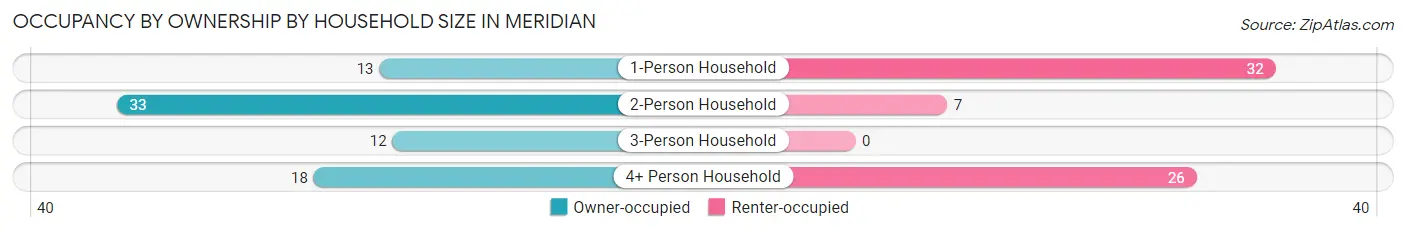
| Household Size | Owner-occupied | Renter-occupied |
| 1-Person Household | 13 (28.9%) | 32 (71.1%) |
| 2-Person Household | 33 (82.5%) | 7 (17.5%) |
| 3-Person Household | 12 (100.0%) | 0 (0.0%) |
| 4+ Person Household | 18 (40.9%) | 26 (59.1%) |
| Total Housing Units | 76 (53.9%) | 65 (46.1%) |
Occupancy by Educational Attainment in Meridian
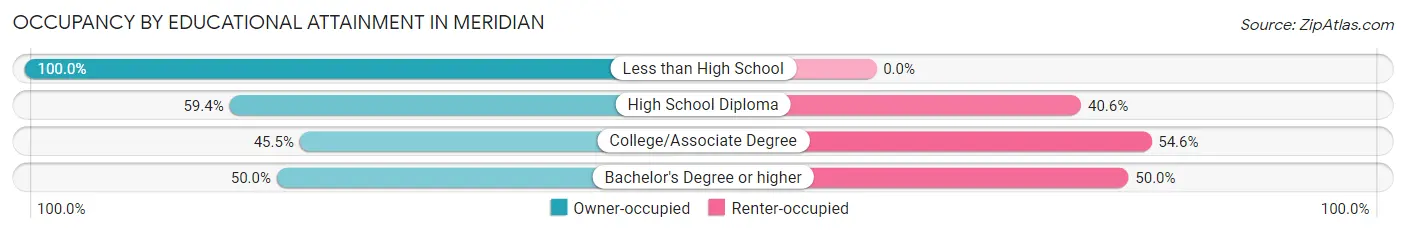
| Household Size | Owner-occupied | Renter-occupied |
| Less than High School | 11 (100.0%) | 0 (0.0%) |
| High School Diploma | 19 (59.4%) | 13 (40.6%) |
| College/Associate Degree | 30 (45.5%) | 36 (54.5%) |
| Bachelor's Degree or higher | 16 (50.0%) | 16 (50.0%) |
Occupancy by Age of Householder in Meridian
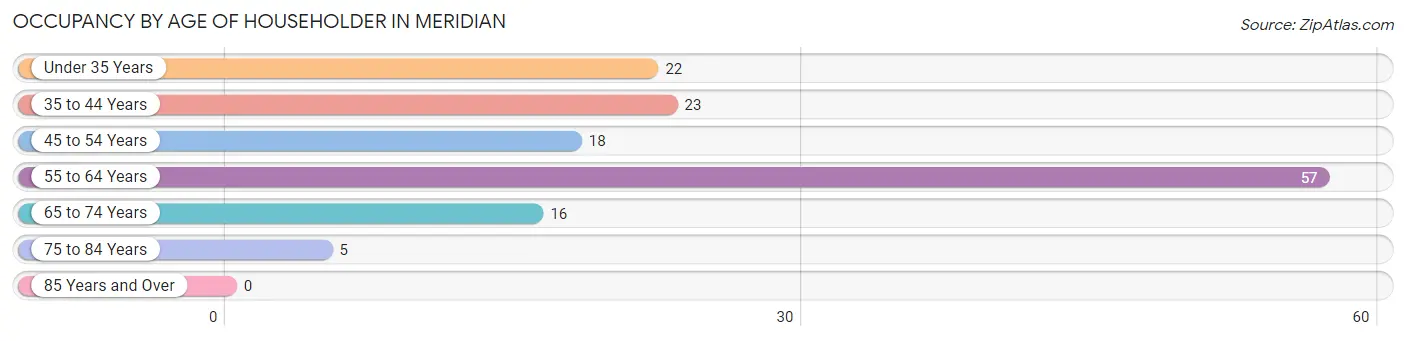
| Age Bracket | # Households | % Households |
| Under 35 Years | 22 | 15.6% |
| 35 to 44 Years | 23 | 16.3% |
| 45 to 54 Years | 18 | 12.8% |
| 55 to 64 Years | 57 | 40.4% |
| 65 to 74 Years | 16 | 11.4% |
| 75 to 84 Years | 5 | 3.5% |
| 85 Years and Over | 0 | 0.0% |
| Total | 141 | 100.0% |
Housing Finances in Meridian
Median Income by Occupancy in Meridian
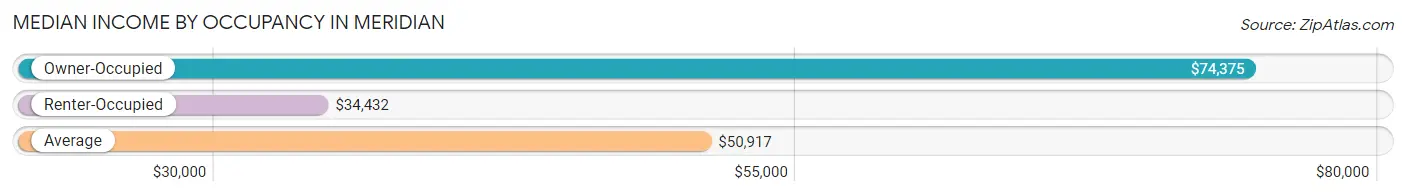
| Occupancy Type | # Households | Median Income |
| Owner-Occupied | 76 (53.9%) | $74,375 |
| Renter-Occupied | 65 (46.1%) | $34,432 |
| Average | 141 (100.0%) | $50,917 |
Occupancy by Householder Income Bracket in Meridian
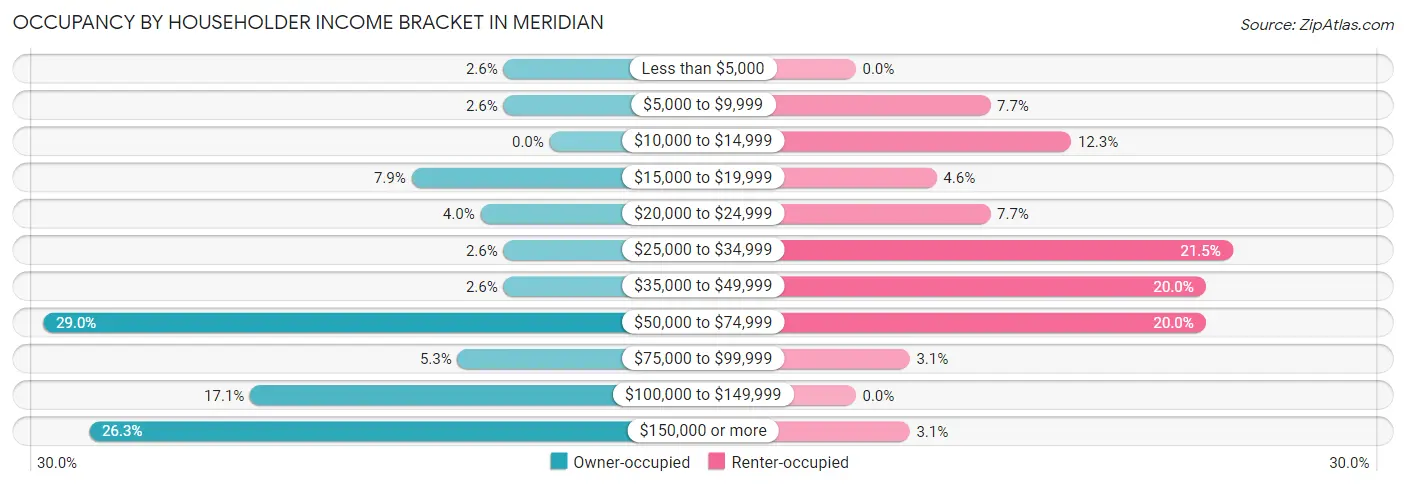
| Income Bracket | Owner-occupied | Renter-occupied |
| Less than $5,000 | 2 (2.6%) | 0 (0.0%) |
| $5,000 to $9,999 | 2 (2.6%) | 5 (7.7%) |
| $10,000 to $14,999 | 0 (0.0%) | 8 (12.3%) |
| $15,000 to $19,999 | 6 (7.9%) | 3 (4.6%) |
| $20,000 to $24,999 | 3 (4.0%) | 5 (7.7%) |
| $25,000 to $34,999 | 2 (2.6%) | 14 (21.5%) |
| $35,000 to $49,999 | 2 (2.6%) | 13 (20.0%) |
| $50,000 to $74,999 | 22 (28.9%) | 13 (20.0%) |
| $75,000 to $99,999 | 4 (5.3%) | 2 (3.1%) |
| $100,000 to $149,999 | 13 (17.1%) | 0 (0.0%) |
| $150,000 or more | 20 (26.3%) | 2 (3.1%) |
| Total | 76 (100.0%) | 65 (100.0%) |
Monthly Housing Cost Tiers in Meridian
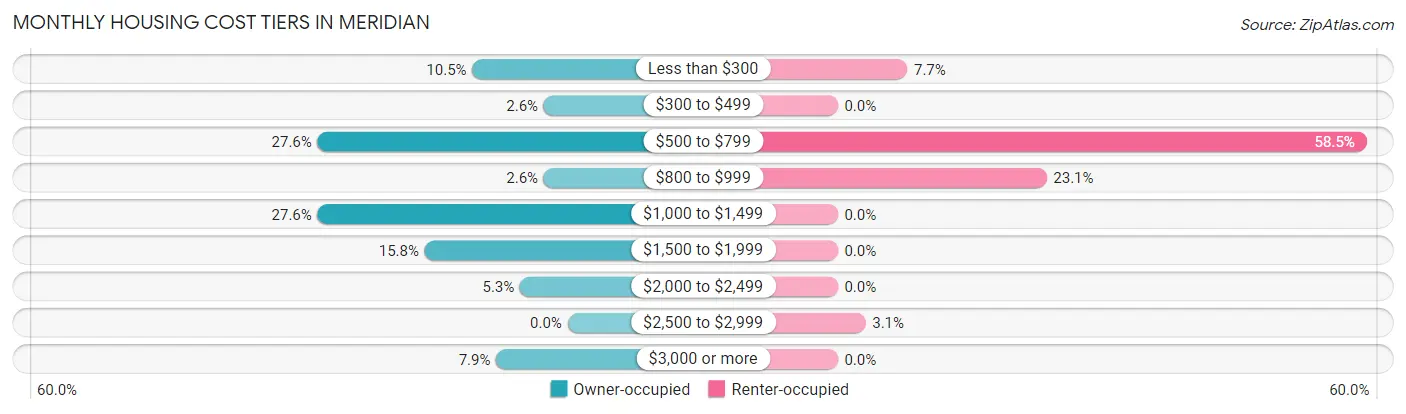
| Monthly Cost | Owner-occupied | Renter-occupied |
| Less than $300 | 8 (10.5%) | 5 (7.7%) |
| $300 to $499 | 2 (2.6%) | 0 (0.0%) |
| $500 to $799 | 21 (27.6%) | 38 (58.5%) |
| $800 to $999 | 2 (2.6%) | 15 (23.1%) |
| $1,000 to $1,499 | 21 (27.6%) | 0 (0.0%) |
| $1,500 to $1,999 | 12 (15.8%) | 0 (0.0%) |
| $2,000 to $2,499 | 4 (5.3%) | 0 (0.0%) |
| $2,500 to $2,999 | 0 (0.0%) | 2 (3.1%) |
| $3,000 or more | 6 (7.9%) | 0 (0.0%) |
| Total | 76 (100.0%) | 65 (100.0%) |
Physical Housing Characteristics in Meridian
Housing Structures in Meridian
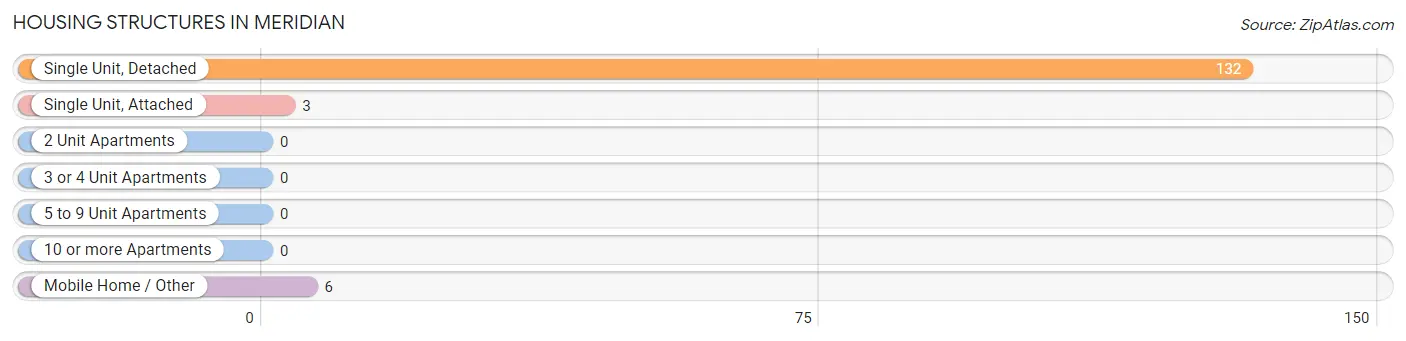
| Structure Type | # Housing Units | % Housing Units |
| Single Unit, Detached | 132 | 93.6% |
| Single Unit, Attached | 3 | 2.1% |
| 2 Unit Apartments | 0 | 0.0% |
| 3 or 4 Unit Apartments | 0 | 0.0% |
| 5 to 9 Unit Apartments | 0 | 0.0% |
| 10 or more Apartments | 0 | 0.0% |
| Mobile Home / Other | 6 | 4.3% |
| Total | 141 | 100.0% |
Housing Structures by Occupancy in Meridian
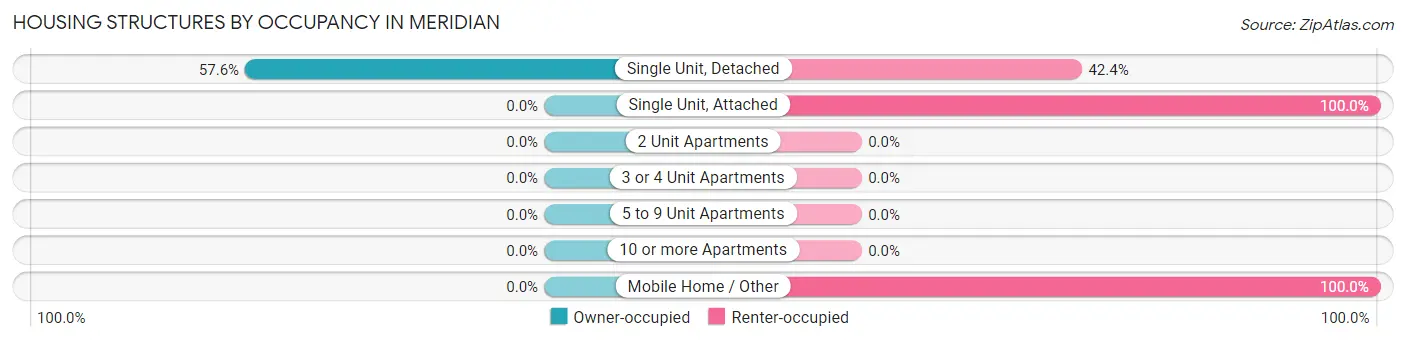
| Structure Type | Owner-occupied | Renter-occupied |
| Single Unit, Detached | 76 (57.6%) | 56 (42.4%) |
| Single Unit, Attached | 0 (0.0%) | 3 (100.0%) |
| 2 Unit Apartments | 0 (0.0%) | 0 (0.0%) |
| 3 or 4 Unit Apartments | 0 (0.0%) | 0 (0.0%) |
| 5 to 9 Unit Apartments | 0 (0.0%) | 0 (0.0%) |
| 10 or more Apartments | 0 (0.0%) | 0 (0.0%) |
| Mobile Home / Other | 0 (0.0%) | 6 (100.0%) |
| Total | 76 (53.9%) | 65 (46.1%) |
Housing Structures by Number of Rooms in Meridian
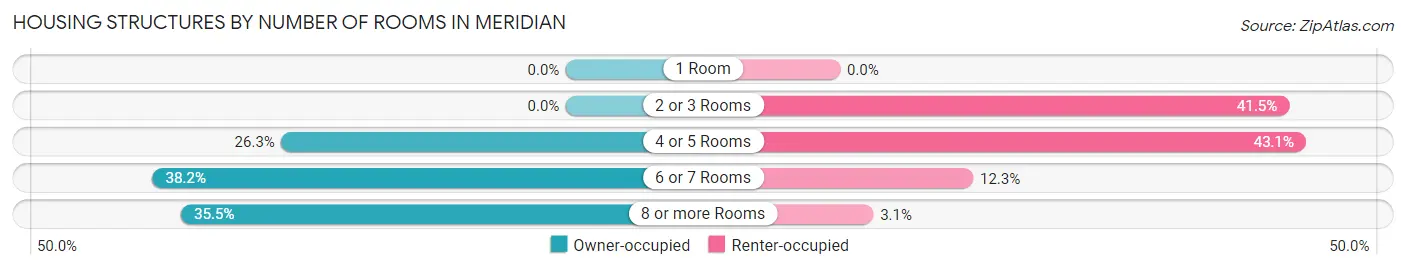
| Number of Rooms | Owner-occupied | Renter-occupied |
| 1 Room | 0 (0.0%) | 0 (0.0%) |
| 2 or 3 Rooms | 0 (0.0%) | 27 (41.5%) |
| 4 or 5 Rooms | 20 (26.3%) | 28 (43.1%) |
| 6 or 7 Rooms | 29 (38.2%) | 8 (12.3%) |
| 8 or more Rooms | 27 (35.5%) | 2 (3.1%) |
| Total | 76 (100.0%) | 65 (100.0%) |
Housing Structure by Heating Type in Meridian
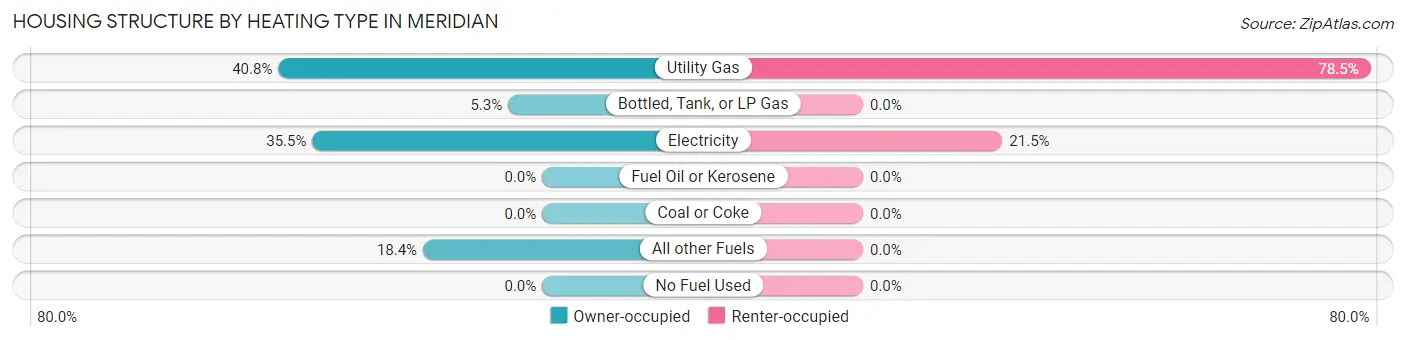
| Heating Type | Owner-occupied | Renter-occupied |
| Utility Gas | 31 (40.8%) | 51 (78.5%) |
| Bottled, Tank, or LP Gas | 4 (5.3%) | 0 (0.0%) |
| Electricity | 27 (35.5%) | 14 (21.5%) |
| Fuel Oil or Kerosene | 0 (0.0%) | 0 (0.0%) |
| Coal or Coke | 0 (0.0%) | 0 (0.0%) |
| All other Fuels | 14 (18.4%) | 0 (0.0%) |
| No Fuel Used | 0 (0.0%) | 0 (0.0%) |
| Total | 76 (100.0%) | 65 (100.0%) |
Household Vehicle Usage in Meridian
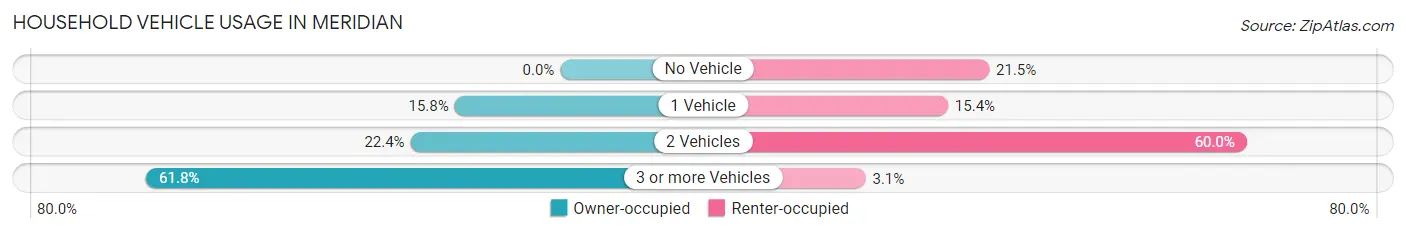
| Vehicles per Household | Owner-occupied | Renter-occupied |
| No Vehicle | 0 (0.0%) | 14 (21.5%) |
| 1 Vehicle | 12 (15.8%) | 10 (15.4%) |
| 2 Vehicles | 17 (22.4%) | 39 (60.0%) |
| 3 or more Vehicles | 47 (61.8%) | 2 (3.1%) |
| Total | 76 (100.0%) | 65 (100.0%) |
Real Estate & Mortgages in Meridian
Real Estate and Mortgage Overview in Meridian
| Characteristic | Without Mortgage | With Mortgage |
| Housing Units | 31 | 45 |
| Median Property Value | $213,900 | $283,800 |
| Median Household Income | $50,568 | $20 |
| Monthly Housing Costs | $537 | $6 |
| Real Estate Taxes | - | - |
Property Value by Mortgage Status in Meridian
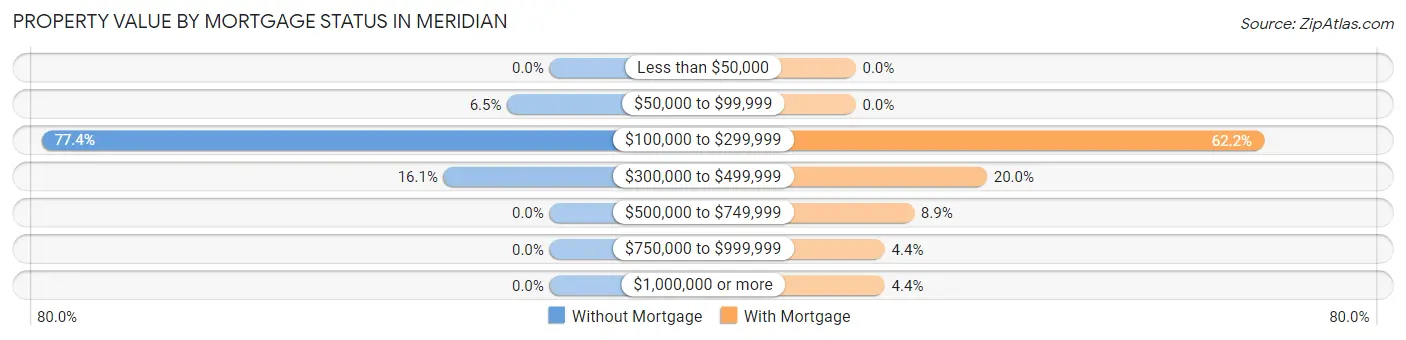
| Property Value | Without Mortgage | With Mortgage |
| Less than $50,000 | 0 (0.0%) | 0 (0.0%) |
| $50,000 to $99,999 | 2 (6.5%) | 0 (0.0%) |
| $100,000 to $299,999 | 24 (77.4%) | 28 (62.2%) |
| $300,000 to $499,999 | 5 (16.1%) | 9 (20.0%) |
| $500,000 to $749,999 | 0 (0.0%) | 4 (8.9%) |
| $750,000 to $999,999 | 0 (0.0%) | 2 (4.4%) |
| $1,000,000 or more | 0 (0.0%) | 2 (4.4%) |
| Total | 31 (100.0%) | 45 (100.0%) |
Household Income by Mortgage Status in Meridian
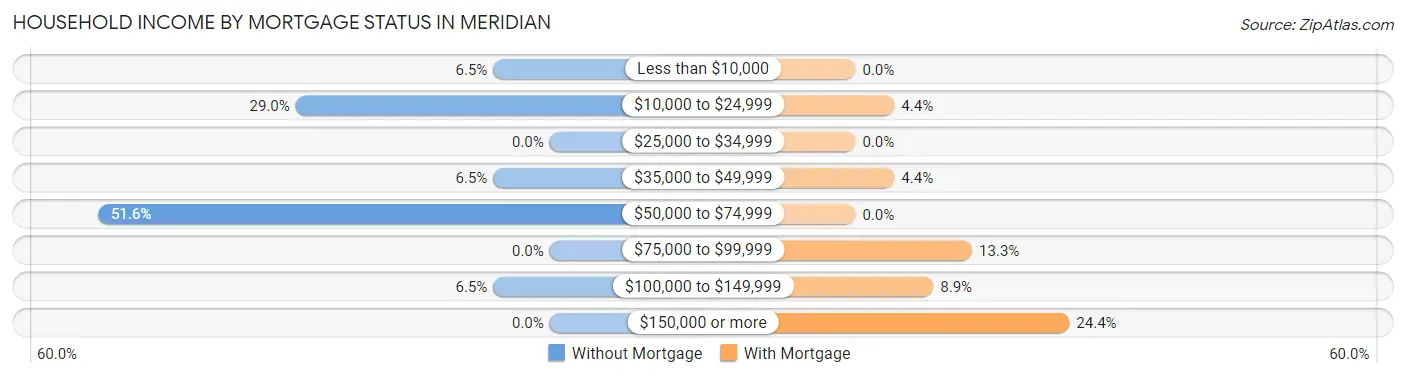
| Household Income | Without Mortgage | With Mortgage |
| Less than $10,000 | 2 (6.5%) | 0 (0.0%) |
| $10,000 to $24,999 | 9 (29.0%) | 2 (4.4%) |
| $25,000 to $34,999 | 0 (0.0%) | 0 (0.0%) |
| $35,000 to $49,999 | 2 (6.5%) | 2 (4.4%) |
| $50,000 to $74,999 | 16 (51.6%) | 0 (0.0%) |
| $75,000 to $99,999 | 0 (0.0%) | 6 (13.3%) |
| $100,000 to $149,999 | 2 (6.5%) | 4 (8.9%) |
| $150,000 or more | 0 (0.0%) | 11 (24.4%) |
| Total | 31 (100.0%) | 45 (100.0%) |
Property Value to Household Income Ratio in Meridian
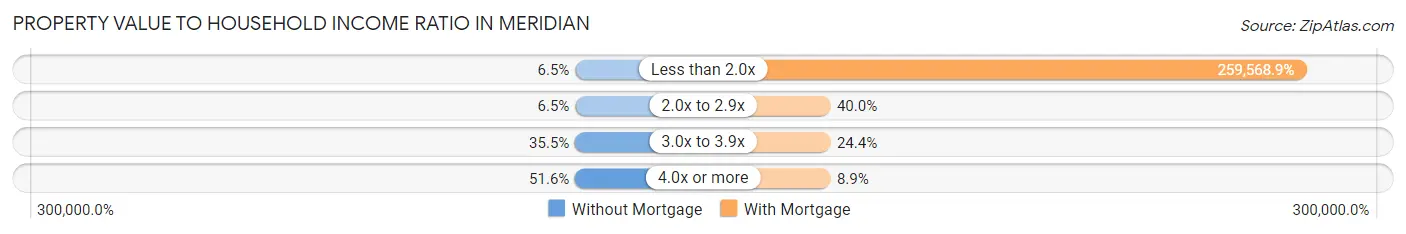
| Value-to-Income Ratio | Without Mortgage | With Mortgage |
| Less than 2.0x | 2 (6.5%) | 116,806 (259,568.9%) |
| 2.0x to 2.9x | 2 (6.5%) | 18 (40.0%) |
| 3.0x to 3.9x | 11 (35.5%) | 11 (24.4%) |
| 4.0x or more | 16 (51.6%) | 4 (8.9%) |
| Total | 31 (100.0%) | 45 (100.0%) |
Real Estate Taxes by Mortgage Status in Meridian
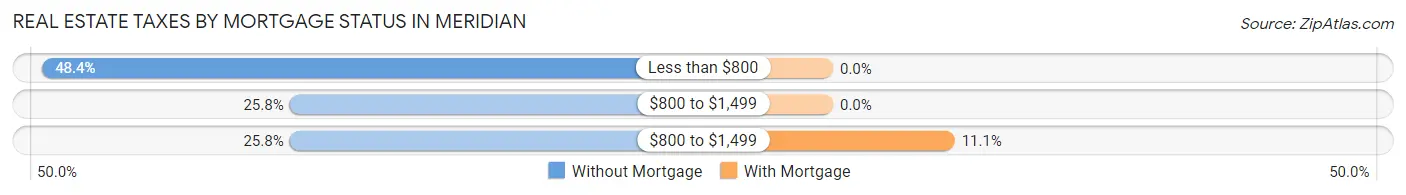
| Property Taxes | Without Mortgage | With Mortgage |
| Less than $800 | 15 (48.4%) | 0 (0.0%) |
| $800 to $1,499 | 8 (25.8%) | 0 (0.0%) |
| $800 to $1,499 | 8 (25.8%) | 5 (11.1%) |
| Total | 31 (100.0%) | 45 (100.0%) |
Health & Disability in Meridian
Health Insurance Coverage by Age in Meridian
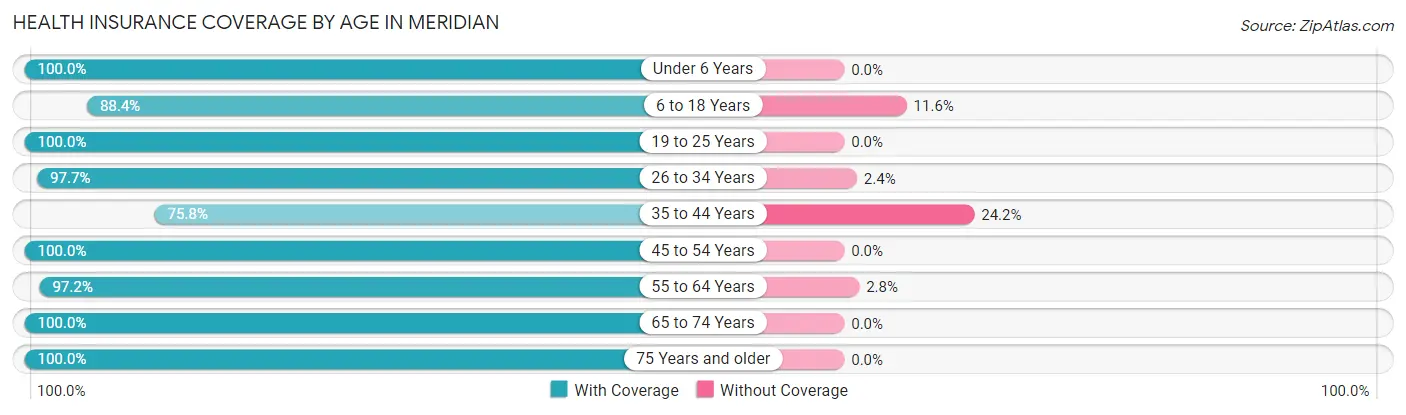
| Age Bracket | With Coverage | Without Coverage |
| Under 6 Years | 52 (100.0%) | 0 (0.0%) |
| 6 to 18 Years | 38 (88.4%) | 5 (11.6%) |
| 19 to 25 Years | 24 (100.0%) | 0 (0.0%) |
| 26 to 34 Years | 83 (97.7%) | 2 (2.4%) |
| 35 to 44 Years | 25 (75.8%) | 8 (24.2%) |
| 45 to 54 Years | 30 (100.0%) | 0 (0.0%) |
| 55 to 64 Years | 70 (97.2%) | 2 (2.8%) |
| 65 to 74 Years | 26 (100.0%) | 0 (0.0%) |
| 75 Years and older | 11 (100.0%) | 0 (0.0%) |
| Total | 359 (95.5%) | 17 (4.5%) |
Health Insurance Coverage by Citizenship Status in Meridian
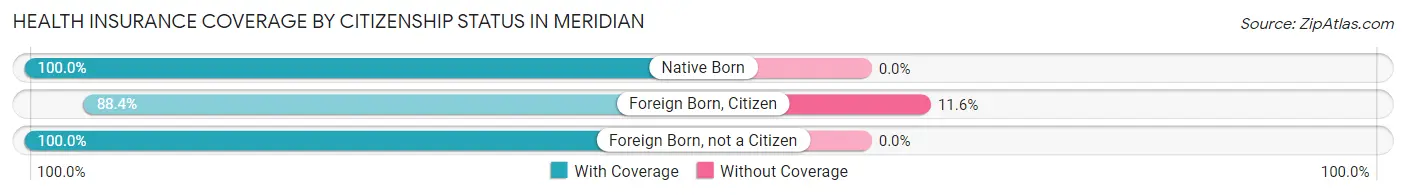
| Citizenship Status | With Coverage | Without Coverage |
| Native Born | 52 (100.0%) | 0 (0.0%) |
| Foreign Born, Citizen | 38 (88.4%) | 5 (11.6%) |
| Foreign Born, not a Citizen | 24 (100.0%) | 0 (0.0%) |
Health Insurance Coverage by Household Income in Meridian
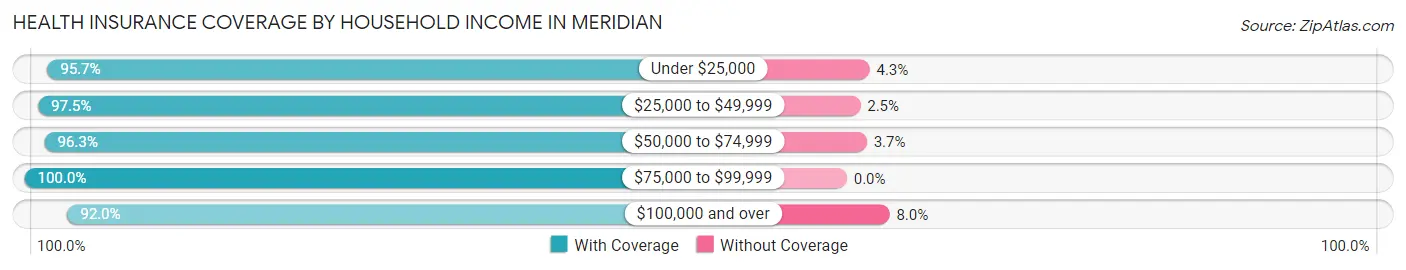
| Household Income | With Coverage | Without Coverage |
| Under $25,000 | 45 (95.7%) | 2 (4.3%) |
| $25,000 to $49,999 | 77 (97.5%) | 2 (2.5%) |
| $50,000 to $74,999 | 129 (96.3%) | 5 (3.7%) |
| $75,000 to $99,999 | 16 (100.0%) | 0 (0.0%) |
| $100,000 and over | 92 (92.0%) | 8 (8.0%) |
Public vs Private Health Insurance Coverage by Age in Meridian
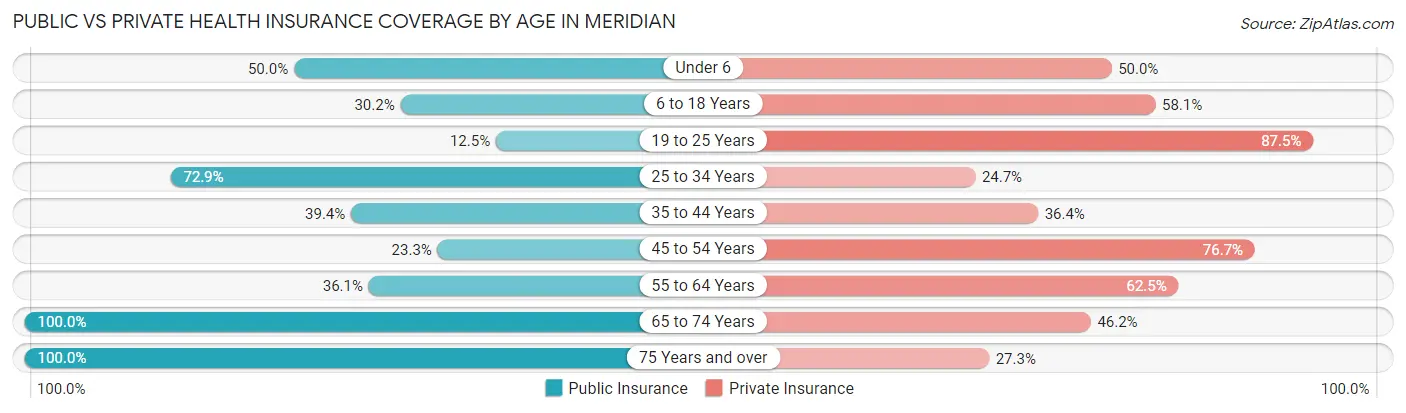
| Age Bracket | Public Insurance | Private Insurance |
| Under 6 | 26 (50.0%) | 26 (50.0%) |
| 6 to 18 Years | 13 (30.2%) | 25 (58.1%) |
| 19 to 25 Years | 3 (12.5%) | 21 (87.5%) |
| 25 to 34 Years | 62 (72.9%) | 21 (24.7%) |
| 35 to 44 Years | 13 (39.4%) | 12 (36.4%) |
| 45 to 54 Years | 7 (23.3%) | 23 (76.7%) |
| 55 to 64 Years | 26 (36.1%) | 45 (62.5%) |
| 65 to 74 Years | 26 (100.0%) | 12 (46.2%) |
| 75 Years and over | 11 (100.0%) | 3 (27.3%) |
| Total | 187 (49.7%) | 188 (50.0%) |
Disability Status by Sex by Age in Meridian
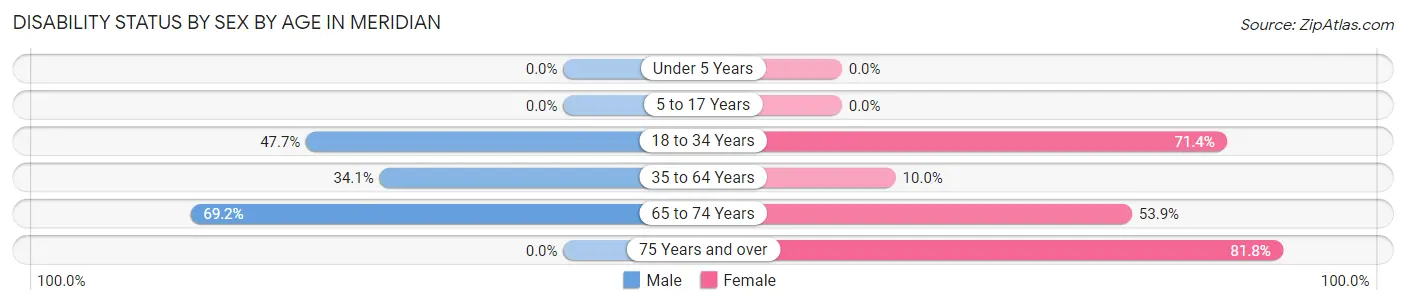
| Age Bracket | Male | Female |
| Under 5 Years | 0 (0.0%) | 0 (0.0%) |
| 5 to 17 Years | 0 (0.0%) | 0 (0.0%) |
| 18 to 34 Years | 42 (47.7%) | 15 (71.4%) |
| 35 to 64 Years | 29 (34.1%) | 5 (10.0%) |
| 65 to 74 Years | 9 (69.2%) | 7 (53.8%) |
| 75 Years and over | 0 (0.0%) | 9 (81.8%) |
Disability Class by Sex by Age in Meridian
Disability Class: Hearing Difficulty
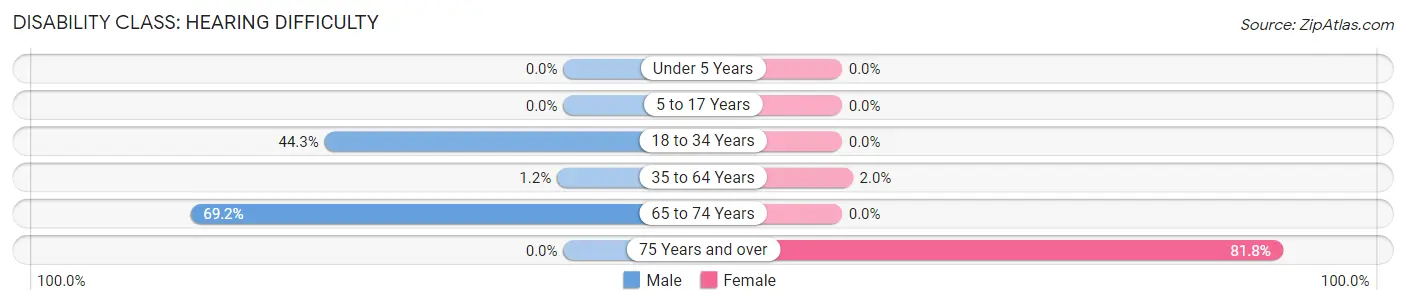
| Age Bracket | Male | Female |
| Under 5 Years | 0 (0.0%) | 0 (0.0%) |
| 5 to 17 Years | 0 (0.0%) | 0 (0.0%) |
| 18 to 34 Years | 39 (44.3%) | 0 (0.0%) |
| 35 to 64 Years | 1 (1.2%) | 1 (2.0%) |
| 65 to 74 Years | 9 (69.2%) | 0 (0.0%) |
| 75 Years and over | 0 (0.0%) | 9 (81.8%) |
Disability Class: Vision Difficulty
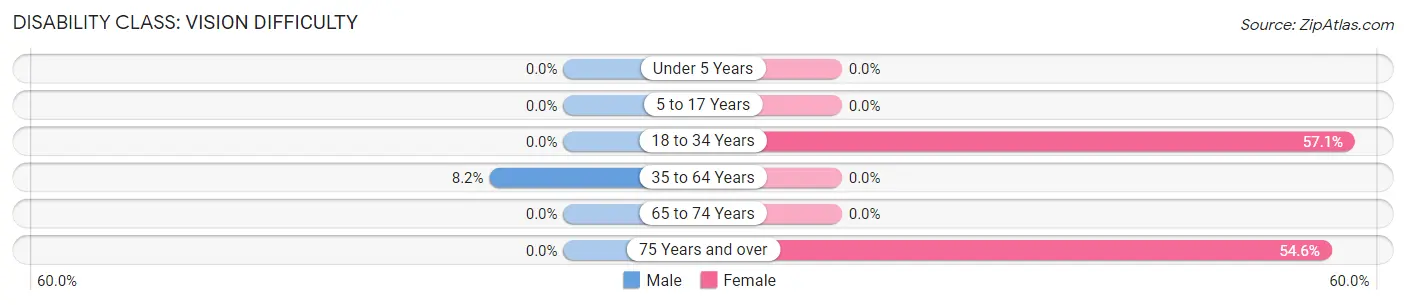
| Age Bracket | Male | Female |
| Under 5 Years | 0 (0.0%) | 0 (0.0%) |
| 5 to 17 Years | 0 (0.0%) | 0 (0.0%) |
| 18 to 34 Years | 0 (0.0%) | 12 (57.1%) |
| 35 to 64 Years | 7 (8.2%) | 0 (0.0%) |
| 65 to 74 Years | 0 (0.0%) | 0 (0.0%) |
| 75 Years and over | 0 (0.0%) | 6 (54.5%) |
Disability Class: Cognitive Difficulty
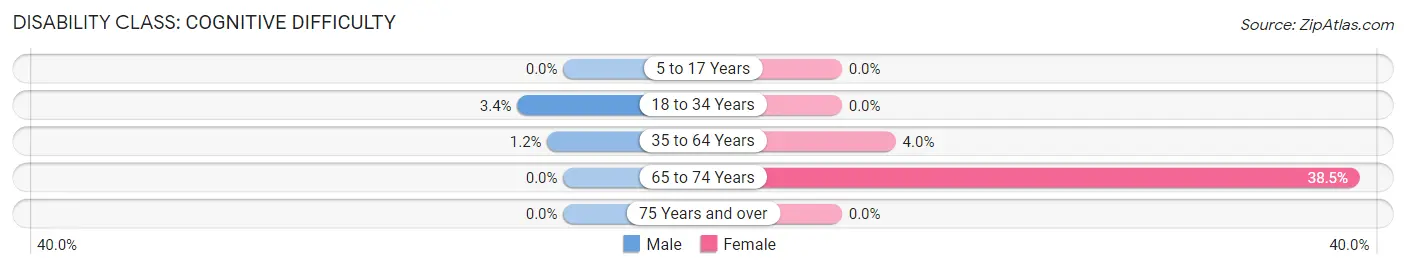
| Age Bracket | Male | Female |
| 5 to 17 Years | 0 (0.0%) | 0 (0.0%) |
| 18 to 34 Years | 3 (3.4%) | 0 (0.0%) |
| 35 to 64 Years | 1 (1.2%) | 2 (4.0%) |
| 65 to 74 Years | 0 (0.0%) | 5 (38.5%) |
| 75 Years and over | 0 (0.0%) | 0 (0.0%) |
Disability Class: Ambulatory Difficulty
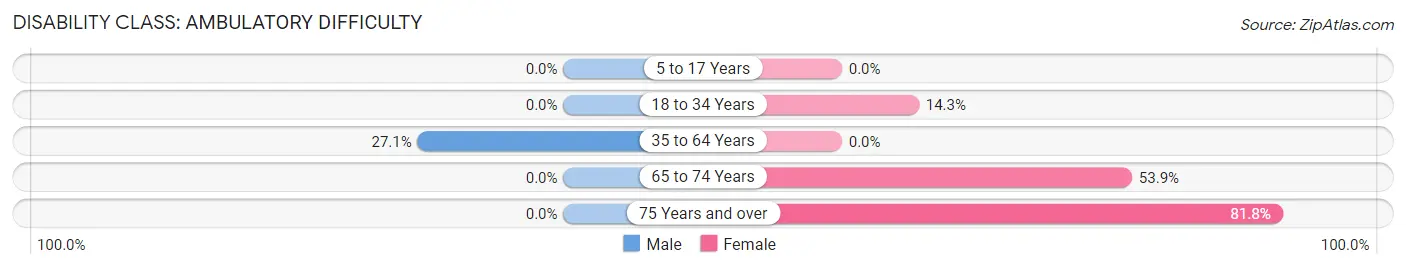
| Age Bracket | Male | Female |
| 5 to 17 Years | 0 (0.0%) | 0 (0.0%) |
| 18 to 34 Years | 0 (0.0%) | 3 (14.3%) |
| 35 to 64 Years | 23 (27.1%) | 0 (0.0%) |
| 65 to 74 Years | 0 (0.0%) | 7 (53.8%) |
| 75 Years and over | 0 (0.0%) | 9 (81.8%) |
Disability Class: Self-Care Difficulty
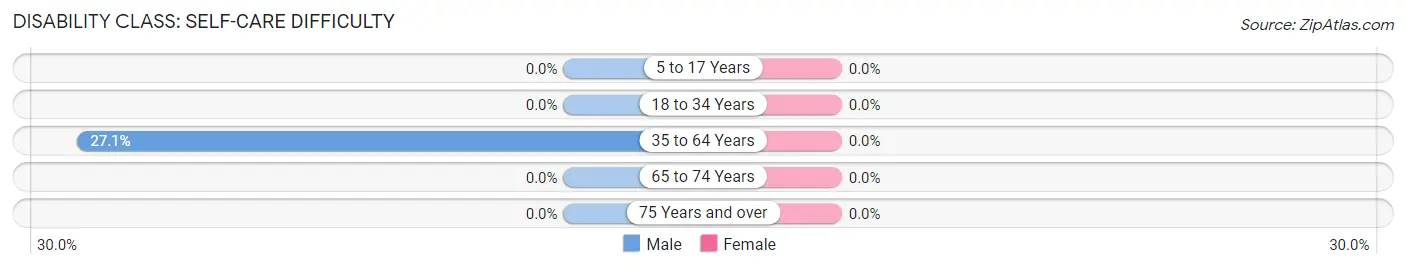
| Age Bracket | Male | Female |
| 5 to 17 Years | 0 (0.0%) | 0 (0.0%) |
| 18 to 34 Years | 0 (0.0%) | 0 (0.0%) |
| 35 to 64 Years | 23 (27.1%) | 0 (0.0%) |
| 65 to 74 Years | 0 (0.0%) | 0 (0.0%) |
| 75 Years and over | 0 (0.0%) | 0 (0.0%) |
Technology Access in Meridian
Computing Device Access in Meridian
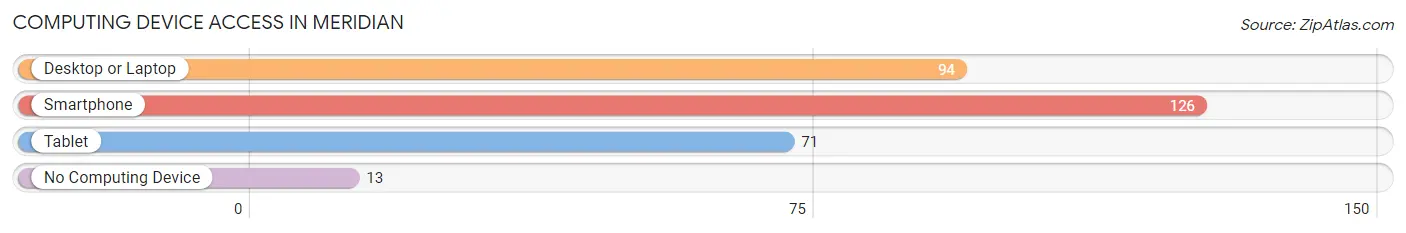
| Device Type | # Households | % Households |
| Desktop or Laptop | 94 | 66.7% |
| Smartphone | 126 | 89.4% |
| Tablet | 71 | 50.3% |
| No Computing Device | 13 | 9.2% |
| Total | 141 | 100.0% |
Internet Access in Meridian
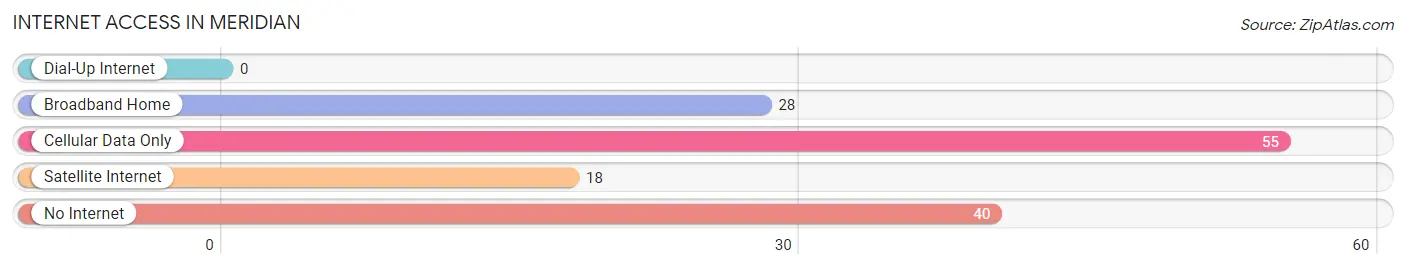
| Internet Type | # Households | % Households |
| Dial-Up Internet | 0 | 0.0% |
| Broadband Home | 28 | 19.9% |
| Cellular Data Only | 55 | 39.0% |
| Satellite Internet | 18 | 12.8% |
| No Internet | 40 | 28.4% |
| Total | 141 | 100.0% |
Meridian Summary
Meridian, California is a small unincorporated community located in the San Joaquin Valley in Fresno County, California. It is situated about 10 miles south of the city of Fresno and is part of the Fresno-Madera Metropolitan Statistical Area. The population of Meridian was estimated to be 1,845 in 2019.
History
Meridian was founded in 1872 by a group of settlers from the Midwest. The town was named after the nearby Meridian School, which was established in 1871. The school was named after the meridian line that ran through the area. The town was originally a farming community, and the main crops grown were wheat, barley, and alfalfa.
In the early 1900s, the town began to grow and develop. The first post office was established in 1906, and the first telephone service was established in 1909. The town also had a general store, a blacksmith shop, and a hotel.
In the 1920s, the town began to experience a population boom. This was due to the construction of the Southern Pacific Railroad, which ran through the town. The railroad brought in new businesses and jobs, and the population of Meridian grew to over 1,000 by the 1930s.
In the 1950s, the town experienced a decline in population as many of the residents moved away to larger cities. However, the town has since experienced a resurgence in population and is now home to a diverse population of people from all over the world.
Geography
Meridian is located in the San Joaquin Valley in Fresno County, California. It is situated about 10 miles south of the city of Fresno and is part of the Fresno-Madera Metropolitan Statistical Area. The town is located at an elevation of about 200 feet above sea level.
The climate in Meridian is hot and dry in the summer and mild in the winter. The average high temperature in the summer is around 95 degrees Fahrenheit, and the average low temperature in the winter is around 40 degrees Fahrenheit.
Economy
The economy of Meridian is largely based on agriculture. The main crops grown in the area are wheat, barley, and alfalfa. Other crops grown in the area include corn, cotton, and tomatoes.
The town also has a few small businesses, including a general store, a gas station, and a few restaurants.
Demographics
The population of Meridian was estimated to be 1,845 in 2019. The racial makeup of the town is predominantly Hispanic or Latino, with about 75% of the population identifying as such. The remaining population is made up of White, African American, Asian, and Native American individuals.
The median household income in Meridian is $45,000, and the median home value is $150,000. The town has a poverty rate of about 20%, which is higher than the national average.
Conclusion
Meridian, California is a small unincorporated community located in the San Joaquin Valley in Fresno County, California. It is situated about 10 miles south of the city of Fresno and is part of the Fresno-Madera Metropolitan Statistical Area. The population of Meridian was estimated to be 1,845 in 2019. The town has a diverse population and is largely based on agriculture. The median household income in Meridian is $45,000, and the median home value is $150,000. The town has a poverty rate of about 20%, which is higher than the national average.
Common Questions
What is Per Capita Income in Meridian?
Per Capita income in Meridian is $28,268.
What is the Median Family Income in Meridian?
Median Family Income in Meridian is $58,056.
What is the Median Household income in Meridian?
Median Household Income in Meridian is $50,917.
What is Inequality or Gini Index in Meridian?
Inequality or Gini Index in Meridian is 0.50.
What is the Total Population of Meridian?
Total Population of Meridian is 376.
What is the Total Male Population of Meridian?
Total Male Population of Meridian is 231.
What is the Total Female Population of Meridian?
Total Female Population of Meridian is 145.
What is the Ratio of Males per 100 Females in Meridian?
There are 159.31 Males per 100 Females in Meridian.
What is the Ratio of Females per 100 Males in Meridian?
There are 62.77 Females per 100 Males in Meridian.
What is the Median Population Age in Meridian?
Median Population Age in Meridian is 31.1 Years.
What is the Average Family Size in Meridian
Average Family Size in Meridian is 3.4 People.
What is the Average Household Size in Meridian
Average Household Size in Meridian is 2.7 People.
How Large is the Labor Force in Meridian?
There are 141 People in the Labor Forcein in Meridian.
What is the Percentage of People in the Labor Force in Meridian?
49.3% of People are in the Labor Force in Meridian.
What is the Unemployment Rate in Meridian?
Unemployment Rate in Meridian is 7.8%.