Olancha, CA Map & Demographics
Olancha Map
Olancha Overview
$47,638
PER CAPITA INCOME
12.4%
WAGE / INCOME GAP [ % ]
87.6¢/ $1
WAGE / INCOME GAP [ $ ]
0.39
INEQUALITY / GINI INDEX
171
TOTAL POPULATION
95
MALE POPULATION
76
FEMALE POPULATION
125.00
MALES / 100 FEMALES
80.00
FEMALES / 100 MALES
60.5
MEDIAN AGE
2.7
AVG FAMILY SIZE
2.5
AVG HOUSEHOLD SIZE
86
LABOR FORCE [ PEOPLE ]
50.3%
PERCENT IN LABOR FORCE
Olancha Zip Codes
Olancha Area Codes
Income in Olancha
Income Overview in Olancha
| Characteristic | Number | Measure |
| Per Capita Income | 171 | $47,638 |
| Median Family Income | 60 | $0 |
| Mean Family Income | 60 | $96,755 |
| Median Household Income | 69 | $0 |
| Mean Household Income | 69 | $88,804 |
| Income Deficit | 60 | $0 |
| Wage / Income Gap (%) | 171 | 12.38% |
| Wage / Income Gap ($) | 171 | 87.62¢ per $1 |
| Gini / Inequality Index | 171 | 0.39 |
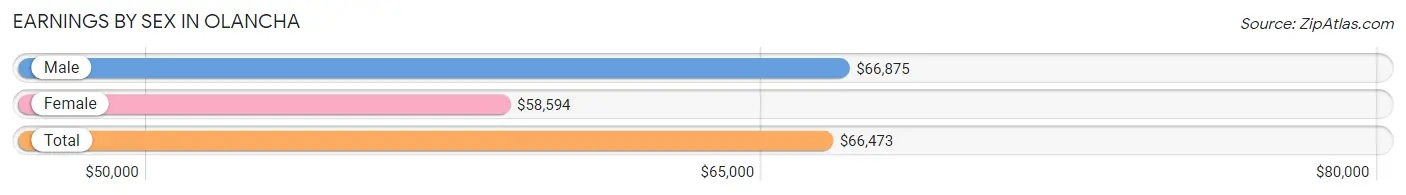
Earnings by Sex in Olancha
Average Earnings in Olancha are $66,473, $66,875 for men and $58,594 for women, a difference of 12.4%.
| Sex | Number | Average Earnings |
| Male | 60 (63.2%) | $66,875 |
| Female | 35 (36.8%) | $58,594 |
| Total | 95 (100.0%) | $66,473 |
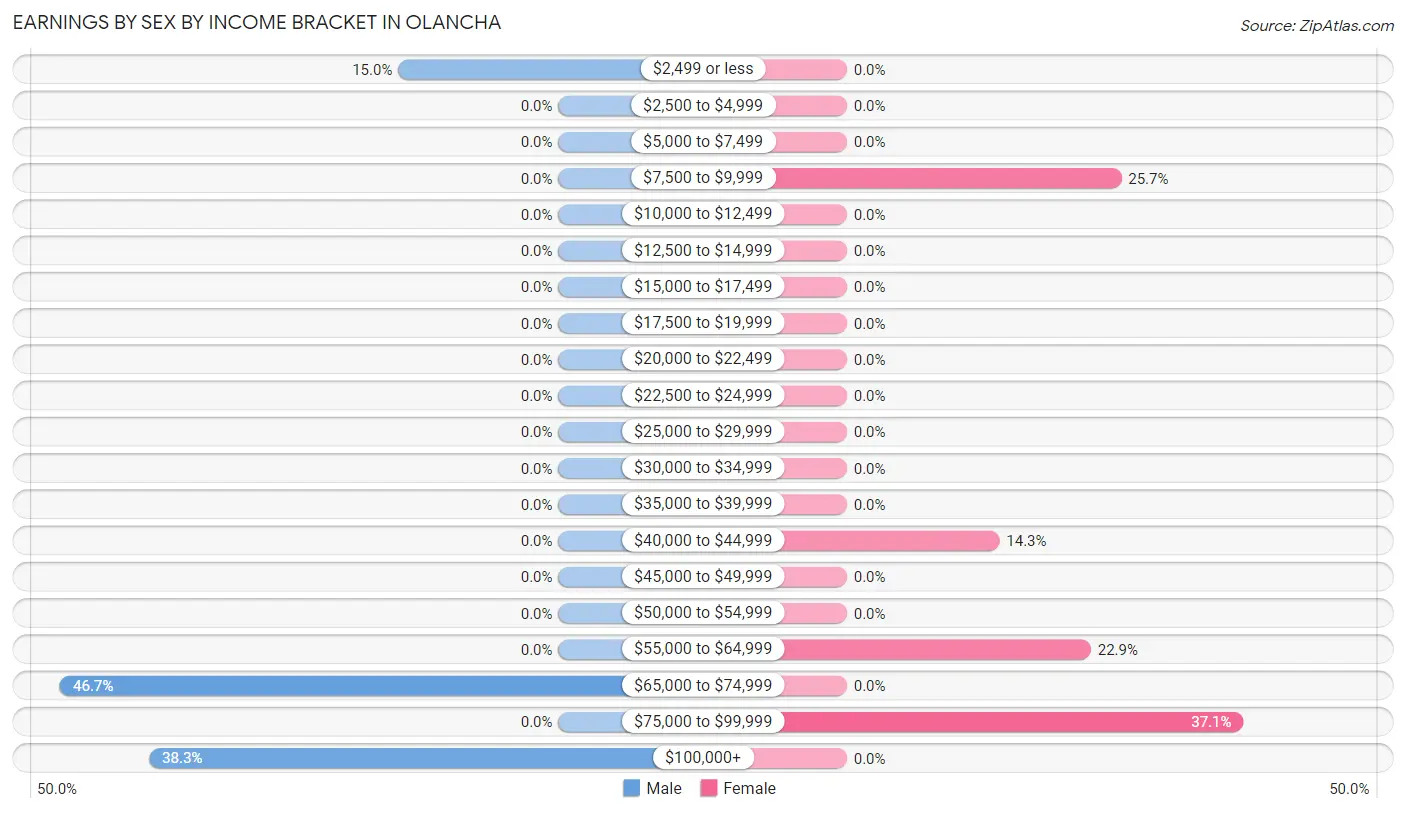
Earnings by Sex by Income Bracket in Olancha
The most common earnings brackets in Olancha are $65,000 to $74,999 for men (28 | 46.7%) and $75,000 to $99,999 for women (13 | 37.1%).
| Income | Male | Female |
| $2,499 or less | 9 (15.0%) | 0 (0.0%) |
| $2,500 to $4,999 | 0 (0.0%) | 0 (0.0%) |
| $5,000 to $7,499 | 0 (0.0%) | 0 (0.0%) |
| $7,500 to $9,999 | 0 (0.0%) | 9 (25.7%) |
| $10,000 to $12,499 | 0 (0.0%) | 0 (0.0%) |
| $12,500 to $14,999 | 0 (0.0%) | 0 (0.0%) |
| $15,000 to $17,499 | 0 (0.0%) | 0 (0.0%) |
| $17,500 to $19,999 | 0 (0.0%) | 0 (0.0%) |
| $20,000 to $22,499 | 0 (0.0%) | 0 (0.0%) |
| $22,500 to $24,999 | 0 (0.0%) | 0 (0.0%) |
| $25,000 to $29,999 | 0 (0.0%) | 0 (0.0%) |
| $30,000 to $34,999 | 0 (0.0%) | 0 (0.0%) |
| $35,000 to $39,999 | 0 (0.0%) | 0 (0.0%) |
| $40,000 to $44,999 | 0 (0.0%) | 5 (14.3%) |
| $45,000 to $49,999 | 0 (0.0%) | 0 (0.0%) |
| $50,000 to $54,999 | 0 (0.0%) | 0 (0.0%) |
| $55,000 to $64,999 | 0 (0.0%) | 8 (22.9%) |
| $65,000 to $74,999 | 28 (46.7%) | 0 (0.0%) |
| $75,000 to $99,999 | 0 (0.0%) | 13 (37.1%) |
| $100,000+ | 23 (38.3%) | 0 (0.0%) |
| Total | 60 (100.0%) | 35 (100.0%) |
Earnings by Sex by Educational Attainment in Olancha
| Educational Attainment | Male Income | Female Income |
| Less than High School | - | - |
| High School Diploma | - | - |
| College or Associate's Degree | - | - |
| Bachelor's Degree | - | - |
| Graduate Degree | - | - |
| Total | $66,875 | $58,594 |
Family Income in Olancha
Family Income Brackets in Olancha
According to the Olancha family income data, there are 23 families falling into the $150,000 to $199,999 income range, which is the most common income bracket and makes up 38.3% of all families.
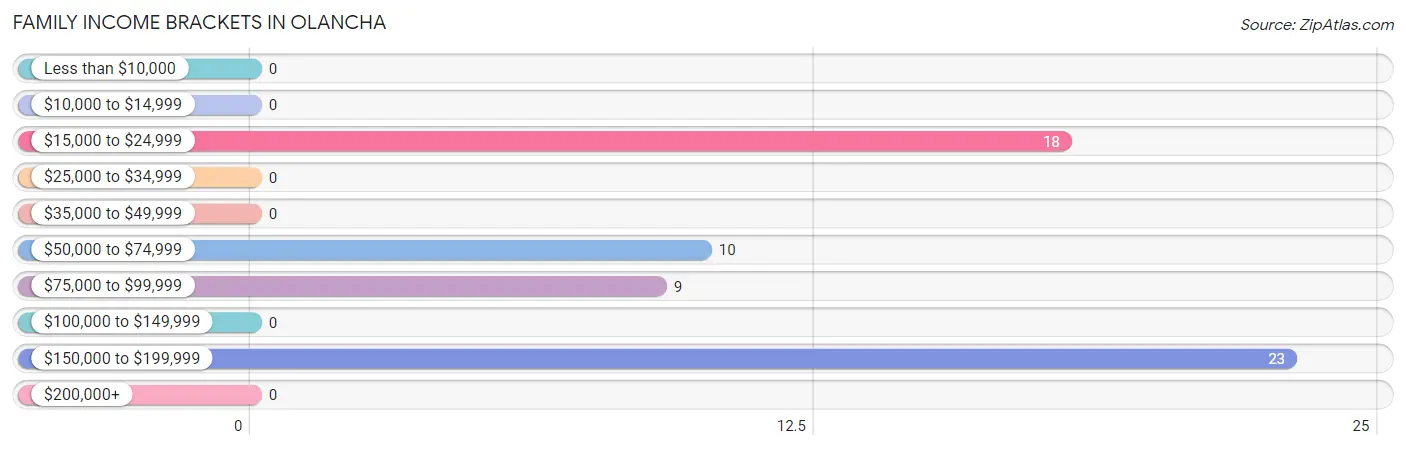
| Income Bracket | # Families | % Families |
| Less than $10,000 | 0 | 0.0% |
| $10,000 to $14,999 | 0 | 0.0% |
| $15,000 to $24,999 | 18 | 30.0% |
| $25,000 to $34,999 | 0 | 0.0% |
| $35,000 to $49,999 | 0 | 0.0% |
| $50,000 to $74,999 | 10 | 16.7% |
| $75,000 to $99,999 | 9 | 15.0% |
| $100,000 to $149,999 | 0 | 0.0% |
| $150,000 to $199,999 | 23 | 38.3% |
| $200,000+ | 0 | 0.0% |
Family Income by Famaliy Size in Olancha
| Income Bracket | # Families | Median Income |
| 2-Person Families | 44 (73.3%) | $0 |
| 3-Person Families | 16 (26.7%) | $0 |
| 4-Person Families | 0 (0.0%) | $0 |
| 5-Person Families | 0 (0.0%) | $0 |
| 6-Person Families | 0 (0.0%) | $0 |
| 7+ Person Families | 0 (0.0%) | $0 |
| Total | 60 (100.0%) | $0 |
Family Income by Number of Earners in Olancha
| Number of Earners | # Families | Median Income |
| No Earners | 25 (41.7%) | $0 |
| 1 Earner | 10 (16.7%) | $0 |
| 2 Earners | 25 (41.7%) | $0 |
| 3+ Earners | 0 (0.0%) | $0 |
| Total | 60 (100.0%) | $0 |
Household Income in Olancha
Household Income Brackets in Olancha
With 23 households falling in the category, the $150,000 to $199,999 income range is the most frequent in Olancha, accounting for 33.3% of all households.
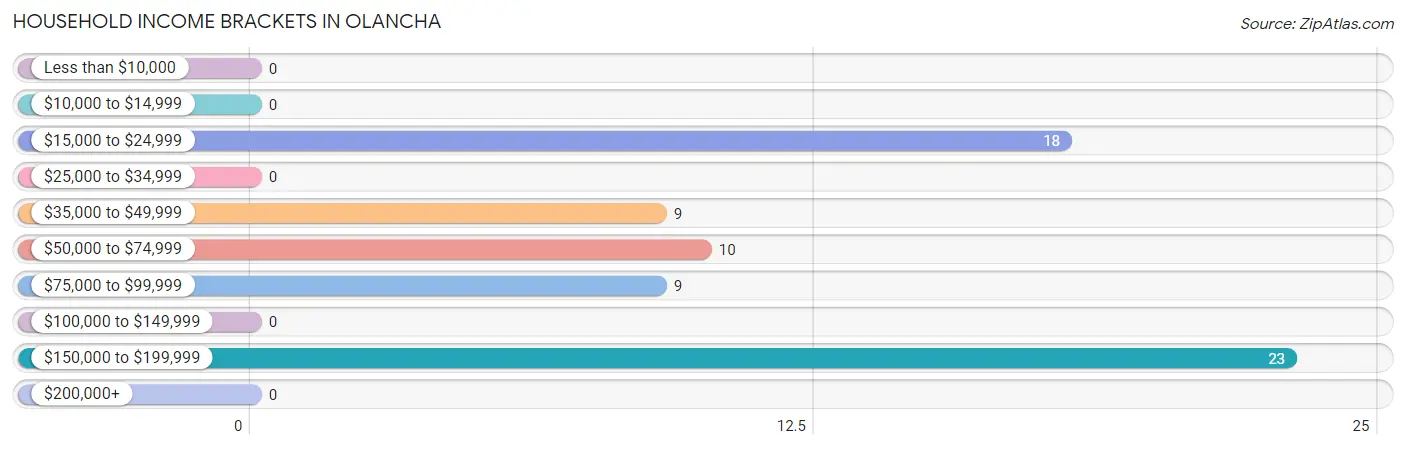
| Income Bracket | # Households | % Households |
| Less than $10,000 | 0 | 0.0% |
| $10,000 to $14,999 | 0 | 0.0% |
| $15,000 to $24,999 | 18 | 26.1% |
| $25,000 to $34,999 | 0 | 0.0% |
| $35,000 to $49,999 | 9 | 13.0% |
| $50,000 to $74,999 | 10 | 14.5% |
| $75,000 to $99,999 | 9 | 13.0% |
| $100,000 to $149,999 | 0 | 0.0% |
| $150,000 to $199,999 | 23 | 33.3% |
| $200,000+ | 0 | 0.0% |
Household Income by Householder Age in Olancha
The median household income in Olancha is $0, with the highest median household income of $86,528 found in the 45 to 64 years age bracket for the primary householder. A total of 21 households (30.4%) fall into this category.
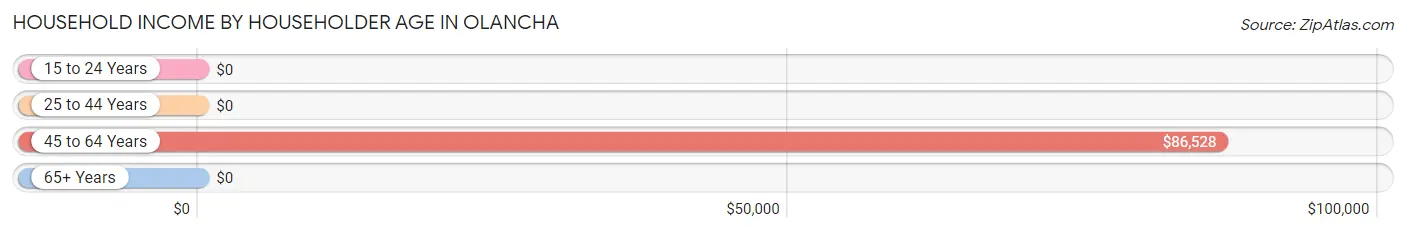
| Income Bracket | # Households | Median Income |
| 15 to 24 Years | 0 (0.0%) | $0 |
| 25 to 44 Years | 0 (0.0%) | $0 |
| 45 to 64 Years | 21 (30.4%) | $86,528 |
| 65+ Years | 48 (69.6%) | $0 |
| Total | 69 (100.0%) | $0 |
Poverty in Olancha
Income Below Poverty by Sex and Age in Olancha
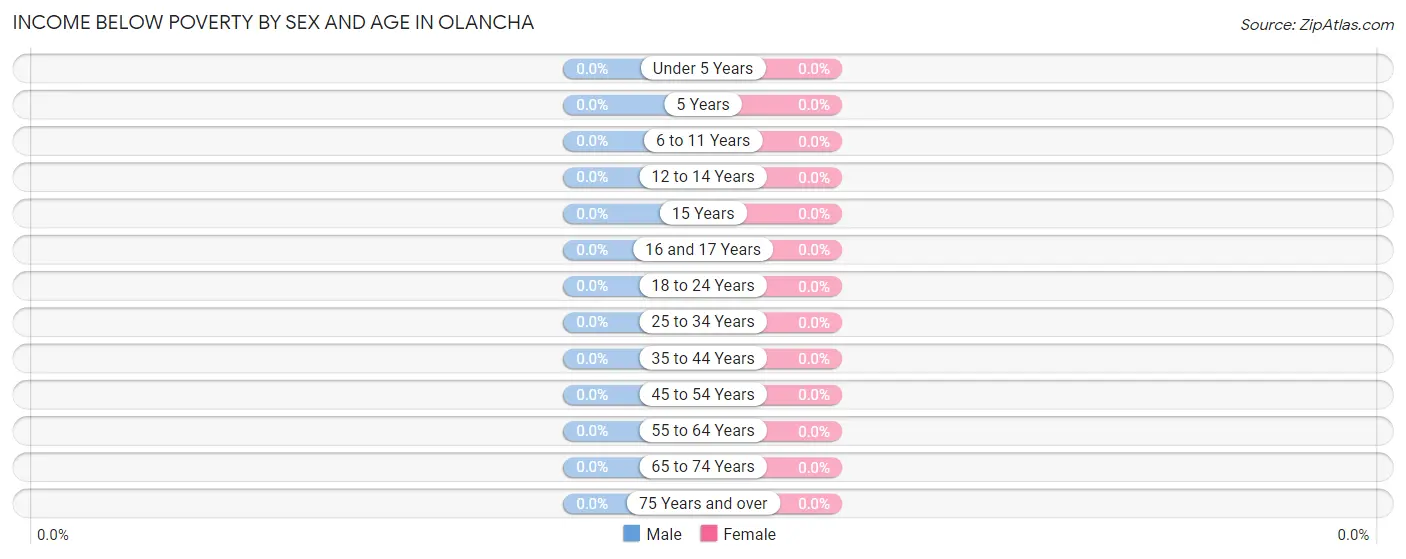
| Age Bracket | Male | Female |
| Under 5 Years | 0 (0.0%) | 0 (0.0%) |
| 5 Years | 0 (0.0%) | 0 (0.0%) |
| 6 to 11 Years | 0 (0.0%) | 0 (0.0%) |
| 12 to 14 Years | 0 (0.0%) | 0 (0.0%) |
| 15 Years | 0 (0.0%) | 0 (0.0%) |
| 16 and 17 Years | 0 (0.0%) | 0 (0.0%) |
| 18 to 24 Years | 0 (0.0%) | 0 (0.0%) |
| 25 to 34 Years | 0 (0.0%) | 0 (0.0%) |
| 35 to 44 Years | 0 (0.0%) | 0 (0.0%) |
| 45 to 54 Years | 0 (0.0%) | 0 (0.0%) |
| 55 to 64 Years | 0 (0.0%) | 0 (0.0%) |
| 65 to 74 Years | 0 (0.0%) | 0 (0.0%) |
| 75 Years and over | 0 (0.0%) | 0 (0.0%) |
| Total | 0 (0.0%) | 0 (0.0%) |
Income Above Poverty by Sex and Age in Olancha
According to the poverty statistics in Olancha, males aged 45 to 54 years and females aged 45 to 54 years are the age groups that are most secure financially, with 100.0% of males and 100.0% of females in these age groups living above the poverty line.
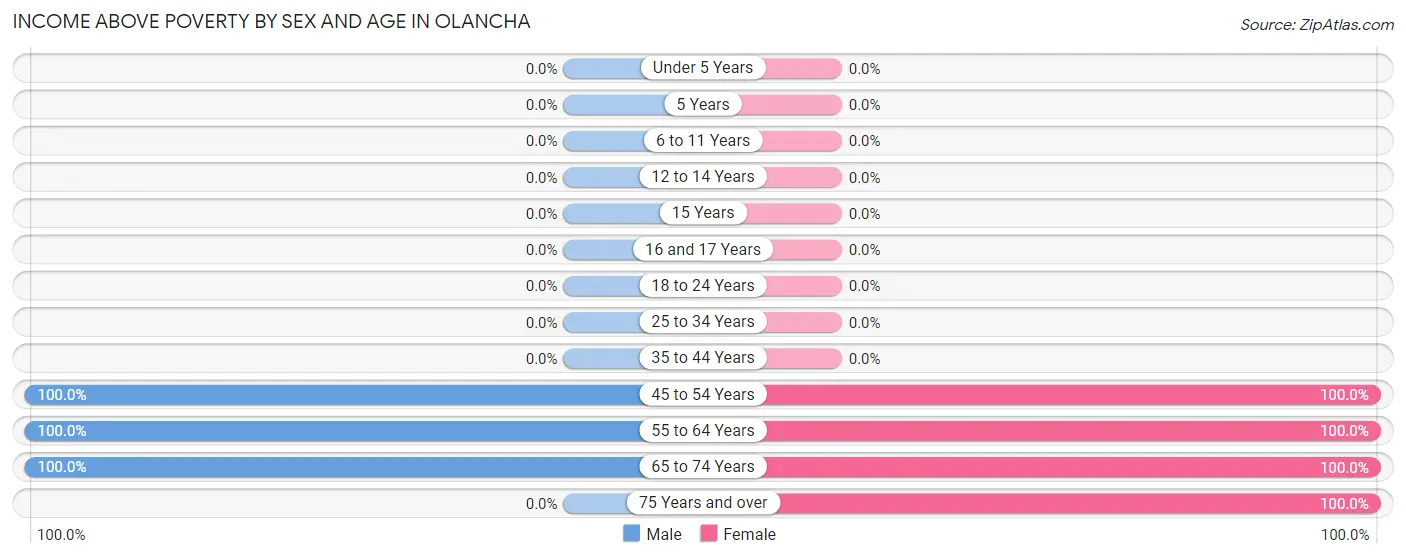
| Age Bracket | Male | Female |
| Under 5 Years | 0 (0.0%) | 0 (0.0%) |
| 5 Years | 0 (0.0%) | 0 (0.0%) |
| 6 to 11 Years | 0 (0.0%) | 0 (0.0%) |
| 12 to 14 Years | 0 (0.0%) | 0 (0.0%) |
| 15 Years | 0 (0.0%) | 0 (0.0%) |
| 16 and 17 Years | 0 (0.0%) | 0 (0.0%) |
| 18 to 24 Years | 0 (0.0%) | 0 (0.0%) |
| 25 to 34 Years | 0 (0.0%) | 0 (0.0%) |
| 35 to 44 Years | 0 (0.0%) | 0 (0.0%) |
| 45 to 54 Years | 28 (100.0%) | 21 (100.0%) |
| 55 to 64 Years | 39 (100.0%) | 12 (100.0%) |
| 65 to 74 Years | 28 (100.0%) | 34 (100.0%) |
| 75 Years and over | 0 (0.0%) | 9 (100.0%) |
| Total | 95 (100.0%) | 76 (100.0%) |
Income Below Poverty Among Married-Couple Families in Olancha
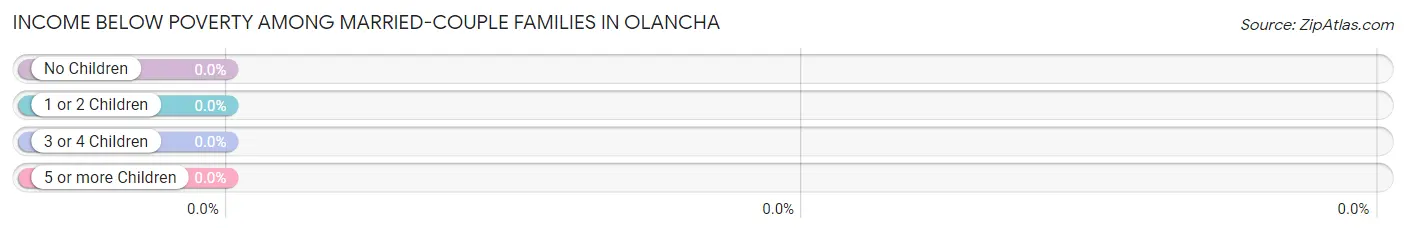
| Children | Above Poverty | Below Poverty |
| No Children | 60 (100.0%) | 0 (0.0%) |
| 1 or 2 Children | 0 (0.0%) | 0 (0.0%) |
| 3 or 4 Children | 0 (0.0%) | 0 (0.0%) |
| 5 or more Children | 0 (0.0%) | 0 (0.0%) |
| Total | 60 (100.0%) | 0 (0.0%) |
Income Below Poverty Among Single-Parent Households in Olancha
| Children | Single Father | Single Mother |
| No Children | 0 (0.0%) | 0 (0.0%) |
| 1 or 2 Children | 0 (0.0%) | 0 (0.0%) |
| 3 or 4 Children | 0 (0.0%) | 0 (0.0%) |
| 5 or more Children | 0 (0.0%) | 0 (0.0%) |
| Total | 0 (0.0%) | 0 (0.0%) |
Income Below Poverty Among Married-Couple vs Single-Parent Households in Olancha
| Children | Married-Couple Families | Single-Parent Households |
| No Children | 0 (0.0%) | 0 (0.0%) |
| 1 or 2 Children | 0 (0.0%) | 0 (0.0%) |
| 3 or 4 Children | 0 (0.0%) | 0 (0.0%) |
| 5 or more Children | 0 (0.0%) | 0 (0.0%) |
| Total | 0 (0.0%) | 0 (0.0%) |
Race in Olancha
The most populous races in Olancha are White / Caucasian (163 | 95.3%), and Native / Alaskan (8 | 4.7%).
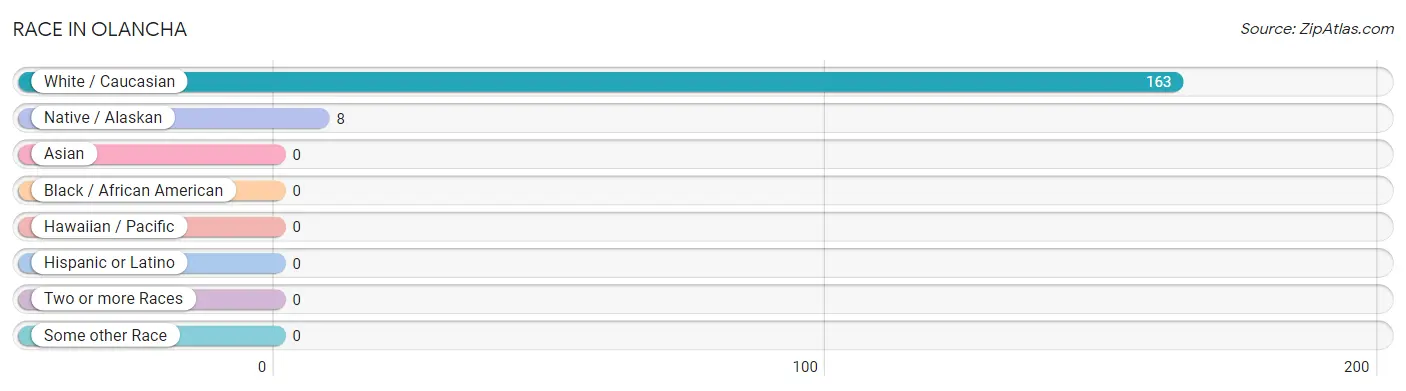
| Race | # Population | % Population |
| Asian | 0 | 0.0% |
| Black / African American | 0 | 0.0% |
| Hawaiian / Pacific | 0 | 0.0% |
| Hispanic or Latino | 0 | 0.0% |
| Native / Alaskan | 8 | 4.7% |
| White / Caucasian | 163 | 95.3% |
| Two or more Races | 0 | 0.0% |
| Some other Race | 0 | 0.0% |
| Total | 171 | 100.0% |
Ancestry in Olancha
The most populous ancestries reported in Olancha are German (49 | 28.6%), Irish (23 | 13.5%), Scottish (14 | 8.2%), English (7 | 4.1%), and Welsh (7 | 4.1%), together accounting for 58.5% of all Olancha residents.
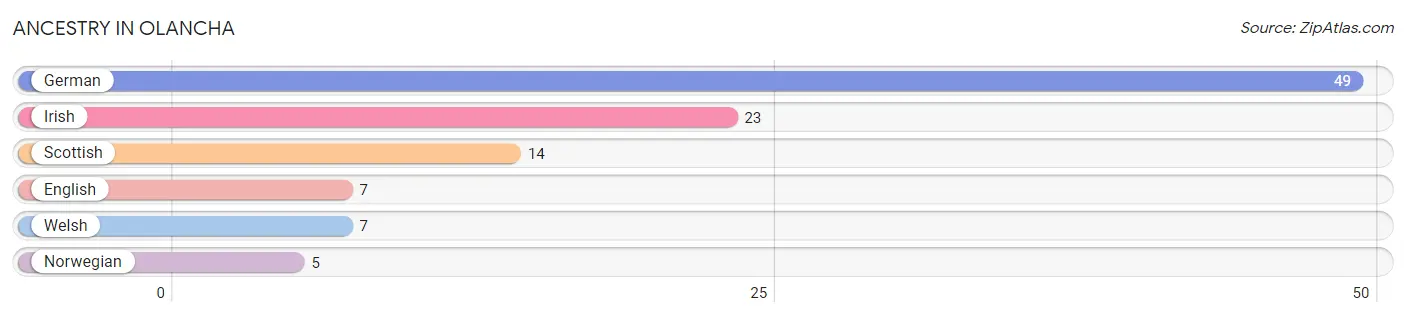
| Ancestry | # Population | % Population |
| English | 7 | 4.1% |
| German | 49 | 28.6% |
| Irish | 23 | 13.5% |
| Norwegian | 5 | 2.9% |
| Scottish | 14 | 8.2% |
| Welsh | 7 | 4.1% | View All 6 Rows |
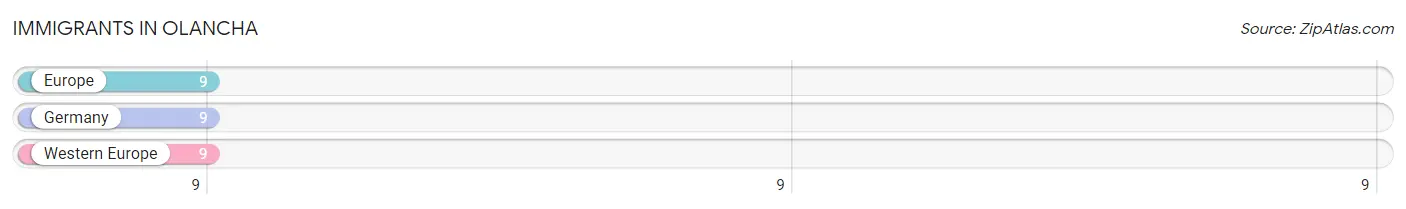
Immigrants in Olancha
The most numerous immigrant groups reported in Olancha came from Europe (9 | 5.3%), Germany (9 | 5.3%), and Western Europe (9 | 5.3%), together accounting for 15.8% of all Olancha residents.
| Immigration Origin | # Population | % Population |
| Europe | 9 | 5.3% |
| Germany | 9 | 5.3% |
| Western Europe | 9 | 5.3% | View All 3 Rows |
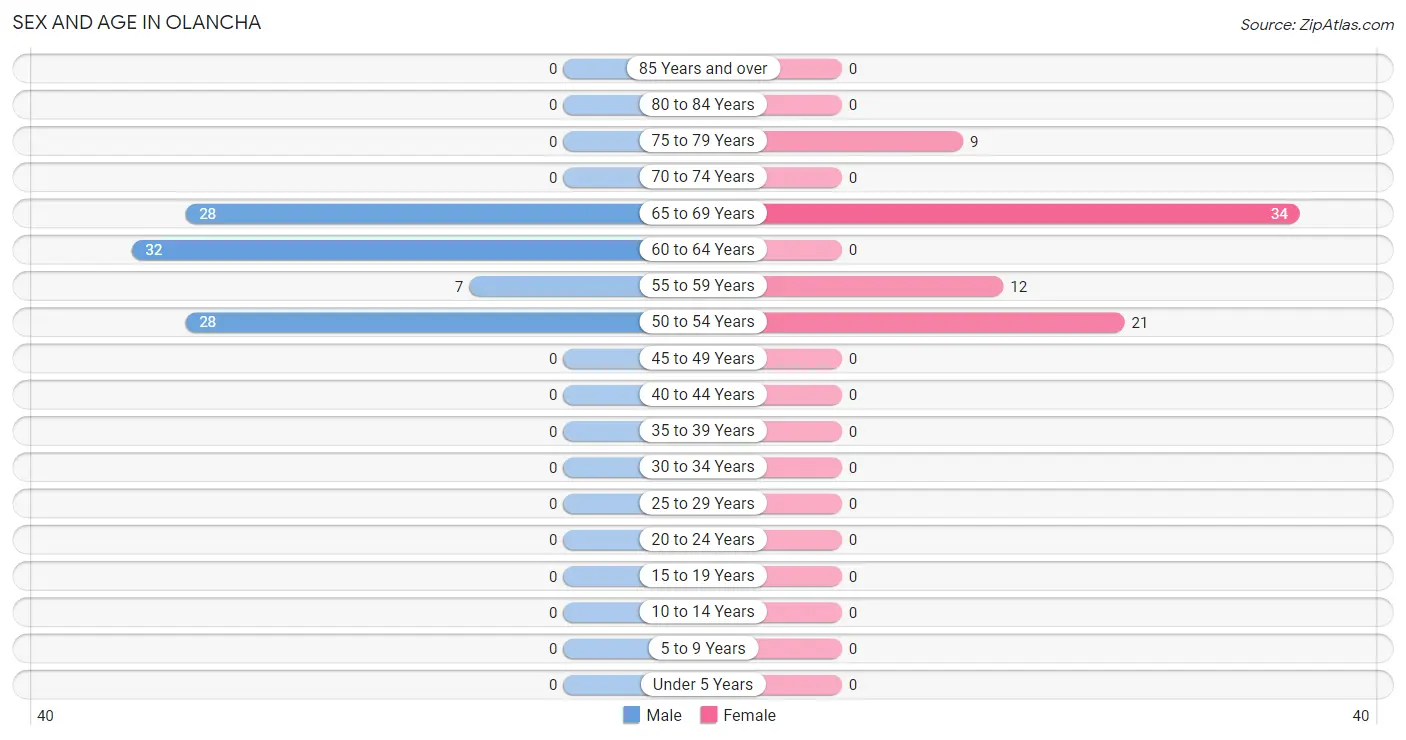
Sex and Age in Olancha
Sex and Age in Olancha
The most populous age groups in Olancha are 60 to 64 Years (32 | 33.7%) for men and 65 to 69 Years (34 | 44.7%) for women.
| Age Bracket | Male | Female |
| Under 5 Years | 0 (0.0%) | 0 (0.0%) |
| 5 to 9 Years | 0 (0.0%) | 0 (0.0%) |
| 10 to 14 Years | 0 (0.0%) | 0 (0.0%) |
| 15 to 19 Years | 0 (0.0%) | 0 (0.0%) |
| 20 to 24 Years | 0 (0.0%) | 0 (0.0%) |
| 25 to 29 Years | 0 (0.0%) | 0 (0.0%) |
| 30 to 34 Years | 0 (0.0%) | 0 (0.0%) |
| 35 to 39 Years | 0 (0.0%) | 0 (0.0%) |
| 40 to 44 Years | 0 (0.0%) | 0 (0.0%) |
| 45 to 49 Years | 0 (0.0%) | 0 (0.0%) |
| 50 to 54 Years | 28 (29.5%) | 21 (27.6%) |
| 55 to 59 Years | 7 (7.4%) | 12 (15.8%) |
| 60 to 64 Years | 32 (33.7%) | 0 (0.0%) |
| 65 to 69 Years | 28 (29.5%) | 34 (44.7%) |
| 70 to 74 Years | 0 (0.0%) | 0 (0.0%) |
| 75 to 79 Years | 0 (0.0%) | 9 (11.8%) |
| 80 to 84 Years | 0 (0.0%) | 0 (0.0%) |
| 85 Years and over | 0 (0.0%) | 0 (0.0%) |
| Total | 95 (100.0%) | 76 (100.0%) |
Families and Households in Olancha
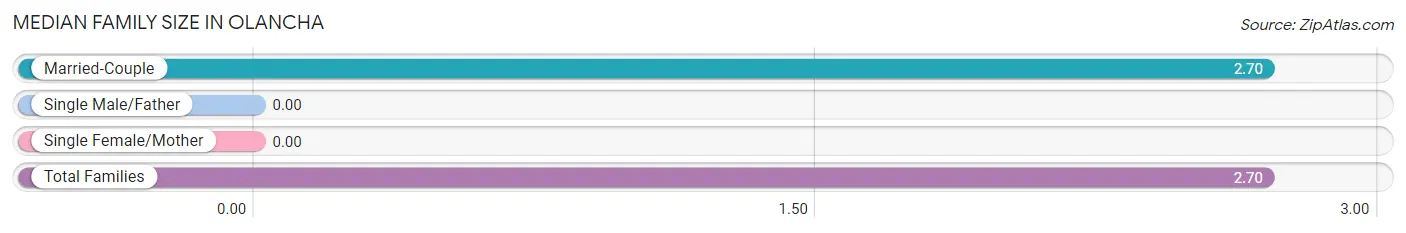
Median Family Size in Olancha
| Family Type | # Families | Family Size |
| Married-Couple | 60 (100.0%) | 2.70 |
| Single Male/Father | 0 (0.0%) | - |
| Single Female/Mother | 0 (0.0%) | - |
| Total Families | 60 (100.0%) | 2.70 |
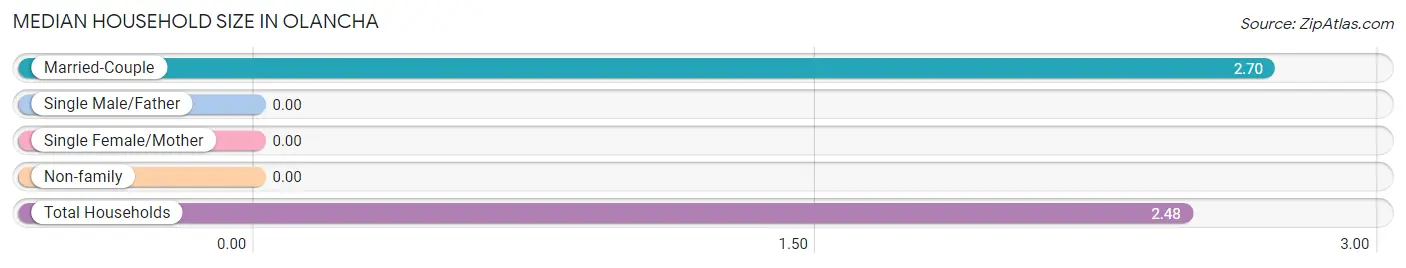
Median Household Size in Olancha
| Household Type | # Households | Household Size |
| Married-Couple | 60 (87.0%) | 2.70 |
| Single Male/Father | 0 (0.0%) | - |
| Single Female/Mother | 0 (0.0%) | - |
| Non-family | 9 (13.0%) | - |
| Total Households | 69 (100.0%) | 2.48 |
Household Size by Marriage Status in Olancha
Out of a total of 69 households in Olancha, 60 (87.0%) are family households, while 9 (13.0%) are nonfamily households. The most numerous type of family households are 2-person households, comprising 44, and the most common type of nonfamily households are 1-person households, comprising 9.
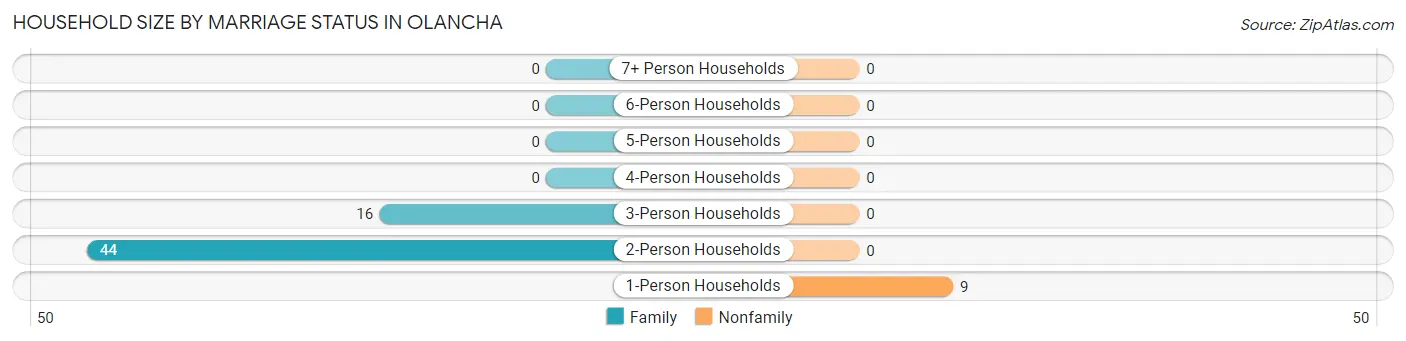
| Household Size | Family Households | Nonfamily Households |
| 1-Person Households | - | 9 (13.0%) |
| 2-Person Households | 44 (63.8%) | 0 (0.0%) |
| 3-Person Households | 16 (23.2%) | 0 (0.0%) |
| 4-Person Households | 0 (0.0%) | 0 (0.0%) |
| 5-Person Households | 0 (0.0%) | 0 (0.0%) |
| 6-Person Households | 0 (0.0%) | 0 (0.0%) |
| 7+ Person Households | 0 (0.0%) | 0 (0.0%) |
| Total | 60 (87.0%) | 9 (13.0%) |
Female Fertility in Olancha
Fertility by Age in Olancha
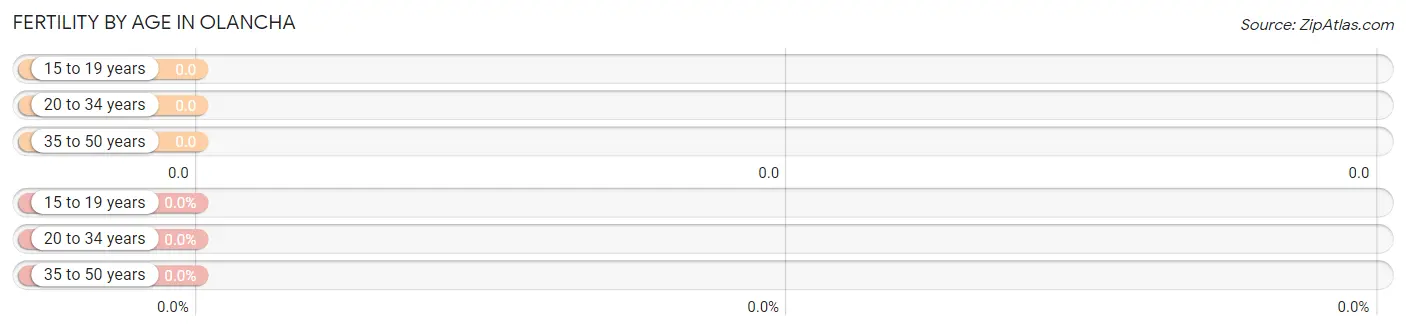
| Age Bracket | Women with Births | Births / 1,000 Women |
| 15 to 19 years | 0 (0.0%) | 0.0 |
| 20 to 34 years | 0 (0.0%) | 0.0 |
| 35 to 50 years | 0 (0.0%) | 0.0 |
| Total | 0 (0.0%) | 0.0 |
Fertility by Age by Marriage Status in Olancha
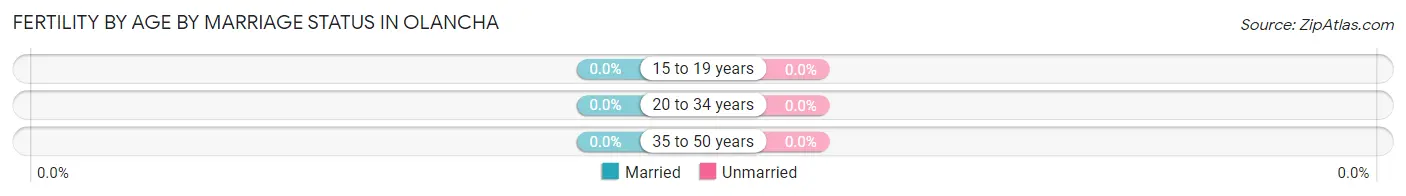
| Age Bracket | Married | Unmarried |
| 15 to 19 years | 0 (0.0%) | 0 (0.0%) |
| 20 to 34 years | 0 (0.0%) | 0 (0.0%) |
| 35 to 50 years | 0 (0.0%) | 0 (0.0%) |
| Total | 0 (0.0%) | 0 (0.0%) |
Fertility by Education in Olancha
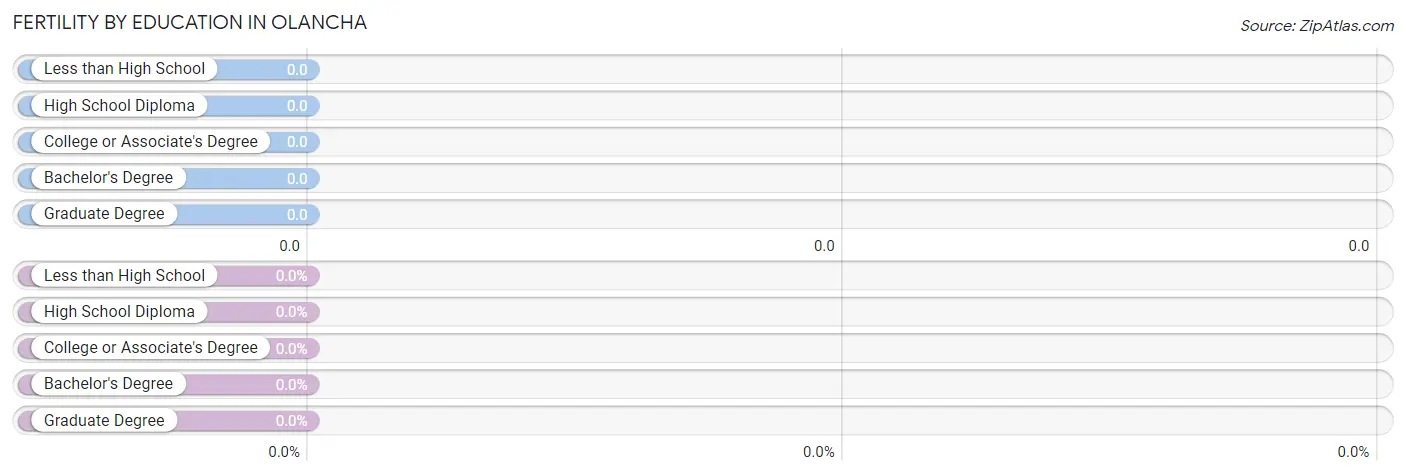
| Educational Attainment | Women with Births | Births / 1,000 Women |
| Less than High School | 0 (0.0%) | 0.0 |
| High School Diploma | 0 (0.0%) | 0.0 |
| College or Associate's Degree | 0 (0.0%) | 0.0 |
| Bachelor's Degree | 0 (0.0%) | 0.0 |
| Graduate Degree | 0 (0.0%) | 0.0 |
| Total | 0 (0.0%) | 0.0 |
Fertility by Education by Marriage Status in Olancha
| Educational Attainment | Married | Unmarried |
| Less than High School | 0 (0.0%) | 0 (0.0%) |
| High School Diploma | 0 (0.0%) | 0 (0.0%) |
| College or Associate's Degree | 0 (0.0%) | 0 (0.0%) |
| Bachelor's Degree | 0 (0.0%) | 0 (0.0%) |
| Graduate Degree | 0 (0.0%) | 0 (0.0%) |
| Total | 0 (0.0%) | 0 (0.0%) |
Employment Characteristics in Olancha
Employment by Class of Employer in Olancha
Among the 49 employed individuals in Olancha, private company employees (23 | 46.9%), local government employees (18 | 36.7%), and state government employees (8 | 16.3%) make up the most common classes of employment.
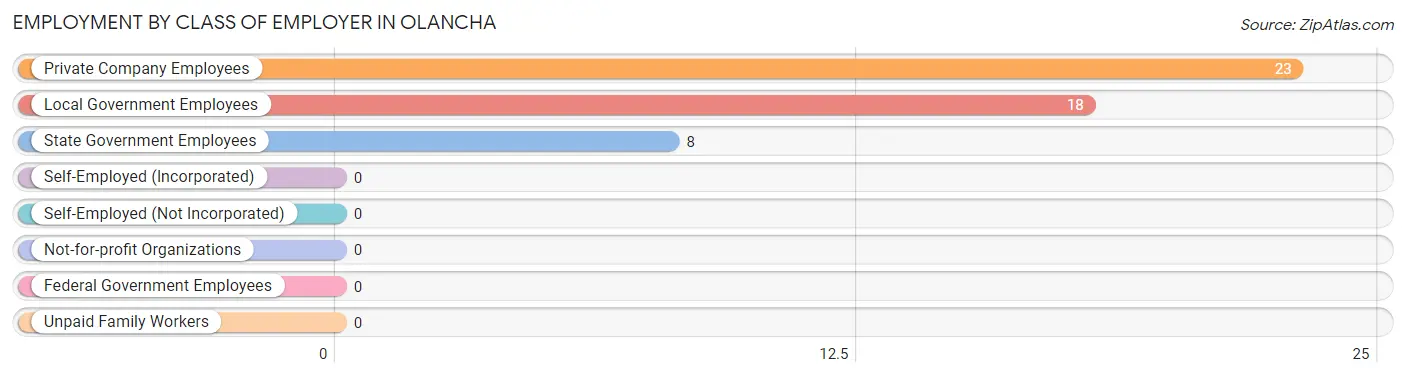
| Employer Class | # Employees | % Employees |
| Private Company Employees | 23 | 46.9% |
| Self-Employed (Incorporated) | 0 | 0.0% |
| Self-Employed (Not Incorporated) | 0 | 0.0% |
| Not-for-profit Organizations | 0 | 0.0% |
| Local Government Employees | 18 | 36.7% |
| State Government Employees | 8 | 16.3% |
| Federal Government Employees | 0 | 0.0% |
| Unpaid Family Workers | 0 | 0.0% |
| Total | 49 | 100.0% |
Employment Status by Age in Olancha
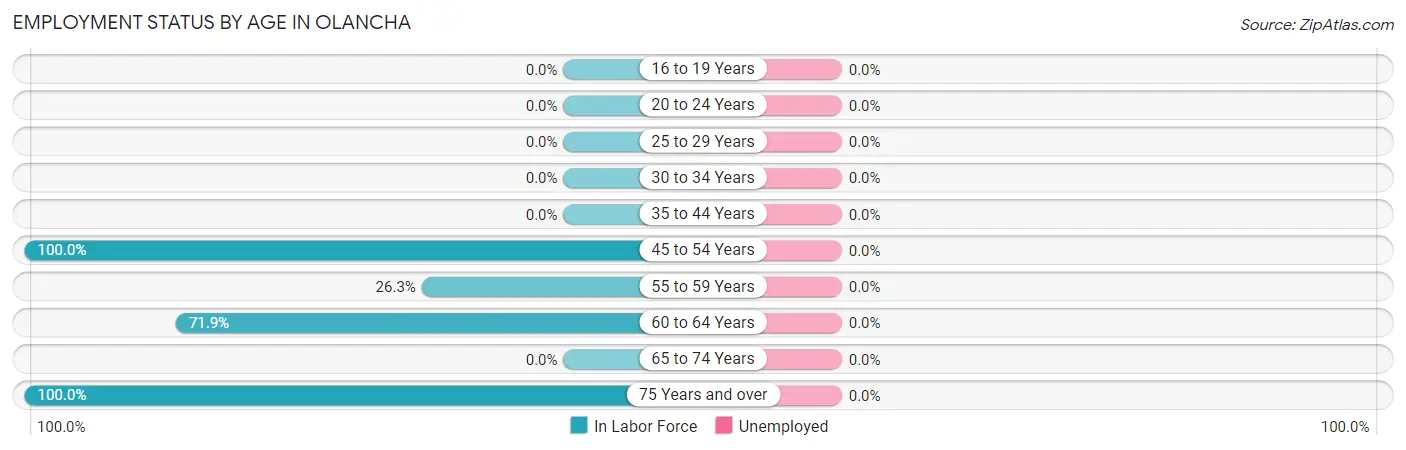
| Age Bracket | In Labor Force | Unemployed |
| 16 to 19 Years | 0 (0.0%) | 0 (0.0%) |
| 20 to 24 Years | 0 (0.0%) | 0 (0.0%) |
| 25 to 29 Years | 0 (0.0%) | 0 (0.0%) |
| 30 to 34 Years | 0 (0.0%) | 0 (0.0%) |
| 35 to 44 Years | 0 (0.0%) | 0 (0.0%) |
| 45 to 54 Years | 49 (100.0%) | 0 (0.0%) |
| 55 to 59 Years | 5 (26.3%) | 0 (0.0%) |
| 60 to 64 Years | 23 (71.9%) | 0 (0.0%) |
| 65 to 74 Years | 0 (0.0%) | 0 (0.0%) |
| 75 Years and over | 9 (100.0%) | 0 (0.0%) |
| Total | 86 (50.3%) | 0 (0.0%) |
Employment Status by Educational Attainment in Olancha
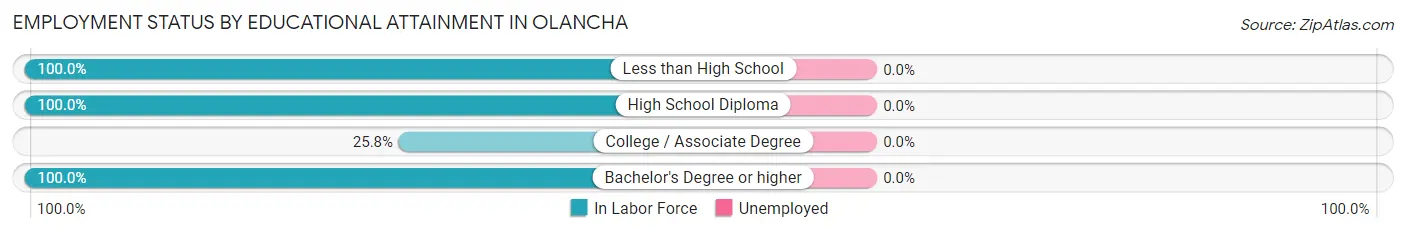
| Educational Attainment | In Labor Force | Unemployed |
| Less than High School | 28 (100.0%) | 0 (0.0%) |
| High School Diploma | 28 (100.0%) | 0 (0.0%) |
| College / Associate Degree | 8 (25.8%) | 0 (0.0%) |
| Bachelor's Degree or higher | 13 (100.0%) | 0 (0.0%) |
| Total | 77 (77.0%) | 0 (0.0%) |
Employment Occupations by Sex in Olancha
Management, Business, Science and Arts Occupations
The most common Management, Business, Science and Arts occupations in Olancha are Management (23 | 26.7%), Community & Social Service (13 | 15.1%), and Education Instruction & Library (13 | 15.1%).
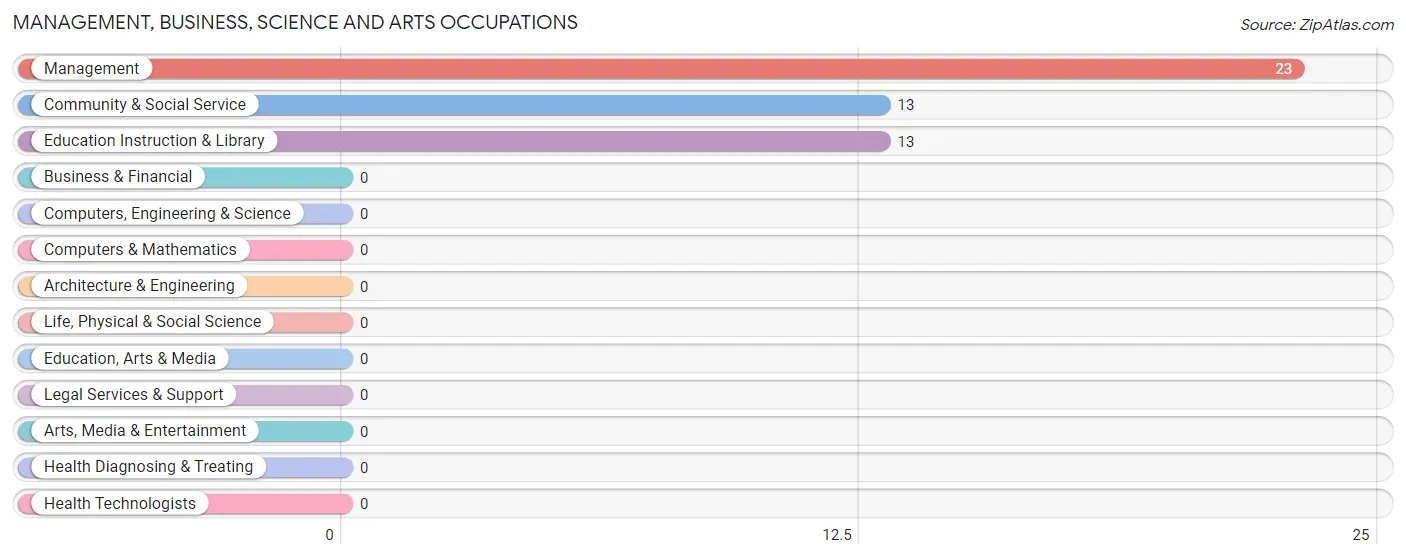
Management, Business, Science and Arts Occupations by Sex
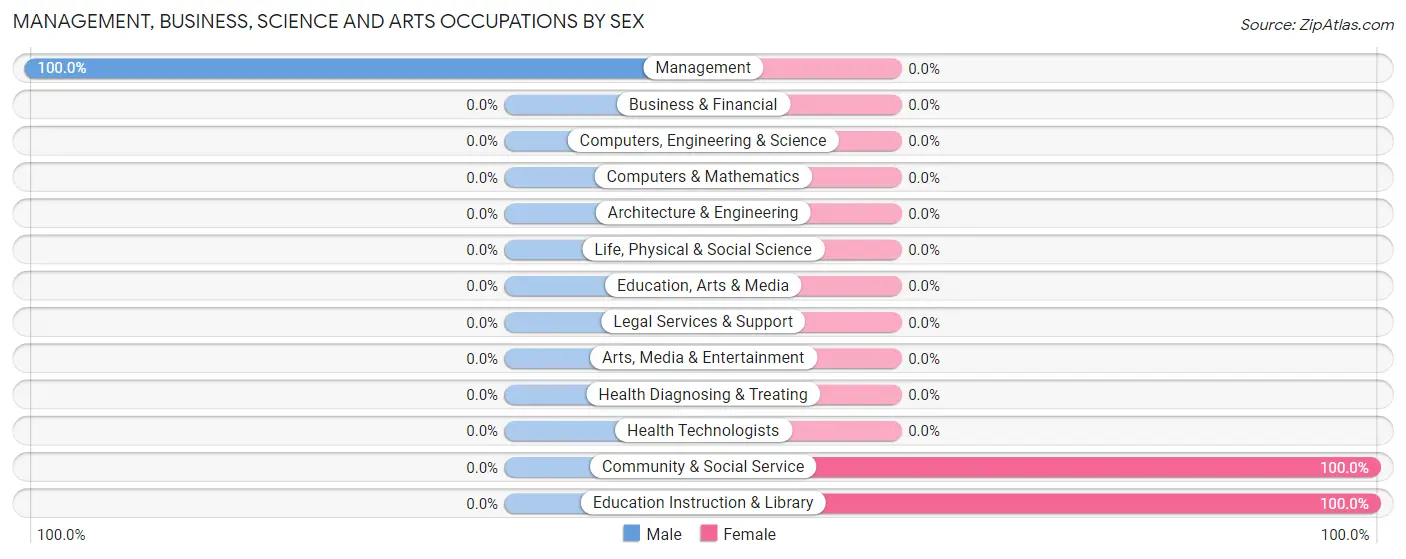
| Occupation | Male | Female |
| Management | 23 (100.0%) | 0 (0.0%) |
| Business & Financial | 0 (0.0%) | 0 (0.0%) |
| Computers, Engineering & Science | 0 (0.0%) | 0 (0.0%) |
| Computers & Mathematics | 0 (0.0%) | 0 (0.0%) |
| Architecture & Engineering | 0 (0.0%) | 0 (0.0%) |
| Life, Physical & Social Science | 0 (0.0%) | 0 (0.0%) |
| Community & Social Service | 0 (0.0%) | 13 (100.0%) |
| Education, Arts & Media | 0 (0.0%) | 0 (0.0%) |
| Legal Services & Support | 0 (0.0%) | 0 (0.0%) |
| Education Instruction & Library | 0 (0.0%) | 13 (100.0%) |
| Arts, Media & Entertainment | 0 (0.0%) | 0 (0.0%) |
| Health Diagnosing & Treating | 0 (0.0%) | 0 (0.0%) |
| Health Technologists | 0 (0.0%) | 0 (0.0%) |
| Total (Category) | 23 (63.9%) | 13 (36.1%) |
| Total (Overall) | 51 (59.3%) | 35 (40.7%) |
Services Occupations
The most common Services occupations in Olancha are , and Food Preparation & Serving (9 | 10.5%).
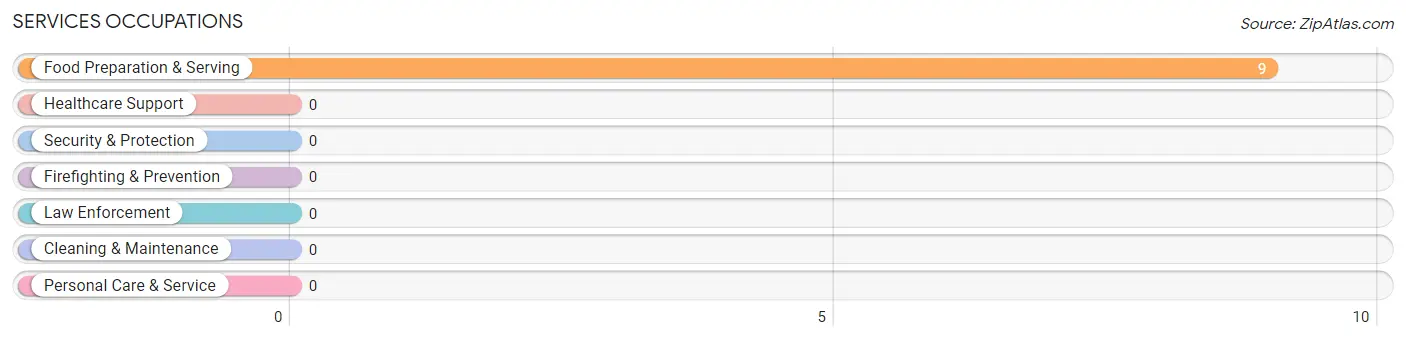
Services Occupations by Sex
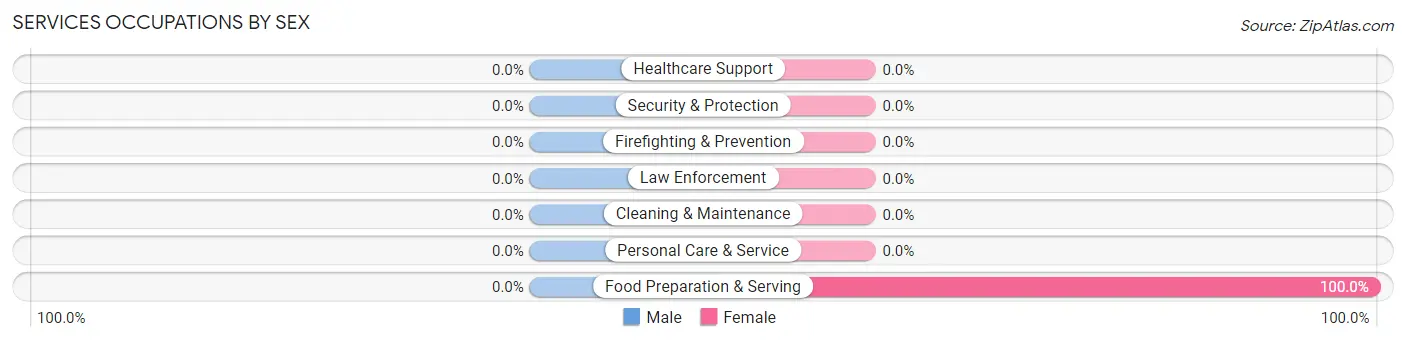
| Occupation | Male | Female |
| Healthcare Support | 0 (0.0%) | 0 (0.0%) |
| Security & Protection | 0 (0.0%) | 0 (0.0%) |
| Firefighting & Prevention | 0 (0.0%) | 0 (0.0%) |
| Law Enforcement | 0 (0.0%) | 0 (0.0%) |
| Food Preparation & Serving | 0 (0.0%) | 9 (100.0%) |
| Cleaning & Maintenance | 0 (0.0%) | 0 (0.0%) |
| Personal Care & Service | 0 (0.0%) | 0 (0.0%) |
| Total (Category) | 0 (0.0%) | 9 (100.0%) |
| Total (Overall) | 51 (59.3%) | 35 (40.7%) |
Sales and Office Occupations
The most common Sales and Office occupations in Olancha are , and Office & Administration (41 | 47.7%).

Sales and Office Occupations by Sex

| Occupation | Male | Female |
| Sales & Related | 0 (0.0%) | 0 (0.0%) |
| Office & Administration | 28 (68.3%) | 13 (31.7%) |
| Total (Category) | 28 (68.3%) | 13 (31.7%) |
| Total (Overall) | 51 (59.3%) | 35 (40.7%) |
Natural Resources, Construction and Maintenance Occupations
Natural Resources, Construction and Maintenance Occupations by Sex
| Occupation | Male | Female |
| Farming, Fishing & Forestry | 0 (0.0%) | 0 (0.0%) |
| Construction & Extraction | 0 (0.0%) | 0 (0.0%) |
| Installation, Maintenance & Repair | 0 (0.0%) | 0 (0.0%) |
| Total (Category) | 0 (0.0%) | 0 (0.0%) |
| Total (Overall) | 51 (59.3%) | 35 (40.7%) |
Production, Transportation and Moving Occupations
Production, Transportation and Moving Occupations by Sex
| Occupation | Male | Female |
| Production | 0 (0.0%) | 0 (0.0%) |
| Transportation | 0 (0.0%) | 0 (0.0%) |
| Material Moving | 0 (0.0%) | 0 (0.0%) |
| Total (Category) | 0 (0.0%) | 0 (0.0%) |
| Total (Overall) | 51 (59.3%) | 35 (40.7%) |
Employment Industries by Sex in Olancha
Employment Industries in Olancha
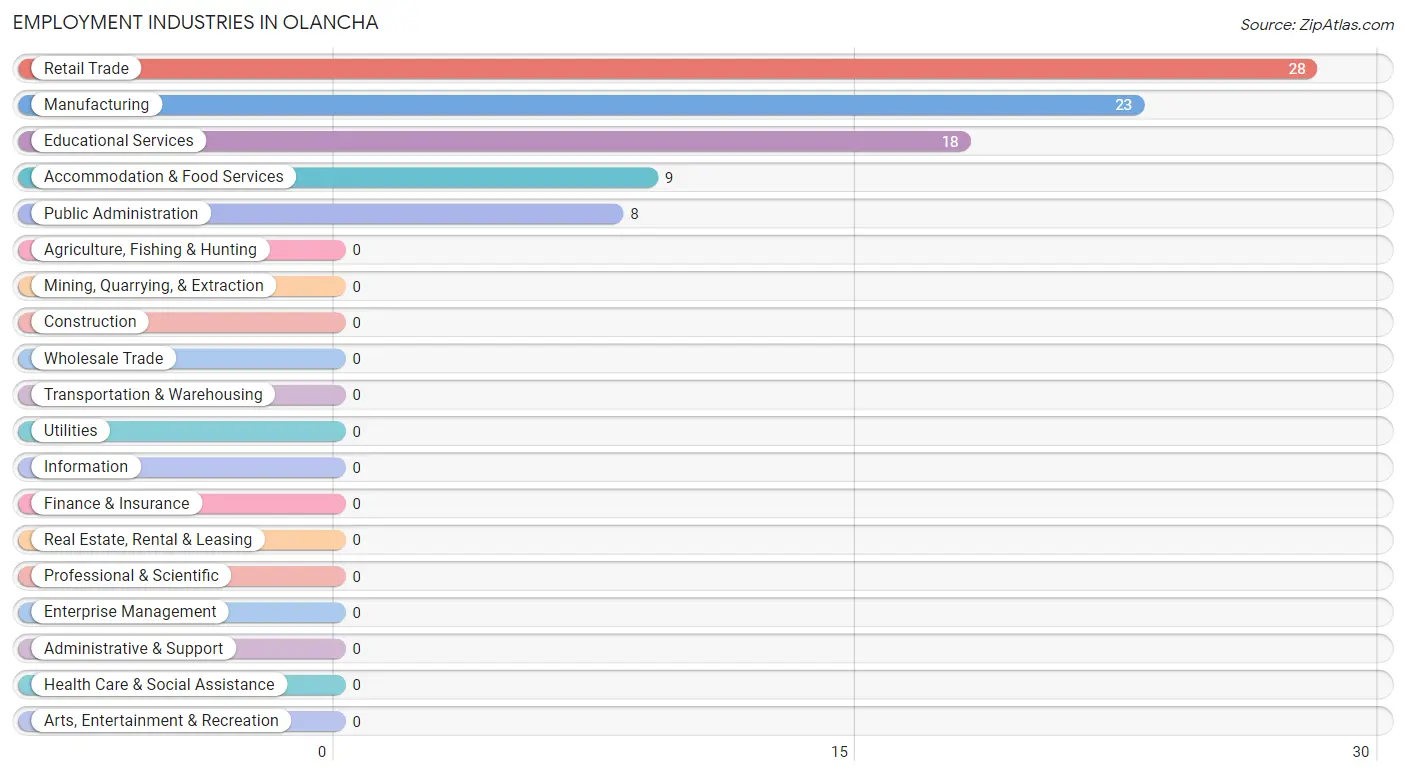
The major employment industries in Olancha include Retail Trade (28 | 32.6%), Manufacturing (23 | 26.7%), Educational Services (18 | 20.9%), Accommodation & Food Services (9 | 10.5%), and Public Administration (8 | 9.3%).
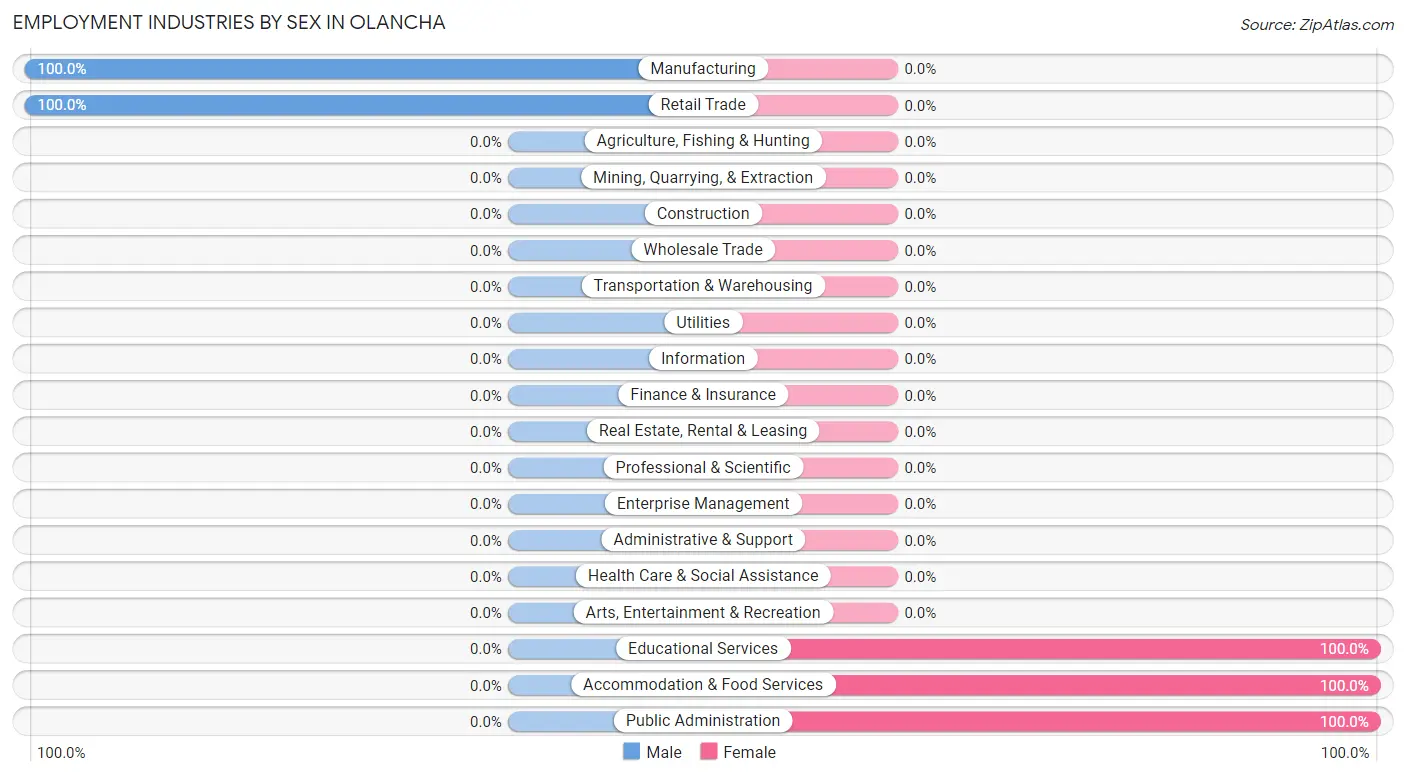
Employment Industries by Sex in Olancha
The Olancha industries that see more men than women are Manufacturing (100.0%), and Retail Trade (100.0%), whereas the industries that tend to have a higher number of women are Educational Services (100.0%), Accommodation & Food Services (100.0%), and Public Administration (100.0%).
| Industry | Male | Female |
| Agriculture, Fishing & Hunting | 0 (0.0%) | 0 (0.0%) |
| Mining, Quarrying, & Extraction | 0 (0.0%) | 0 (0.0%) |
| Construction | 0 (0.0%) | 0 (0.0%) |
| Manufacturing | 23 (100.0%) | 0 (0.0%) |
| Wholesale Trade | 0 (0.0%) | 0 (0.0%) |
| Retail Trade | 28 (100.0%) | 0 (0.0%) |
| Transportation & Warehousing | 0 (0.0%) | 0 (0.0%) |
| Utilities | 0 (0.0%) | 0 (0.0%) |
| Information | 0 (0.0%) | 0 (0.0%) |
| Finance & Insurance | 0 (0.0%) | 0 (0.0%) |
| Real Estate, Rental & Leasing | 0 (0.0%) | 0 (0.0%) |
| Professional & Scientific | 0 (0.0%) | 0 (0.0%) |
| Enterprise Management | 0 (0.0%) | 0 (0.0%) |
| Administrative & Support | 0 (0.0%) | 0 (0.0%) |
| Educational Services | 0 (0.0%) | 18 (100.0%) |
| Health Care & Social Assistance | 0 (0.0%) | 0 (0.0%) |
| Arts, Entertainment & Recreation | 0 (0.0%) | 0 (0.0%) |
| Accommodation & Food Services | 0 (0.0%) | 9 (100.0%) |
| Public Administration | 0 (0.0%) | 8 (100.0%) |
| Total | 51 (59.3%) | 35 (40.7%) |
Education in Olancha
School Enrollment in Olancha
| School Level | # Students | % Students |
| Nursery / Preschool | 0 | 0.0% |
| Kindergarten | 0 | 0.0% |
| Elementary School | 0 | 0.0% |
| Middle School | 0 | 0.0% |
| High School | 0 | 0.0% |
| College / Undergraduate | 0 | 0.0% |
| Graduate / Professional | 0 | 0.0% |
| Total | 0 | 0.0% |
School Enrollment by Age by Funding Source in Olancha
| Age Bracket | Public School | Private School |
| 3 to 4 Year Olds | 0 (0.0%) | 0 (0.0%) |
| 5 to 9 Year Old | 0 (0.0%) | 0 (0.0%) |
| 10 to 14 Year Olds | 0 (0.0%) | 0 (0.0%) |
| 15 to 17 Year Olds | 0 (0.0%) | 0 (0.0%) |
| 18 to 19 Year Olds | 0 (0.0%) | 0 (0.0%) |
| 20 to 24 Year Olds | 0 (0.0%) | 0 (0.0%) |
| 25 to 34 Year Olds | 0 (0.0%) | 0 (0.0%) |
| 35 Years and over | 0 (0.0%) | 0 (0.0%) |
| Total | 0 (0.0%) | 0 (0.0%) |
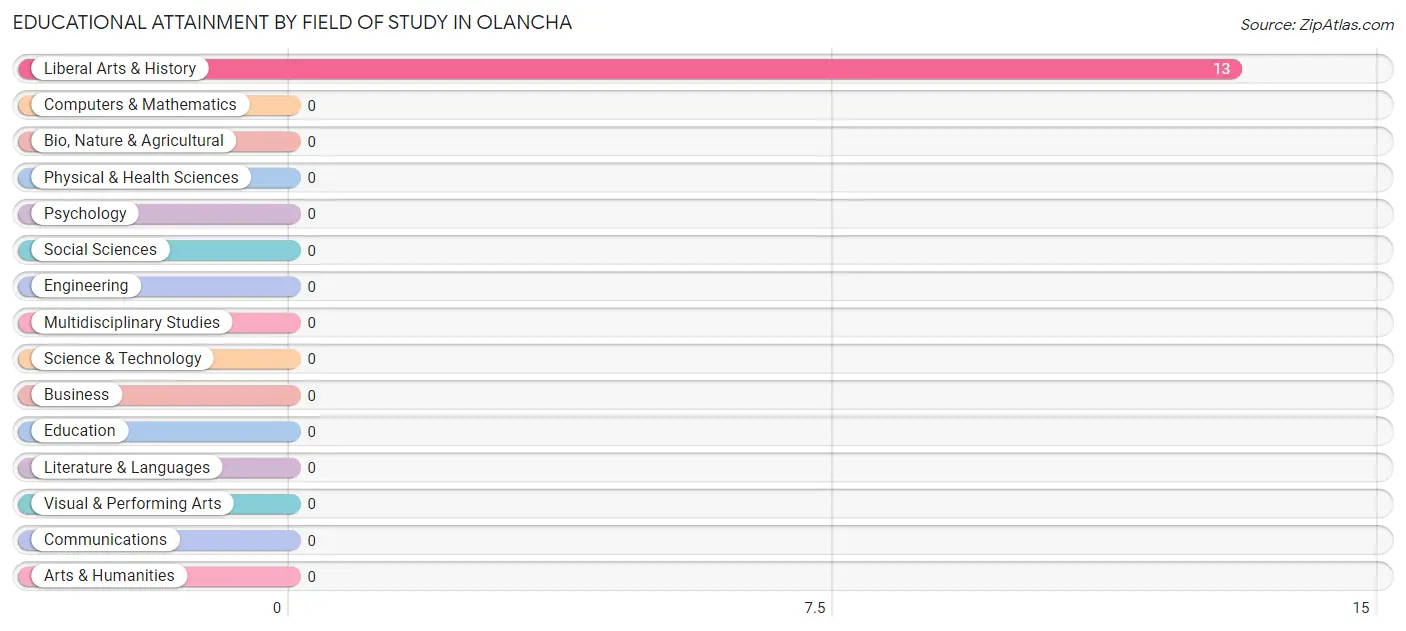
Educational Attainment by Field of Study in Olancha
, and liberal arts & history (13 | 100.0%) are the most common fields of study among 13 individuals in Olancha who have obtained a bachelor's degree or higher.
| Field of Study | # Graduates | % Graduates |
| Computers & Mathematics | 0 | 0.0% |
| Bio, Nature & Agricultural | 0 | 0.0% |
| Physical & Health Sciences | 0 | 0.0% |
| Psychology | 0 | 0.0% |
| Social Sciences | 0 | 0.0% |
| Engineering | 0 | 0.0% |
| Multidisciplinary Studies | 0 | 0.0% |
| Science & Technology | 0 | 0.0% |
| Business | 0 | 0.0% |
| Education | 0 | 0.0% |
| Literature & Languages | 0 | 0.0% |
| Liberal Arts & History | 13 | 100.0% |
| Visual & Performing Arts | 0 | 0.0% |
| Communications | 0 | 0.0% |
| Arts & Humanities | 0 | 0.0% |
| Total | 13 | 100.0% |
Transportation & Commute in Olancha
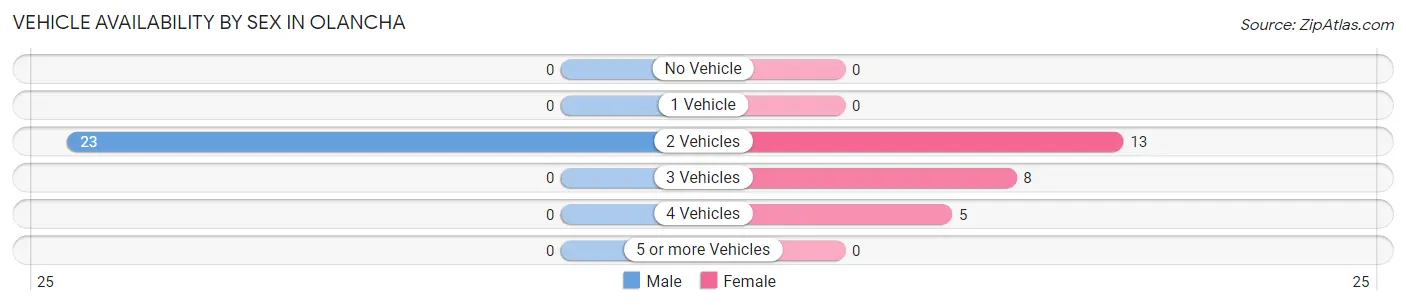
Vehicle Availability by Sex in Olancha
The most prevalent vehicle ownership categories in Olancha are males with 2 vehicles (23, accounting for 100.0%) and females with 2 vehicles (13, making up 88.5%).
| Vehicles Available | Male | Female |
| No Vehicle | 0 (0.0%) | 0 (0.0%) |
| 1 Vehicle | 0 (0.0%) | 0 (0.0%) |
| 2 Vehicles | 23 (100.0%) | 13 (50.0%) |
| 3 Vehicles | 0 (0.0%) | 8 (30.8%) |
| 4 Vehicles | 0 (0.0%) | 5 (19.2%) |
| 5 or more Vehicles | 0 (0.0%) | 0 (0.0%) |
| Total | 23 (100.0%) | 26 (100.0%) |
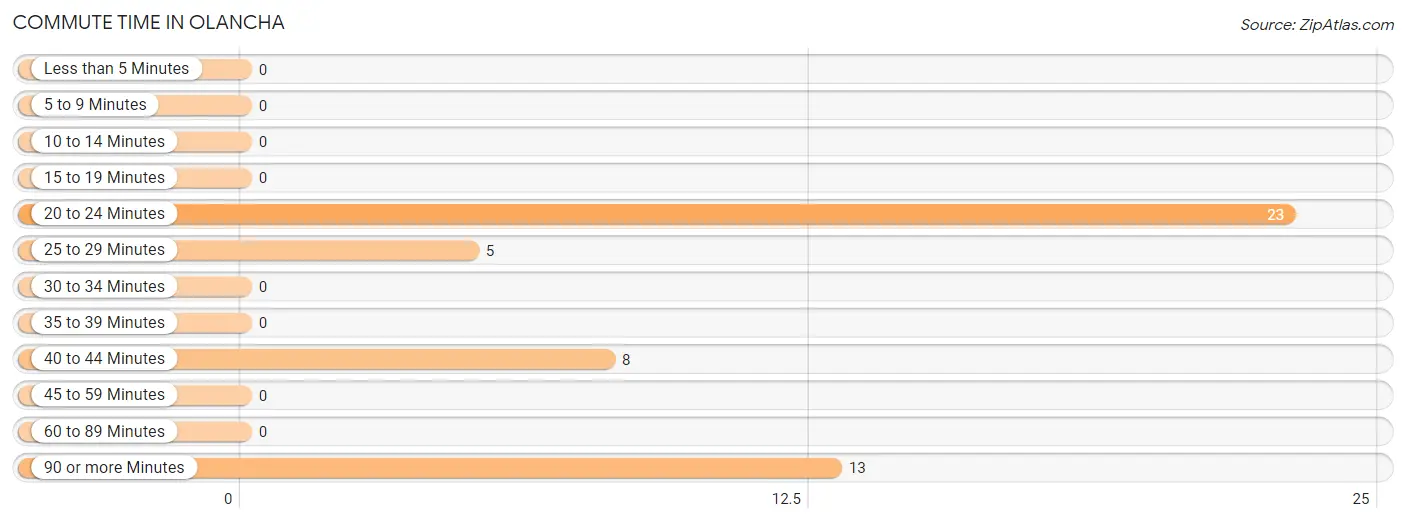
Commute Time in Olancha
The most frequently occuring commute durations in Olancha are 20 to 24 minutes (23 commuters, 46.9%), 90 or more minutes (13 commuters, 26.5%), and 40 to 44 minutes (8 commuters, 16.3%).
| Commute Time | # Commuters | % Commuters |
| Less than 5 Minutes | 0 | 0.0% |
| 5 to 9 Minutes | 0 | 0.0% |
| 10 to 14 Minutes | 0 | 0.0% |
| 15 to 19 Minutes | 0 | 0.0% |
| 20 to 24 Minutes | 23 | 46.9% |
| 25 to 29 Minutes | 5 | 10.2% |
| 30 to 34 Minutes | 0 | 0.0% |
| 35 to 39 Minutes | 0 | 0.0% |
| 40 to 44 Minutes | 8 | 16.3% |
| 45 to 59 Minutes | 0 | 0.0% |
| 60 to 89 Minutes | 0 | 0.0% |
| 90 or more Minutes | 13 | 26.5% |
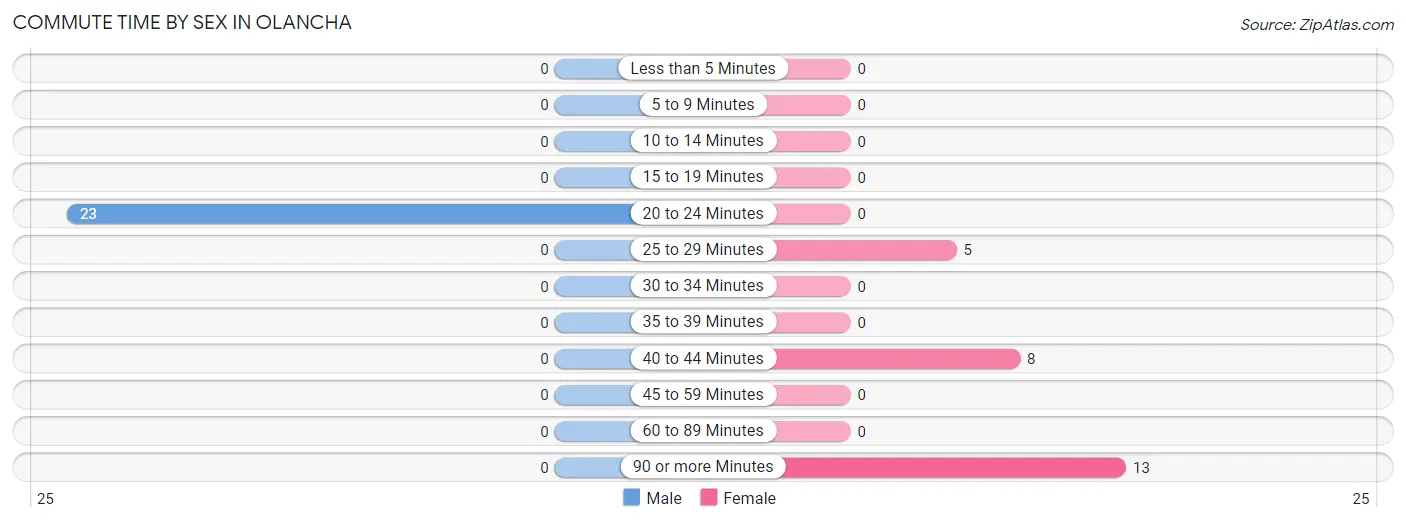
Commute Time by Sex in Olancha
The most common commute times in Olancha are 20 to 24 minutes (23 commuters, 100.0%) for males and 90 or more minutes (13 commuters, 50.0%) for females.
| Commute Time | Male | Female |
| Less than 5 Minutes | 0 (0.0%) | 0 (0.0%) |
| 5 to 9 Minutes | 0 (0.0%) | 0 (0.0%) |
| 10 to 14 Minutes | 0 (0.0%) | 0 (0.0%) |
| 15 to 19 Minutes | 0 (0.0%) | 0 (0.0%) |
| 20 to 24 Minutes | 23 (100.0%) | 0 (0.0%) |
| 25 to 29 Minutes | 0 (0.0%) | 5 (19.2%) |
| 30 to 34 Minutes | 0 (0.0%) | 0 (0.0%) |
| 35 to 39 Minutes | 0 (0.0%) | 0 (0.0%) |
| 40 to 44 Minutes | 0 (0.0%) | 8 (30.8%) |
| 45 to 59 Minutes | 0 (0.0%) | 0 (0.0%) |
| 60 to 89 Minutes | 0 (0.0%) | 0 (0.0%) |
| 90 or more Minutes | 0 (0.0%) | 13 (50.0%) |
Time of Departure to Work by Sex in Olancha
The most frequent times of departure to work in Olancha are 5:00 AM to 5:29 AM (23, 100.0%) for males and 6:30 AM to 6:59 AM (13, 50.0%) for females.
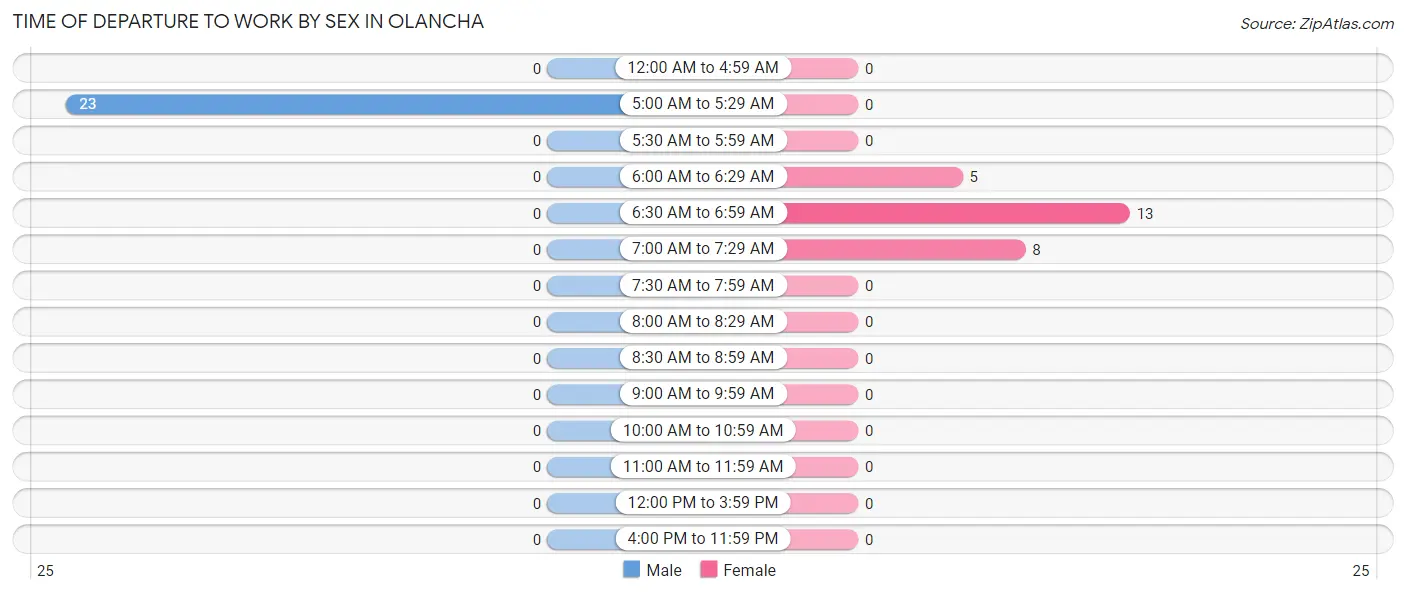
| Time of Departure | Male | Female |
| 12:00 AM to 4:59 AM | 0 (0.0%) | 0 (0.0%) |
| 5:00 AM to 5:29 AM | 23 (100.0%) | 0 (0.0%) |
| 5:30 AM to 5:59 AM | 0 (0.0%) | 0 (0.0%) |
| 6:00 AM to 6:29 AM | 0 (0.0%) | 5 (19.2%) |
| 6:30 AM to 6:59 AM | 0 (0.0%) | 13 (50.0%) |
| 7:00 AM to 7:29 AM | 0 (0.0%) | 8 (30.8%) |
| 7:30 AM to 7:59 AM | 0 (0.0%) | 0 (0.0%) |
| 8:00 AM to 8:29 AM | 0 (0.0%) | 0 (0.0%) |
| 8:30 AM to 8:59 AM | 0 (0.0%) | 0 (0.0%) |
| 9:00 AM to 9:59 AM | 0 (0.0%) | 0 (0.0%) |
| 10:00 AM to 10:59 AM | 0 (0.0%) | 0 (0.0%) |
| 11:00 AM to 11:59 AM | 0 (0.0%) | 0 (0.0%) |
| 12:00 PM to 3:59 PM | 0 (0.0%) | 0 (0.0%) |
| 4:00 PM to 11:59 PM | 0 (0.0%) | 0 (0.0%) |
| Total | 23 (100.0%) | 26 (100.0%) |
Housing Occupancy in Olancha
Occupancy by Ownership in Olancha
Of the total 69 dwellings in Olancha, owner-occupied units account for 53 (76.8%), while renter-occupied units make up 16 (23.2%).
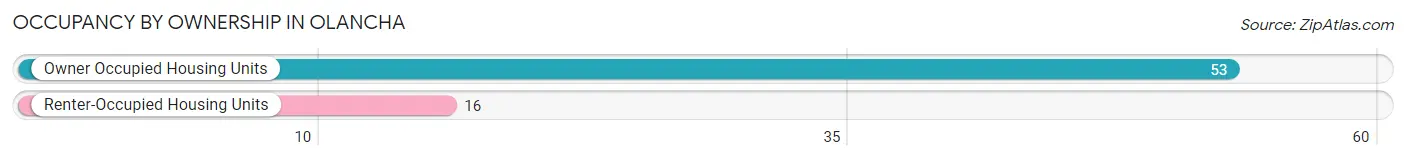
| Occupancy | # Housing Units | % Housing Units |
| Owner Occupied Housing Units | 53 | 76.8% |
| Renter-Occupied Housing Units | 16 | 23.2% |
| Total Occupied Housing Units | 69 | 100.0% |
Occupancy by Household Size in Olancha
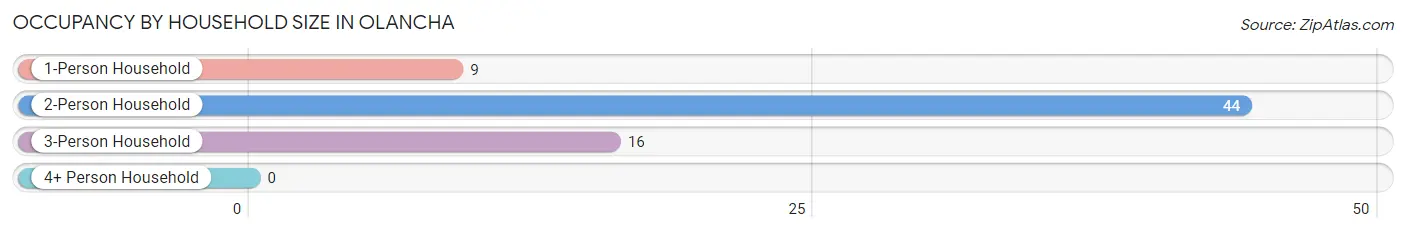
| Household Size | # Housing Units | % Housing Units |
| 1-Person Household | 9 | 13.0% |
| 2-Person Household | 44 | 63.8% |
| 3-Person Household | 16 | 23.2% |
| 4+ Person Household | 0 | 0.0% |
| Total Housing Units | 69 | 100.0% |
Occupancy by Ownership by Household Size in Olancha
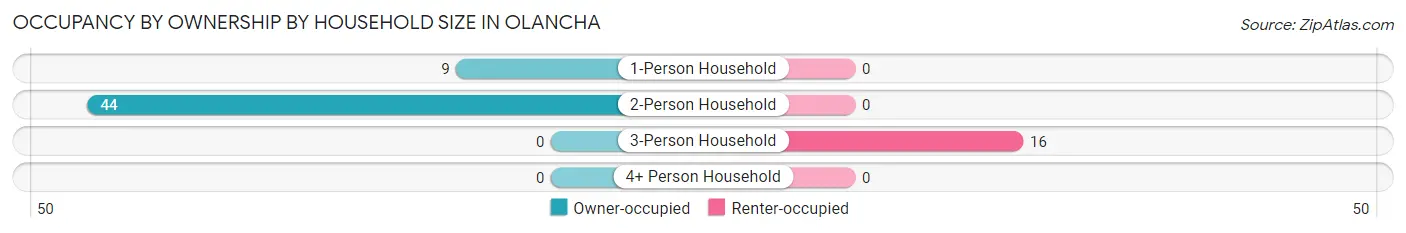
| Household Size | Owner-occupied | Renter-occupied |
| 1-Person Household | 9 (100.0%) | 0 (0.0%) |
| 2-Person Household | 44 (100.0%) | 0 (0.0%) |
| 3-Person Household | 0 (0.0%) | 16 (100.0%) |
| 4+ Person Household | 0 (0.0%) | 0 (0.0%) |
| Total Housing Units | 53 (76.8%) | 16 (23.2%) |
Occupancy by Educational Attainment in Olancha
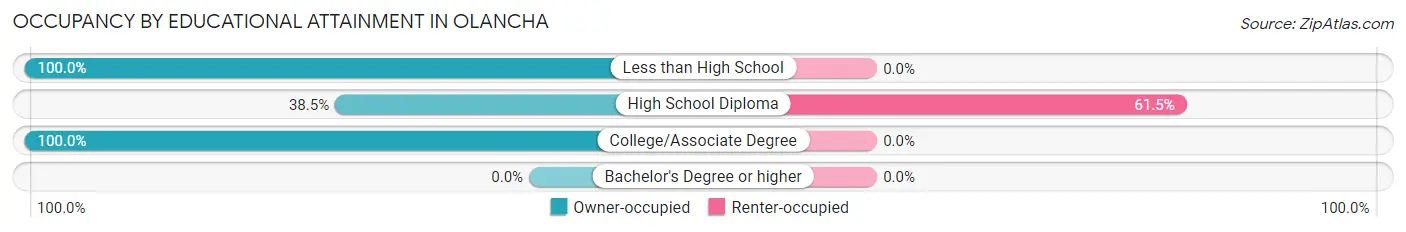
| Household Size | Owner-occupied | Renter-occupied |
| Less than High School | 9 (100.0%) | 0 (0.0%) |
| High School Diploma | 10 (38.5%) | 16 (61.5%) |
| College/Associate Degree | 34 (100.0%) | 0 (0.0%) |
| Bachelor's Degree or higher | 0 (0.0%) | 0 (0.0%) |
Occupancy by Age of Householder in Olancha
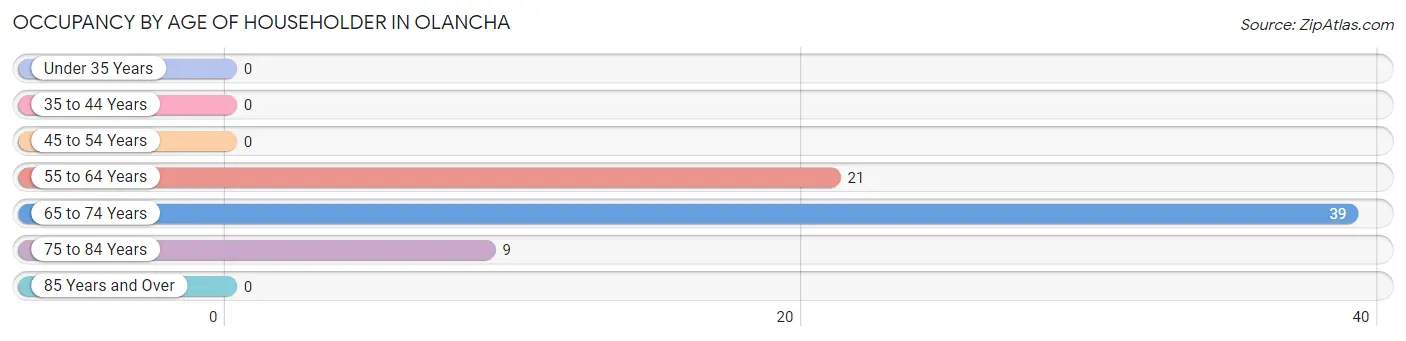
| Age Bracket | # Households | % Households |
| Under 35 Years | 0 | 0.0% |
| 35 to 44 Years | 0 | 0.0% |
| 45 to 54 Years | 0 | 0.0% |
| 55 to 64 Years | 21 | 30.4% |
| 65 to 74 Years | 39 | 56.5% |
| 75 to 84 Years | 9 | 13.0% |
| 85 Years and Over | 0 | 0.0% |
| Total | 69 | 100.0% |
Housing Finances in Olancha
Median Income by Occupancy in Olancha
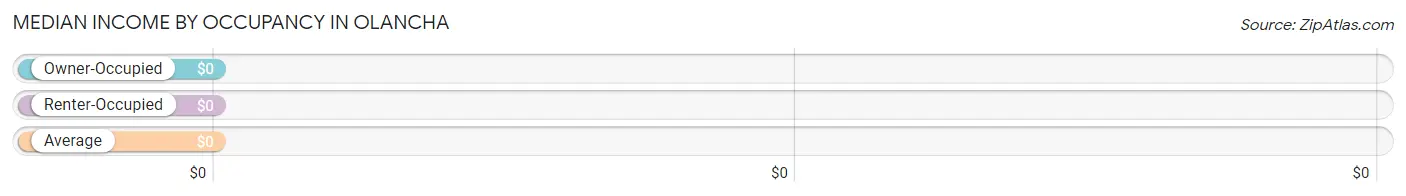
| Occupancy Type | # Households | Median Income |
| Owner-Occupied | 53 (76.8%) | $0 |
| Renter-Occupied | 16 (23.2%) | $0 |
| Average | 69 (100.0%) | $0 |
Occupancy by Householder Income Bracket in Olancha
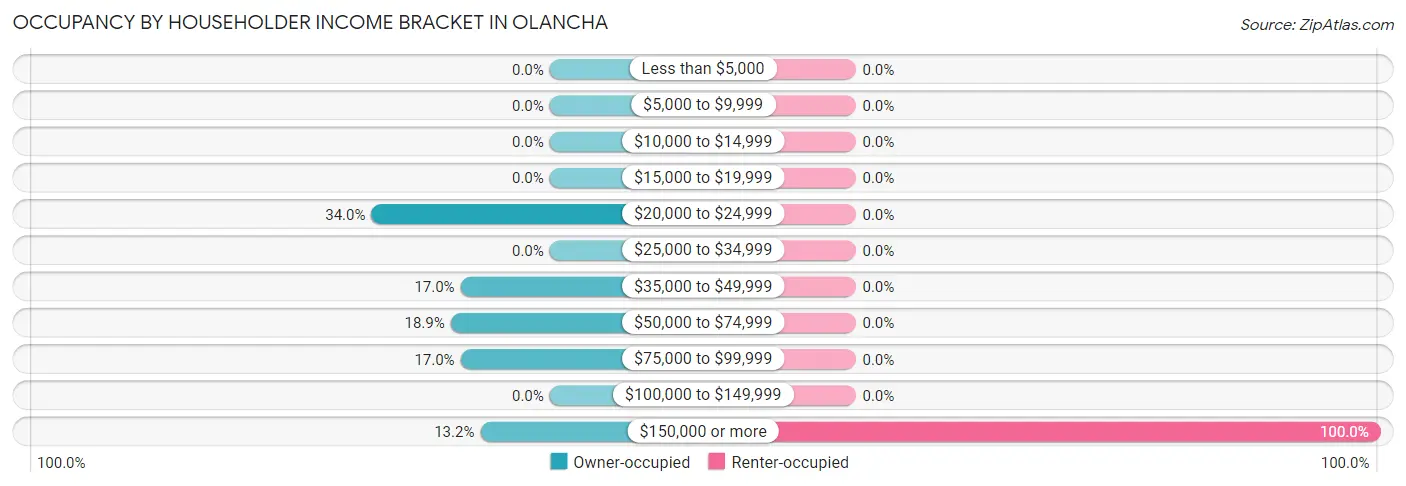
| Income Bracket | Owner-occupied | Renter-occupied |
| Less than $5,000 | 0 (0.0%) | 0 (0.0%) |
| $5,000 to $9,999 | 0 (0.0%) | 0 (0.0%) |
| $10,000 to $14,999 | 0 (0.0%) | 0 (0.0%) |
| $15,000 to $19,999 | 0 (0.0%) | 0 (0.0%) |
| $20,000 to $24,999 | 18 (34.0%) | 0 (0.0%) |
| $25,000 to $34,999 | 0 (0.0%) | 0 (0.0%) |
| $35,000 to $49,999 | 9 (17.0%) | 0 (0.0%) |
| $50,000 to $74,999 | 10 (18.9%) | 0 (0.0%) |
| $75,000 to $99,999 | 9 (17.0%) | 0 (0.0%) |
| $100,000 to $149,999 | 0 (0.0%) | 0 (0.0%) |
| $150,000 or more | 7 (13.2%) | 16 (100.0%) |
| Total | 53 (100.0%) | 16 (100.0%) |
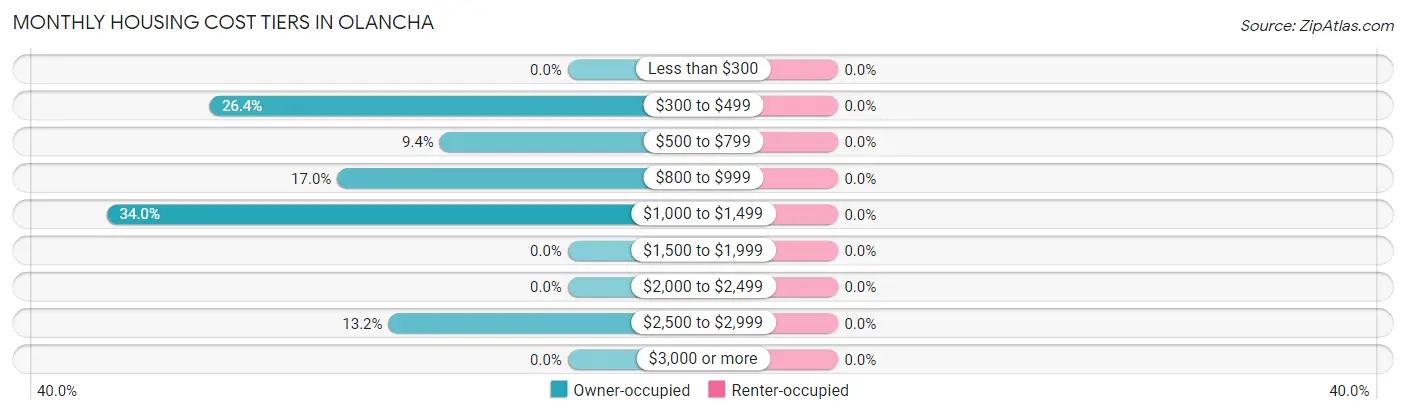
Monthly Housing Cost Tiers in Olancha
| Monthly Cost | Owner-occupied | Renter-occupied |
| Less than $300 | 0 (0.0%) | 0 (0.0%) |
| $300 to $499 | 14 (26.4%) | 0 (0.0%) |
| $500 to $799 | 5 (9.4%) | 0 (0.0%) |
| $800 to $999 | 9 (17.0%) | 0 (0.0%) |
| $1,000 to $1,499 | 18 (34.0%) | 0 (0.0%) |
| $1,500 to $1,999 | 0 (0.0%) | 0 (0.0%) |
| $2,000 to $2,499 | 0 (0.0%) | 0 (0.0%) |
| $2,500 to $2,999 | 7 (13.2%) | 0 (0.0%) |
| $3,000 or more | 0 (0.0%) | 0 (0.0%) |
| Total | 53 (100.0%) | 16 (100.0%) |
Physical Housing Characteristics in Olancha
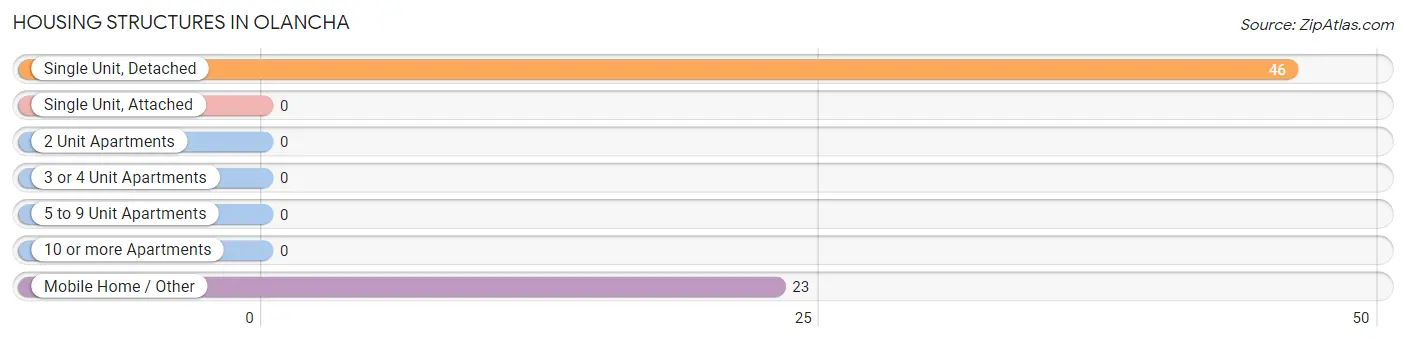
Housing Structures in Olancha
| Structure Type | # Housing Units | % Housing Units |
| Single Unit, Detached | 46 | 66.7% |
| Single Unit, Attached | 0 | 0.0% |
| 2 Unit Apartments | 0 | 0.0% |
| 3 or 4 Unit Apartments | 0 | 0.0% |
| 5 to 9 Unit Apartments | 0 | 0.0% |
| 10 or more Apartments | 0 | 0.0% |
| Mobile Home / Other | 23 | 33.3% |
| Total | 69 | 100.0% |
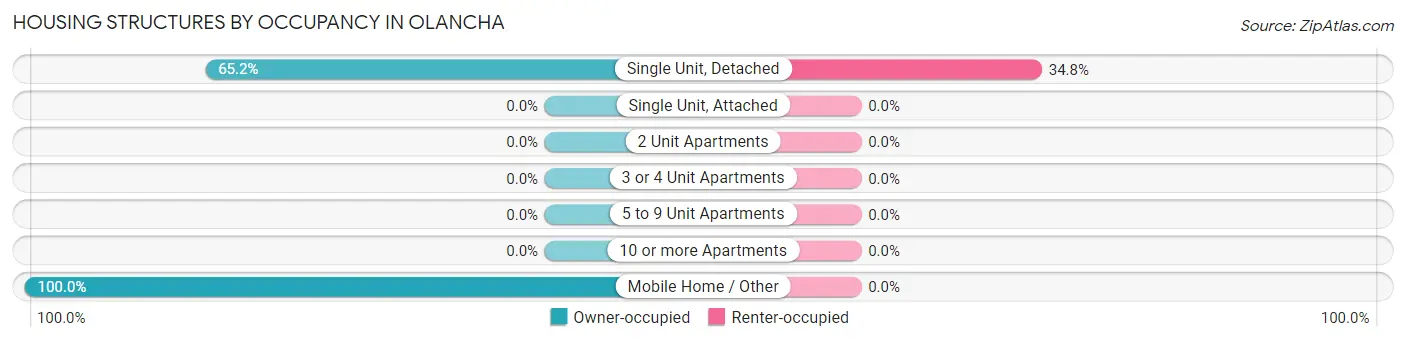
Housing Structures by Occupancy in Olancha
| Structure Type | Owner-occupied | Renter-occupied |
| Single Unit, Detached | 30 (65.2%) | 16 (34.8%) |
| Single Unit, Attached | 0 (0.0%) | 0 (0.0%) |
| 2 Unit Apartments | 0 (0.0%) | 0 (0.0%) |
| 3 or 4 Unit Apartments | 0 (0.0%) | 0 (0.0%) |
| 5 to 9 Unit Apartments | 0 (0.0%) | 0 (0.0%) |
| 10 or more Apartments | 0 (0.0%) | 0 (0.0%) |
| Mobile Home / Other | 23 (100.0%) | 0 (0.0%) |
| Total | 53 (76.8%) | 16 (23.2%) |
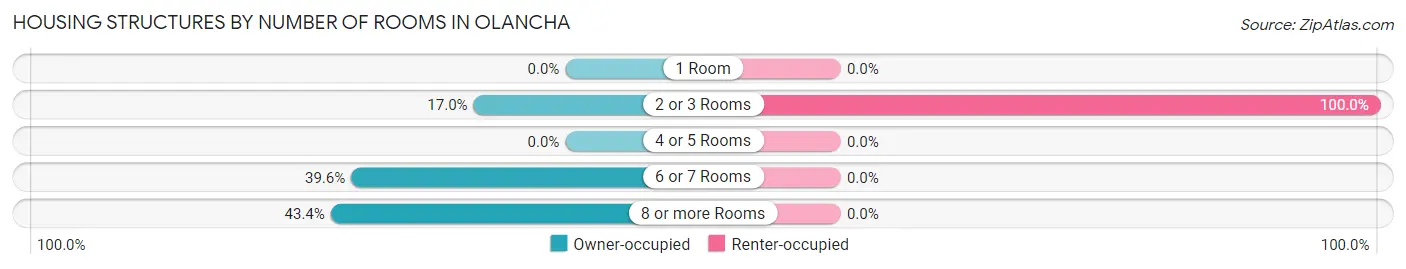
Housing Structures by Number of Rooms in Olancha
| Number of Rooms | Owner-occupied | Renter-occupied |
| 1 Room | 0 (0.0%) | 0 (0.0%) |
| 2 or 3 Rooms | 9 (17.0%) | 16 (100.0%) |
| 4 or 5 Rooms | 0 (0.0%) | 0 (0.0%) |
| 6 or 7 Rooms | 21 (39.6%) | 0 (0.0%) |
| 8 or more Rooms | 23 (43.4%) | 0 (0.0%) |
| Total | 53 (100.0%) | 16 (100.0%) |
Housing Structure by Heating Type in Olancha
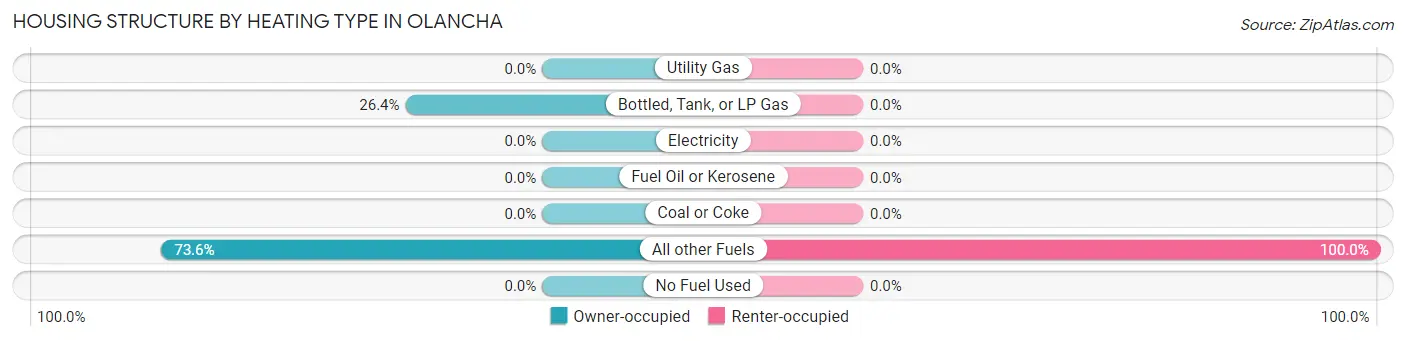
| Heating Type | Owner-occupied | Renter-occupied |
| Utility Gas | 0 (0.0%) | 0 (0.0%) |
| Bottled, Tank, or LP Gas | 14 (26.4%) | 0 (0.0%) |
| Electricity | 0 (0.0%) | 0 (0.0%) |
| Fuel Oil or Kerosene | 0 (0.0%) | 0 (0.0%) |
| Coal or Coke | 0 (0.0%) | 0 (0.0%) |
| All other Fuels | 39 (73.6%) | 16 (100.0%) |
| No Fuel Used | 0 (0.0%) | 0 (0.0%) |
| Total | 53 (100.0%) | 16 (100.0%) |
Household Vehicle Usage in Olancha
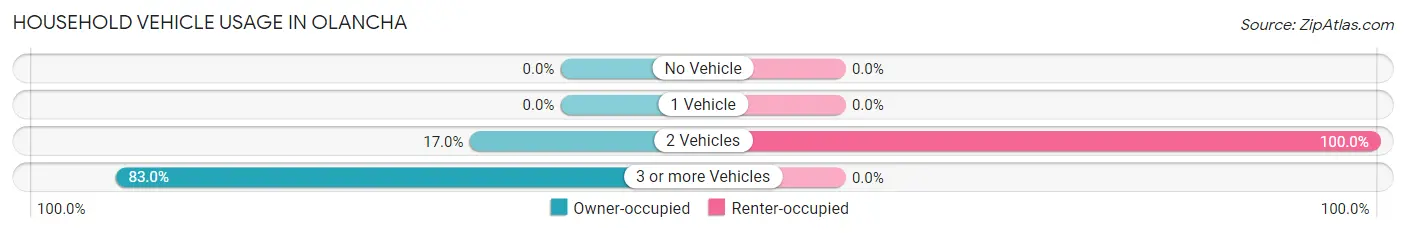
| Vehicles per Household | Owner-occupied | Renter-occupied |
| No Vehicle | 0 (0.0%) | 0 (0.0%) |
| 1 Vehicle | 0 (0.0%) | 0 (0.0%) |
| 2 Vehicles | 9 (17.0%) | 16 (100.0%) |
| 3 or more Vehicles | 44 (83.0%) | 0 (0.0%) |
| Total | 53 (100.0%) | 16 (100.0%) |
Real Estate & Mortgages in Olancha
Real Estate and Mortgage Overview in Olancha
| Characteristic | Without Mortgage | With Mortgage |
| Housing Units | 28 | 25 |
| Median Property Value | - | - |
| Median Household Income | $68,750 | $7 |
| Monthly Housing Costs | $600 | $0 |
| Real Estate Taxes | $1,250 | $0 |
Property Value by Mortgage Status in Olancha
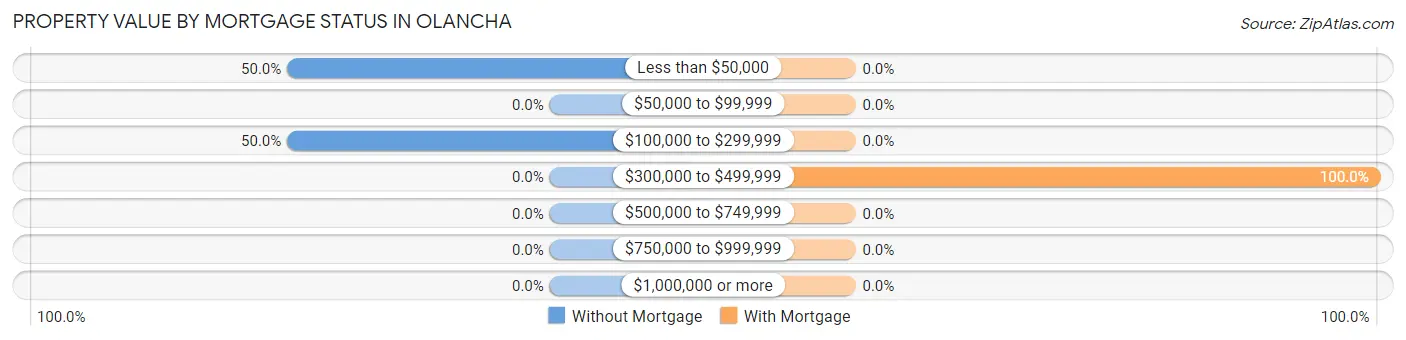
| Property Value | Without Mortgage | With Mortgage |
| Less than $50,000 | 14 (50.0%) | 0 (0.0%) |
| $50,000 to $99,999 | 0 (0.0%) | 0 (0.0%) |
| $100,000 to $299,999 | 14 (50.0%) | 0 (0.0%) |
| $300,000 to $499,999 | 0 (0.0%) | 25 (100.0%) |
| $500,000 to $749,999 | 0 (0.0%) | 0 (0.0%) |
| $750,000 to $999,999 | 0 (0.0%) | 0 (0.0%) |
| $1,000,000 or more | 0 (0.0%) | 0 (0.0%) |
| Total | 28 (100.0%) | 25 (100.0%) |
Household Income by Mortgage Status in Olancha
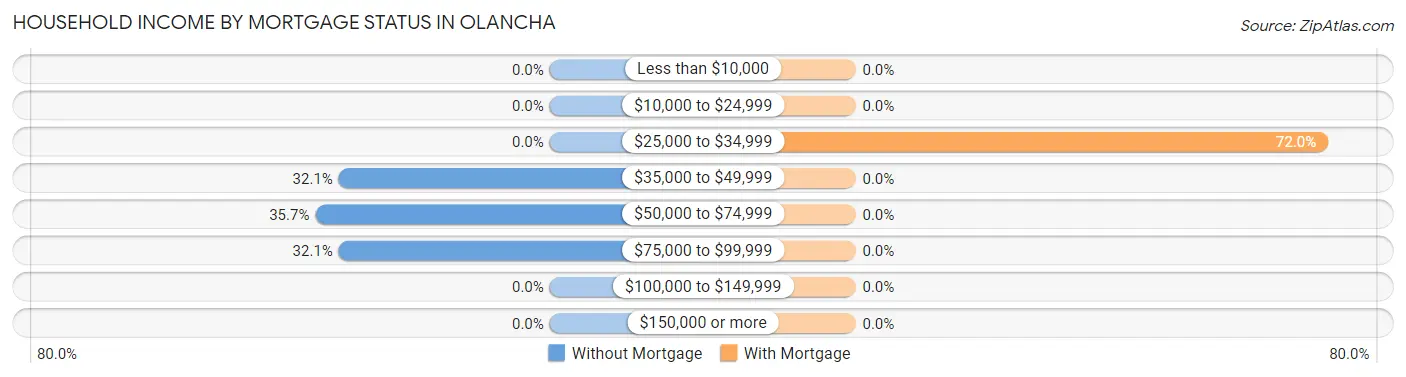
| Household Income | Without Mortgage | With Mortgage |
| Less than $10,000 | 0 (0.0%) | 0 (0.0%) |
| $10,000 to $24,999 | 0 (0.0%) | 0 (0.0%) |
| $25,000 to $34,999 | 0 (0.0%) | 18 (72.0%) |
| $35,000 to $49,999 | 9 (32.1%) | 0 (0.0%) |
| $50,000 to $74,999 | 10 (35.7%) | 0 (0.0%) |
| $75,000 to $99,999 | 9 (32.1%) | 0 (0.0%) |
| $100,000 to $149,999 | 0 (0.0%) | 0 (0.0%) |
| $150,000 or more | 0 (0.0%) | 0 (0.0%) |
| Total | 28 (100.0%) | 25 (100.0%) |
Property Value to Household Income Ratio in Olancha
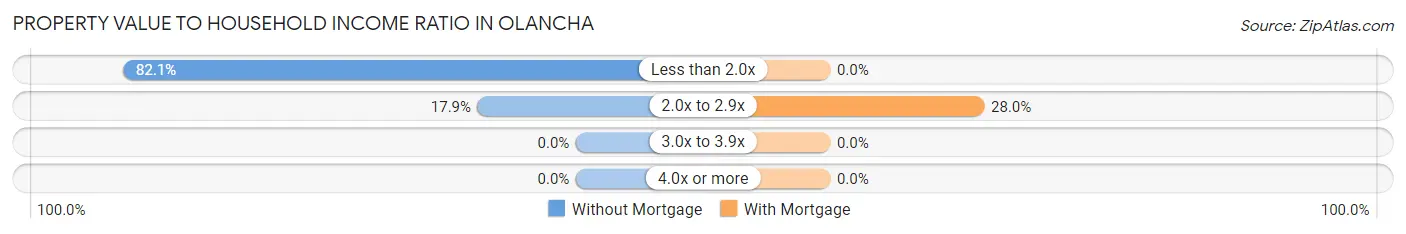
| Value-to-Income Ratio | Without Mortgage | With Mortgage |
| Less than 2.0x | 23 (82.1%) | 0 (0.0%) |
| 2.0x to 2.9x | 5 (17.9%) | 7 (28.0%) |
| 3.0x to 3.9x | 0 (0.0%) | 0 (0.0%) |
| 4.0x or more | 0 (0.0%) | 0 (0.0%) |
| Total | 28 (100.0%) | 25 (100.0%) |
Real Estate Taxes by Mortgage Status in Olancha
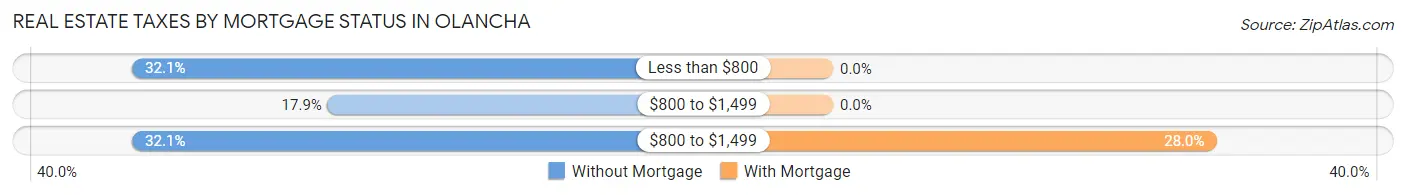
| Property Taxes | Without Mortgage | With Mortgage |
| Less than $800 | 9 (32.1%) | 0 (0.0%) |
| $800 to $1,499 | 5 (17.9%) | 0 (0.0%) |
| $800 to $1,499 | 9 (32.1%) | 7 (28.0%) |
| Total | 28 (100.0%) | 25 (100.0%) |
Health & Disability in Olancha
Health Insurance Coverage by Age in Olancha
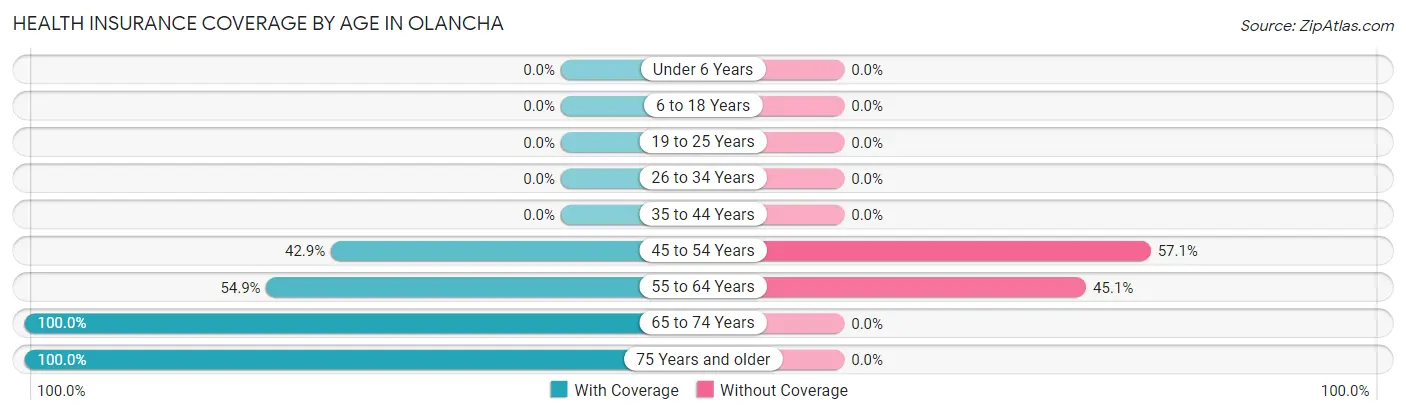
| Age Bracket | With Coverage | Without Coverage |
| Under 6 Years | 0 (0.0%) | 0 (0.0%) |
| 6 to 18 Years | 0 (0.0%) | 0 (0.0%) |
| 19 to 25 Years | 0 (0.0%) | 0 (0.0%) |
| 26 to 34 Years | 0 (0.0%) | 0 (0.0%) |
| 35 to 44 Years | 0 (0.0%) | 0 (0.0%) |
| 45 to 54 Years | 21 (42.9%) | 28 (57.1%) |
| 55 to 64 Years | 28 (54.9%) | 23 (45.1%) |
| 65 to 74 Years | 62 (100.0%) | 0 (0.0%) |
| 75 Years and older | 9 (100.0%) | 0 (0.0%) |
| Total | 120 (70.2%) | 51 (29.8%) |
Health Insurance Coverage by Citizenship Status in Olancha

| Citizenship Status | With Coverage | Without Coverage |
| Native Born | 0 (0.0%) | 0 (0.0%) |
| Foreign Born, Citizen | 0 (0.0%) | 0 (0.0%) |
| Foreign Born, not a Citizen | 0 (0.0%) | 0 (0.0%) |
Health Insurance Coverage by Household Income in Olancha
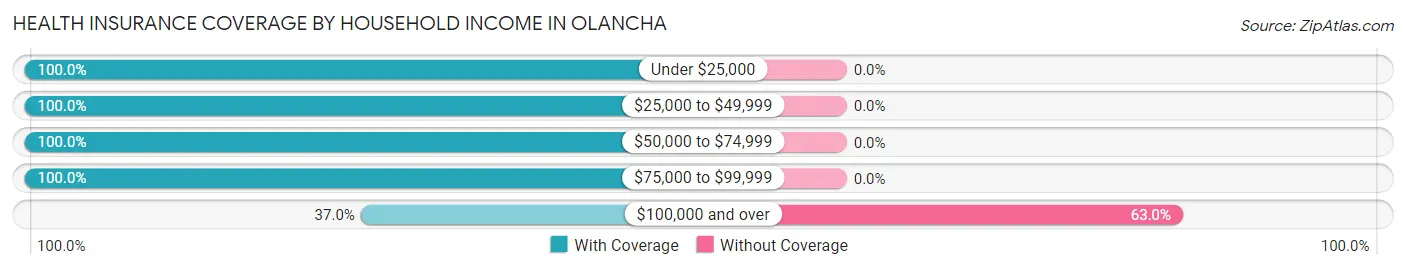
| Household Income | With Coverage | Without Coverage |
| Under $25,000 | 36 (100.0%) | 0 (0.0%) |
| $25,000 to $49,999 | 9 (100.0%) | 0 (0.0%) |
| $50,000 to $74,999 | 23 (100.0%) | 0 (0.0%) |
| $75,000 to $99,999 | 22 (100.0%) | 0 (0.0%) |
| $100,000 and over | 30 (37.0%) | 51 (63.0%) |
Public vs Private Health Insurance Coverage by Age in Olancha
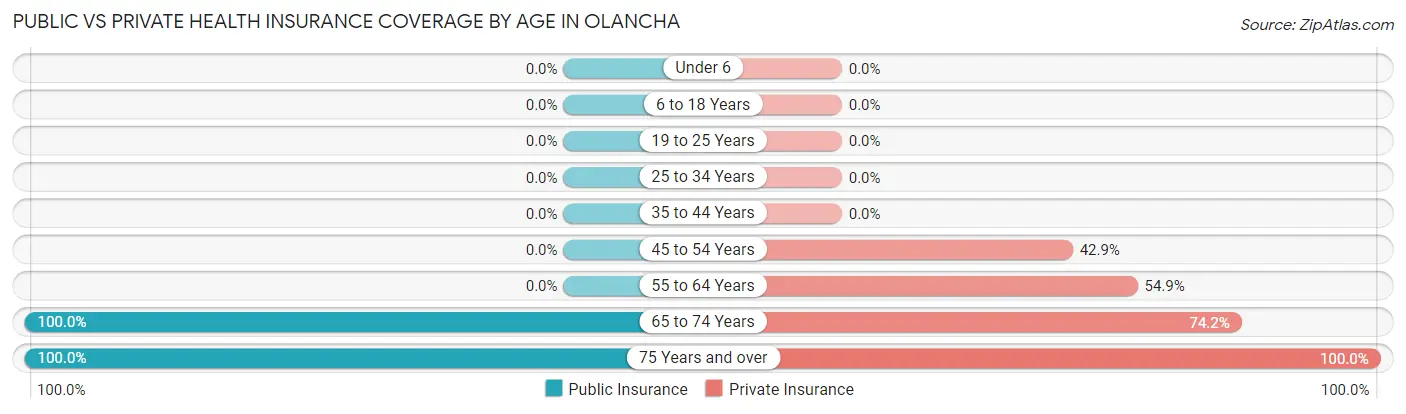
| Age Bracket | Public Insurance | Private Insurance |
| Under 6 | 0 (0.0%) | 0 (0.0%) |
| 6 to 18 Years | 0 (0.0%) | 0 (0.0%) |
| 19 to 25 Years | 0 (0.0%) | 0 (0.0%) |
| 25 to 34 Years | 0 (0.0%) | 0 (0.0%) |
| 35 to 44 Years | 0 (0.0%) | 0 (0.0%) |
| 45 to 54 Years | 0 (0.0%) | 21 (42.9%) |
| 55 to 64 Years | 0 (0.0%) | 28 (54.9%) |
| 65 to 74 Years | 62 (100.0%) | 46 (74.2%) |
| 75 Years and over | 9 (100.0%) | 9 (100.0%) |
| Total | 71 (41.5%) | 104 (60.8%) |
Disability Status by Sex by Age in Olancha
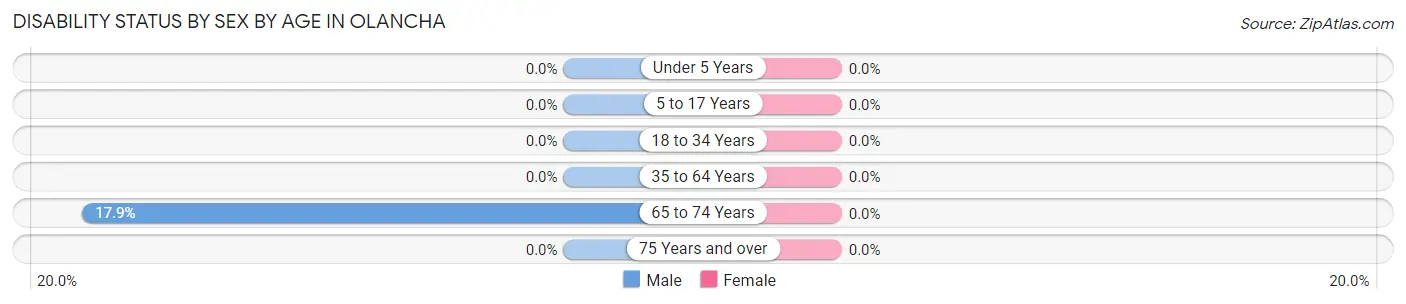
| Age Bracket | Male | Female |
| Under 5 Years | 0 (0.0%) | 0 (0.0%) |
| 5 to 17 Years | 0 (0.0%) | 0 (0.0%) |
| 18 to 34 Years | 0 (0.0%) | 0 (0.0%) |
| 35 to 64 Years | 0 (0.0%) | 0 (0.0%) |
| 65 to 74 Years | 5 (17.9%) | 0 (0.0%) |
| 75 Years and over | 0 (0.0%) | 0 (0.0%) |
Disability Class by Sex by Age in Olancha
Disability Class: Hearing Difficulty
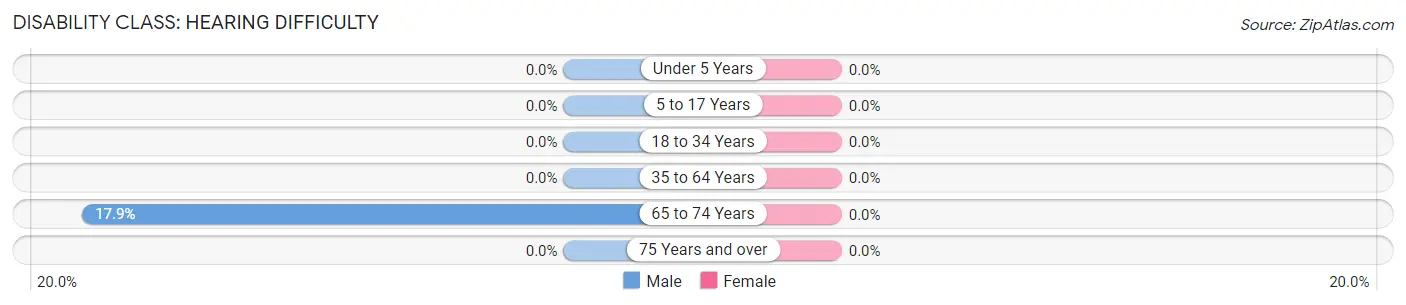
| Age Bracket | Male | Female |
| Under 5 Years | 0 (0.0%) | 0 (0.0%) |
| 5 to 17 Years | 0 (0.0%) | 0 (0.0%) |
| 18 to 34 Years | 0 (0.0%) | 0 (0.0%) |
| 35 to 64 Years | 0 (0.0%) | 0 (0.0%) |
| 65 to 74 Years | 5 (17.9%) | 0 (0.0%) |
| 75 Years and over | 0 (0.0%) | 0 (0.0%) |
Disability Class: Vision Difficulty
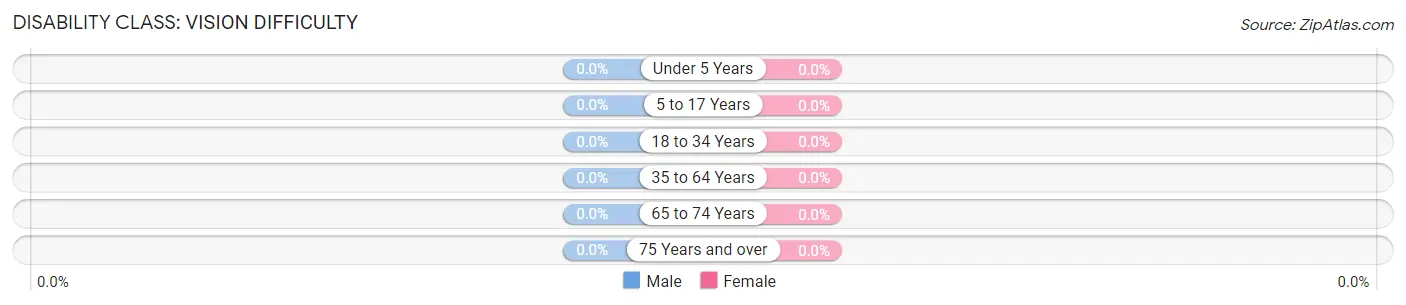
| Age Bracket | Male | Female |
| Under 5 Years | 0 (0.0%) | 0 (0.0%) |
| 5 to 17 Years | 0 (0.0%) | 0 (0.0%) |
| 18 to 34 Years | 0 (0.0%) | 0 (0.0%) |
| 35 to 64 Years | 0 (0.0%) | 0 (0.0%) |
| 65 to 74 Years | 0 (0.0%) | 0 (0.0%) |
| 75 Years and over | 0 (0.0%) | 0 (0.0%) |
Disability Class: Cognitive Difficulty
| Age Bracket | Male | Female |
| 5 to 17 Years | 0 (0.0%) | 0 (0.0%) |
| 18 to 34 Years | 0 (0.0%) | 0 (0.0%) |
| 35 to 64 Years | 0 (0.0%) | 0 (0.0%) |
| 65 to 74 Years | 0 (0.0%) | 0 (0.0%) |
| 75 Years and over | 0 (0.0%) | 0 (0.0%) |
Disability Class: Ambulatory Difficulty
| Age Bracket | Male | Female |
| 5 to 17 Years | 0 (0.0%) | 0 (0.0%) |
| 18 to 34 Years | 0 (0.0%) | 0 (0.0%) |
| 35 to 64 Years | 0 (0.0%) | 0 (0.0%) |
| 65 to 74 Years | 0 (0.0%) | 0 (0.0%) |
| 75 Years and over | 0 (0.0%) | 0 (0.0%) |
Disability Class: Self-Care Difficulty
| Age Bracket | Male | Female |
| 5 to 17 Years | 0 (0.0%) | 0 (0.0%) |
| 18 to 34 Years | 0 (0.0%) | 0 (0.0%) |
| 35 to 64 Years | 0 (0.0%) | 0 (0.0%) |
| 65 to 74 Years | 0 (0.0%) | 0 (0.0%) |
| 75 Years and over | 0 (0.0%) | 0 (0.0%) |
Technology Access in Olancha
Computing Device Access in Olancha
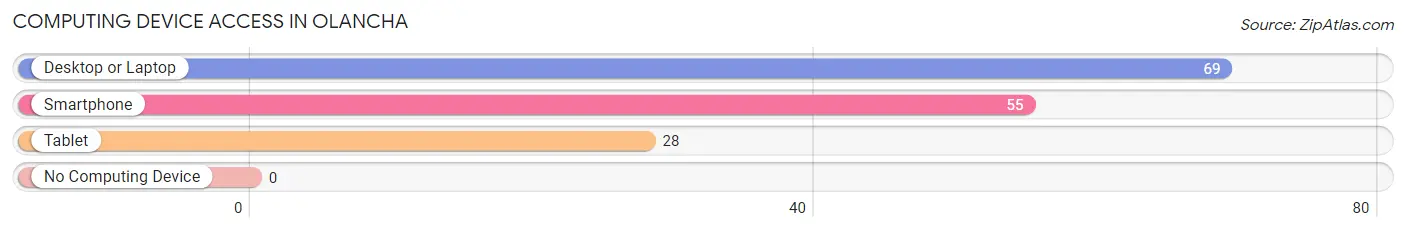
| Device Type | # Households | % Households |
| Desktop or Laptop | 69 | 100.0% |
| Smartphone | 55 | 79.7% |
| Tablet | 28 | 40.6% |
| No Computing Device | 0 | 0.0% |
| Total | 69 | 100.0% |
Internet Access in Olancha
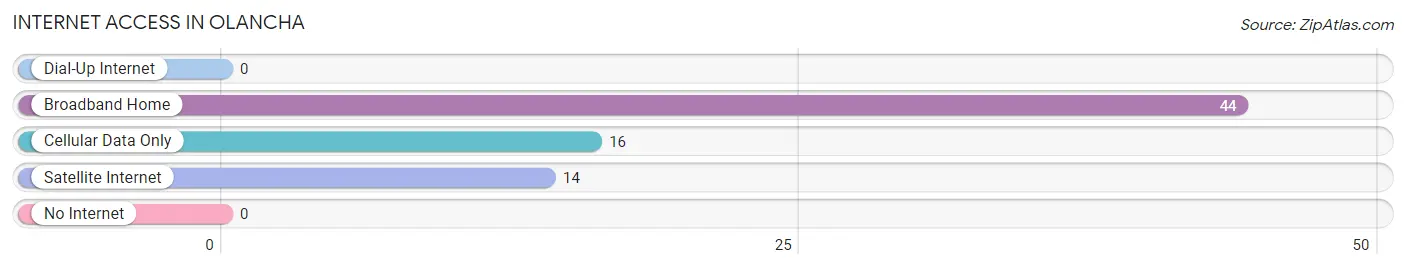
| Internet Type | # Households | % Households |
| Dial-Up Internet | 0 | 0.0% |
| Broadband Home | 44 | 63.8% |
| Cellular Data Only | 16 | 23.2% |
| Satellite Internet | 14 | 20.3% |
| No Internet | 0 | 0.0% |
| Total | 69 | 100.0% |
Olancha Summary
Olancha is a small unincorporated community located in the Owens Valley of Inyo County, California. It is situated at the base of the Sierra Nevada mountain range, approximately 20 miles south of the town of Independence. The population of Olancha was estimated to be around 200 people in 2020.
History
The area around Olancha has been inhabited for thousands of years by the Paiute and Shoshone Native American tribes. The first European settlers arrived in the area in the late 19th century, and the town of Olancha was established in 1883. The town was named after a Paiute chief, Olancha, who lived in the area.
The town was initially a mining town, with gold and silver being mined in the nearby hills. The town also served as a stop on the Carson and Colorado Railroad, which ran from Mound House, Nevada to Keeler, California. The railroad was used to transport ore from the mines to the nearby towns of Independence and Lone Pine.
In the early 20th century, the town began to decline as the mines were depleted and the railroad was abandoned. The town was nearly abandoned by the 1950s, but it experienced a resurgence in the 1970s when it became a popular destination for off-road vehicle enthusiasts.
Geography
Olancha is located in the Owens Valley of Inyo County, California. It is situated at the base of the Sierra Nevada mountain range, approximately 20 miles south of the town of Independence. The town is located at an elevation of 4,000 feet, and the surrounding area is mostly desert.
The town is located near the Owens River, which is a major source of water for the area. The nearby Owens Lake is a popular destination for bird watching and other outdoor activities.
Economy
The economy of Olancha is largely based on tourism. The town is a popular destination for off-road vehicle enthusiasts, and it is also a popular stop for travelers on their way to the nearby towns of Independence and Lone Pine.
The town also has a few small businesses, including a gas station, a convenience store, and a few restaurants. The nearby Owens Valley is also home to several ranches and farms, which provide employment for some of the town's residents.
Demographics
The population of Olancha was estimated to be around 200 people in 2020. The town is predominantly white, with a small Hispanic population. The median household income in the town is around $30,000, and the median home value is around $100,000.
Conclusion
Olancha is a small unincorporated community located in the Owens Valley of Inyo County, California. It is situated at the base of the Sierra Nevada mountain range, approximately 20 miles south of the town of Independence. The population of Olancha was estimated to be around 200 people in 2020. The town is predominantly white, with a small Hispanic population. The economy of Olancha is largely based on tourism, and the town is a popular destination for off-road vehicle enthusiasts. The nearby Owens Valley is also home to several ranches and farms, which provide employment for some of the town's residents.
Common Questions
What is Per Capita Income in Olancha?
Per Capita income in Olancha is $47,638.
What is Income or Wage Gap in Olancha?
Income or Wage Gap in Olancha is 12.4%.
Women in Olancha earn 87.6 cents for every dollar earned by a man.
What is Inequality or Gini Index in Olancha?
Inequality or Gini Index in Olancha is 0.39.
What is the Total Population of Olancha?
Total Population of Olancha is 171.
What is the Total Male Population of Olancha?
Total Male Population of Olancha is 95.
What is the Total Female Population of Olancha?
Total Female Population of Olancha is 76.
What is the Ratio of Males per 100 Females in Olancha?
There are 125.00 Males per 100 Females in Olancha.
What is the Ratio of Females per 100 Males in Olancha?
There are 80.00 Females per 100 Males in Olancha.
What is the Median Population Age in Olancha?
Median Population Age in Olancha is 60.5 Years.
What is the Average Family Size in Olancha
Average Family Size in Olancha is 2.7 People.
What is the Average Household Size in Olancha
Average Household Size in Olancha is 2.5 People.
How Large is the Labor Force in Olancha?
There are 86 People in the Labor Forcein in Olancha.
What is the Percentage of People in the Labor Force in Olancha?
50.3% of People are in the Labor Force in Olancha.