Bret Harte, CA Map & Demographics
Bret Harte Map
Bret Harte Overview
$12,497
PER CAPITA INCOME
$32,237
AVG FAMILY INCOME
$36,125
AVG HOUSEHOLD INCOME
35.2%
WAGE / INCOME GAP [ % ]
64.8¢/ $1
WAGE / INCOME GAP [ $ ]
0.42
INEQUALITY / GINI INDEX
4,926
TOTAL POPULATION
2,613
MALE POPULATION
2,313
FEMALE POPULATION
112.97
MALES / 100 FEMALES
88.52
FEMALES / 100 MALES
22.6
MEDIAN AGE
4.7
AVG FAMILY SIZE
4.3
AVG HOUSEHOLD SIZE
1,722
LABOR FORCE [ PEOPLE ]
55.4%
PERCENT IN LABOR FORCE
12.6%
UNEMPLOYMENT RATE
Income in Bret Harte
Income Overview in Bret Harte
Per Capita Income in Bret Harte is $12,497, while median incomes of families and households are $32,237 and $36,125 respectively.
| Characteristic | Number | Measure |
| Per Capita Income | 4,926 | $12,497 |
| Median Family Income | 952 | $32,237 |
| Mean Family Income | 952 | $50,807 |
| Median Household Income | 1,147 | $36,125 |
| Mean Household Income | 1,147 | $52,143 |
| Income Deficit | 952 | $0 |
| Wage / Income Gap (%) | 4,926 | 35.18% |
| Wage / Income Gap ($) | 4,926 | 64.82¢ per $1 |
| Gini / Inequality Index | 4,926 | 0.42 |
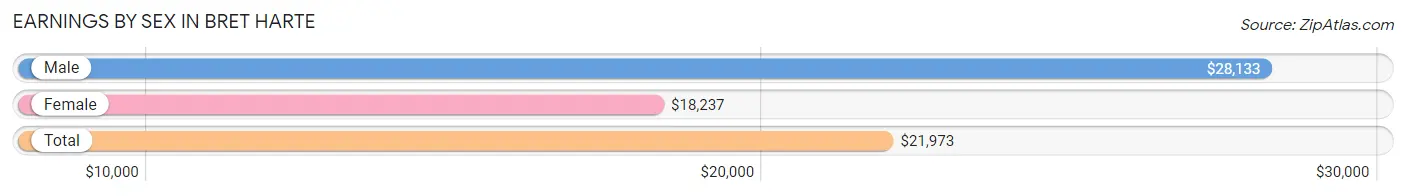
Earnings by Sex in Bret Harte
Average Earnings in Bret Harte are $21,973, $28,133 for men and $18,237 for women, a difference of 35.2%.
| Sex | Number | Average Earnings |
| Male | 1,101 (61.9%) | $28,133 |
| Female | 679 (38.2%) | $18,237 |
| Total | 1,780 (100.0%) | $21,973 |
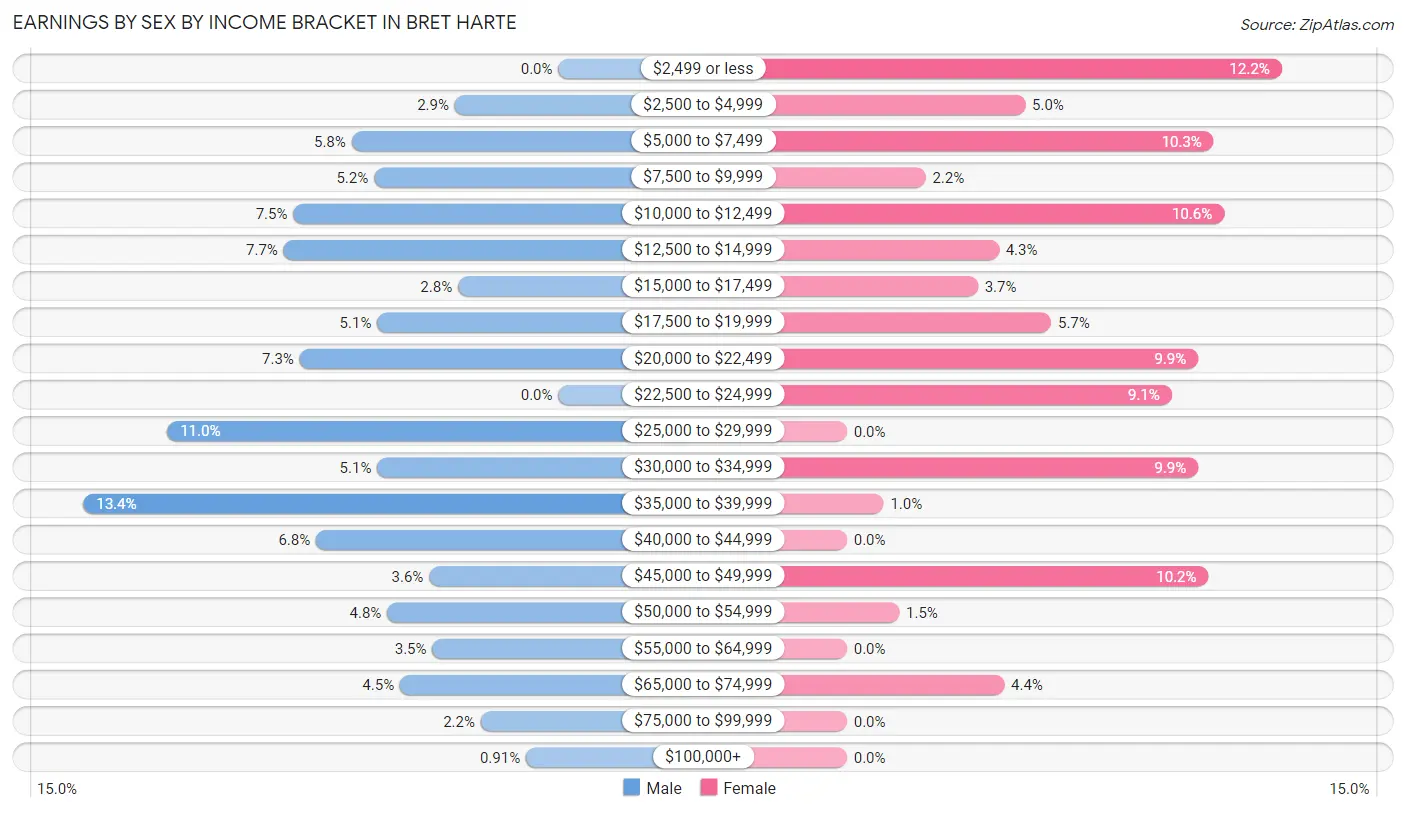
Earnings by Sex by Income Bracket in Bret Harte
The most common earnings brackets in Bret Harte are $35,000 to $39,999 for men (147 | 13.4%) and $2,499 or less for women (83 | 12.2%).
| Income | Male | Female |
| $2,499 or less | 0 (0.0%) | 83 (12.2%) |
| $2,500 to $4,999 | 32 (2.9%) | 34 (5.0%) |
| $5,000 to $7,499 | 64 (5.8%) | 70 (10.3%) |
| $7,500 to $9,999 | 57 (5.2%) | 15 (2.2%) |
| $10,000 to $12,499 | 82 (7.4%) | 72 (10.6%) |
| $12,500 to $14,999 | 85 (7.7%) | 29 (4.3%) |
| $15,000 to $17,499 | 31 (2.8%) | 25 (3.7%) |
| $17,500 to $19,999 | 56 (5.1%) | 39 (5.7%) |
| $20,000 to $22,499 | 80 (7.3%) | 67 (9.9%) |
| $22,500 to $24,999 | 0 (0.0%) | 62 (9.1%) |
| $25,000 to $29,999 | 121 (11.0%) | 0 (0.0%) |
| $30,000 to $34,999 | 56 (5.1%) | 67 (9.9%) |
| $35,000 to $39,999 | 147 (13.4%) | 7 (1.0%) |
| $40,000 to $44,999 | 75 (6.8%) | 0 (0.0%) |
| $45,000 to $49,999 | 40 (3.6%) | 69 (10.2%) |
| $50,000 to $54,999 | 53 (4.8%) | 10 (1.5%) |
| $55,000 to $64,999 | 39 (3.5%) | 0 (0.0%) |
| $65,000 to $74,999 | 49 (4.4%) | 30 (4.4%) |
| $75,000 to $99,999 | 24 (2.2%) | 0 (0.0%) |
| $100,000+ | 10 (0.9%) | 0 (0.0%) |
| Total | 1,101 (100.0%) | 679 (100.0%) |
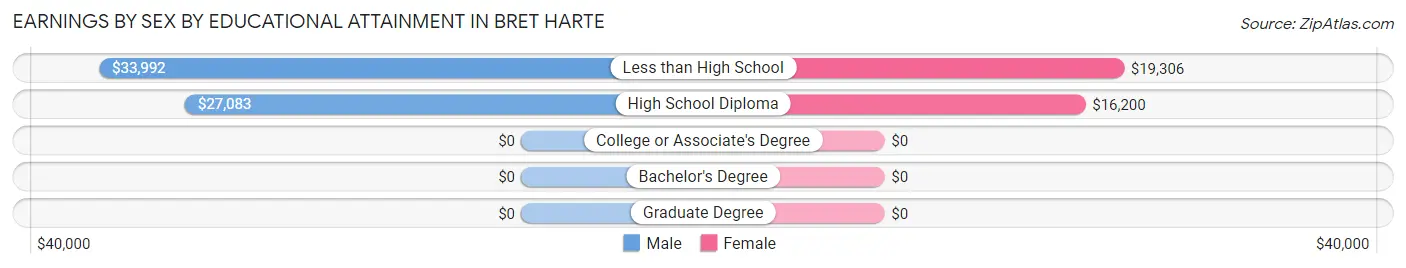
Earnings by Sex by Educational Attainment in Bret Harte
Average earnings in Bret Harte are $29,167 for men and $18,397 for women, a difference of 36.9%. Men with an educational attainment of less than high school enjoy the highest average annual earnings of $33,992, while those with high school diploma education earn the least with $27,083. Women with an educational attainment of less than high school earn the most with the average annual earnings of $19,306, while those with high school diploma education have the smallest earnings of $16,200.
| Educational Attainment | Male Income | Female Income |
| Less than High School | $33,992 | $19,306 |
| High School Diploma | $27,083 | $16,200 |
| College or Associate's Degree | - | - |
| Bachelor's Degree | - | - |
| Graduate Degree | - | - |
| Total | $29,167 | $18,397 |
Family Income in Bret Harte
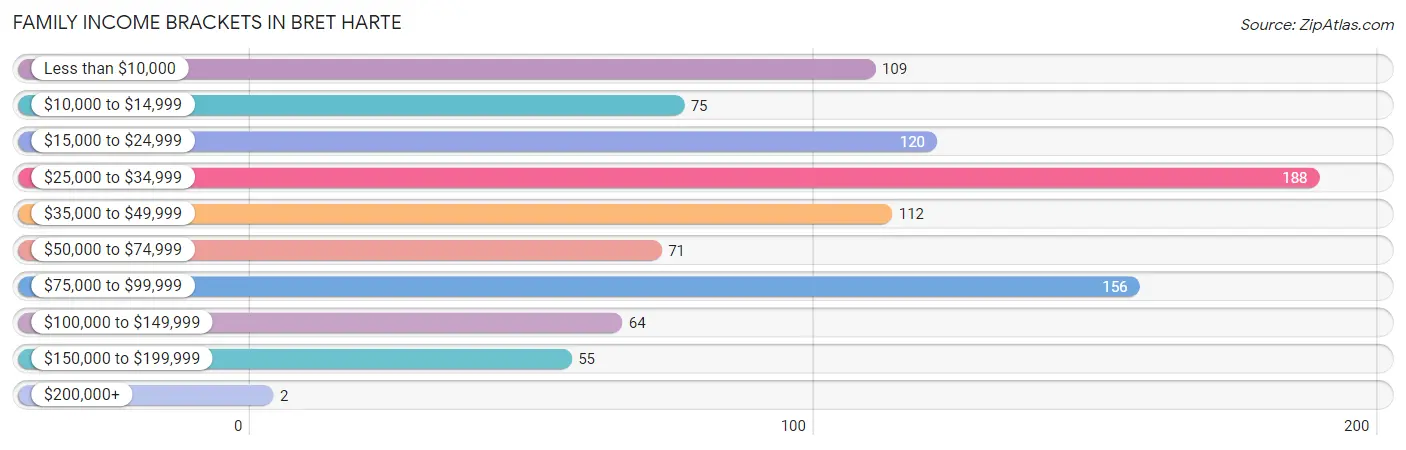
Family Income Brackets in Bret Harte
According to the Bret Harte family income data, there are 188 families falling into the $25,000 to $34,999 income range, which is the most common income bracket and makes up 19.8% of all families. Conversely, the $200,000+ income bracket is the least frequent group with only 2 families (0.2%) belonging to this category.
| Income Bracket | # Families | % Families |
| Less than $10,000 | 109 | 11.4% |
| $10,000 to $14,999 | 75 | 7.9% |
| $15,000 to $24,999 | 120 | 12.6% |
| $25,000 to $34,999 | 188 | 19.7% |
| $35,000 to $49,999 | 112 | 11.8% |
| $50,000 to $74,999 | 71 | 7.5% |
| $75,000 to $99,999 | 156 | 16.4% |
| $100,000 to $149,999 | 64 | 6.7% |
| $150,000 to $199,999 | 55 | 5.8% |
| $200,000+ | 2 | 0.2% |
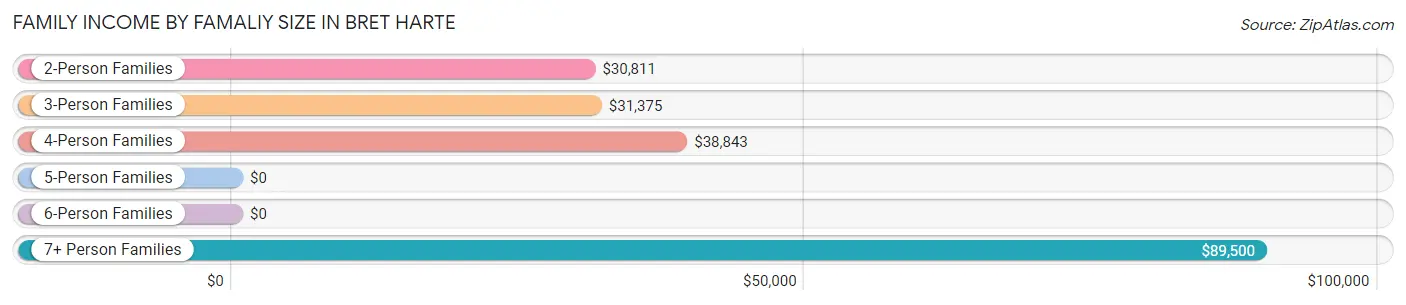
Family Income by Famaliy Size in Bret Harte
7+ person families (138 | 14.5%) account for the highest median family income in Bret Harte with $89,500 per family, while 2-person families (188 | 19.8%) have the highest median income of $15,406 per family member.
| Income Bracket | # Families | Median Income |
| 2-Person Families | 188 (19.8%) | $30,811 |
| 3-Person Families | 162 (17.0%) | $31,375 |
| 4-Person Families | 199 (20.9%) | $38,843 |
| 5-Person Families | 240 (25.2%) | $0 |
| 6-Person Families | 25 (2.6%) | $0 |
| 7+ Person Families | 138 (14.5%) | $89,500 |
| Total | 952 (100.0%) | $32,237 |
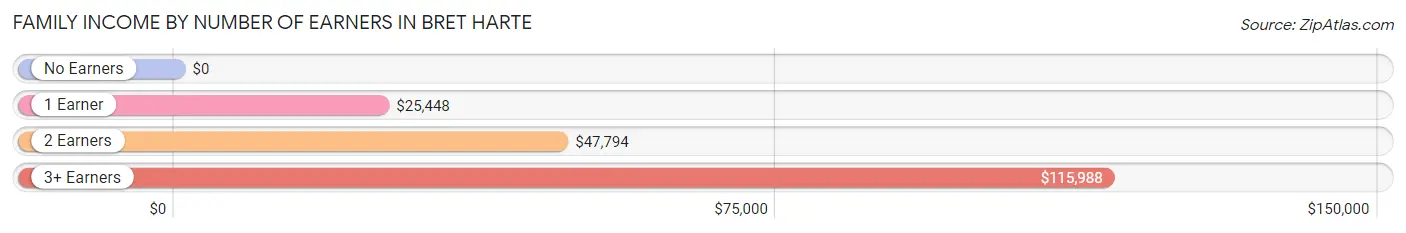
Family Income by Number of Earners in Bret Harte
| Number of Earners | # Families | Median Income |
| No Earners | 93 (9.8%) | $0 |
| 1 Earner | 439 (46.1%) | $25,448 |
| 2 Earners | 234 (24.6%) | $47,794 |
| 3+ Earners | 186 (19.5%) | $115,988 |
| Total | 952 (100.0%) | $32,237 |
Household Income in Bret Harte
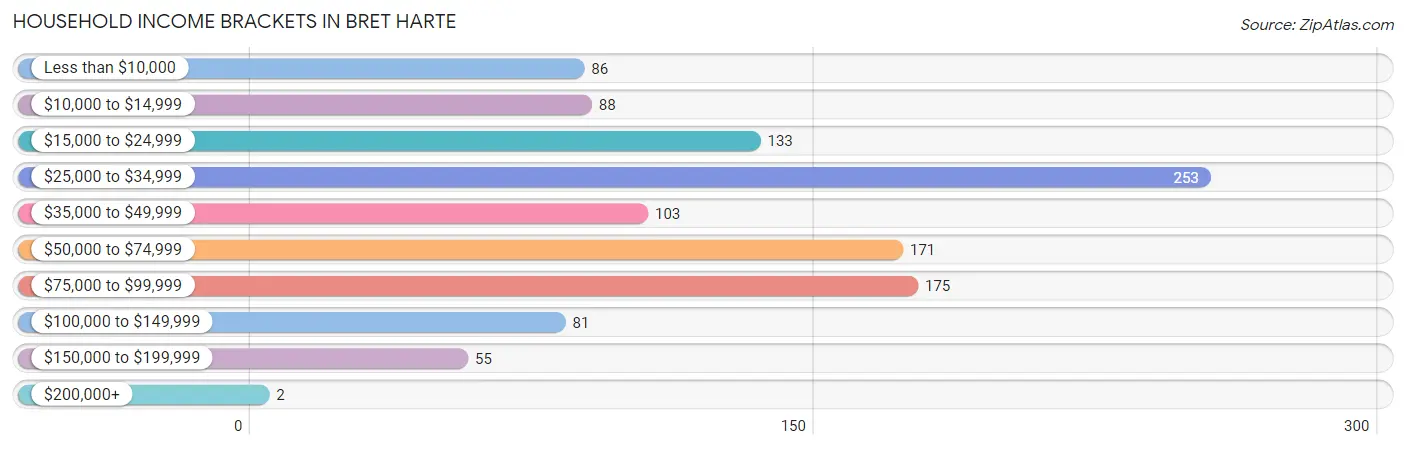
Household Income Brackets in Bret Harte
With 253 households falling in the category, the $25,000 to $34,999 income range is the most frequent in Bret Harte, accounting for 22.1% of all households. In contrast, only 2 households (0.2%) fall into the $200,000+ income bracket, making it the least populous group.
| Income Bracket | # Households | % Households |
| Less than $10,000 | 86 | 7.5% |
| $10,000 to $14,999 | 88 | 7.7% |
| $15,000 to $24,999 | 133 | 11.6% |
| $25,000 to $34,999 | 253 | 22.1% |
| $35,000 to $49,999 | 103 | 9.0% |
| $50,000 to $74,999 | 171 | 14.9% |
| $75,000 to $99,999 | 175 | 15.3% |
| $100,000 to $149,999 | 81 | 7.1% |
| $150,000 to $199,999 | 55 | 4.8% |
| $200,000+ | 2 | 0.2% |
Household Income by Householder Age in Bret Harte
The median household income in Bret Harte is $36,125, with the highest median household income of $58,056 found in the 45 to 64 years age bracket for the primary householder. A total of 420 households (36.6%) fall into this category. Meanwhile, the 15 to 24 years age bracket for the primary householder has the lowest median household income of $0, with 17 households (1.5%) in this group.
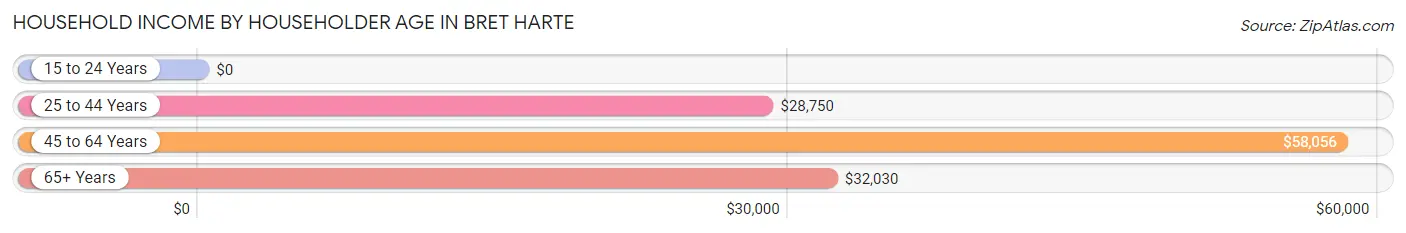
| Income Bracket | # Households | Median Income |
| 15 to 24 Years | 17 (1.5%) | $0 |
| 25 to 44 Years | 527 (46.0%) | $28,750 |
| 45 to 64 Years | 420 (36.6%) | $58,056 |
| 65+ Years | 183 (16.0%) | $32,030 |
| Total | 1,147 (100.0%) | $36,125 |
Poverty in Bret Harte
Income Below Poverty by Sex and Age in Bret Harte
With 39.0% poverty level for males and 43.1% for females among the residents of Bret Harte, 5 year old males and 16 and 17 year old females are the most vulnerable to poverty, with 61 males (88.4%) and 59 females (86.8%) in their respective age groups living below the poverty level.
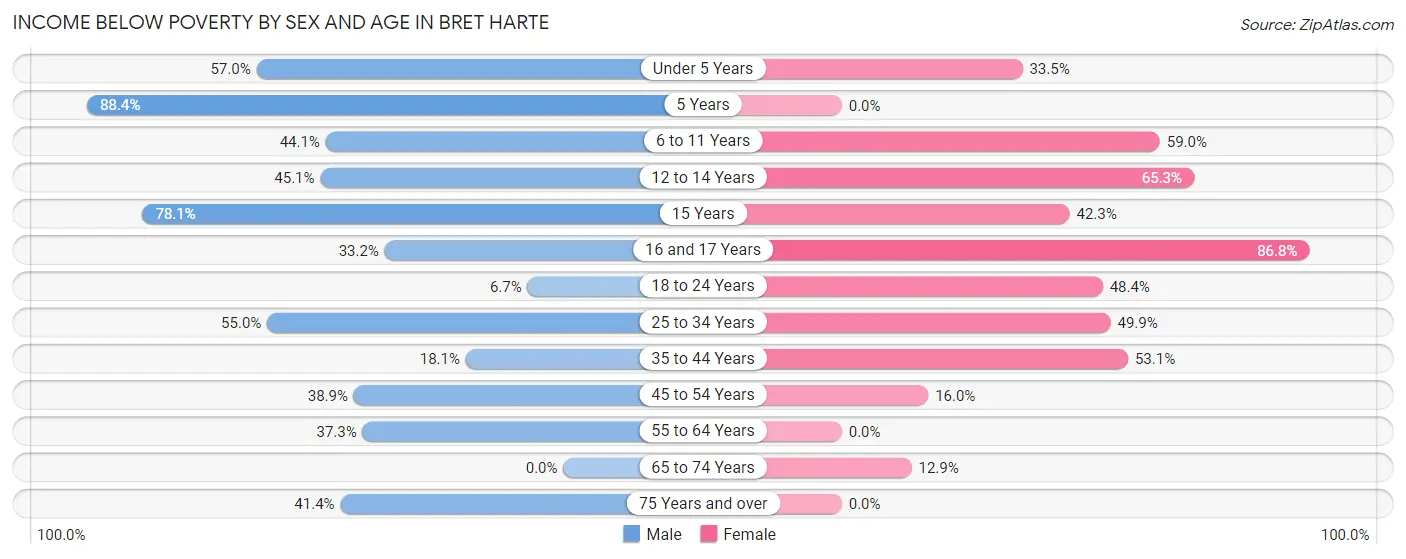
| Age Bracket | Male | Female |
| Under 5 Years | 270 (57.0%) | 55 (33.5%) |
| 5 Years | 61 (88.4%) | 0 (0.0%) |
| 6 to 11 Years | 131 (44.1%) | 157 (59.0%) |
| 12 to 14 Years | 92 (45.1%) | 115 (65.3%) |
| 15 Years | 25 (78.1%) | 41 (42.3%) |
| 16 and 17 Years | 65 (33.2%) | 59 (86.8%) |
| 18 to 24 Years | 22 (6.7%) | 108 (48.4%) |
| 25 to 34 Years | 149 (55.0%) | 232 (49.9%) |
| 35 to 44 Years | 48 (18.1%) | 170 (53.1%) |
| 45 to 54 Years | 84 (38.9%) | 34 (16.0%) |
| 55 to 64 Years | 60 (37.3%) | 0 (0.0%) |
| 65 to 74 Years | 0 (0.0%) | 22 (12.9%) |
| 75 Years and over | 12 (41.4%) | 0 (0.0%) |
| Total | 1,019 (39.0%) | 993 (43.1%) |
Income Above Poverty by Sex and Age in Bret Harte
According to the poverty statistics in Bret Harte, males aged 65 to 74 years and females aged 5 years are the age groups that are most secure financially, with 100.0% of males and 100.0% of females in these age groups living above the poverty line.
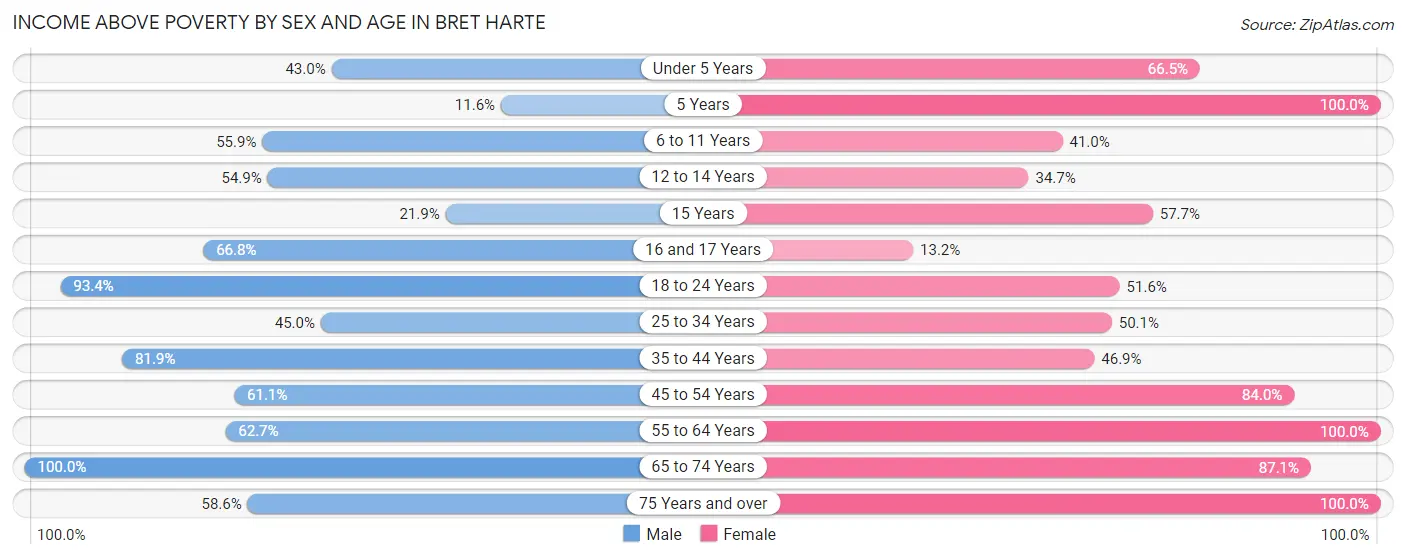
| Age Bracket | Male | Female |
| Under 5 Years | 204 (43.0%) | 109 (66.5%) |
| 5 Years | 8 (11.6%) | 29 (100.0%) |
| 6 to 11 Years | 166 (55.9%) | 109 (41.0%) |
| 12 to 14 Years | 112 (54.9%) | 61 (34.7%) |
| 15 Years | 7 (21.9%) | 56 (57.7%) |
| 16 and 17 Years | 131 (66.8%) | 9 (13.2%) |
| 18 to 24 Years | 309 (93.3%) | 115 (51.6%) |
| 25 to 34 Years | 122 (45.0%) | 233 (50.1%) |
| 35 to 44 Years | 217 (81.9%) | 150 (46.9%) |
| 45 to 54 Years | 132 (61.1%) | 178 (84.0%) |
| 55 to 64 Years | 101 (62.7%) | 93 (100.0%) |
| 65 to 74 Years | 68 (100.0%) | 148 (87.1%) |
| 75 Years and over | 17 (58.6%) | 21 (100.0%) |
| Total | 1,594 (61.0%) | 1,311 (56.9%) |
Income Below Poverty Among Married-Couple Families in Bret Harte
The poverty statistics for married-couple families in Bret Harte show that 37.0% or 210 of the total 568 families live below the poverty line. Families with 3 or 4 children have the highest poverty rate of 85.7%, comprising of 96 families. On the other hand, families with no children have the lowest poverty rate of 0.0%, which includes 0 families.
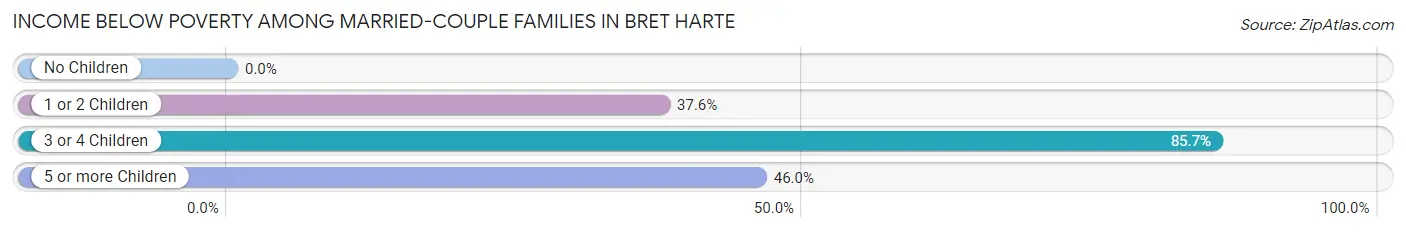
| Children | Above Poverty | Below Poverty |
| No Children | 167 (100.0%) | 0 (0.0%) |
| 1 or 2 Children | 141 (62.4%) | 85 (37.6%) |
| 3 or 4 Children | 16 (14.3%) | 96 (85.7%) |
| 5 or more Children | 34 (54.0%) | 29 (46.0%) |
| Total | 358 (63.0%) | 210 (37.0%) |
Income Below Poverty Among Single-Parent Households in Bret Harte
According to the poverty data in Bret Harte, 33.0% or 31 single-father households and 54.1% or 157 single-mother households are living below the poverty line. Among single-father households, those with 3 or 4 children have the highest poverty rate, with 31 households (100.0%) experiencing poverty. Likewise, among single-mother households, those with 3 or 4 children have the highest poverty rate, with 32 households (100.0%) falling below the poverty line.
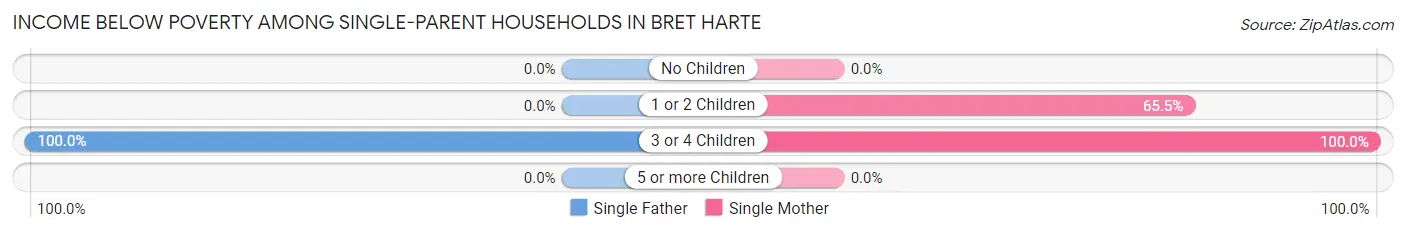
| Children | Single Father | Single Mother |
| No Children | 0 (0.0%) | 0 (0.0%) |
| 1 or 2 Children | 0 (0.0%) | 125 (65.4%) |
| 3 or 4 Children | 31 (100.0%) | 32 (100.0%) |
| 5 or more Children | 0 (0.0%) | 0 (0.0%) |
| Total | 31 (33.0%) | 157 (54.1%) |
Income Below Poverty Among Married-Couple vs Single-Parent Households in Bret Harte
The poverty data for Bret Harte shows that 210 of the married-couple family households (37.0%) and 188 of the single-parent households (49.0%) are living below the poverty level. Within the married-couple family households, those with 3 or 4 children have the highest poverty rate, with 96 households (85.7%) falling below the poverty line. Among the single-parent households, those with 3 or 4 children have the highest poverty rate, with 63 household (100.0%) living below poverty.
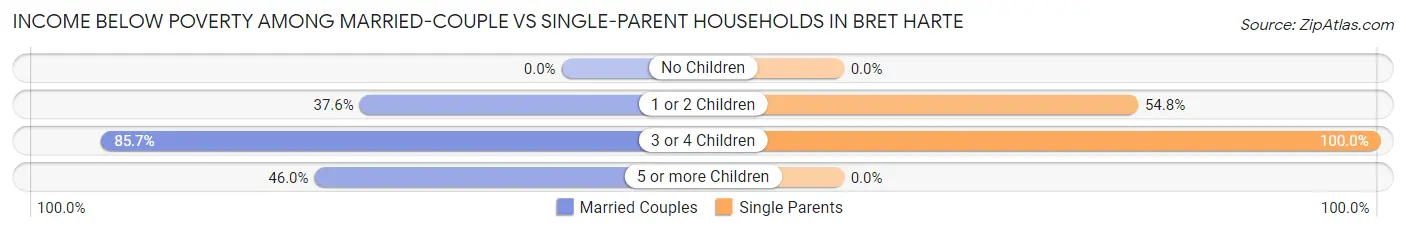
| Children | Married-Couple Families | Single-Parent Households |
| No Children | 0 (0.0%) | 0 (0.0%) |
| 1 or 2 Children | 85 (37.6%) | 125 (54.8%) |
| 3 or 4 Children | 96 (85.7%) | 63 (100.0%) |
| 5 or more Children | 29 (46.0%) | 0 (0.0%) |
| Total | 210 (37.0%) | 188 (49.0%) |
Race in Bret Harte
The most populous races in Bret Harte are Hispanic or Latino (4,571 | 92.8%), Two or more Races (2,288 | 46.5%), and White / Caucasian (1,783 | 36.2%).
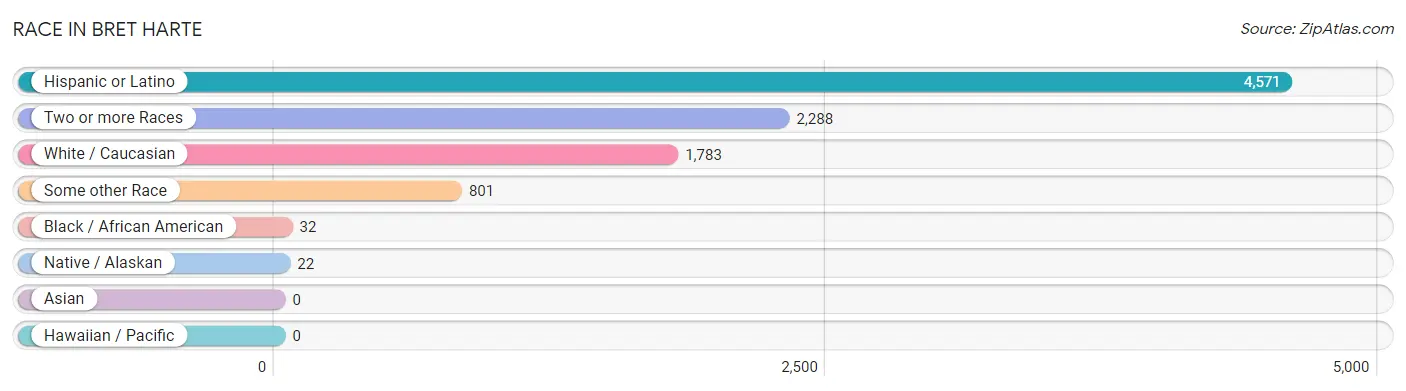
| Race | # Population | % Population |
| Asian | 0 | 0.0% |
| Black / African American | 32 | 0.6% |
| Hawaiian / Pacific | 0 | 0.0% |
| Hispanic or Latino | 4,571 | 92.8% |
| Native / Alaskan | 22 | 0.4% |
| White / Caucasian | 1,783 | 36.2% |
| Two or more Races | 2,288 | 46.5% |
| Some other Race | 801 | 16.3% |
| Total | 4,926 | 100.0% |
Ancestry in Bret Harte
The most populous ancestries reported in Bret Harte are Mexican (4,361 | 88.5%), Central American (102 | 2.1%), Salvadoran (91 | 1.8%), Korean (78 | 1.6%), and Native Hawaiian (78 | 1.6%), together accounting for 95.6% of all Bret Harte residents.
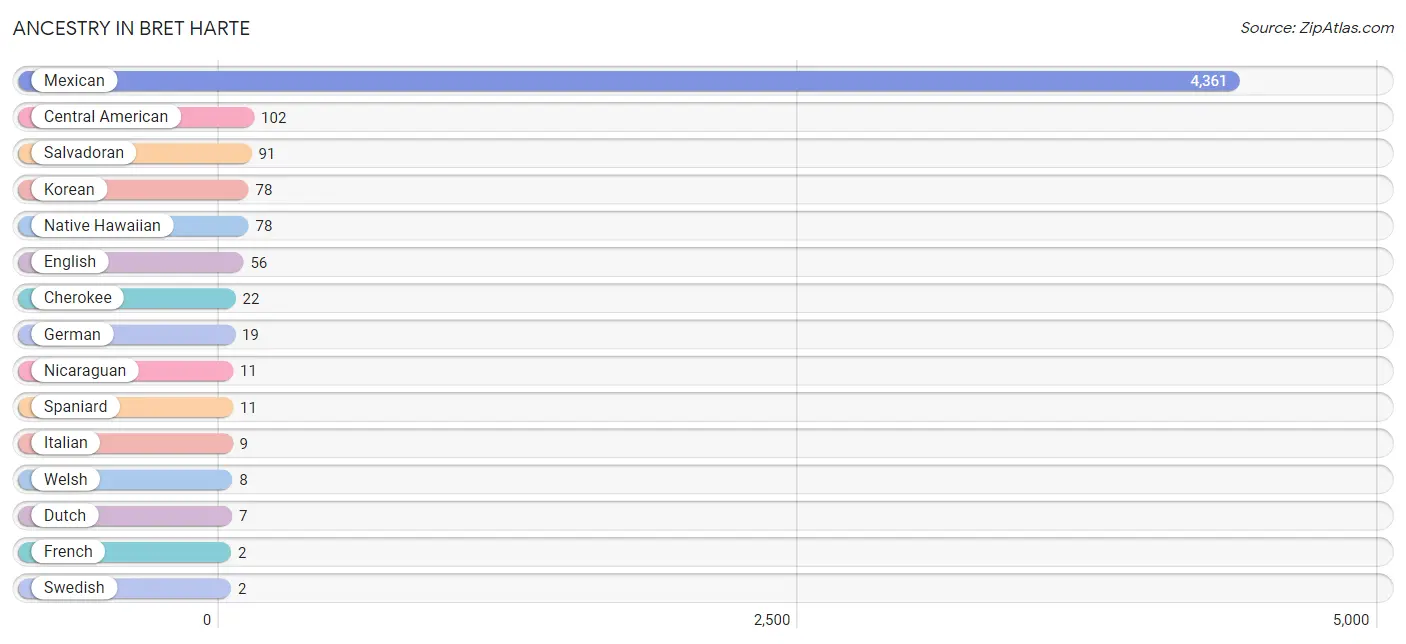
| Ancestry | # Population | % Population |
| Central American | 102 | 2.1% |
| Cherokee | 22 | 0.4% |
| Dutch | 7 | 0.1% |
| English | 56 | 1.1% |
| French | 2 | 0.0% |
| German | 19 | 0.4% |
| Italian | 9 | 0.2% |
| Korean | 78 | 1.6% |
| Mexican | 4,361 | 88.5% |
| Native Hawaiian | 78 | 1.6% |
| Nicaraguan | 11 | 0.2% |
| Salvadoran | 91 | 1.8% |
| Spaniard | 11 | 0.2% |
| Swedish | 2 | 0.0% |
| Welsh | 8 | 0.2% | View All 15 Rows |
Immigrants in Bret Harte
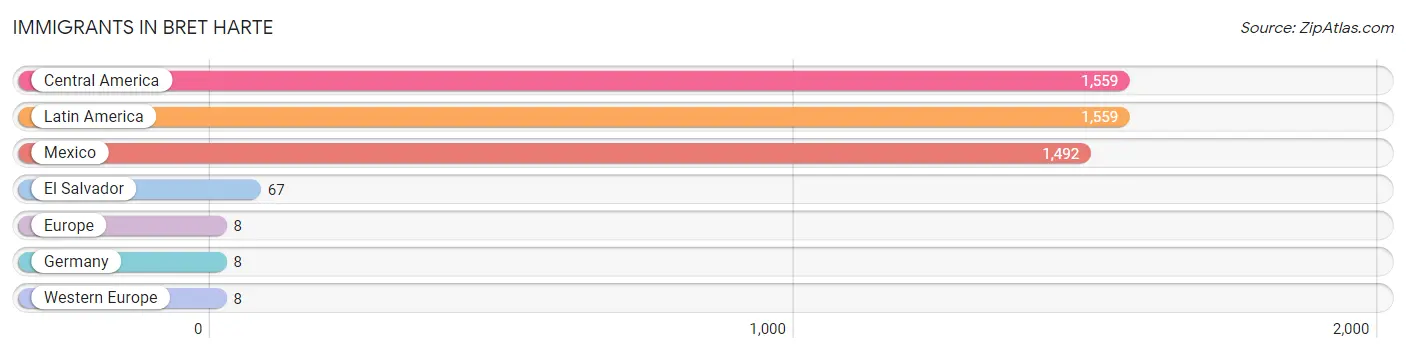
The most numerous immigrant groups reported in Bret Harte came from Central America (1,559 | 31.7%), Latin America (1,559 | 31.7%), Mexico (1,492 | 30.3%), El Salvador (67 | 1.4%), and Europe (8 | 0.2%), together accounting for 95.1% of all Bret Harte residents.
| Immigration Origin | # Population | % Population |
| Central America | 1,559 | 31.7% |
| El Salvador | 67 | 1.4% |
| Europe | 8 | 0.2% |
| Germany | 8 | 0.2% |
| Latin America | 1,559 | 31.7% |
| Mexico | 1,492 | 30.3% |
| Western Europe | 8 | 0.2% | View All 7 Rows |
Sex and Age in Bret Harte
Sex and Age in Bret Harte
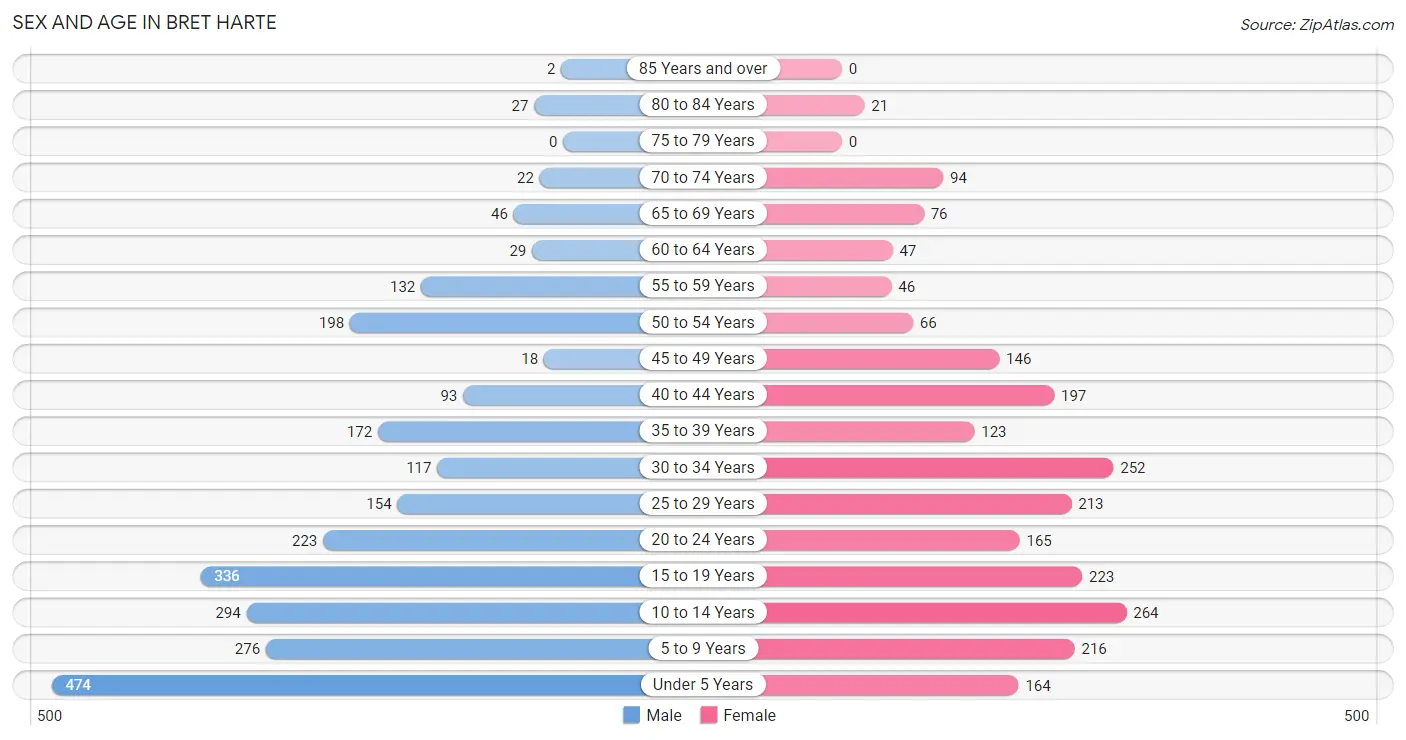
The most populous age groups in Bret Harte are Under 5 Years (474 | 18.1%) for men and 10 to 14 Years (264 | 11.4%) for women.
| Age Bracket | Male | Female |
| Under 5 Years | 474 (18.1%) | 164 (7.1%) |
| 5 to 9 Years | 276 (10.6%) | 216 (9.3%) |
| 10 to 14 Years | 294 (11.3%) | 264 (11.4%) |
| 15 to 19 Years | 336 (12.9%) | 223 (9.6%) |
| 20 to 24 Years | 223 (8.5%) | 165 (7.1%) |
| 25 to 29 Years | 154 (5.9%) | 213 (9.2%) |
| 30 to 34 Years | 117 (4.5%) | 252 (10.9%) |
| 35 to 39 Years | 172 (6.6%) | 123 (5.3%) |
| 40 to 44 Years | 93 (3.6%) | 197 (8.5%) |
| 45 to 49 Years | 18 (0.7%) | 146 (6.3%) |
| 50 to 54 Years | 198 (7.6%) | 66 (2.9%) |
| 55 to 59 Years | 132 (5.1%) | 46 (2.0%) |
| 60 to 64 Years | 29 (1.1%) | 47 (2.0%) |
| 65 to 69 Years | 46 (1.8%) | 76 (3.3%) |
| 70 to 74 Years | 22 (0.8%) | 94 (4.1%) |
| 75 to 79 Years | 0 (0.0%) | 0 (0.0%) |
| 80 to 84 Years | 27 (1.0%) | 21 (0.9%) |
| 85 Years and over | 2 (0.1%) | 0 (0.0%) |
| Total | 2,613 (100.0%) | 2,313 (100.0%) |
Families and Households in Bret Harte
Median Family Size in Bret Harte
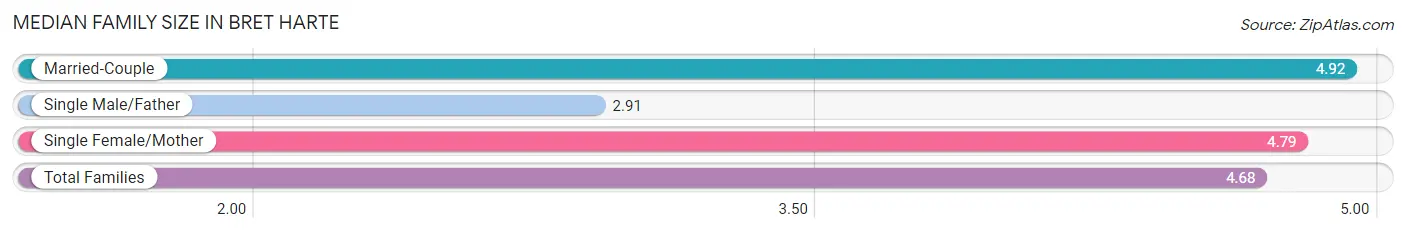
The median family size in Bret Harte is 4.68 persons per family, with married-couple families (568 | 59.7%) accounting for the largest median family size of 4.92 persons per family. On the other hand, single male/father families (94 | 9.9%) represent the smallest median family size with 2.91 persons per family.
| Family Type | # Families | Family Size |
| Married-Couple | 568 (59.7%) | 4.92 |
| Single Male/Father | 94 (9.9%) | 2.91 |
| Single Female/Mother | 290 (30.5%) | 4.79 |
| Total Families | 952 (100.0%) | 4.68 |
Median Household Size in Bret Harte
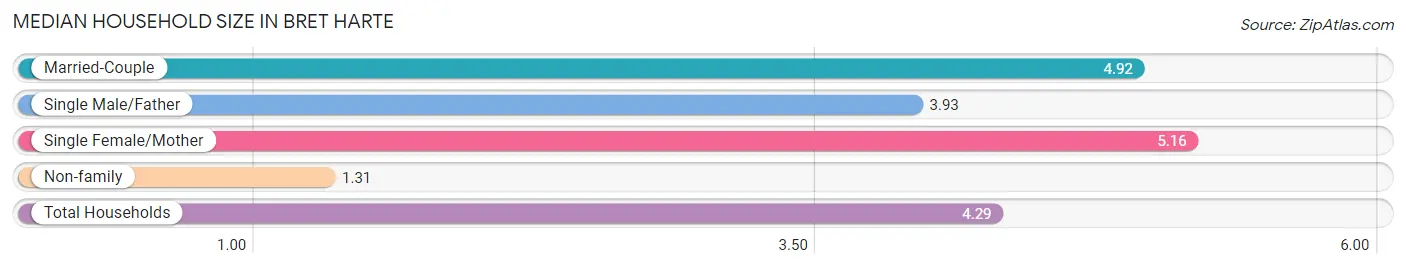
The median household size in Bret Harte is 4.29 persons per household, with single female/mother households (290 | 25.3%) accounting for the largest median household size of 5.16 persons per household. non-family households (195 | 17.0%) represent the smallest median household size with 1.31 persons per household.
| Household Type | # Households | Household Size |
| Married-Couple | 568 (49.5%) | 4.92 |
| Single Male/Father | 94 (8.2%) | 3.93 |
| Single Female/Mother | 290 (25.3%) | 5.16 |
| Non-family | 195 (17.0%) | 1.31 |
| Total Households | 1,147 (100.0%) | 4.29 |
Household Size by Marriage Status in Bret Harte
Out of a total of 1,147 households in Bret Harte, 952 (83.0%) are family households, while 195 (17.0%) are nonfamily households. The most numerous type of family households are 5-person households, comprising 281, and the most common type of nonfamily households are 1-person households, comprising 125.
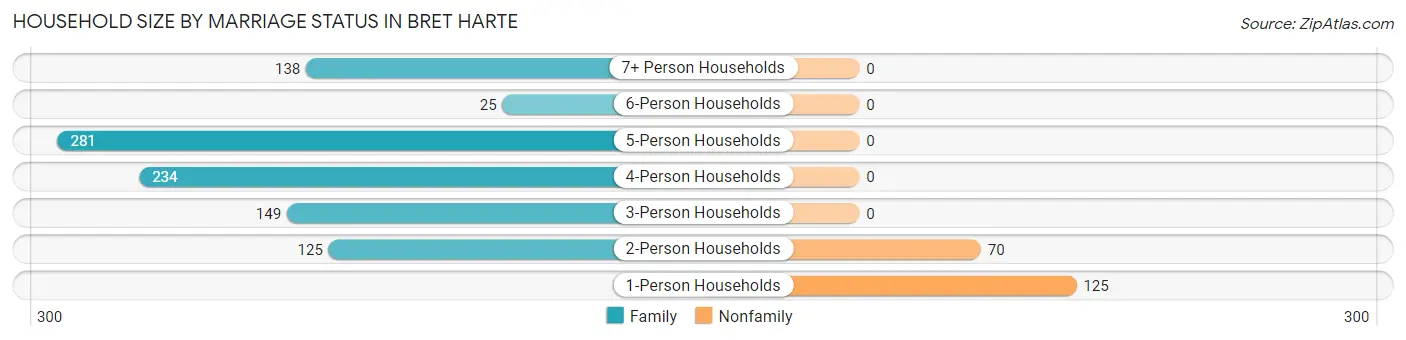
| Household Size | Family Households | Nonfamily Households |
| 1-Person Households | - | 125 (10.9%) |
| 2-Person Households | 125 (10.9%) | 70 (6.1%) |
| 3-Person Households | 149 (13.0%) | 0 (0.0%) |
| 4-Person Households | 234 (20.4%) | 0 (0.0%) |
| 5-Person Households | 281 (24.5%) | 0 (0.0%) |
| 6-Person Households | 25 (2.2%) | 0 (0.0%) |
| 7+ Person Households | 138 (12.0%) | 0 (0.0%) |
| Total | 952 (83.0%) | 195 (17.0%) |
Female Fertility in Bret Harte
Fertility by Age in Bret Harte
Average fertility rate in Bret Harte is 68.0 births per 1,000 women. Women in the age bracket of 20 to 34 years have the highest fertility rate with 89.0 births per 1,000 women. Women in the age bracket of 20 to 34 years acount for 62.2% of all women with births.
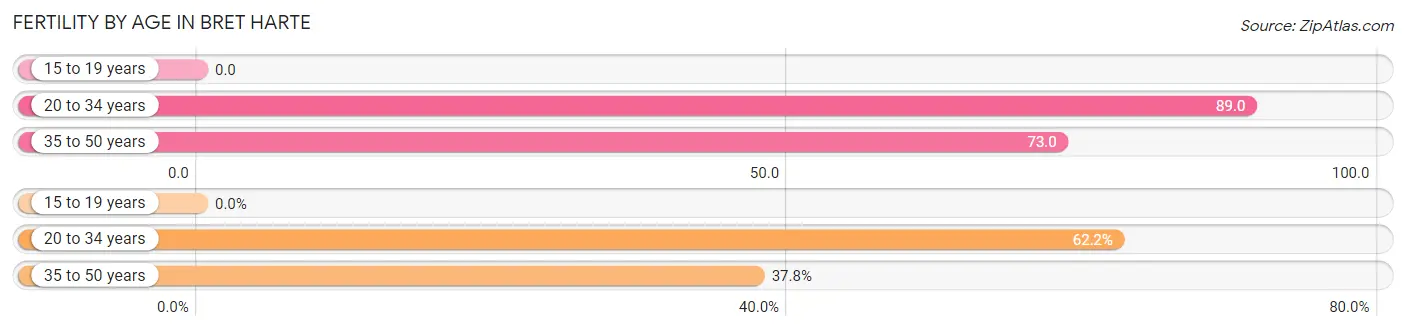
| Age Bracket | Women with Births | Births / 1,000 Women |
| 15 to 19 years | 0 (0.0%) | 0.0 |
| 20 to 34 years | 56 (62.2%) | 89.0 |
| 35 to 50 years | 34 (37.8%) | 73.0 |
| Total | 90 (100.0%) | 68.0 |
Fertility by Age by Marriage Status in Bret Harte
62.2% of women with births (90) in Bret Harte are married. The highest percentage of unmarried women with births falls into 20 to 34 years age bracket with 60.7% of them unmarried at the time of birth, while the lowest percentage of unmarried women with births belong to 35 to 50 years age bracket with 0.0% of them unmarried.
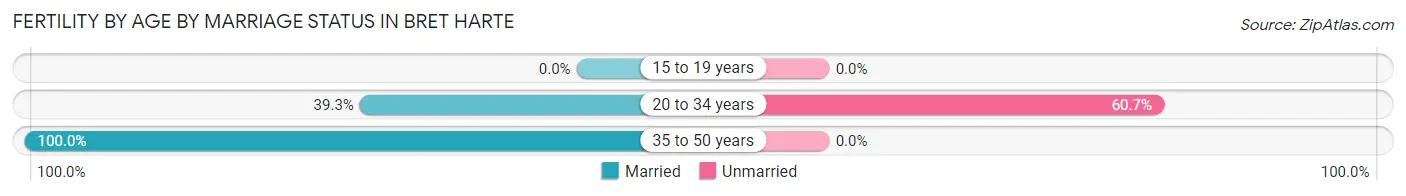
| Age Bracket | Married | Unmarried |
| 15 to 19 years | 0 (0.0%) | 0 (0.0%) |
| 20 to 34 years | 22 (39.3%) | 34 (60.7%) |
| 35 to 50 years | 34 (100.0%) | 0 (0.0%) |
| Total | 56 (62.2%) | 34 (37.8%) |
Fertility by Education in Bret Harte
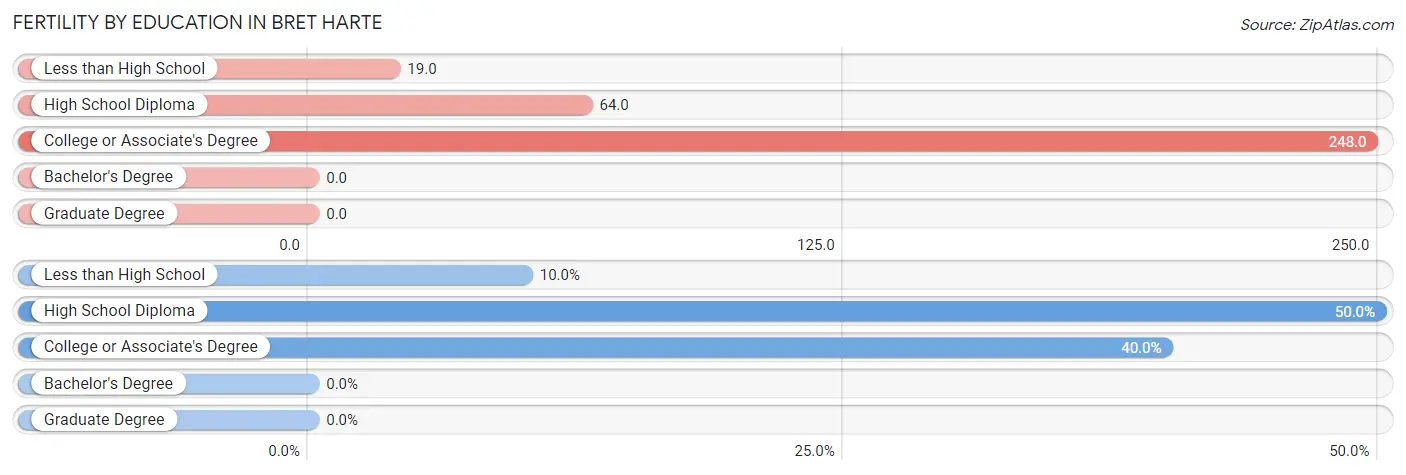
| Educational Attainment | Women with Births | Births / 1,000 Women |
| Less than High School | 9 (10.0%) | 19.0 |
| High School Diploma | 45 (50.0%) | 64.0 |
| College or Associate's Degree | 36 (40.0%) | 248.0 |
| Bachelor's Degree | 0 (0.0%) | 0.0 |
| Graduate Degree | 0 (0.0%) | 0.0 |
| Total | 90 (100.0%) | 68.0 |
Fertility by Education by Marriage Status in Bret Harte
37.8% of women with births in Bret Harte are unmarried. Women with the educational attainment of less than high school are most likely to be married with 100.0% of them married at childbirth, while women with the educational attainment of high school diploma are least likely to be married with 75.6% of them unmarried at childbirth.
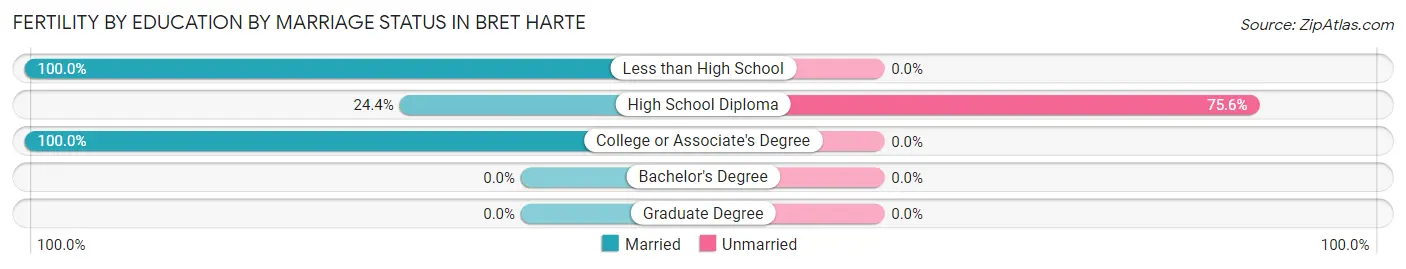
| Educational Attainment | Married | Unmarried |
| Less than High School | 9 (100.0%) | 0 (0.0%) |
| High School Diploma | 11 (24.4%) | 34 (75.6%) |
| College or Associate's Degree | 36 (100.0%) | 0 (0.0%) |
| Bachelor's Degree | 0 (0.0%) | 0 (0.0%) |
| Graduate Degree | 0 (0.0%) | 0 (0.0%) |
| Total | 56 (62.2%) | 34 (37.8%) |
Employment Characteristics in Bret Harte
Employment by Class of Employer in Bret Harte
Among the 1,365 employed individuals in Bret Harte, private company employees (1,119 | 82.0%), self-employed (not incorporated) (162 | 11.9%), and local government employees (37 | 2.7%) make up the most common classes of employment.
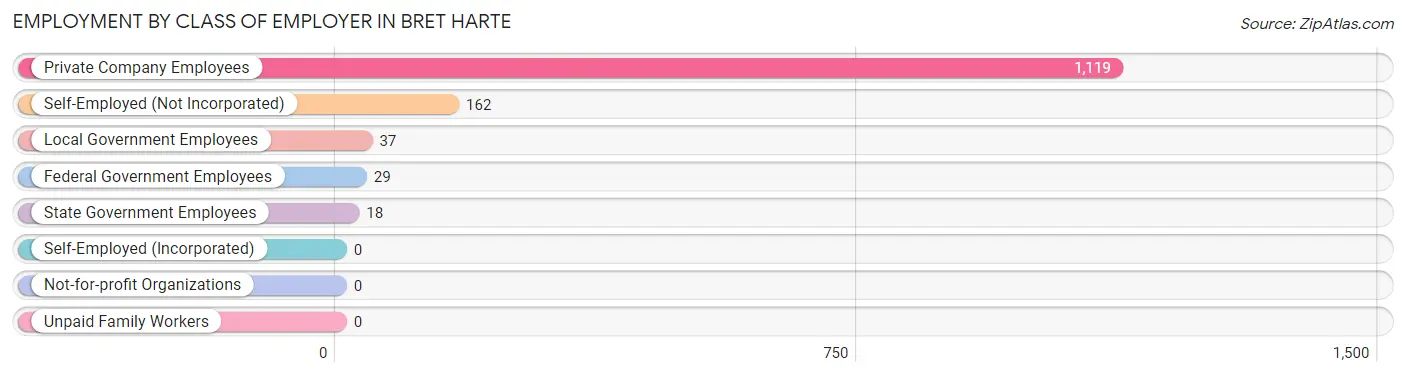
| Employer Class | # Employees | % Employees |
| Private Company Employees | 1,119 | 82.0% |
| Self-Employed (Incorporated) | 0 | 0.0% |
| Self-Employed (Not Incorporated) | 162 | 11.9% |
| Not-for-profit Organizations | 0 | 0.0% |
| Local Government Employees | 37 | 2.7% |
| State Government Employees | 18 | 1.3% |
| Federal Government Employees | 29 | 2.1% |
| Unpaid Family Workers | 0 | 0.0% |
| Total | 1,365 | 100.0% |
Employment Status by Age in Bret Harte
According to the labor force statistics for Bret Harte, out of the total population over 16 years of age (3,109), 55.4% or 1,722 individuals are in the labor force, with 12.6% or 217 of them unemployed. The age group with the highest labor force participation rate is 55 to 59 years, with 78.1% or 139 individuals in the labor force. Within the labor force, the 16 to 19 years age range has the highest percentage of unemployed individuals, with 66.1% or 72 of them being unemployed.
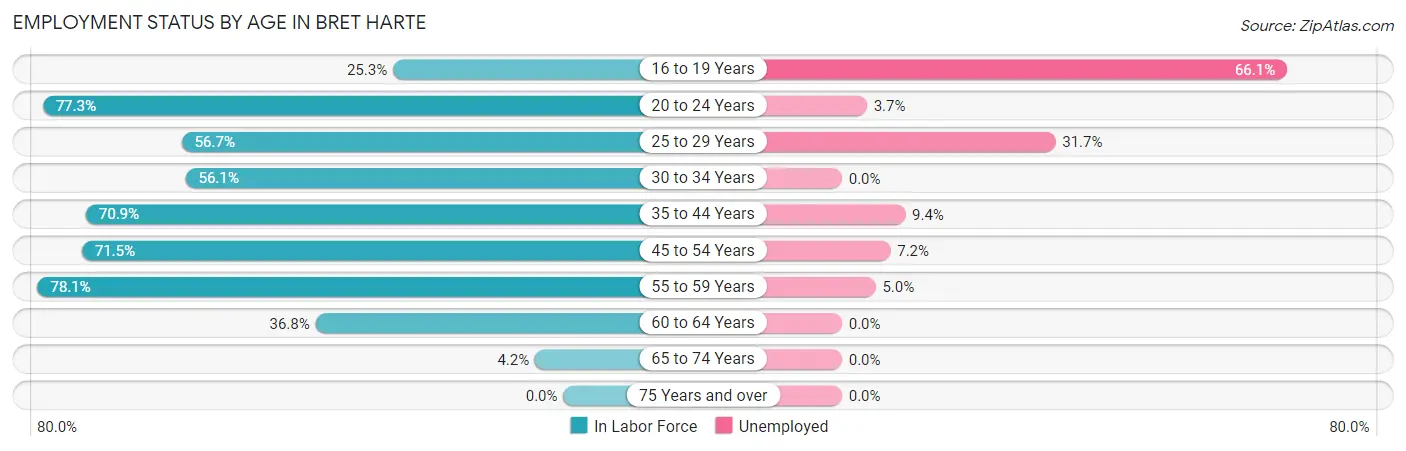
| Age Bracket | In Labor Force | Unemployed |
| 16 to 19 Years | 109 (25.3%) | 72 (66.1%) |
| 20 to 24 Years | 300 (77.3%) | 11 (3.7%) |
| 25 to 29 Years | 208 (56.7%) | 66 (31.7%) |
| 30 to 34 Years | 207 (56.1%) | 0 (0.0%) |
| 35 to 44 Years | 415 (70.9%) | 39 (9.4%) |
| 45 to 54 Years | 306 (71.5%) | 22 (7.2%) |
| 55 to 59 Years | 139 (78.1%) | 7 (5.0%) |
| 60 to 64 Years | 28 (36.8%) | 0 (0.0%) |
| 65 to 74 Years | 10 (4.2%) | 0 (0.0%) |
| 75 Years and over | 0 (0.0%) | 0 (0.0%) |
| Total | 1,722 (55.4%) | 217 (12.6%) |
Employment Status by Educational Attainment in Bret Harte
According to labor force statistics for Bret Harte, 65.1% of individuals (1,304) out of the total population between 25 and 64 years of age (2,003) are in the labor force, with 10.3% or 134 of them being unemployed. The group with the highest labor force participation rate are those with the educational attainment of bachelor's degree or higher, with 100.0% or 24 individuals in the labor force. Within the labor force, individuals with college / associate degree education have the highest percentage of unemployment, with 18.9% or 7 of them being unemployed.
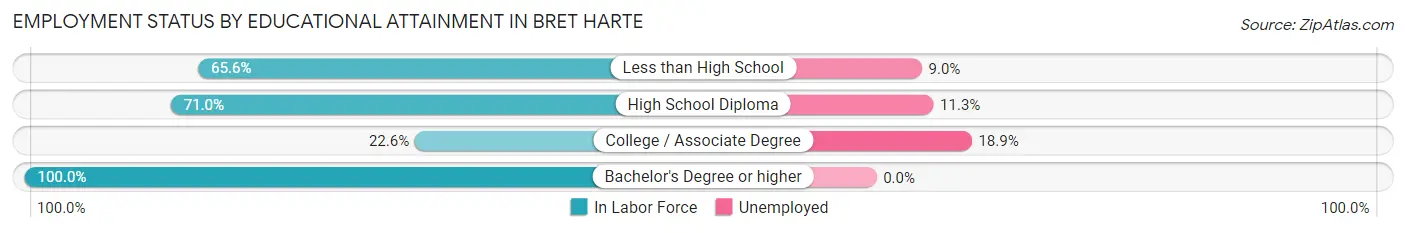
| Educational Attainment | In Labor Force | Unemployed |
| Less than High School | 569 (65.6%) | 78 (9.0%) |
| High School Diploma | 673 (71.0%) | 107 (11.3%) |
| College / Associate Degree | 37 (22.6%) | 31 (18.9%) |
| Bachelor's Degree or higher | 24 (100.0%) | 0 (0.0%) |
| Total | 1,304 (65.1%) | 206 (10.3%) |
Employment Occupations by Sex in Bret Harte
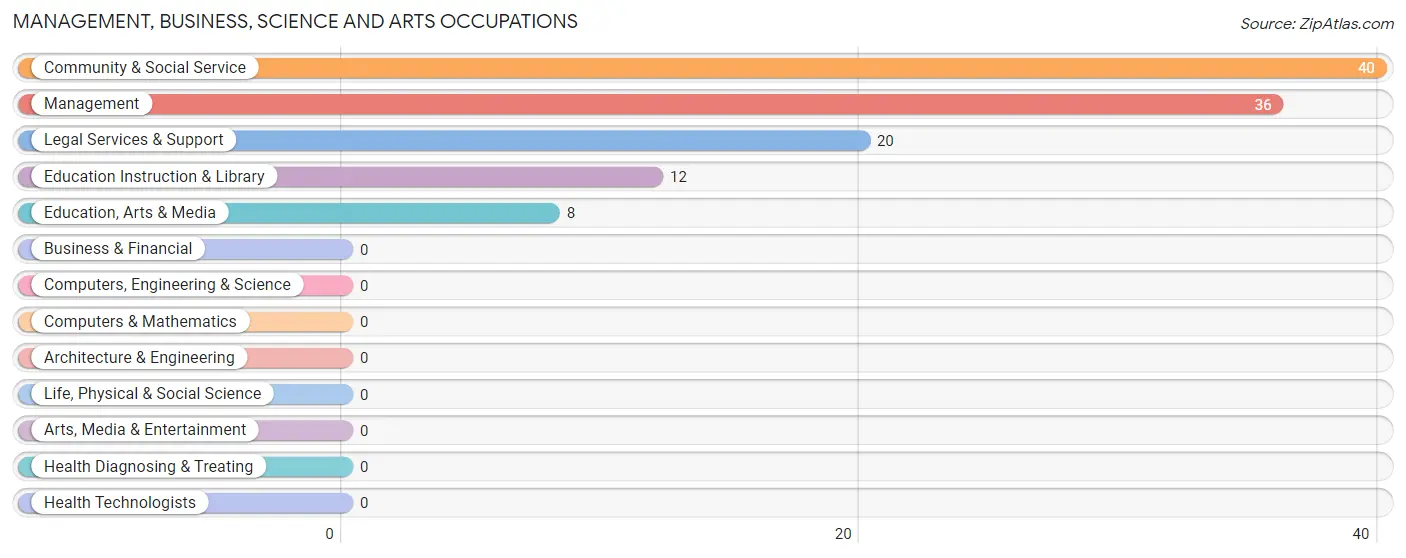
Management, Business, Science and Arts Occupations
The most common Management, Business, Science and Arts occupations in Bret Harte are Community & Social Service (40 | 2.7%), Management (36 | 2.4%), Legal Services & Support (20 | 1.3%), Education Instruction & Library (12 | 0.8%), and Education, Arts & Media (8 | 0.5%).
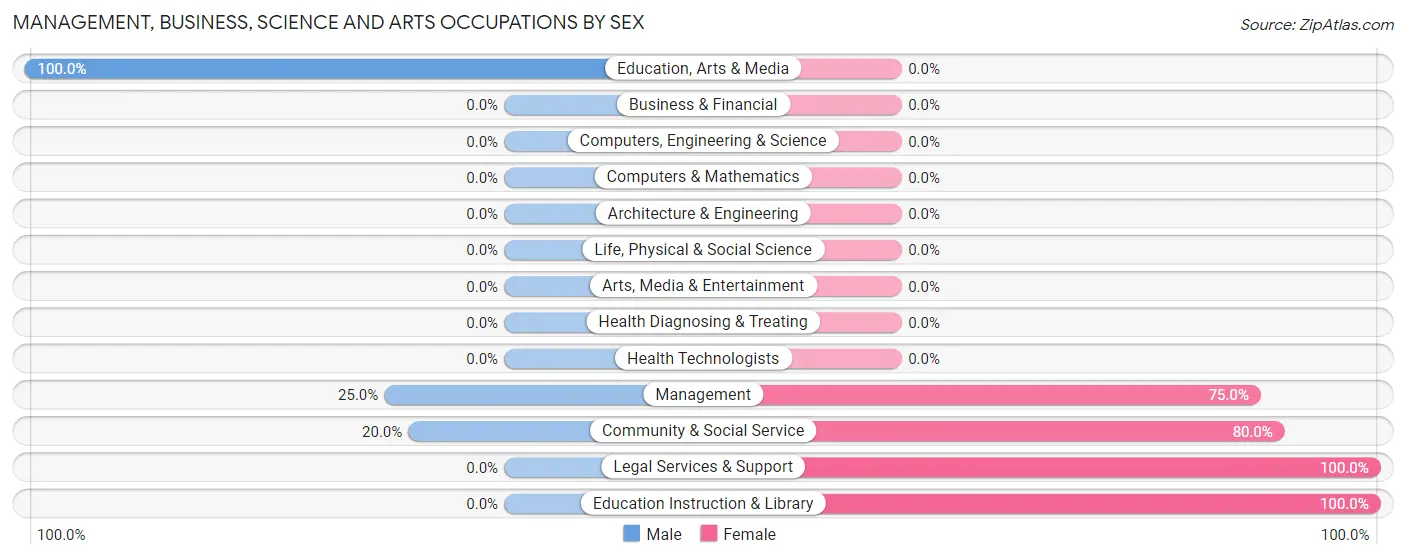
Management, Business, Science and Arts Occupations by Sex
Within the Management, Business, Science and Arts occupations in Bret Harte, the most male-oriented occupations are Education, Arts & Media (100.0%), Management (25.0%), and Community & Social Service (20.0%), while the most female-oriented occupations are Legal Services & Support (100.0%), Education Instruction & Library (100.0%), and Community & Social Service (80.0%).
| Occupation | Male | Female |
| Management | 9 (25.0%) | 27 (75.0%) |
| Business & Financial | 0 (0.0%) | 0 (0.0%) |
| Computers, Engineering & Science | 0 (0.0%) | 0 (0.0%) |
| Computers & Mathematics | 0 (0.0%) | 0 (0.0%) |
| Architecture & Engineering | 0 (0.0%) | 0 (0.0%) |
| Life, Physical & Social Science | 0 (0.0%) | 0 (0.0%) |
| Community & Social Service | 8 (20.0%) | 32 (80.0%) |
| Education, Arts & Media | 8 (100.0%) | 0 (0.0%) |
| Legal Services & Support | 0 (0.0%) | 20 (100.0%) |
| Education Instruction & Library | 0 (0.0%) | 12 (100.0%) |
| Arts, Media & Entertainment | 0 (0.0%) | 0 (0.0%) |
| Health Diagnosing & Treating | 0 (0.0%) | 0 (0.0%) |
| Health Technologists | 0 (0.0%) | 0 (0.0%) |
| Total (Category) | 17 (22.4%) | 59 (77.6%) |
| Total (Overall) | 990 (65.8%) | 515 (34.2%) |
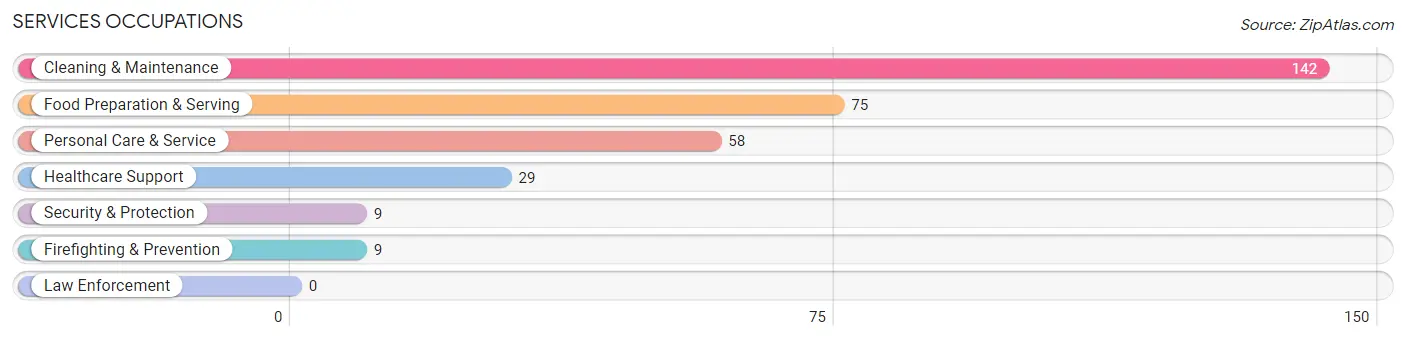
Services Occupations
The most common Services occupations in Bret Harte are Cleaning & Maintenance (142 | 9.4%), Food Preparation & Serving (75 | 5.0%), Personal Care & Service (58 | 3.8%), Healthcare Support (29 | 1.9%), and Security & Protection (9 | 0.6%).
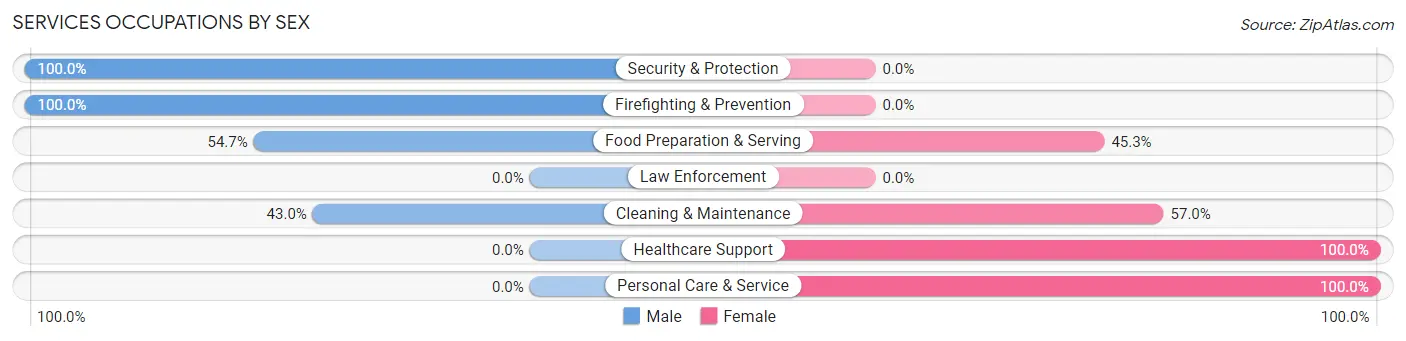
Services Occupations by Sex
Within the Services occupations in Bret Harte, the most male-oriented occupations are Security & Protection (100.0%), Firefighting & Prevention (100.0%), and Food Preparation & Serving (54.7%), while the most female-oriented occupations are Healthcare Support (100.0%), Personal Care & Service (100.0%), and Cleaning & Maintenance (57.0%).
| Occupation | Male | Female |
| Healthcare Support | 0 (0.0%) | 29 (100.0%) |
| Security & Protection | 9 (100.0%) | 0 (0.0%) |
| Firefighting & Prevention | 9 (100.0%) | 0 (0.0%) |
| Law Enforcement | 0 (0.0%) | 0 (0.0%) |
| Food Preparation & Serving | 41 (54.7%) | 34 (45.3%) |
| Cleaning & Maintenance | 61 (43.0%) | 81 (57.0%) |
| Personal Care & Service | 0 (0.0%) | 58 (100.0%) |
| Total (Category) | 111 (35.5%) | 202 (64.5%) |
| Total (Overall) | 990 (65.8%) | 515 (34.2%) |
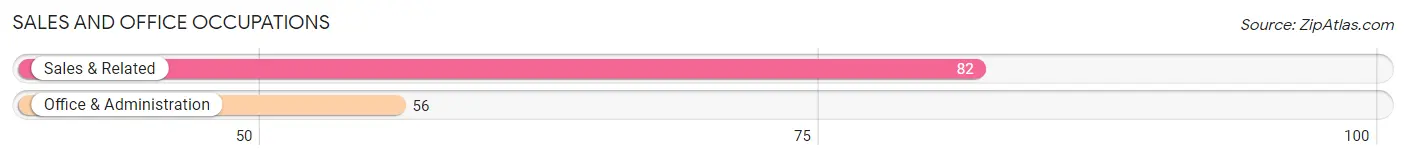
Sales and Office Occupations
The most common Sales and Office occupations in Bret Harte are Sales & Related (82 | 5.4%), and Office & Administration (56 | 3.7%).
Sales and Office Occupations by Sex
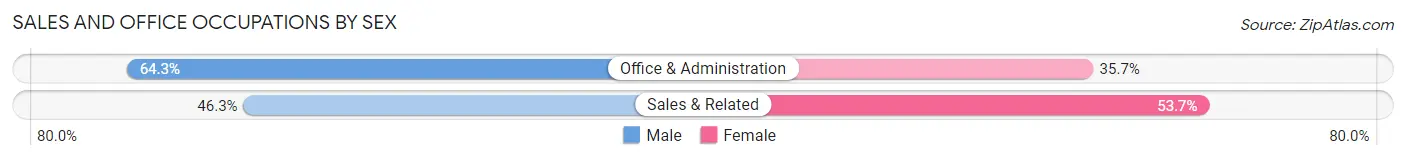
| Occupation | Male | Female |
| Sales & Related | 38 (46.3%) | 44 (53.7%) |
| Office & Administration | 36 (64.3%) | 20 (35.7%) |
| Total (Category) | 74 (53.6%) | 64 (46.4%) |
| Total (Overall) | 990 (65.8%) | 515 (34.2%) |
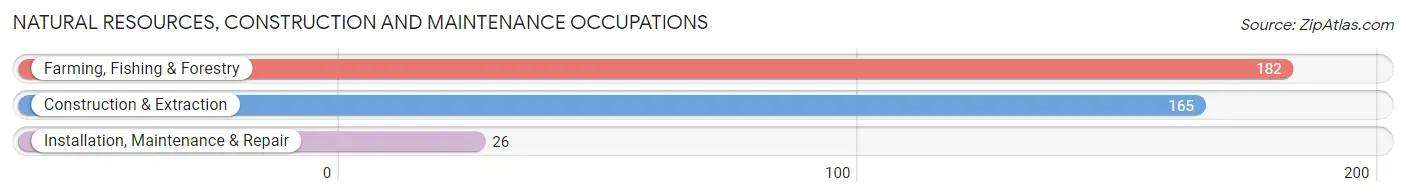
Natural Resources, Construction and Maintenance Occupations
The most common Natural Resources, Construction and Maintenance occupations in Bret Harte are Farming, Fishing & Forestry (182 | 12.1%), Construction & Extraction (165 | 11.0%), and Installation, Maintenance & Repair (26 | 1.7%).
Natural Resources, Construction and Maintenance Occupations by Sex
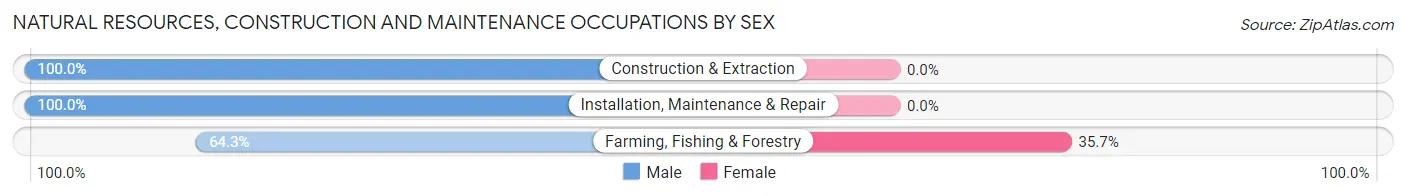
| Occupation | Male | Female |
| Farming, Fishing & Forestry | 117 (64.3%) | 65 (35.7%) |
| Construction & Extraction | 165 (100.0%) | 0 (0.0%) |
| Installation, Maintenance & Repair | 26 (100.0%) | 0 (0.0%) |
| Total (Category) | 308 (82.6%) | 65 (17.4%) |
| Total (Overall) | 990 (65.8%) | 515 (34.2%) |
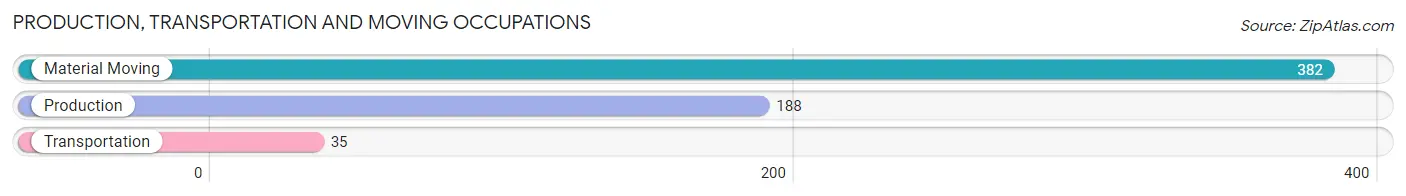
Production, Transportation and Moving Occupations
The most common Production, Transportation and Moving occupations in Bret Harte are Material Moving (382 | 25.4%), Production (188 | 12.5%), and Transportation (35 | 2.3%).
Production, Transportation and Moving Occupations by Sex
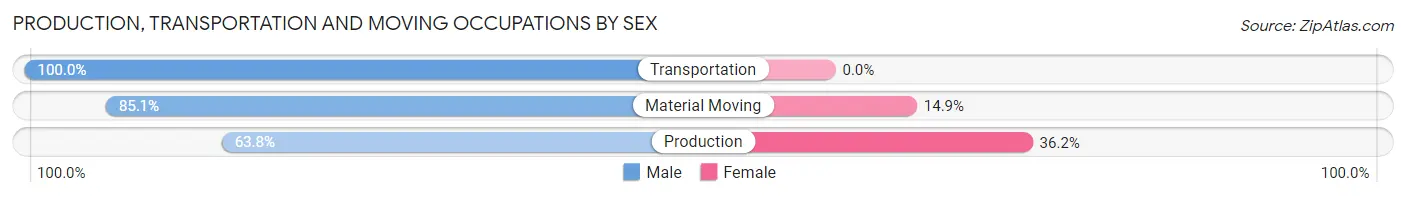
| Occupation | Male | Female |
| Production | 120 (63.8%) | 68 (36.2%) |
| Transportation | 35 (100.0%) | 0 (0.0%) |
| Material Moving | 325 (85.1%) | 57 (14.9%) |
| Total (Category) | 480 (79.3%) | 125 (20.7%) |
| Total (Overall) | 990 (65.8%) | 515 (34.2%) |
Employment Industries by Sex in Bret Harte
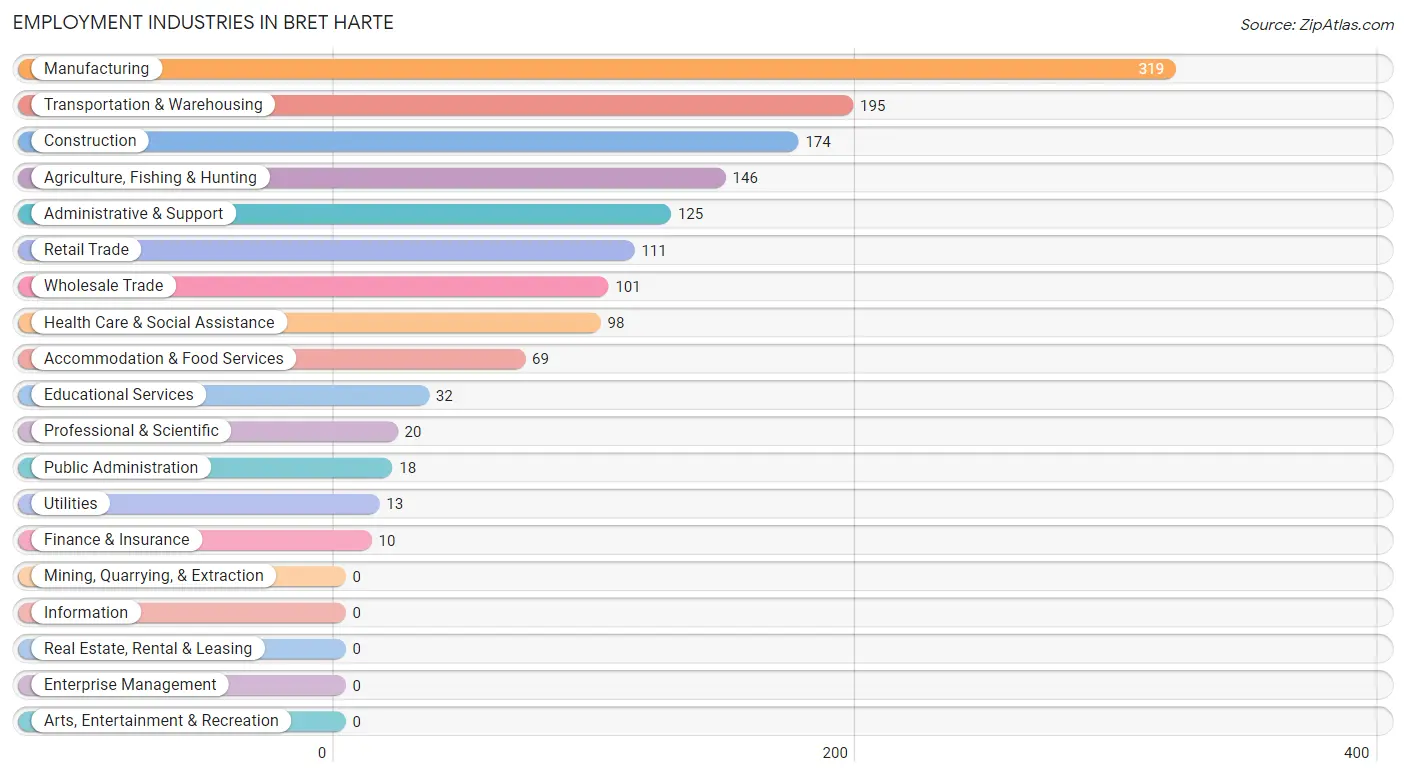
Employment Industries in Bret Harte
The major employment industries in Bret Harte include Manufacturing (319 | 21.2%), Transportation & Warehousing (195 | 13.0%), Construction (174 | 11.6%), Agriculture, Fishing & Hunting (146 | 9.7%), and Administrative & Support (125 | 8.3%).
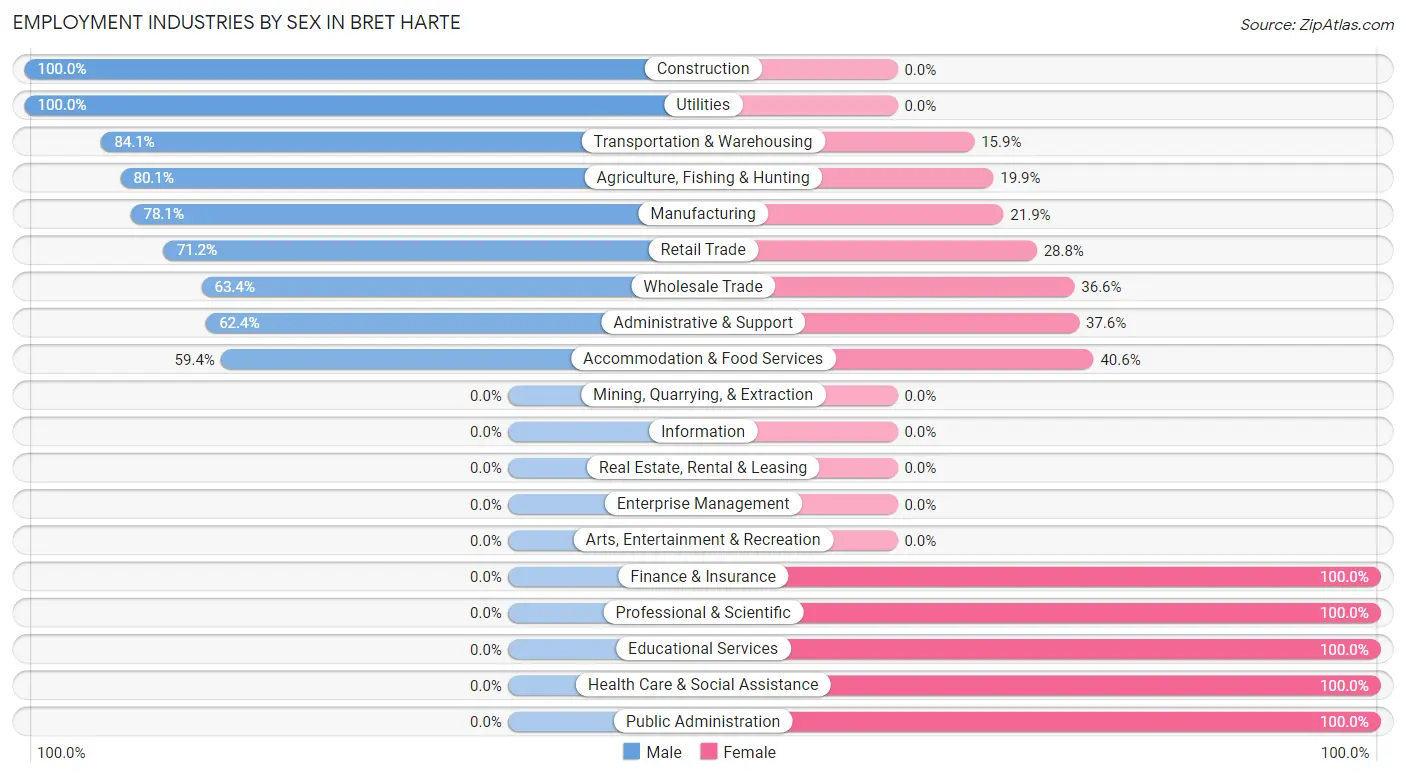
Employment Industries by Sex in Bret Harte
The Bret Harte industries that see more men than women are Construction (100.0%), Utilities (100.0%), and Transportation & Warehousing (84.1%), whereas the industries that tend to have a higher number of women are Finance & Insurance (100.0%), Professional & Scientific (100.0%), and Educational Services (100.0%).
| Industry | Male | Female |
| Agriculture, Fishing & Hunting | 117 (80.1%) | 29 (19.9%) |
| Mining, Quarrying, & Extraction | 0 (0.0%) | 0 (0.0%) |
| Construction | 174 (100.0%) | 0 (0.0%) |
| Manufacturing | 249 (78.1%) | 70 (21.9%) |
| Wholesale Trade | 64 (63.4%) | 37 (36.6%) |
| Retail Trade | 79 (71.2%) | 32 (28.8%) |
| Transportation & Warehousing | 164 (84.1%) | 31 (15.9%) |
| Utilities | 13 (100.0%) | 0 (0.0%) |
| Information | 0 (0.0%) | 0 (0.0%) |
| Finance & Insurance | 0 (0.0%) | 10 (100.0%) |
| Real Estate, Rental & Leasing | 0 (0.0%) | 0 (0.0%) |
| Professional & Scientific | 0 (0.0%) | 20 (100.0%) |
| Enterprise Management | 0 (0.0%) | 0 (0.0%) |
| Administrative & Support | 78 (62.4%) | 47 (37.6%) |
| Educational Services | 0 (0.0%) | 32 (100.0%) |
| Health Care & Social Assistance | 0 (0.0%) | 98 (100.0%) |
| Arts, Entertainment & Recreation | 0 (0.0%) | 0 (0.0%) |
| Accommodation & Food Services | 41 (59.4%) | 28 (40.6%) |
| Public Administration | 0 (0.0%) | 18 (100.0%) |
| Total | 990 (65.8%) | 515 (34.2%) |
Education in Bret Harte
School Enrollment in Bret Harte
The most common levels of schooling among the 1,659 students in Bret Harte are high school (475 | 28.6%), middle school (428 | 25.8%), and elementary school (385 | 23.2%).
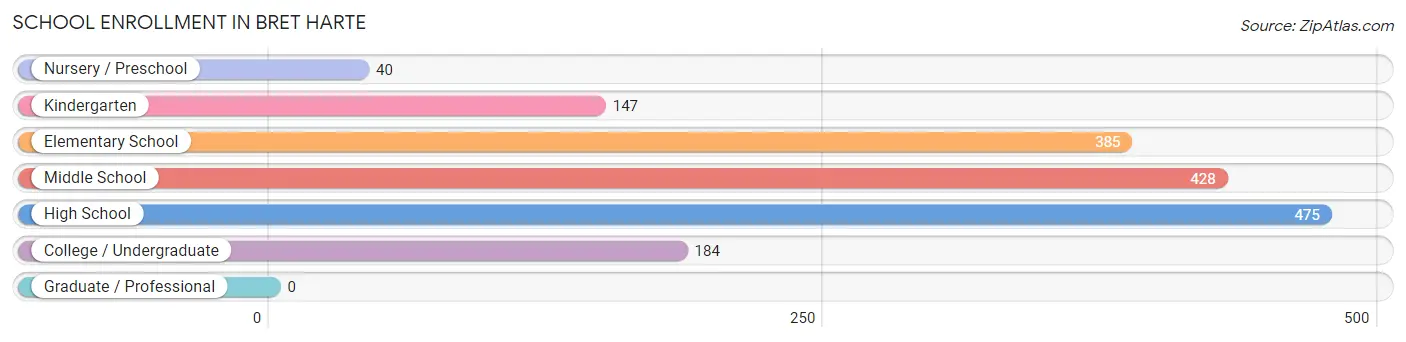
| School Level | # Students | % Students |
| Nursery / Preschool | 40 | 2.4% |
| Kindergarten | 147 | 8.9% |
| Elementary School | 385 | 23.2% |
| Middle School | 428 | 25.8% |
| High School | 475 | 28.6% |
| College / Undergraduate | 184 | 11.1% |
| Graduate / Professional | 0 | 0.0% |
| Total | 1,659 | 100.0% |
School Enrollment by Age by Funding Source in Bret Harte
Out of a total of 1,659 students who are enrolled in schools in Bret Harte, 18 (1.1%) attend a private institution, while the remaining 1,641 (98.9%) are enrolled in public schools. The age group of 25 to 34 year olds has the highest likelihood of being enrolled in private schools, with 8 (50.0% in the age bracket) enrolled. Conversely, the age group of 3 to 4 year olds has the lowest likelihood of being enrolled in a private school, with 67 (100.0% in the age bracket) attending a public institution.
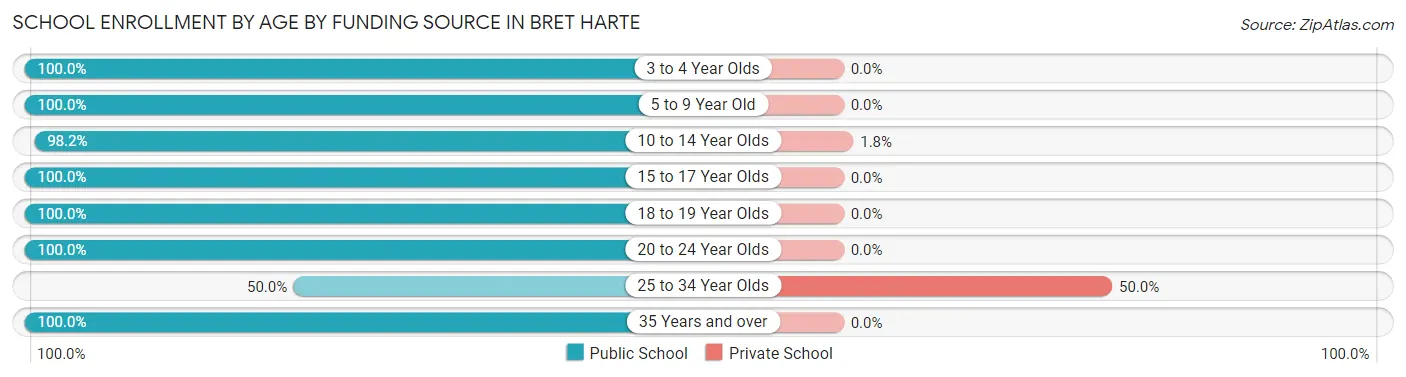
| Age Bracket | Public School | Private School |
| 3 to 4 Year Olds | 67 (100.0%) | 0 (0.0%) |
| 5 to 9 Year Old | 484 (100.0%) | 0 (0.0%) |
| 10 to 14 Year Olds | 548 (98.2%) | 10 (1.8%) |
| 15 to 17 Year Olds | 393 (100.0%) | 0 (0.0%) |
| 18 to 19 Year Olds | 80 (100.0%) | 0 (0.0%) |
| 20 to 24 Year Olds | 36 (100.0%) | 0 (0.0%) |
| 25 to 34 Year Olds | 8 (50.0%) | 8 (50.0%) |
| 35 Years and over | 25 (100.0%) | 0 (0.0%) |
| Total | 1,641 (98.9%) | 18 (1.1%) |
Educational Attainment by Field of Study in Bret Harte
Business (16 | 53.3%), liberal arts & history (8 | 26.7%), science & technology (2 | 6.7%), education (2 | 6.7%), and visual & performing arts (2 | 6.7%) are the most common fields of study among 30 individuals in Bret Harte who have obtained a bachelor's degree or higher.
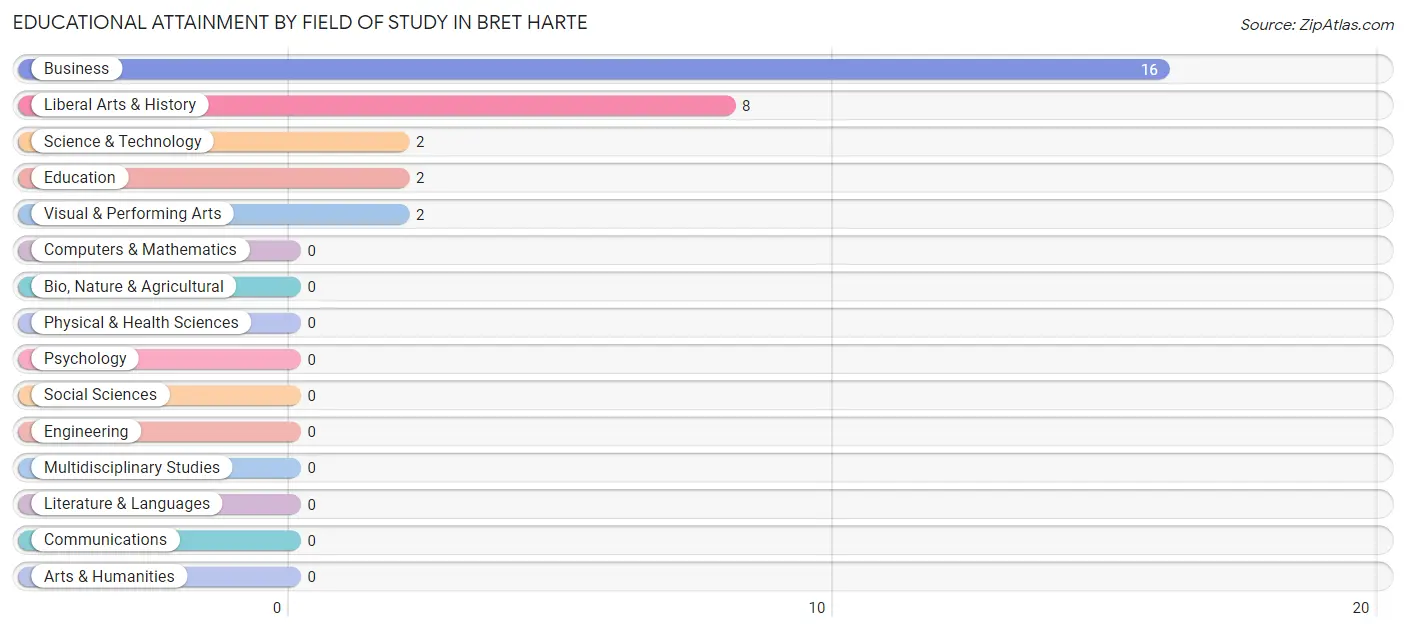
| Field of Study | # Graduates | % Graduates |
| Computers & Mathematics | 0 | 0.0% |
| Bio, Nature & Agricultural | 0 | 0.0% |
| Physical & Health Sciences | 0 | 0.0% |
| Psychology | 0 | 0.0% |
| Social Sciences | 0 | 0.0% |
| Engineering | 0 | 0.0% |
| Multidisciplinary Studies | 0 | 0.0% |
| Science & Technology | 2 | 6.7% |
| Business | 16 | 53.3% |
| Education | 2 | 6.7% |
| Literature & Languages | 0 | 0.0% |
| Liberal Arts & History | 8 | 26.7% |
| Visual & Performing Arts | 2 | 6.7% |
| Communications | 0 | 0.0% |
| Arts & Humanities | 0 | 0.0% |
| Total | 30 | 100.0% |
Transportation & Commute in Bret Harte
Vehicle Availability by Sex in Bret Harte
The most prevalent vehicle ownership categories in Bret Harte are males with 2 vehicles (350, accounting for 39.4%) and females with 2 vehicles (160, making up 73.4%).
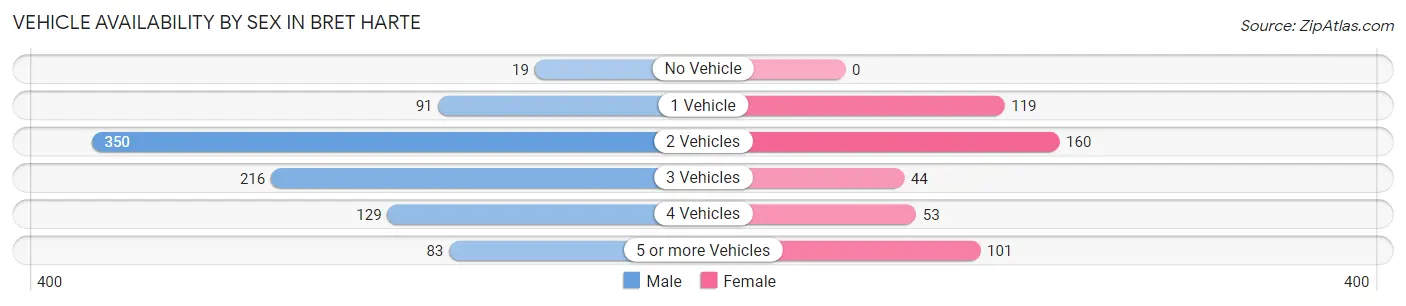
| Vehicles Available | Male | Female |
| No Vehicle | 19 (2.1%) | 0 (0.0%) |
| 1 Vehicle | 91 (10.2%) | 119 (24.9%) |
| 2 Vehicles | 350 (39.4%) | 160 (33.5%) |
| 3 Vehicles | 216 (24.3%) | 44 (9.2%) |
| 4 Vehicles | 129 (14.5%) | 53 (11.1%) |
| 5 or more Vehicles | 83 (9.3%) | 101 (21.2%) |
| Total | 888 (100.0%) | 477 (100.0%) |
Commute Time in Bret Harte
The most frequently occuring commute durations in Bret Harte are 20 to 24 minutes (263 commuters, 19.9%), 15 to 19 minutes (248 commuters, 18.7%), and 30 to 34 minutes (184 commuters, 13.9%).
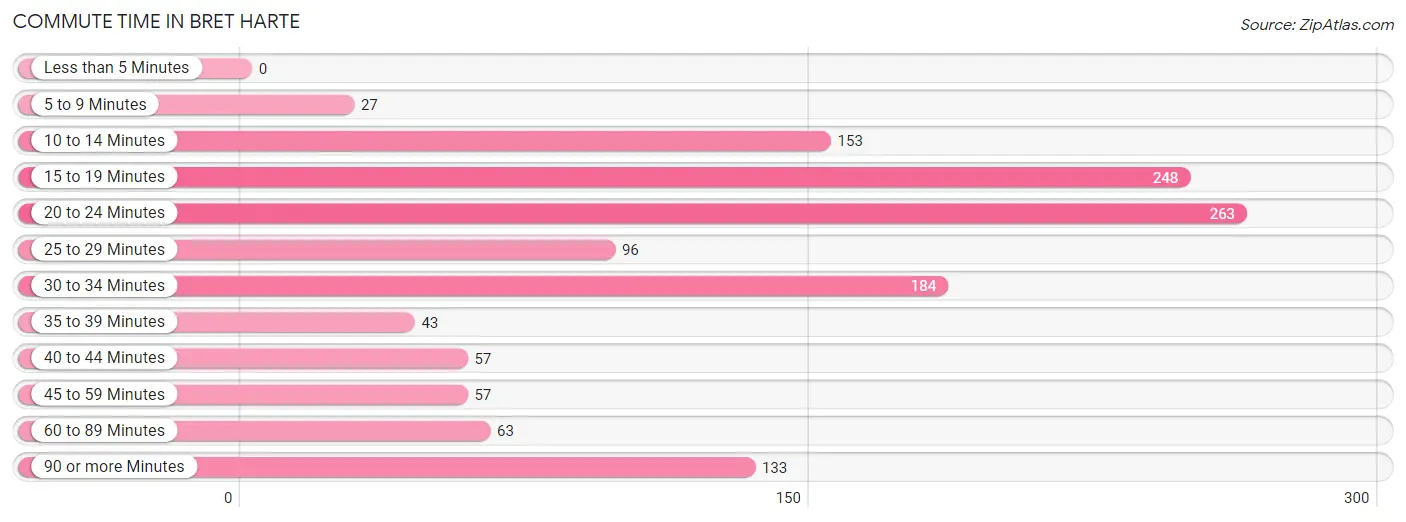
| Commute Time | # Commuters | % Commuters |
| Less than 5 Minutes | 0 | 0.0% |
| 5 to 9 Minutes | 27 | 2.0% |
| 10 to 14 Minutes | 153 | 11.6% |
| 15 to 19 Minutes | 248 | 18.7% |
| 20 to 24 Minutes | 263 | 19.9% |
| 25 to 29 Minutes | 96 | 7.2% |
| 30 to 34 Minutes | 184 | 13.9% |
| 35 to 39 Minutes | 43 | 3.3% |
| 40 to 44 Minutes | 57 | 4.3% |
| 45 to 59 Minutes | 57 | 4.3% |
| 60 to 89 Minutes | 63 | 4.8% |
| 90 or more Minutes | 133 | 10.1% |
Commute Time by Sex in Bret Harte
The most common commute times in Bret Harte are 20 to 24 minutes (179 commuters, 20.2%) for males and 15 to 19 minutes (177 commuters, 40.6%) for females.
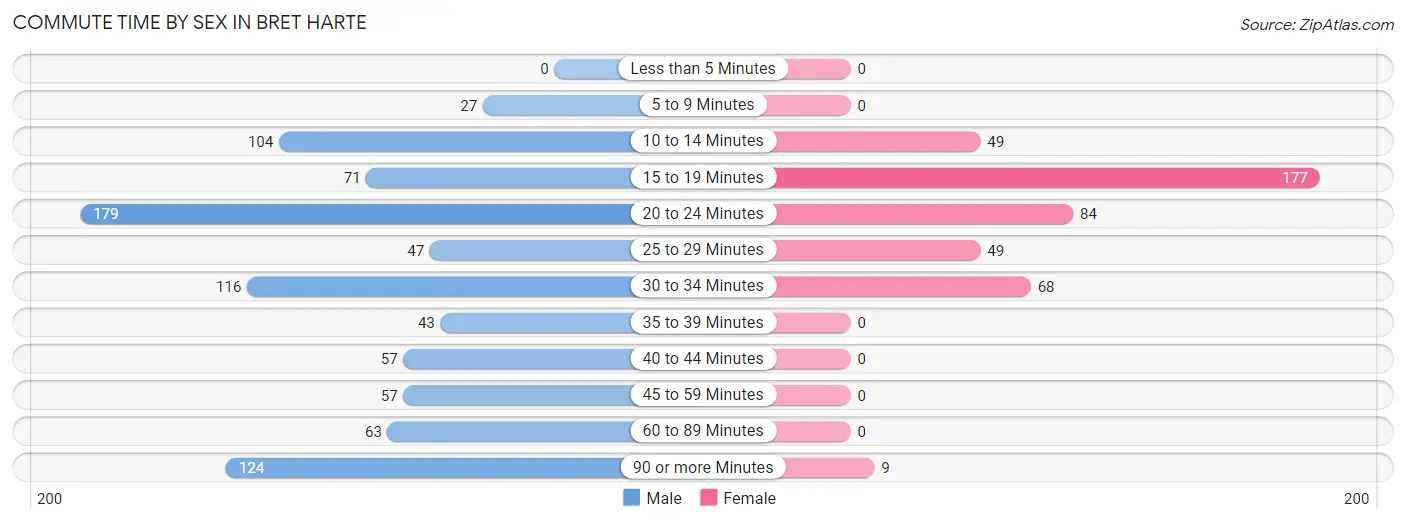
| Commute Time | Male | Female |
| Less than 5 Minutes | 0 (0.0%) | 0 (0.0%) |
| 5 to 9 Minutes | 27 (3.0%) | 0 (0.0%) |
| 10 to 14 Minutes | 104 (11.7%) | 49 (11.2%) |
| 15 to 19 Minutes | 71 (8.0%) | 177 (40.6%) |
| 20 to 24 Minutes | 179 (20.2%) | 84 (19.3%) |
| 25 to 29 Minutes | 47 (5.3%) | 49 (11.2%) |
| 30 to 34 Minutes | 116 (13.1%) | 68 (15.6%) |
| 35 to 39 Minutes | 43 (4.8%) | 0 (0.0%) |
| 40 to 44 Minutes | 57 (6.4%) | 0 (0.0%) |
| 45 to 59 Minutes | 57 (6.4%) | 0 (0.0%) |
| 60 to 89 Minutes | 63 (7.1%) | 0 (0.0%) |
| 90 or more Minutes | 124 (14.0%) | 9 (2.1%) |
Time of Departure to Work by Sex in Bret Harte
The most frequent times of departure to work in Bret Harte are 7:00 AM to 7:29 AM (151, 17.0%) for males and 6:00 AM to 6:29 AM (96, 22.0%) for females.
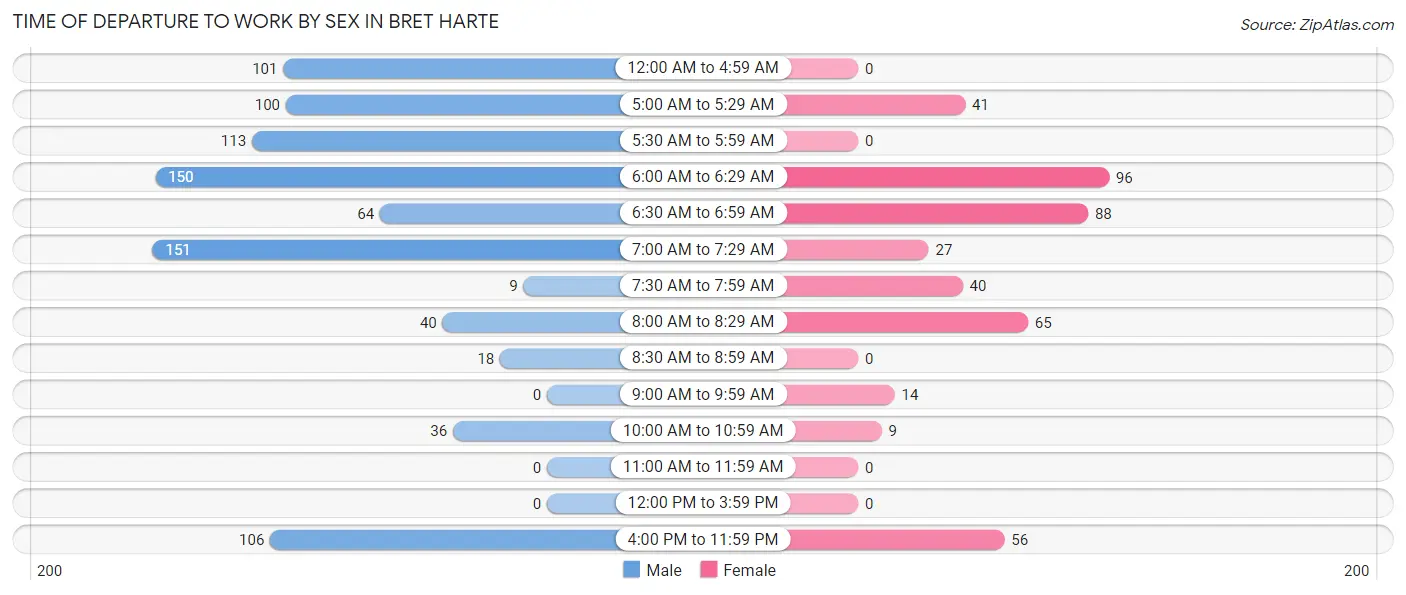
| Time of Departure | Male | Female |
| 12:00 AM to 4:59 AM | 101 (11.4%) | 0 (0.0%) |
| 5:00 AM to 5:29 AM | 100 (11.3%) | 41 (9.4%) |
| 5:30 AM to 5:59 AM | 113 (12.7%) | 0 (0.0%) |
| 6:00 AM to 6:29 AM | 150 (16.9%) | 96 (22.0%) |
| 6:30 AM to 6:59 AM | 64 (7.2%) | 88 (20.2%) |
| 7:00 AM to 7:29 AM | 151 (17.0%) | 27 (6.2%) |
| 7:30 AM to 7:59 AM | 9 (1.0%) | 40 (9.2%) |
| 8:00 AM to 8:29 AM | 40 (4.5%) | 65 (14.9%) |
| 8:30 AM to 8:59 AM | 18 (2.0%) | 0 (0.0%) |
| 9:00 AM to 9:59 AM | 0 (0.0%) | 14 (3.2%) |
| 10:00 AM to 10:59 AM | 36 (4.1%) | 9 (2.1%) |
| 11:00 AM to 11:59 AM | 0 (0.0%) | 0 (0.0%) |
| 12:00 PM to 3:59 PM | 0 (0.0%) | 0 (0.0%) |
| 4:00 PM to 11:59 PM | 106 (11.9%) | 56 (12.8%) |
| Total | 888 (100.0%) | 436 (100.0%) |
Housing Occupancy in Bret Harte
Occupancy by Ownership in Bret Harte
Of the total 1,147 dwellings in Bret Harte, owner-occupied units account for 426 (37.1%), while renter-occupied units make up 721 (62.9%).
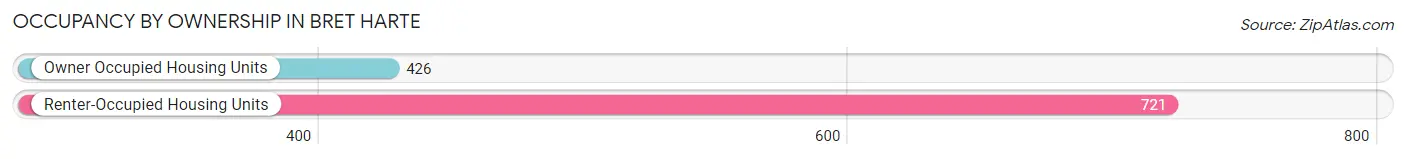
| Occupancy | # Housing Units | % Housing Units |
| Owner Occupied Housing Units | 426 | 37.1% |
| Renter-Occupied Housing Units | 721 | 62.9% |
| Total Occupied Housing Units | 1,147 | 100.0% |
Occupancy by Household Size in Bret Harte
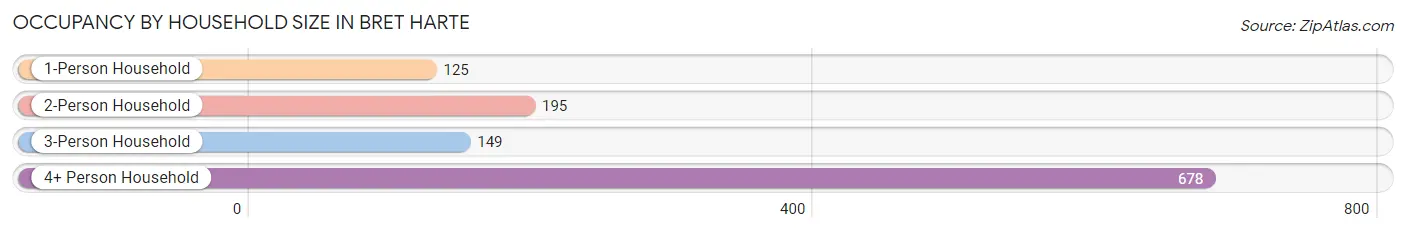
| Household Size | # Housing Units | % Housing Units |
| 1-Person Household | 125 | 10.9% |
| 2-Person Household | 195 | 17.0% |
| 3-Person Household | 149 | 13.0% |
| 4+ Person Household | 678 | 59.1% |
| Total Housing Units | 1,147 | 100.0% |
Occupancy by Ownership by Household Size in Bret Harte
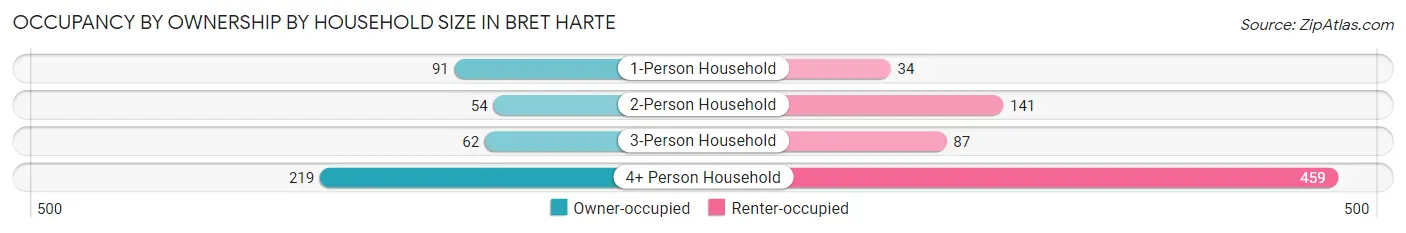
| Household Size | Owner-occupied | Renter-occupied |
| 1-Person Household | 91 (72.8%) | 34 (27.2%) |
| 2-Person Household | 54 (27.7%) | 141 (72.3%) |
| 3-Person Household | 62 (41.6%) | 87 (58.4%) |
| 4+ Person Household | 219 (32.3%) | 459 (67.7%) |
| Total Housing Units | 426 (37.1%) | 721 (62.9%) |
Occupancy by Educational Attainment in Bret Harte
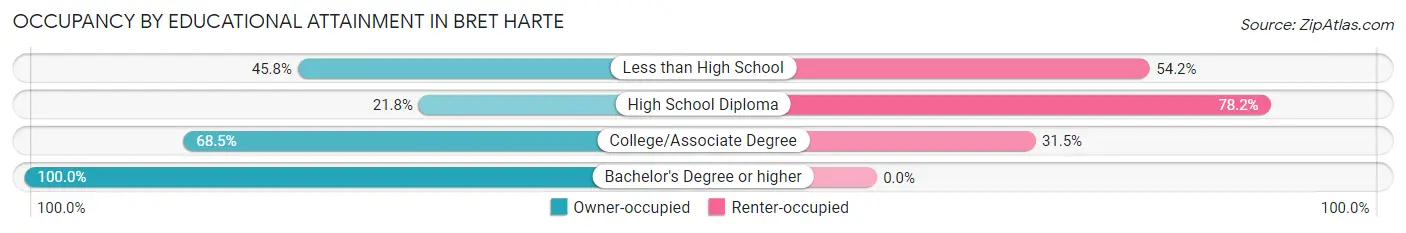
| Household Size | Owner-occupied | Renter-occupied |
| Less than High School | 236 (45.8%) | 279 (54.2%) |
| High School Diploma | 114 (21.8%) | 408 (78.2%) |
| College/Associate Degree | 74 (68.5%) | 34 (31.5%) |
| Bachelor's Degree or higher | 2 (100.0%) | 0 (0.0%) |
Occupancy by Age of Householder in Bret Harte
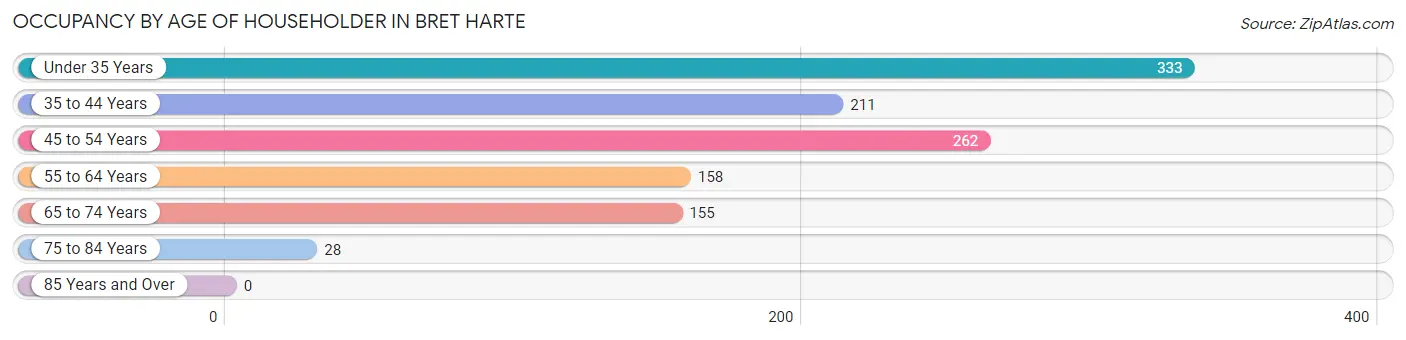
| Age Bracket | # Households | % Households |
| Under 35 Years | 333 | 29.0% |
| 35 to 44 Years | 211 | 18.4% |
| 45 to 54 Years | 262 | 22.8% |
| 55 to 64 Years | 158 | 13.8% |
| 65 to 74 Years | 155 | 13.5% |
| 75 to 84 Years | 28 | 2.4% |
| 85 Years and Over | 0 | 0.0% |
| Total | 1,147 | 100.0% |
Housing Finances in Bret Harte
Median Income by Occupancy in Bret Harte
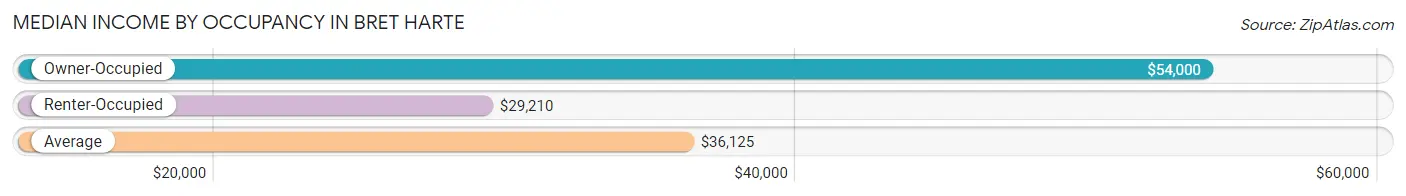
| Occupancy Type | # Households | Median Income |
| Owner-Occupied | 426 (37.1%) | $54,000 |
| Renter-Occupied | 721 (62.9%) | $29,210 |
| Average | 1,147 (100.0%) | $36,125 |
Occupancy by Householder Income Bracket in Bret Harte
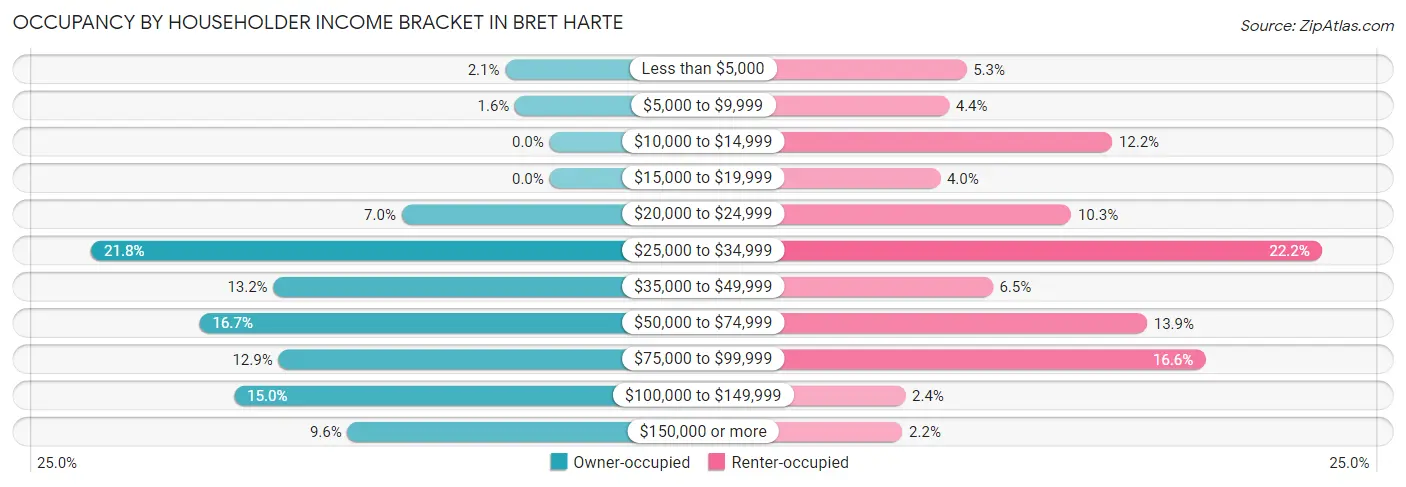
| Income Bracket | Owner-occupied | Renter-occupied |
| Less than $5,000 | 9 (2.1%) | 38 (5.3%) |
| $5,000 to $9,999 | 7 (1.6%) | 32 (4.4%) |
| $10,000 to $14,999 | 0 (0.0%) | 88 (12.2%) |
| $15,000 to $19,999 | 0 (0.0%) | 29 (4.0%) |
| $20,000 to $24,999 | 30 (7.0%) | 74 (10.3%) |
| $25,000 to $34,999 | 93 (21.8%) | 160 (22.2%) |
| $35,000 to $49,999 | 56 (13.2%) | 47 (6.5%) |
| $50,000 to $74,999 | 71 (16.7%) | 100 (13.9%) |
| $75,000 to $99,999 | 55 (12.9%) | 120 (16.6%) |
| $100,000 to $149,999 | 64 (15.0%) | 17 (2.4%) |
| $150,000 or more | 41 (9.6%) | 16 (2.2%) |
| Total | 426 (100.0%) | 721 (100.0%) |
Monthly Housing Cost Tiers in Bret Harte
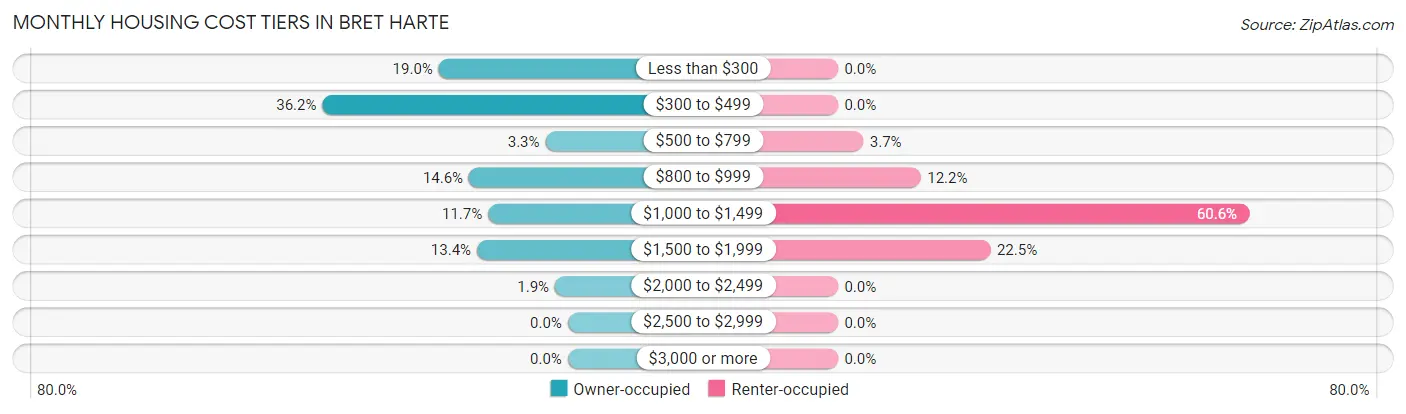
| Monthly Cost | Owner-occupied | Renter-occupied |
| Less than $300 | 81 (19.0%) | 0 (0.0%) |
| $300 to $499 | 154 (36.1%) | 0 (0.0%) |
| $500 to $799 | 14 (3.3%) | 27 (3.7%) |
| $800 to $999 | 62 (14.5%) | 88 (12.2%) |
| $1,000 to $1,499 | 50 (11.7%) | 437 (60.6%) |
| $1,500 to $1,999 | 57 (13.4%) | 162 (22.5%) |
| $2,000 to $2,499 | 8 (1.9%) | 0 (0.0%) |
| $2,500 to $2,999 | 0 (0.0%) | 0 (0.0%) |
| $3,000 or more | 0 (0.0%) | 0 (0.0%) |
| Total | 426 (100.0%) | 721 (100.0%) |
Physical Housing Characteristics in Bret Harte
Housing Structures in Bret Harte
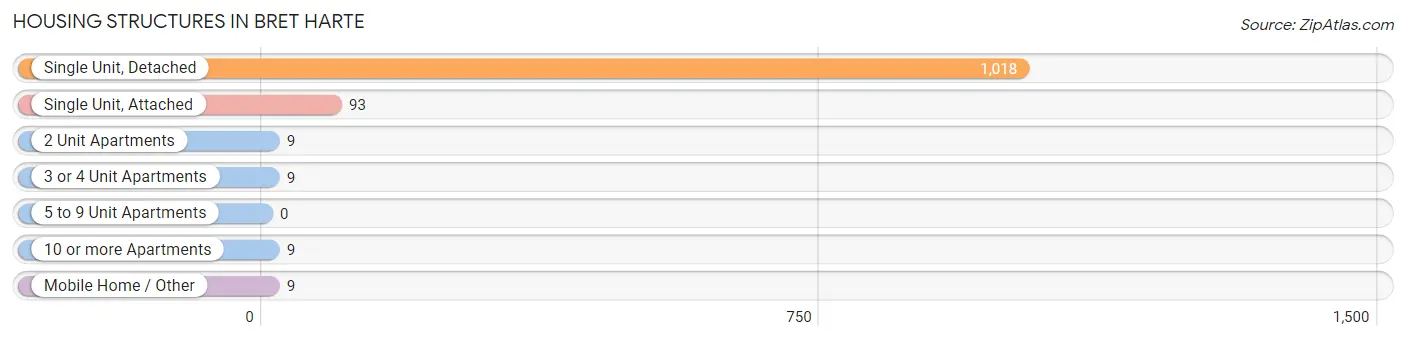
| Structure Type | # Housing Units | % Housing Units |
| Single Unit, Detached | 1,018 | 88.7% |
| Single Unit, Attached | 93 | 8.1% |
| 2 Unit Apartments | 9 | 0.8% |
| 3 or 4 Unit Apartments | 9 | 0.8% |
| 5 to 9 Unit Apartments | 0 | 0.0% |
| 10 or more Apartments | 9 | 0.8% |
| Mobile Home / Other | 9 | 0.8% |
| Total | 1,147 | 100.0% |
Housing Structures by Occupancy in Bret Harte
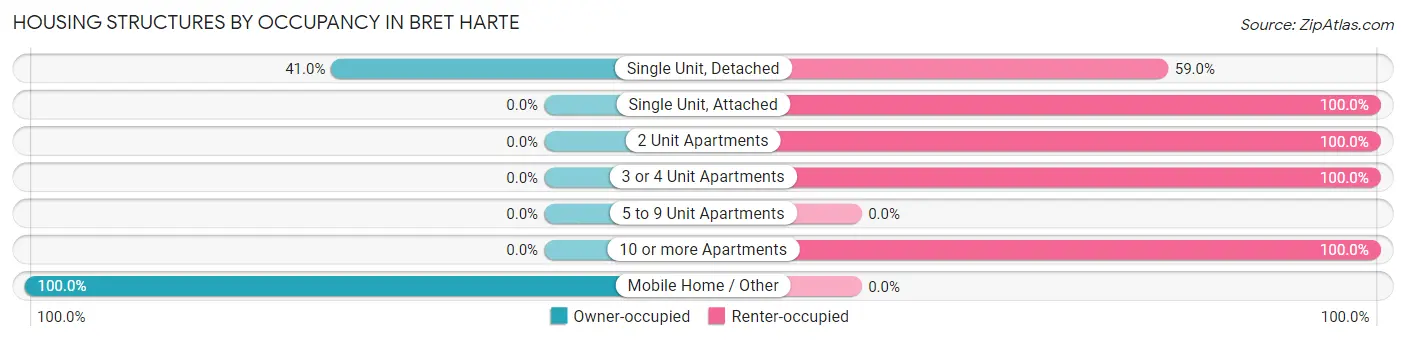
| Structure Type | Owner-occupied | Renter-occupied |
| Single Unit, Detached | 417 (41.0%) | 601 (59.0%) |
| Single Unit, Attached | 0 (0.0%) | 93 (100.0%) |
| 2 Unit Apartments | 0 (0.0%) | 9 (100.0%) |
| 3 or 4 Unit Apartments | 0 (0.0%) | 9 (100.0%) |
| 5 to 9 Unit Apartments | 0 (0.0%) | 0 (0.0%) |
| 10 or more Apartments | 0 (0.0%) | 9 (100.0%) |
| Mobile Home / Other | 9 (100.0%) | 0 (0.0%) |
| Total | 426 (37.1%) | 721 (62.9%) |
Housing Structures by Number of Rooms in Bret Harte
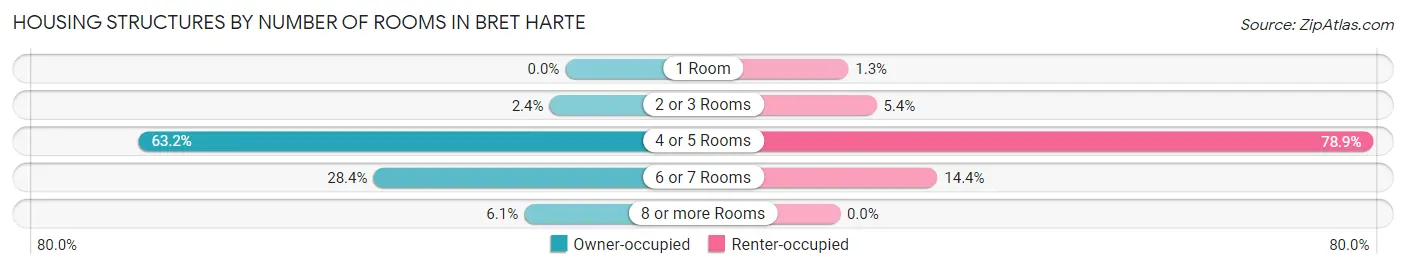
| Number of Rooms | Owner-occupied | Renter-occupied |
| 1 Room | 0 (0.0%) | 9 (1.3%) |
| 2 or 3 Rooms | 10 (2.4%) | 39 (5.4%) |
| 4 or 5 Rooms | 269 (63.1%) | 569 (78.9%) |
| 6 or 7 Rooms | 121 (28.4%) | 104 (14.4%) |
| 8 or more Rooms | 26 (6.1%) | 0 (0.0%) |
| Total | 426 (100.0%) | 721 (100.0%) |
Housing Structure by Heating Type in Bret Harte
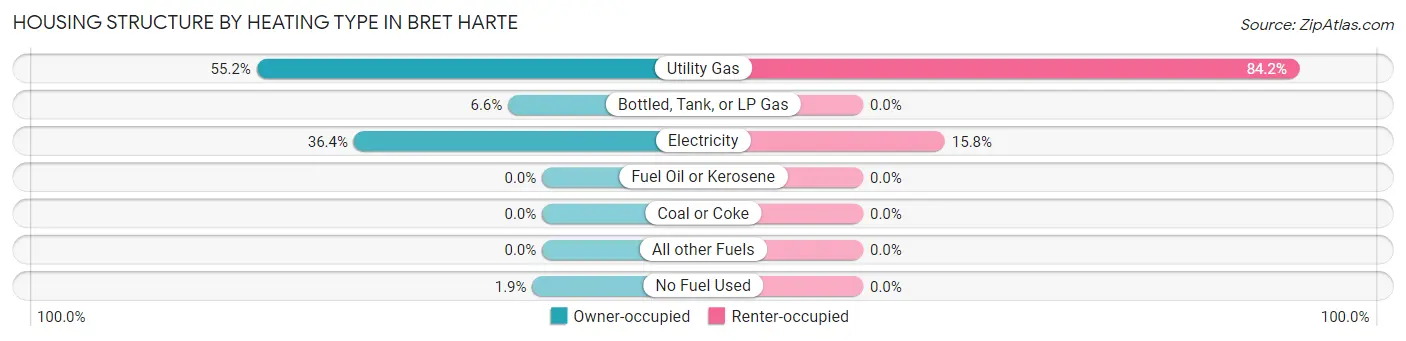
| Heating Type | Owner-occupied | Renter-occupied |
| Utility Gas | 235 (55.2%) | 607 (84.2%) |
| Bottled, Tank, or LP Gas | 28 (6.6%) | 0 (0.0%) |
| Electricity | 155 (36.4%) | 114 (15.8%) |
| Fuel Oil or Kerosene | 0 (0.0%) | 0 (0.0%) |
| Coal or Coke | 0 (0.0%) | 0 (0.0%) |
| All other Fuels | 0 (0.0%) | 0 (0.0%) |
| No Fuel Used | 8 (1.9%) | 0 (0.0%) |
| Total | 426 (100.0%) | 721 (100.0%) |
Household Vehicle Usage in Bret Harte
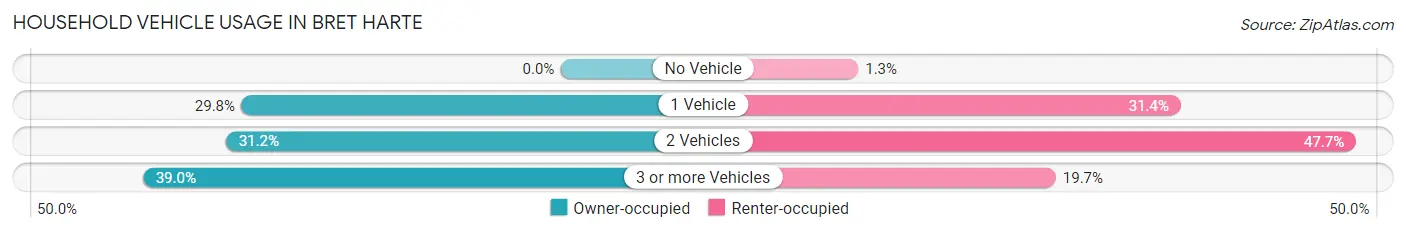
| Vehicles per Household | Owner-occupied | Renter-occupied |
| No Vehicle | 0 (0.0%) | 9 (1.3%) |
| 1 Vehicle | 127 (29.8%) | 226 (31.4%) |
| 2 Vehicles | 133 (31.2%) | 344 (47.7%) |
| 3 or more Vehicles | 166 (39.0%) | 142 (19.7%) |
| Total | 426 (100.0%) | 721 (100.0%) |
Real Estate & Mortgages in Bret Harte
Real Estate and Mortgage Overview in Bret Harte
| Characteristic | Without Mortgage | With Mortgage |
| Housing Units | 249 | 177 |
| Median Property Value | $171,400 | $245,800 |
| Median Household Income | $36,292 | $32 |
| Monthly Housing Costs | $361 | $0 |
| Real Estate Taxes | $1,246 | $0 |
Property Value by Mortgage Status in Bret Harte
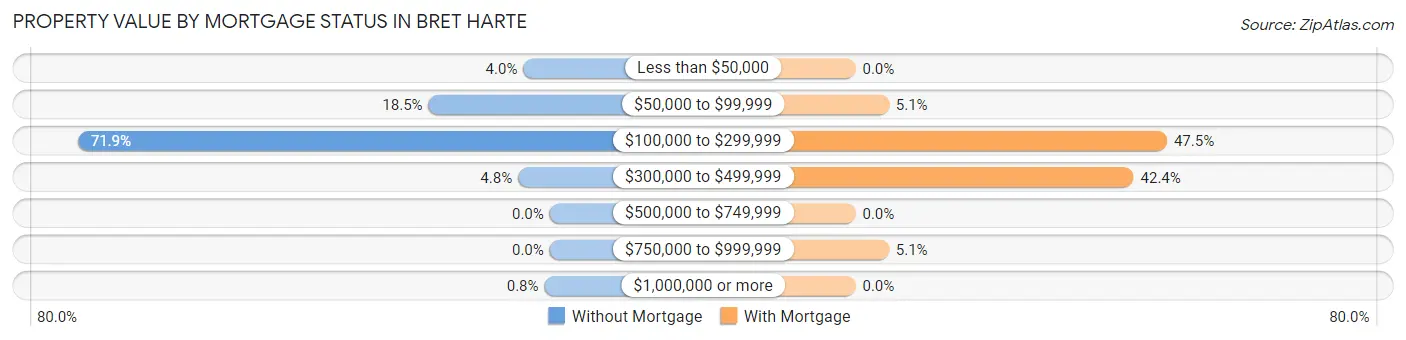
| Property Value | Without Mortgage | With Mortgage |
| Less than $50,000 | 10 (4.0%) | 0 (0.0%) |
| $50,000 to $99,999 | 46 (18.5%) | 9 (5.1%) |
| $100,000 to $299,999 | 179 (71.9%) | 84 (47.5%) |
| $300,000 to $499,999 | 12 (4.8%) | 75 (42.4%) |
| $500,000 to $749,999 | 0 (0.0%) | 0 (0.0%) |
| $750,000 to $999,999 | 0 (0.0%) | 9 (5.1%) |
| $1,000,000 or more | 2 (0.8%) | 0 (0.0%) |
| Total | 249 (100.0%) | 177 (100.0%) |
Household Income by Mortgage Status in Bret Harte
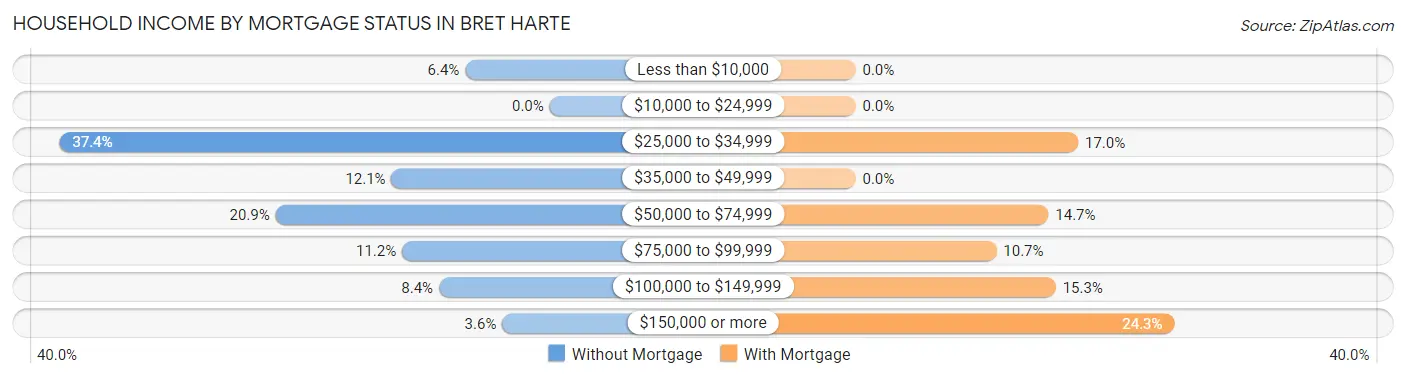
| Household Income | Without Mortgage | With Mortgage |
| Less than $10,000 | 16 (6.4%) | 0 (0.0%) |
| $10,000 to $24,999 | 0 (0.0%) | 0 (0.0%) |
| $25,000 to $34,999 | 93 (37.3%) | 30 (17.0%) |
| $35,000 to $49,999 | 30 (12.0%) | 0 (0.0%) |
| $50,000 to $74,999 | 52 (20.9%) | 26 (14.7%) |
| $75,000 to $99,999 | 28 (11.2%) | 19 (10.7%) |
| $100,000 to $149,999 | 21 (8.4%) | 27 (15.2%) |
| $150,000 or more | 9 (3.6%) | 43 (24.3%) |
| Total | 249 (100.0%) | 177 (100.0%) |
Property Value to Household Income Ratio in Bret Harte
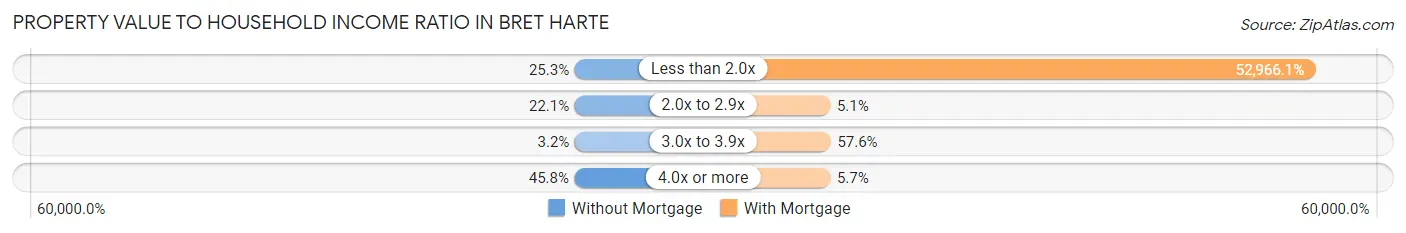
| Value-to-Income Ratio | Without Mortgage | With Mortgage |
| Less than 2.0x | 63 (25.3%) | 93,750 (52,966.1%) |
| 2.0x to 2.9x | 55 (22.1%) | 9 (5.1%) |
| 3.0x to 3.9x | 8 (3.2%) | 102 (57.6%) |
| 4.0x or more | 114 (45.8%) | 10 (5.7%) |
| Total | 249 (100.0%) | 177 (100.0%) |
Real Estate Taxes by Mortgage Status in Bret Harte
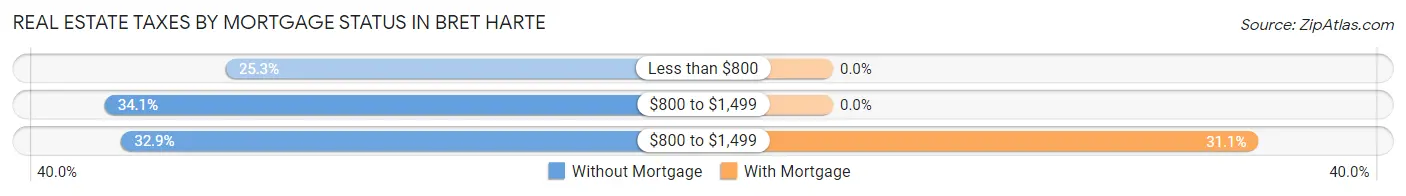
| Property Taxes | Without Mortgage | With Mortgage |
| Less than $800 | 63 (25.3%) | 0 (0.0%) |
| $800 to $1,499 | 85 (34.1%) | 0 (0.0%) |
| $800 to $1,499 | 82 (32.9%) | 55 (31.1%) |
| Total | 249 (100.0%) | 177 (100.0%) |
Health & Disability in Bret Harte
Health Insurance Coverage by Age in Bret Harte
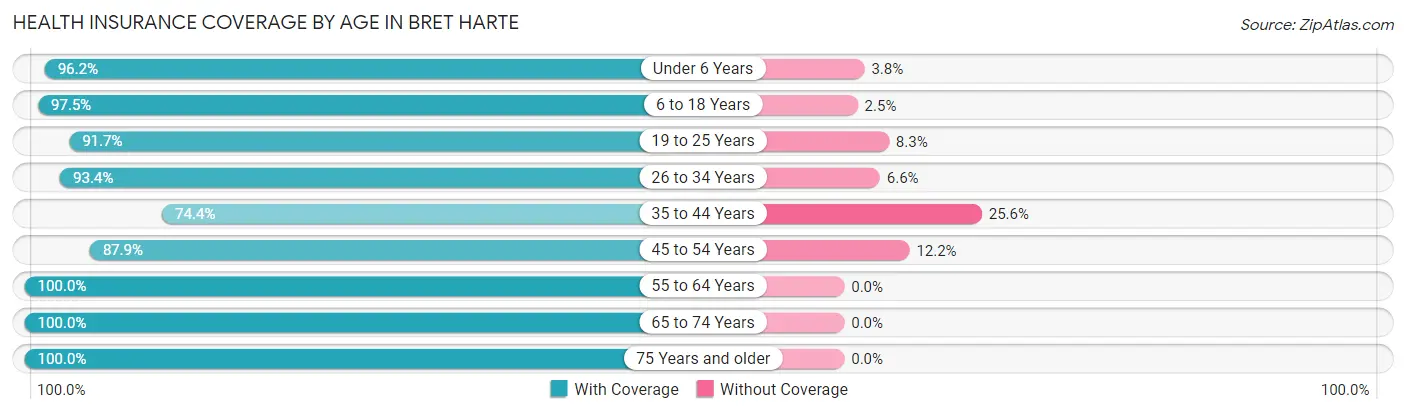
| Age Bracket | With Coverage | Without Coverage |
| Under 6 Years | 717 (96.2%) | 28 (3.8%) |
| 6 to 18 Years | 1,412 (97.5%) | 36 (2.5%) |
| 19 to 25 Years | 430 (91.7%) | 39 (8.3%) |
| 26 to 34 Years | 662 (93.4%) | 47 (6.6%) |
| 35 to 44 Years | 435 (74.4%) | 150 (25.6%) |
| 45 to 54 Years | 376 (87.8%) | 52 (12.1%) |
| 55 to 64 Years | 254 (100.0%) | 0 (0.0%) |
| 65 to 74 Years | 238 (100.0%) | 0 (0.0%) |
| 75 Years and older | 50 (100.0%) | 0 (0.0%) |
| Total | 4,574 (92.8%) | 352 (7.1%) |
Health Insurance Coverage by Citizenship Status in Bret Harte
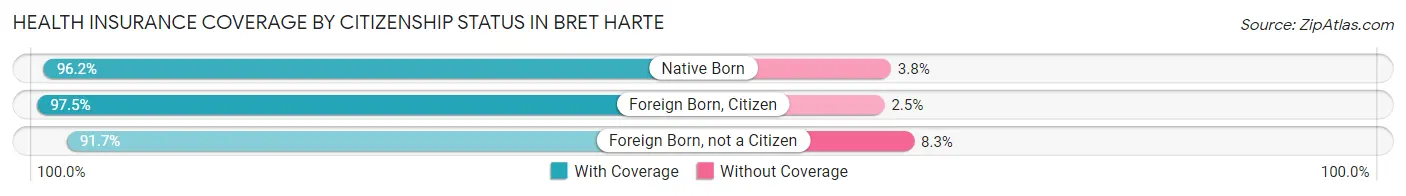
| Citizenship Status | With Coverage | Without Coverage |
| Native Born | 717 (96.2%) | 28 (3.8%) |
| Foreign Born, Citizen | 1,412 (97.5%) | 36 (2.5%) |
| Foreign Born, not a Citizen | 430 (91.7%) | 39 (8.3%) |
Health Insurance Coverage by Household Income in Bret Harte
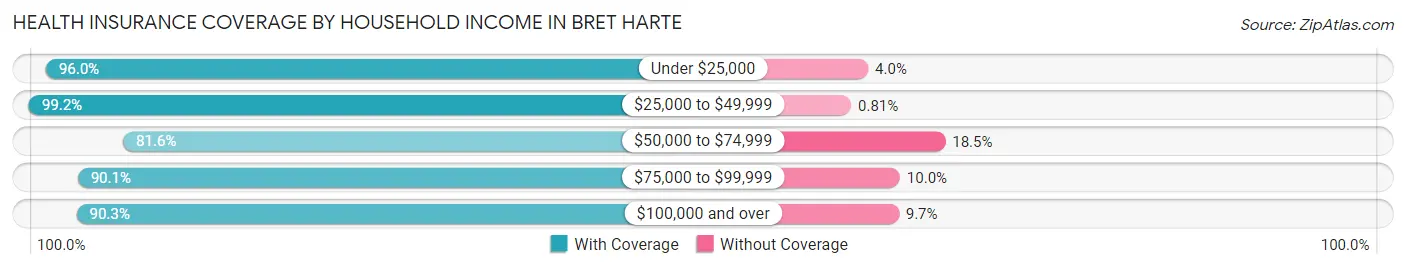
| Household Income | With Coverage | Without Coverage |
| Under $25,000 | 1,151 (96.0%) | 48 (4.0%) |
| $25,000 to $49,999 | 1,222 (99.2%) | 10 (0.8%) |
| $50,000 to $74,999 | 464 (81.6%) | 105 (18.4%) |
| $75,000 to $99,999 | 1,023 (90.0%) | 113 (10.0%) |
| $100,000 and over | 704 (90.3%) | 76 (9.7%) |
Public vs Private Health Insurance Coverage by Age in Bret Harte
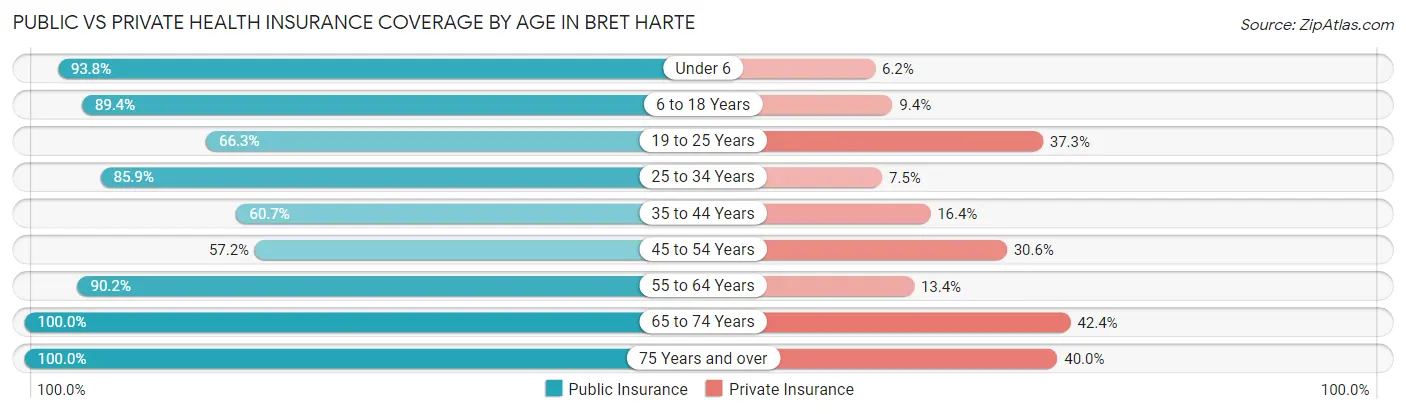
| Age Bracket | Public Insurance | Private Insurance |
| Under 6 | 699 (93.8%) | 46 (6.2%) |
| 6 to 18 Years | 1,294 (89.4%) | 136 (9.4%) |
| 19 to 25 Years | 311 (66.3%) | 175 (37.3%) |
| 25 to 34 Years | 609 (85.9%) | 53 (7.5%) |
| 35 to 44 Years | 355 (60.7%) | 96 (16.4%) |
| 45 to 54 Years | 245 (57.2%) | 131 (30.6%) |
| 55 to 64 Years | 229 (90.2%) | 34 (13.4%) |
| 65 to 74 Years | 238 (100.0%) | 101 (42.4%) |
| 75 Years and over | 50 (100.0%) | 20 (40.0%) |
| Total | 4,030 (81.8%) | 792 (16.1%) |
Disability Status by Sex by Age in Bret Harte
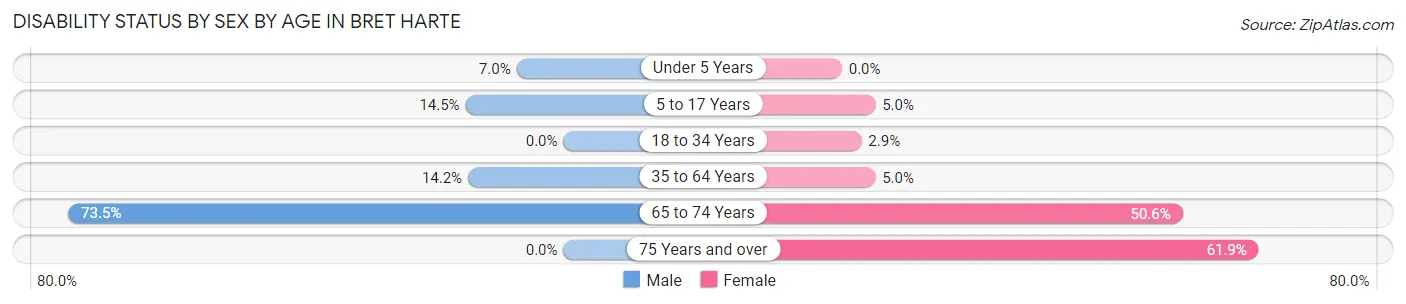
| Age Bracket | Male | Female |
| Under 5 Years | 33 (7.0%) | 0 (0.0%) |
| 5 to 17 Years | 116 (14.5%) | 32 (5.0%) |
| 18 to 34 Years | 0 (0.0%) | 20 (2.9%) |
| 35 to 64 Years | 91 (14.2%) | 31 (5.0%) |
| 65 to 74 Years | 50 (73.5%) | 86 (50.6%) |
| 75 Years and over | 0 (0.0%) | 13 (61.9%) |
Disability Class by Sex by Age in Bret Harte
Disability Class: Hearing Difficulty
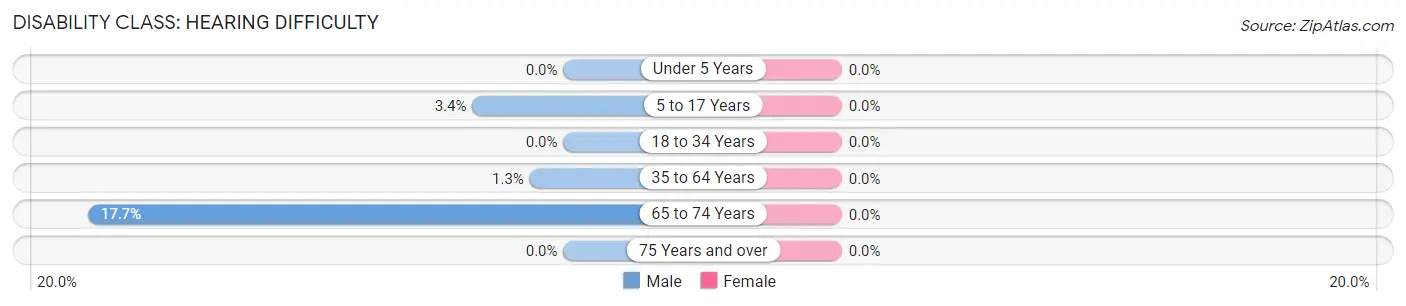
| Age Bracket | Male | Female |
| Under 5 Years | 0 (0.0%) | 0 (0.0%) |
| 5 to 17 Years | 27 (3.4%) | 0 (0.0%) |
| 18 to 34 Years | 0 (0.0%) | 0 (0.0%) |
| 35 to 64 Years | 8 (1.3%) | 0 (0.0%) |
| 65 to 74 Years | 12 (17.6%) | 0 (0.0%) |
| 75 Years and over | 0 (0.0%) | 0 (0.0%) |
Disability Class: Vision Difficulty
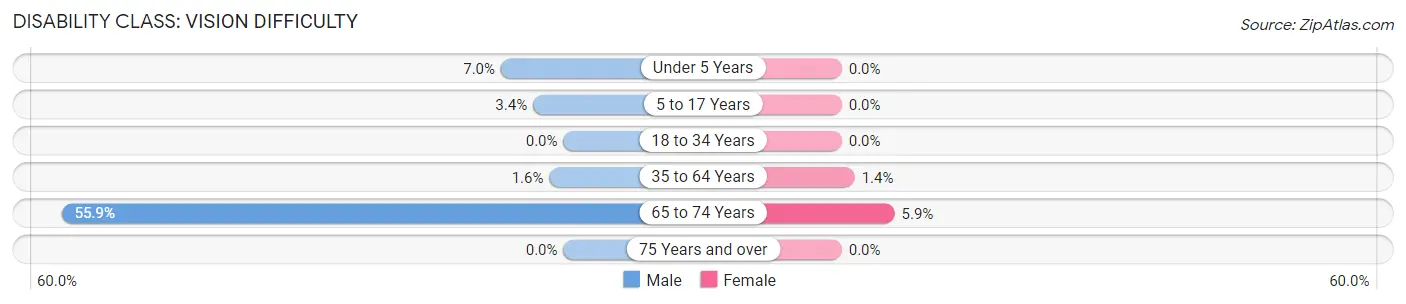
| Age Bracket | Male | Female |
| Under 5 Years | 33 (7.0%) | 0 (0.0%) |
| 5 to 17 Years | 27 (3.4%) | 0 (0.0%) |
| 18 to 34 Years | 0 (0.0%) | 0 (0.0%) |
| 35 to 64 Years | 10 (1.6%) | 9 (1.4%) |
| 65 to 74 Years | 38 (55.9%) | 10 (5.9%) |
| 75 Years and over | 0 (0.0%) | 0 (0.0%) |
Disability Class: Cognitive Difficulty
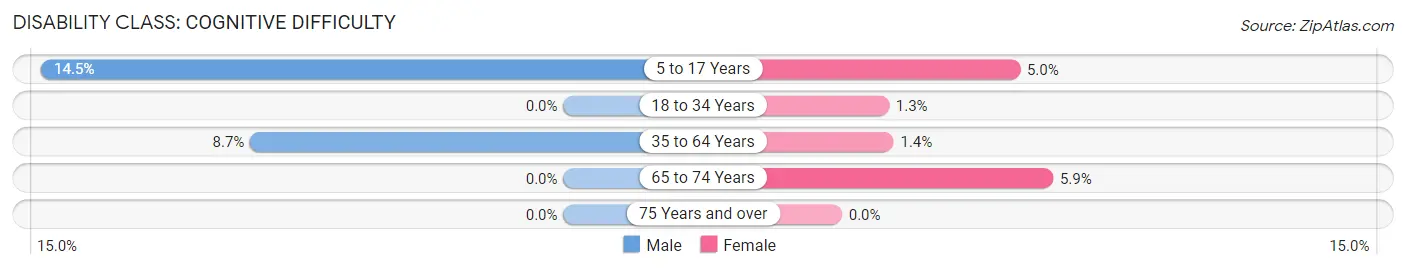
| Age Bracket | Male | Female |
| 5 to 17 Years | 116 (14.5%) | 32 (5.0%) |
| 18 to 34 Years | 0 (0.0%) | 9 (1.3%) |
| 35 to 64 Years | 56 (8.7%) | 9 (1.4%) |
| 65 to 74 Years | 0 (0.0%) | 10 (5.9%) |
| 75 Years and over | 0 (0.0%) | 0 (0.0%) |
Disability Class: Ambulatory Difficulty
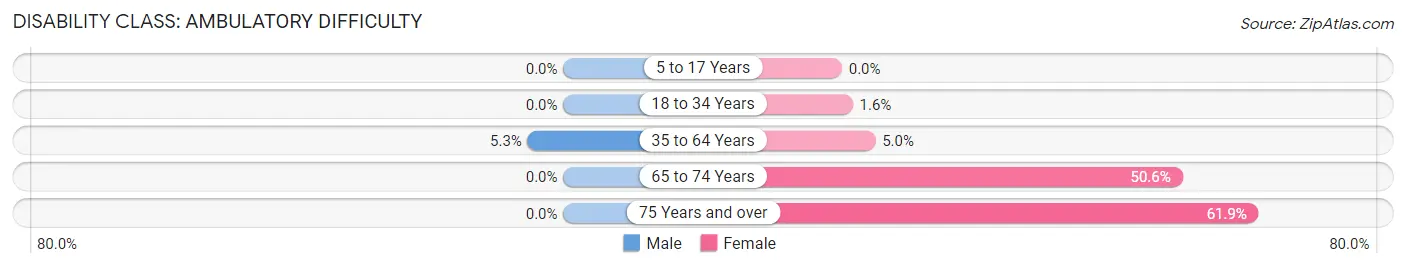
| Age Bracket | Male | Female |
| 5 to 17 Years | 0 (0.0%) | 0 (0.0%) |
| 18 to 34 Years | 0 (0.0%) | 11 (1.6%) |
| 35 to 64 Years | 34 (5.3%) | 31 (5.0%) |
| 65 to 74 Years | 0 (0.0%) | 86 (50.6%) |
| 75 Years and over | 0 (0.0%) | 13 (61.9%) |
Disability Class: Self-Care Difficulty
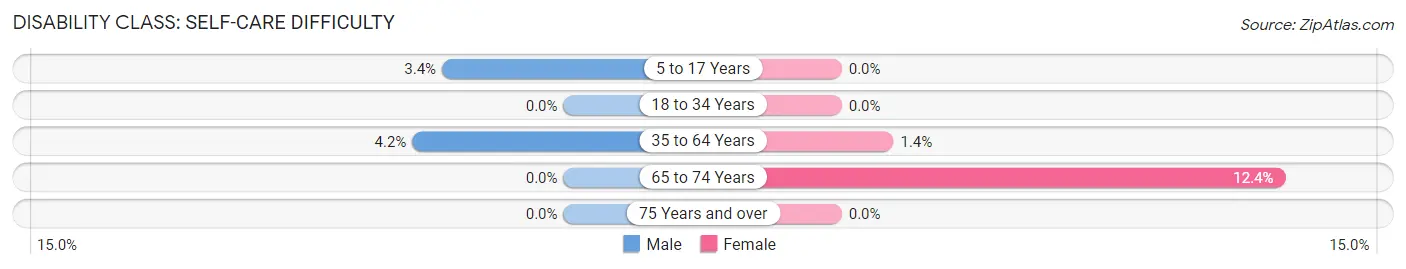
| Age Bracket | Male | Female |
| 5 to 17 Years | 27 (3.4%) | 0 (0.0%) |
| 18 to 34 Years | 0 (0.0%) | 0 (0.0%) |
| 35 to 64 Years | 27 (4.2%) | 9 (1.4%) |
| 65 to 74 Years | 0 (0.0%) | 21 (12.3%) |
| 75 Years and over | 0 (0.0%) | 0 (0.0%) |
Technology Access in Bret Harte
Computing Device Access in Bret Harte
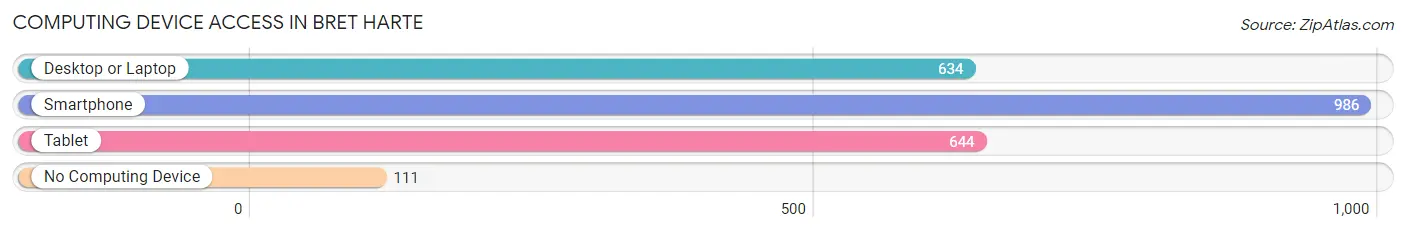
| Device Type | # Households | % Households |
| Desktop or Laptop | 634 | 55.3% |
| Smartphone | 986 | 86.0% |
| Tablet | 644 | 56.1% |
| No Computing Device | 111 | 9.7% |
| Total | 1,147 | 100.0% |
Internet Access in Bret Harte
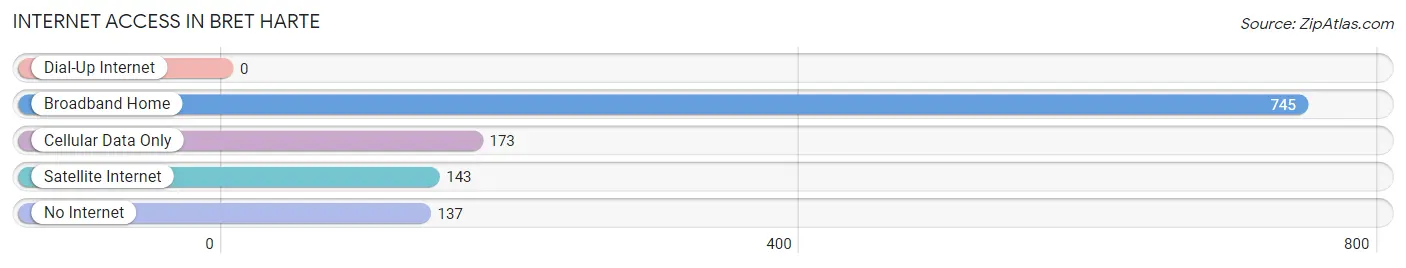
| Internet Type | # Households | % Households |
| Dial-Up Internet | 0 | 0.0% |
| Broadband Home | 745 | 64.9% |
| Cellular Data Only | 173 | 15.1% |
| Satellite Internet | 143 | 12.5% |
| No Internet | 137 | 11.9% |
| Total | 1,147 | 100.0% |
Bret Harte Summary
Bret Harte, California is a small unincorporated community located in Calaveras County, California. It is situated in the foothills of the Sierra Nevada Mountains, approximately 25 miles east of Angels Camp and 25 miles west of Sonora. The population of Bret Harte was estimated to be 1,845 in 2019.
History
Bret Harte was founded in 1854 by a group of miners who named the town after the famous American author, Bret Harte. The town was originally known as “Garrote”, but the name was changed to honor Harte’s literary works. The town was a popular destination for miners during the California Gold Rush, and it was also a popular stop for stagecoaches traveling between Sonora and Angels Camp.
In the late 1800s, Bret Harte was a bustling town with a population of over 1,000 people. It had several stores, saloons, hotels, and a post office. The town was also home to a number of churches, including the Bret Harte Methodist Church, which was founded in 1859.
In the early 1900s, the population of Bret Harte began to decline as the gold rush ended and the town’s economy shifted to logging and ranching. The town’s population continued to decline until the 1950s, when it began to experience a resurgence due to the growth of nearby cities such as Angels Camp and Sonora.
Geography
Bret Harte is located in the foothills of the Sierra Nevada Mountains, approximately 25 miles east of Angels Camp and 25 miles west of Sonora. The town is situated at an elevation of 1,845 feet above sea level.
The town is surrounded by rolling hills and is home to several creeks, including the Stanislaus River, which flows through the town. The town is also home to several small lakes, including Lake Tulloch, which is located just outside of town.
The climate in Bret Harte is mild and temperate, with hot summers and cool winters. The average high temperature in the summer is around 90 degrees Fahrenheit, while the average low temperature in the winter is around 40 degrees Fahrenheit.
Economy
The economy of Bret Harte is largely based on tourism and agriculture. The town is home to several wineries, as well as a number of small businesses, including restaurants, shops, and galleries.
The town is also home to a number of outdoor recreation activities, including fishing, camping, and hiking. The nearby Stanislaus River is a popular destination for kayaking and rafting.
Demographics
The population of Bret Harte was estimated to be 1,845 in 2019. The town is predominantly white, with a small Hispanic population. The median household income in the town is $50,000, and the median home value is $250,000.
Conclusion
Bret Harte is a small unincorporated community located in Calaveras County, California. It is situated in the foothills of the Sierra Nevada Mountains, approximately 25 miles east of Angels Camp and 25 miles west of Sonora. The population of Bret Harte was estimated to be 1,845 in 2019. The town is predominantly white, with a small Hispanic population. The economy of Bret Harte is largely based on tourism and agriculture, and the town is home to several wineries, as well as a number of small businesses. The town is also home to a number of outdoor recreation activities, including fishing, camping, and hiking.
Common Questions
What is Per Capita Income in Bret Harte?
Per Capita income in Bret Harte is $12,497.
What is the Median Family Income in Bret Harte?
Median Family Income in Bret Harte is $32,237.
What is the Median Household income in Bret Harte?
Median Household Income in Bret Harte is $36,125.
What is Income or Wage Gap in Bret Harte?
Income or Wage Gap in Bret Harte is 35.2%.
Women in Bret Harte earn 64.8 cents for every dollar earned by a man.
What is Inequality or Gini Index in Bret Harte?
Inequality or Gini Index in Bret Harte is 0.42.
What is the Total Population of Bret Harte?
Total Population of Bret Harte is 4,926.
What is the Total Male Population of Bret Harte?
Total Male Population of Bret Harte is 2,613.
What is the Total Female Population of Bret Harte?
Total Female Population of Bret Harte is 2,313.
What is the Ratio of Males per 100 Females in Bret Harte?
There are 112.97 Males per 100 Females in Bret Harte.
What is the Ratio of Females per 100 Males in Bret Harte?
There are 88.52 Females per 100 Males in Bret Harte.
What is the Median Population Age in Bret Harte?
Median Population Age in Bret Harte is 22.6 Years.
What is the Average Family Size in Bret Harte
Average Family Size in Bret Harte is 4.7 People.
What is the Average Household Size in Bret Harte
Average Household Size in Bret Harte is 4.3 People.
How Large is the Labor Force in Bret Harte?
There are 1,722 People in the Labor Forcein in Bret Harte.
What is the Percentage of People in the Labor Force in Bret Harte?
55.4% of People are in the Labor Force in Bret Harte.
What is the Unemployment Rate in Bret Harte?
Unemployment Rate in Bret Harte is 12.6%.