Cities with the Highest Percentage of Population with a Degree in Liberal Arts and History in North Carolina
RELATED REPORTS & OPTIONS
Liberal Arts and History
North Carolina
Compare Cities
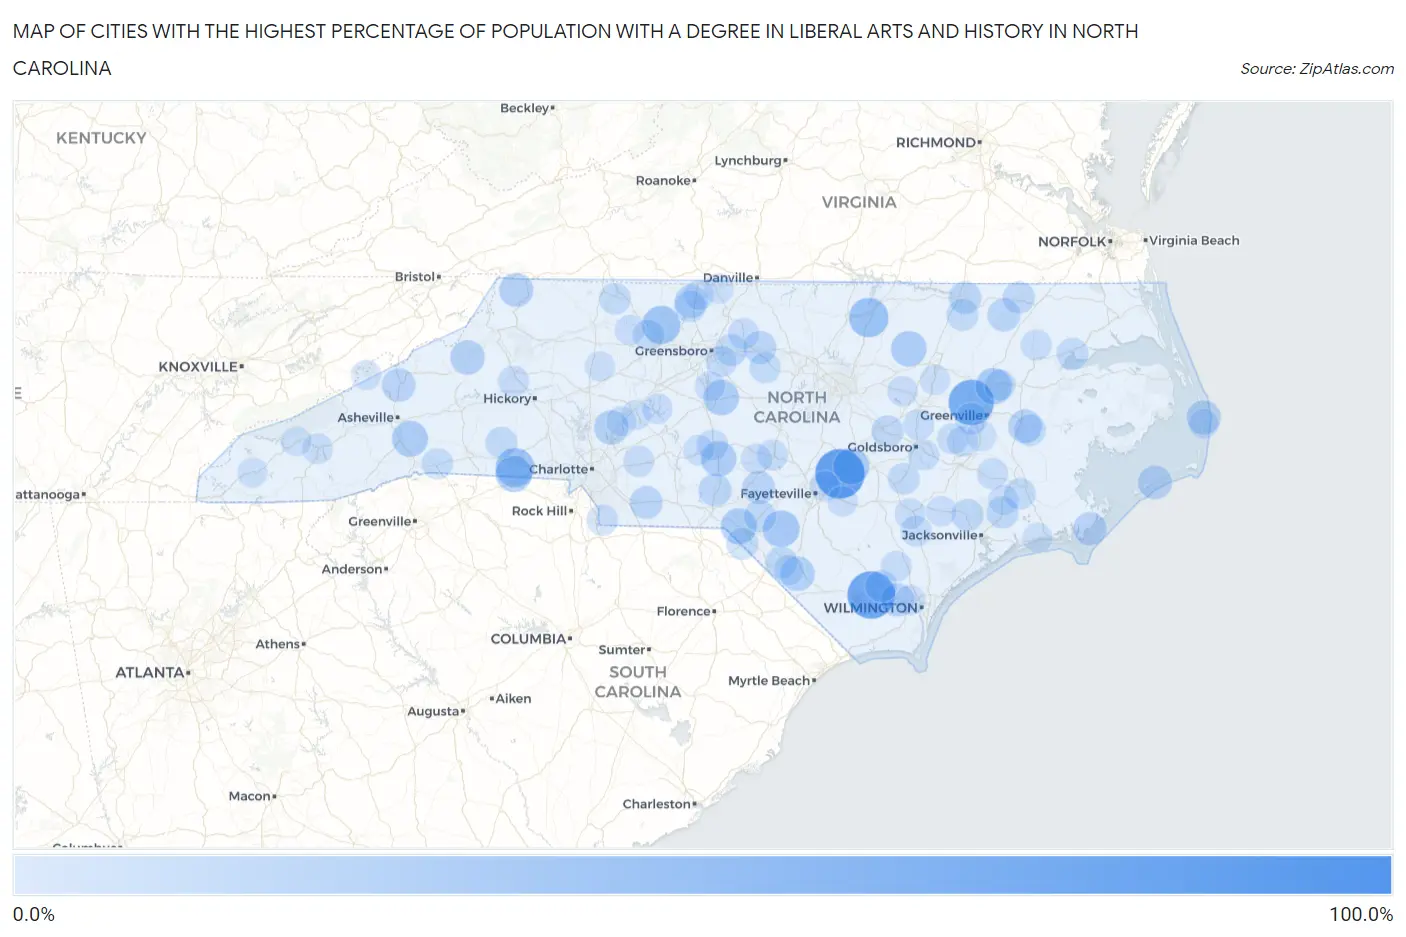
Map of Cities with the Highest Percentage of Population with a Degree in Liberal Arts and History in North Carolina
0.0%
100.0%
Cities with the Highest Percentage of Population with a Degree in Liberal Arts and History in North Carolina
| City | % Graduates | vs State | vs National | |
| 1. | Roberdel | 100.0% | 4.9%(+95.1)#1 | 4.9%(+95.1)#34 |
| 2. | Falcon | 82.5% | 4.9%(+77.6)#2 | 4.9%(+77.6)#102 |
| 3. | Bolton | 75.0% | 4.9%(+70.1)#3 | 4.9%(+70.1)#116 |
| 4. | Falkland | 66.7% | 4.9%(+61.8)#4 | 4.9%(+61.8)#145 |
| 5. | South Henderson | 44.0% | 4.9%(+39.1)#5 | 4.9%(+39.1)#319 |
| 6. | Patterson Springs | 42.3% | 4.9%(+37.4)#6 | 4.9%(+37.4)#352 |
| 7. | Germanton | 39.7% | 4.9%(+34.8)#7 | 4.9%(+34.9)#390 |
| 8. | Red Springs | 34.3% | 4.9%(+29.4)#8 | 4.9%(+29.5)#502 |
| 9. | Earl | 33.3% | 4.9%(+28.4)#9 | 4.9%(+28.5)#526 |
| 10. | Parmele | 33.3% | 4.9%(+28.4)#10 | 4.9%(+28.5)#531 |
| 11. | Plain View | 32.4% | 4.9%(+27.5)#11 | 4.9%(+27.5)#584 |
| 12. | Laurel Hill | 31.9% | 4.9%(+27.0)#12 | 4.9%(+27.0)#596 |
| 13. | Hoopers Creek | 31.5% | 4.9%(+26.6)#13 | 4.9%(+26.6)#610 |
| 14. | Franklinville | 30.4% | 4.9%(+25.5)#14 | 4.9%(+25.6)#641 |
| 15. | Castalia | 30.4% | 4.9%(+25.5)#15 | 4.9%(+25.6)#643 |
| 16. | Candor | 29.8% | 4.9%(+24.9)#16 | 4.9%(+24.9)#667 |
| 17. | Chowan Beach | 27.5% | 4.9%(+22.6)#17 | 4.9%(+22.6)#762 |
| 18. | Proctorville | 26.7% | 4.9%(+21.8)#18 | 4.9%(+21.8)#813 |
| 19. | Crossnore | 26.3% | 4.9%(+21.4)#19 | 4.9%(+21.4)#829 |
| 20. | Enochville | 26.3% | 4.9%(+21.3)#20 | 4.9%(+21.4)#832 |
| 21. | Rodanthe | 25.8% | 4.9%(+20.9)#21 | 4.9%(+21.0)#855 |
| 22. | Lansing | 25.0% | 4.9%(+20.1)#22 | 4.9%(+20.1)#905 |
| 23. | Ocracoke | 24.4% | 4.9%(+19.5)#23 | 4.9%(+19.5)#945 |
| 24. | Washington Park | 23.5% | 4.9%(+18.6)#24 | 4.9%(+18.7)#994 |
| 25. | Mars Hill | 23.1% | 4.9%(+18.2)#25 | 4.9%(+18.2)#1,023 |
| 26. | Davis | 22.5% | 4.9%(+17.6)#26 | 4.9%(+17.7)#1,063 |
| 27. | Sandy Creek | 22.2% | 4.9%(+17.3)#27 | 4.9%(+17.4)#1,081 |
| 28. | Ashley Heights | 21.1% | 4.9%(+16.2)#28 | 4.9%(+16.2)#1,186 |
| 29. | Mayodan | 21.0% | 4.9%(+16.1)#29 | 4.9%(+16.1)#1,192 |
| 30. | Haw River | 20.9% | 4.9%(+16.0)#30 | 4.9%(+16.0)#1,194 |
| 31. | Woodland | 20.9% | 4.9%(+16.0)#31 | 4.9%(+16.0)#1,197 |
| 32. | Ellerbe | 20.7% | 4.9%(+15.8)#32 | 4.9%(+15.8)#1,213 |
| 33. | Marshville | 20.7% | 4.9%(+15.8)#33 | 4.9%(+15.8)#1,214 |
| 34. | Garysburg | 19.8% | 4.9%(+14.9)#34 | 4.9%(+14.9)#1,319 |
| 35. | Wagram | 18.9% | 4.9%(+14.0)#35 | 4.9%(+14.0)#1,411 |
| 36. | Murfreesboro | 18.7% | 4.9%(+13.8)#36 | 4.9%(+13.8)#1,430 |
| 37. | Maysville | 17.9% | 4.9%(+13.0)#37 | 4.9%(+13.1)#1,520 |
| 38. | Richlands | 17.9% | 4.9%(+13.0)#38 | 4.9%(+13.1)#1,523 |
| 39. | Sedalia | 17.6% | 4.9%(+12.7)#39 | 4.9%(+12.8)#1,555 |
| 40. | Mcdonald | 17.6% | 4.9%(+12.7)#40 | 4.9%(+12.8)#1,564 |
| 41. | Sandyfield | 17.5% | 4.9%(+12.6)#41 | 4.9%(+12.7)#1,569 |
| 42. | Pine Level | 17.5% | 4.9%(+12.6)#42 | 4.9%(+12.7)#1,571 |
| 43. | Nebo | 17.3% | 4.9%(+12.4)#43 | 4.9%(+12.4)#1,614 |
| 44. | Calypso | 17.2% | 4.9%(+12.3)#44 | 4.9%(+12.4)#1,621 |
| 45. | Edenton | 17.2% | 4.9%(+12.3)#45 | 4.9%(+12.3)#1,628 |
| 46. | Madison | 17.1% | 4.9%(+12.2)#46 | 4.9%(+12.2)#1,647 |
| 47. | Bell Arthur | 17.1% | 4.9%(+12.2)#47 | 4.9%(+12.2)#1,649 |
| 48. | Halifax | 16.9% | 4.9%(+12.0)#48 | 4.9%(+12.1)#1,664 |
| 49. | River Road | 16.8% | 4.9%(+11.9)#49 | 4.9%(+12.0)#1,680 |
| 50. | Scotch Meadows | 16.8% | 4.9%(+11.9)#50 | 4.9%(+11.9)#1,689 |
| 51. | White Plains | 16.5% | 4.9%(+11.6)#51 | 4.9%(+11.6)#1,774 |
| 52. | Polkville | 16.3% | 4.9%(+11.4)#52 | 4.9%(+11.4)#1,802 |
| 53. | Brices Creek | 15.4% | 4.9%(+10.5)#53 | 4.9%(+10.6)#1,957 |
| 54. | Saxapahaw | 15.2% | 4.9%(+10.3)#54 | 4.9%(+10.3)#2,018 |
| 55. | Bethania | 14.9% | 4.9%(+10.0)#55 | 4.9%(+10.1)#2,061 |
| 56. | Columbus | 14.8% | 4.9%(+9.90)#56 | 4.9%(+9.93)#2,085 |
| 57. | Forest Oaks | 14.7% | 4.9%(+9.82)#57 | 4.9%(+9.85)#2,098 |
| 58. | Robersonville | 14.7% | 4.9%(+9.77)#58 | 4.9%(+9.79)#2,113 |
| 59. | Jaars | 14.5% | 4.9%(+9.59)#59 | 4.9%(+9.62)#2,151 |
| 60. | Cove City | 14.4% | 4.9%(+9.52)#60 | 4.9%(+9.55)#2,170 |
| 61. | Star | 14.4% | 4.9%(+9.49)#61 | 4.9%(+9.52)#2,175 |
| 62. | Elroy | 14.3% | 4.9%(+9.43)#62 | 4.9%(+9.46)#2,184 |
| 63. | Cajah S Mountain | 14.3% | 4.9%(+9.39)#63 | 4.9%(+9.41)#2,189 |
| 64. | Askewville | 14.3% | 4.9%(+9.39)#64 | 4.9%(+9.41)#2,235 |
| 65. | Locust | 14.2% | 4.9%(+9.34)#65 | 4.9%(+9.37)#2,259 |
| 66. | Grandy | 14.1% | 4.9%(+9.23)#66 | 4.9%(+9.26)#2,274 |
| 67. | Cameron | 14.1% | 4.9%(+9.20)#67 | 4.9%(+9.23)#2,281 |
| 68. | Altamahaw | 14.1% | 4.9%(+9.16)#68 | 4.9%(+9.19)#2,289 |
| 69. | Snow Hill | 13.8% | 4.9%(+8.94)#69 | 4.9%(+8.97)#2,349 |
| 70. | Teachey | 13.8% | 4.9%(+8.89)#70 | 4.9%(+8.92)#2,361 |
| 71. | Magnolia | 13.6% | 4.9%(+8.74)#71 | 4.9%(+8.76)#2,402 |
| 72. | Hookerton | 13.6% | 4.9%(+8.74)#72 | 4.9%(+8.76)#2,405 |
| 73. | Atkinson | 13.6% | 4.9%(+8.74)#73 | 4.9%(+8.76)#2,411 |
| 74. | Fremont | 13.2% | 4.9%(+8.31)#74 | 4.9%(+8.34)#2,549 |
| 75. | Dillsboro | 13.0% | 4.9%(+8.10)#75 | 4.9%(+8.13)#2,611 |
| 76. | Bailey | 13.0% | 4.9%(+8.06)#76 | 4.9%(+8.09)#2,626 |
| 77. | Troy | 12.7% | 4.9%(+7.80)#77 | 4.9%(+7.83)#2,701 |
| 78. | Eastover | 12.5% | 4.9%(+7.63)#78 | 4.9%(+7.66)#2,741 |
| 79. | Carthage | 12.4% | 4.9%(+7.54)#79 | 4.9%(+7.57)#2,811 |
| 80. | Beulaville | 12.4% | 4.9%(+7.50)#80 | 4.9%(+7.53)#2,819 |
| 81. | Pollocksville | 12.2% | 4.9%(+7.34)#81 | 4.9%(+7.37)#2,874 |
| 82. | Cherry Branch | 12.1% | 4.9%(+7.21)#82 | 4.9%(+7.24)#2,923 |
| 83. | Autryville | 12.0% | 4.9%(+7.10)#83 | 4.9%(+7.13)#2,983 |
| 84. | Stoneville | 11.8% | 4.9%(+6.86)#84 | 4.9%(+6.89)#3,065 |
| 85. | Southmont | 11.7% | 4.9%(+6.84)#85 | 4.9%(+6.87)#3,093 |
| 86. | East Bend | 11.6% | 4.9%(+6.73)#86 | 4.9%(+6.76)#3,141 |
| 87. | Navassa | 11.6% | 4.9%(+6.66)#87 | 4.9%(+6.68)#3,163 |
| 88. | Randleman | 11.5% | 4.9%(+6.64)#88 | 4.9%(+6.67)#3,165 |
| 89. | Bryson City | 11.4% | 4.9%(+6.54)#89 | 4.9%(+6.57)#3,206 |
| 90. | Harmony | 11.3% | 4.9%(+6.42)#90 | 4.9%(+6.45)#3,260 |
| 91. | Ayden | 11.2% | 4.9%(+6.34)#91 | 4.9%(+6.36)#3,293 |
| 92. | Andrews | 11.1% | 4.9%(+6.21)#92 | 4.9%(+6.24)#3,336 |
| 93. | Sharpsburg | 11.0% | 4.9%(+6.13)#93 | 4.9%(+6.16)#3,413 |
| 94. | Granite Quarry | 11.0% | 4.9%(+6.09)#94 | 4.9%(+6.12)#3,432 |
| 95. | Eden | 11.0% | 4.9%(+6.07)#95 | 4.9%(+6.10)#3,441 |
| 96. | Fairmont | 10.9% | 4.9%(+6.02)#96 | 4.9%(+6.05)#3,471 |
| 97. | Hot Springs | 10.9% | 4.9%(+6.01)#97 | 4.9%(+6.04)#3,477 |
| 98. | Salvo | 10.8% | 4.9%(+5.94)#98 | 4.9%(+5.97)#3,514 |
| 99. | Broad Creek | 10.8% | 4.9%(+5.93)#99 | 4.9%(+5.96)#3,520 |
| 100. | China Grove | 10.8% | 4.9%(+5.88)#100 | 4.9%(+5.91)#3,549 |
Common Questions
What are the Top 10 Cities with the Highest Percentage of Population with a Degree in Liberal Arts and History in North Carolina?
Top 10 Cities with the Highest Percentage of Population with a Degree in Liberal Arts and History in North Carolina are:
#1
82.5%
#2
75.0%
#3
66.7%
#4
44.0%
#5
42.3%
#6
39.7%
#7
34.3%
#8
33.3%
#9
33.3%
#10
32.4%
What city has the Highest Percentage of Population with a Degree in Liberal Arts and History in North Carolina?
Falcon has the Highest Percentage of Population with a Degree in Liberal Arts and History in North Carolina with 82.5%.
What is the Percentage of Population with a Degree in Liberal Arts and History in the State of North Carolina?
Percentage of Population with a Degree in Liberal Arts and History in North Carolina is 4.9%.
What is the Percentage of Population with a Degree in Liberal Arts and History in the United States?
Percentage of Population with a Degree in Liberal Arts and History in the United States is 4.9%.