Willows, CA Map & Demographics
Willows Map
Willows Overview
$26,702
PER CAPITA INCOME
$65,341
AVG FAMILY INCOME
$61,806
AVG HOUSEHOLD INCOME
19.2%
WAGE / INCOME GAP [ % ]
80.8¢/ $1
WAGE / INCOME GAP [ $ ]
0.42
INEQUALITY / GINI INDEX
6,201
TOTAL POPULATION
3,420
MALE POPULATION
2,781
FEMALE POPULATION
122.98
MALES / 100 FEMALES
81.32
FEMALES / 100 MALES
32.6
MEDIAN AGE
3.9
AVG FAMILY SIZE
3.0
AVG HOUSEHOLD SIZE
2,830
LABOR FORCE [ PEOPLE ]
61.6%
PERCENT IN LABOR FORCE
9.2%
UNEMPLOYMENT RATE
Willows Zip Codes
Willows Area Codes
Income in Willows
Income Overview in Willows
Per Capita Income in Willows is $26,702, while median incomes of families and households are $65,341 and $61,806 respectively.
| Characteristic | Number | Measure |
| Per Capita Income | 6,201 | $26,702 |
| Median Family Income | 1,212 | $65,341 |
| Mean Family Income | 1,212 | $79,142 |
| Median Household Income | 2,037 | $61,806 |
| Mean Household Income | 2,037 | $76,580 |
| Income Deficit | 1,212 | $0 |
| Wage / Income Gap (%) | 6,201 | 19.23% |
| Wage / Income Gap ($) | 6,201 | 80.77¢ per $1 |
| Gini / Inequality Index | 6,201 | 0.42 |
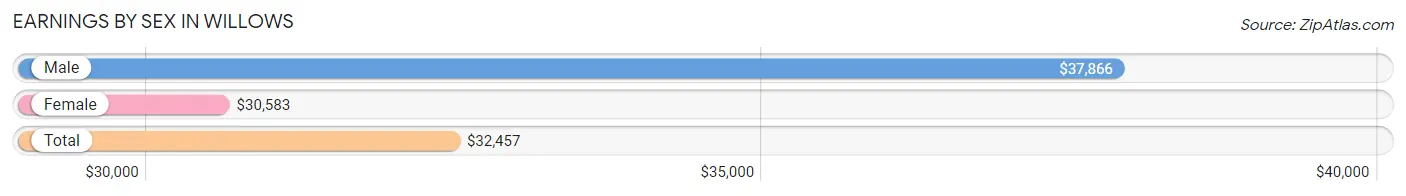
Earnings by Sex in Willows
Average Earnings in Willows are $32,457, $37,866 for men and $30,583 for women, a difference of 19.2%.
| Sex | Number | Average Earnings |
| Male | 1,860 (64.0%) | $37,866 |
| Female | 1,047 (36.0%) | $30,583 |
| Total | 2,907 (100.0%) | $32,457 |
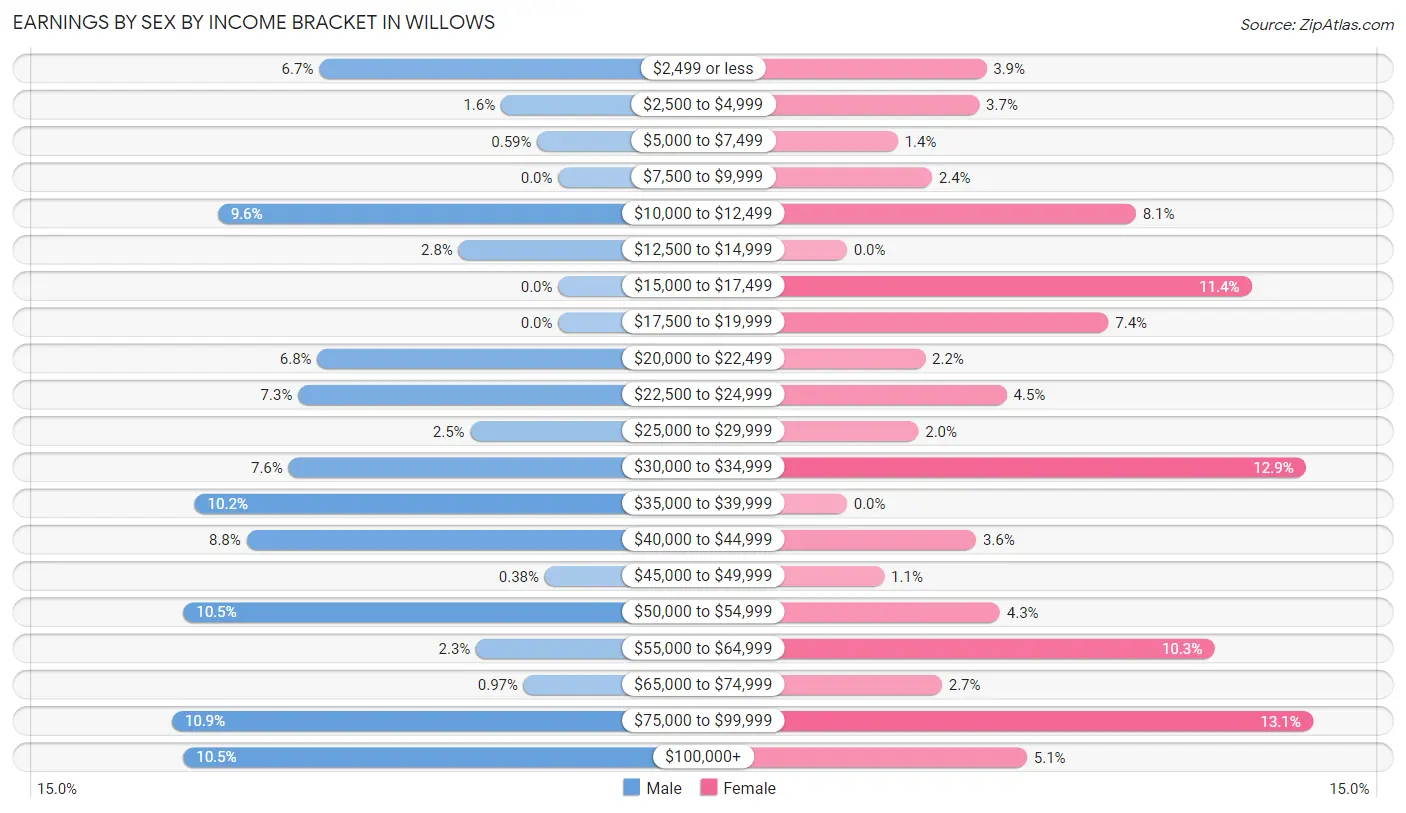
Earnings by Sex by Income Bracket in Willows
The most common earnings brackets in Willows are $75,000 to $99,999 for men (202 | 10.9%) and $75,000 to $99,999 for women (137 | 13.1%).
| Income | Male | Female |
| $2,499 or less | 125 (6.7%) | 41 (3.9%) |
| $2,500 to $4,999 | 30 (1.6%) | 39 (3.7%) |
| $5,000 to $7,499 | 11 (0.6%) | 15 (1.4%) |
| $7,500 to $9,999 | 0 (0.0%) | 25 (2.4%) |
| $10,000 to $12,499 | 178 (9.6%) | 85 (8.1%) |
| $12,500 to $14,999 | 52 (2.8%) | 0 (0.0%) |
| $15,000 to $17,499 | 0 (0.0%) | 119 (11.4%) |
| $17,500 to $19,999 | 0 (0.0%) | 77 (7.3%) |
| $20,000 to $22,499 | 126 (6.8%) | 23 (2.2%) |
| $22,500 to $24,999 | 136 (7.3%) | 47 (4.5%) |
| $25,000 to $29,999 | 46 (2.5%) | 21 (2.0%) |
| $30,000 to $34,999 | 141 (7.6%) | 135 (12.9%) |
| $35,000 to $39,999 | 190 (10.2%) | 0 (0.0%) |
| $40,000 to $44,999 | 163 (8.8%) | 38 (3.6%) |
| $45,000 to $49,999 | 7 (0.4%) | 11 (1.1%) |
| $50,000 to $54,999 | 196 (10.5%) | 45 (4.3%) |
| $55,000 to $64,999 | 43 (2.3%) | 108 (10.3%) |
| $65,000 to $74,999 | 18 (1.0%) | 28 (2.7%) |
| $75,000 to $99,999 | 202 (10.9%) | 137 (13.1%) |
| $100,000+ | 196 (10.5%) | 53 (5.1%) |
| Total | 1,860 (100.0%) | 1,047 (100.0%) |
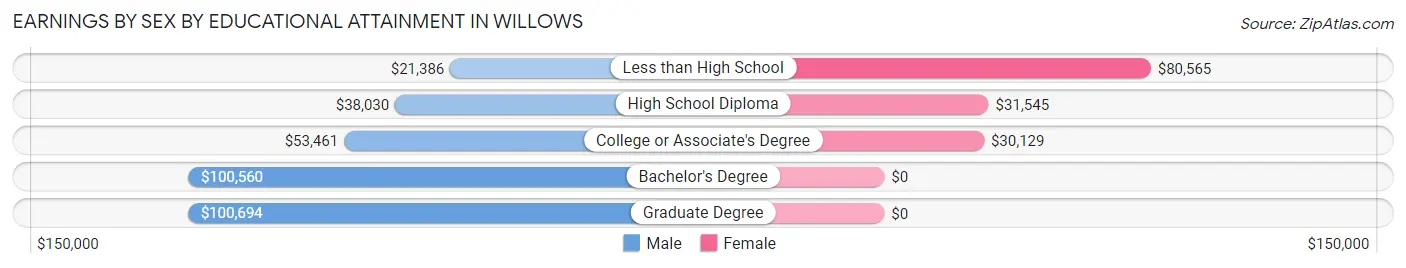
Earnings by Sex by Educational Attainment in Willows
Average earnings in Willows are $40,646 for men and $31,685 for women, a difference of 22.1%. Men with an educational attainment of graduate degree enjoy the highest average annual earnings of $100,694, while those with less than high school education earn the least with $21,386. Women with an educational attainment of less than high school earn the most with the average annual earnings of $80,565, while those with college or associate's degree education have the smallest earnings of $30,129.
| Educational Attainment | Male Income | Female Income |
| Less than High School | $21,386 | $80,565 |
| High School Diploma | $38,030 | $31,545 |
| College or Associate's Degree | $53,461 | $30,129 |
| Bachelor's Degree | $100,560 | $0 |
| Graduate Degree | $100,694 | $0 |
| Total | $40,646 | $31,685 |
Family Income in Willows
Family Income Brackets in Willows
According to the Willows family income data, there are 351 families falling into the $100,000 to $149,999 income range, which is the most common income bracket and makes up 29.0% of all families. Conversely, the $150,000 to $199,999 income bracket is the least frequent group with only 47 families (3.9%) belonging to this category.
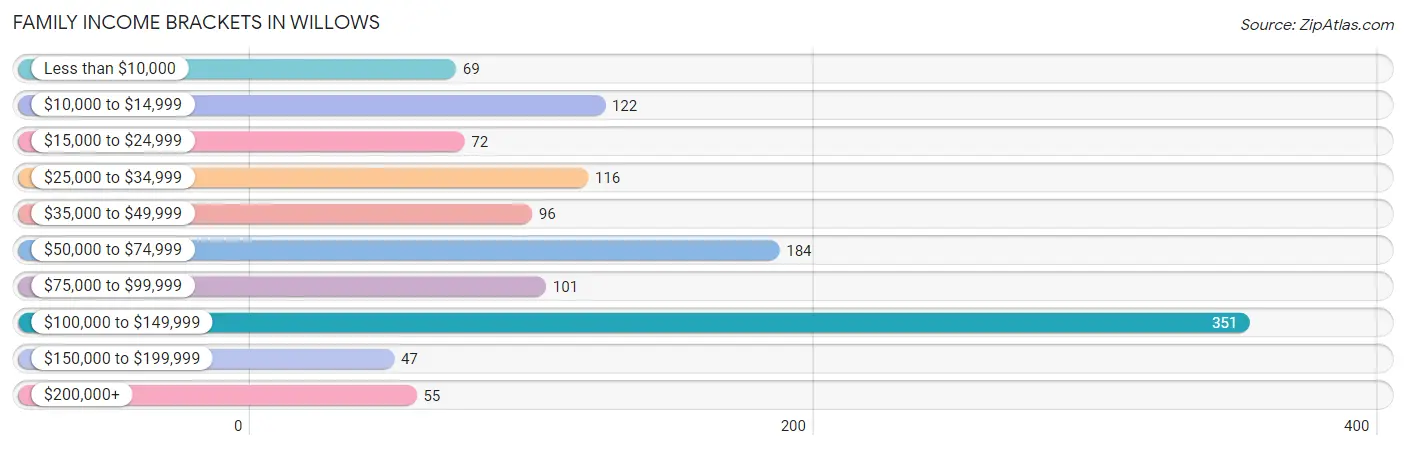
| Income Bracket | # Families | % Families |
| Less than $10,000 | 69 | 5.7% |
| $10,000 to $14,999 | 122 | 10.1% |
| $15,000 to $24,999 | 72 | 5.9% |
| $25,000 to $34,999 | 116 | 9.6% |
| $35,000 to $49,999 | 96 | 7.9% |
| $50,000 to $74,999 | 184 | 15.2% |
| $75,000 to $99,999 | 101 | 8.3% |
| $100,000 to $149,999 | 351 | 29.0% |
| $150,000 to $199,999 | 47 | 3.9% |
| $200,000+ | 55 | 4.5% |
Family Income by Famaliy Size in Willows
4-person families (270 | 22.3%) account for the highest median family income in Willows with $117,353 per family, while 2-person families (494 | 40.8%) have the highest median income of $31,300 per family member.
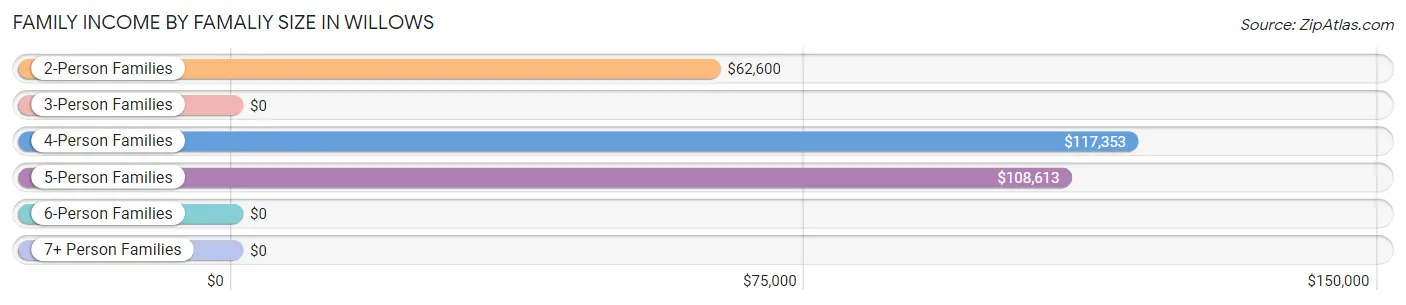
| Income Bracket | # Families | Median Income |
| 2-Person Families | 494 (40.8%) | $62,600 |
| 3-Person Families | 185 (15.3%) | $0 |
| 4-Person Families | 270 (22.3%) | $117,353 |
| 5-Person Families | 117 (9.7%) | $108,613 |
| 6-Person Families | 23 (1.9%) | $0 |
| 7+ Person Families | 123 (10.2%) | $0 |
| Total | 1,212 (100.0%) | $65,341 |
Family Income by Number of Earners in Willows
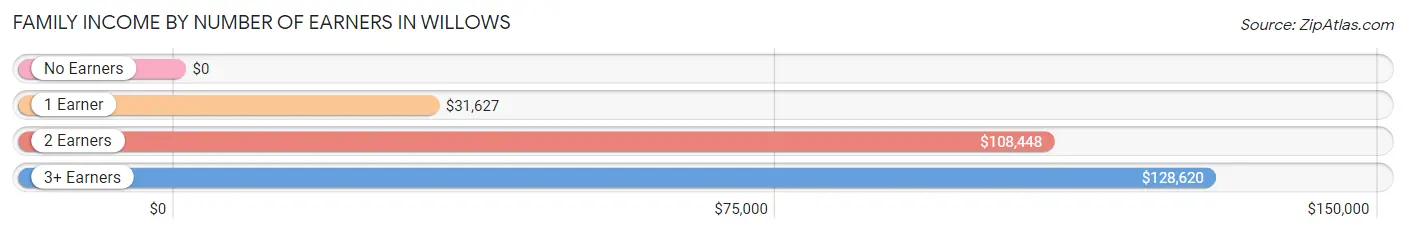
| Number of Earners | # Families | Median Income |
| No Earners | 228 (18.8%) | $0 |
| 1 Earner | 460 (38.0%) | $31,627 |
| 2 Earners | 351 (29.0%) | $108,448 |
| 3+ Earners | 173 (14.3%) | $128,620 |
| Total | 1,212 (100.0%) | $65,341 |
Household Income in Willows
Household Income Brackets in Willows
With 385 households falling in the category, the $100,000 to $149,999 income range is the most frequent in Willows, accounting for 18.9% of all households. In contrast, only 49 households (2.4%) fall into the less than $10,000 income bracket, making it the least populous group.
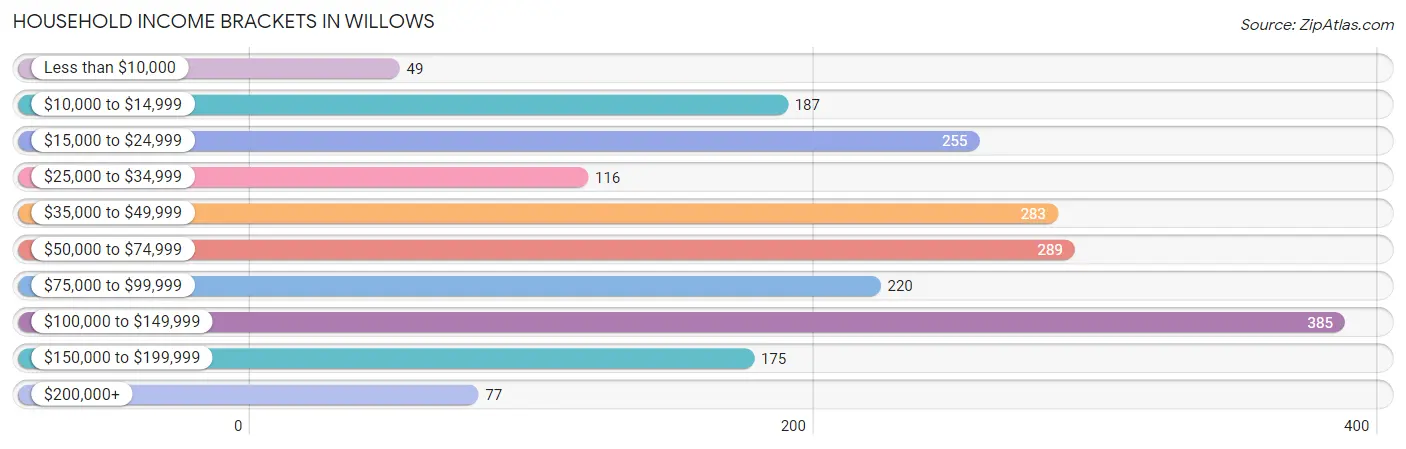
| Income Bracket | # Households | % Households |
| Less than $10,000 | 49 | 2.4% |
| $10,000 to $14,999 | 187 | 9.2% |
| $15,000 to $24,999 | 255 | 12.5% |
| $25,000 to $34,999 | 116 | 5.7% |
| $35,000 to $49,999 | 283 | 13.9% |
| $50,000 to $74,999 | 289 | 14.2% |
| $75,000 to $99,999 | 220 | 10.8% |
| $100,000 to $149,999 | 385 | 18.9% |
| $150,000 to $199,999 | 175 | 8.6% |
| $200,000+ | 77 | 3.8% |
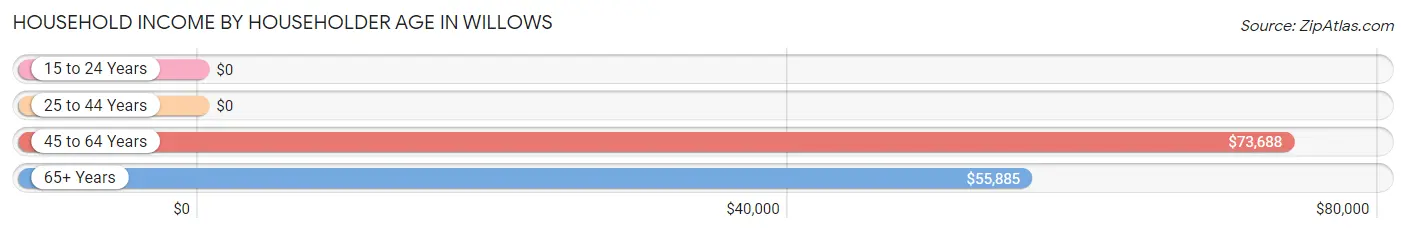
Household Income by Householder Age in Willows
The median household income in Willows is $61,806, with the highest median household income of $73,688 found in the 45 to 64 years age bracket for the primary householder. A total of 565 households (27.7%) fall into this category. Meanwhile, the 15 to 24 years age bracket for the primary householder has the lowest median household income of $0, with 45 households (2.2%) in this group.
| Income Bracket | # Households | Median Income |
| 15 to 24 Years | 45 (2.2%) | $0 |
| 25 to 44 Years | 950 (46.6%) | $0 |
| 45 to 64 Years | 565 (27.7%) | $73,688 |
| 65+ Years | 477 (23.4%) | $55,885 |
| Total | 2,037 (100.0%) | $61,806 |
Poverty in Willows
Income Below Poverty by Sex and Age in Willows
With 20.7% poverty level for males and 30.9% for females among the residents of Willows, under 5 year old males and 5 year old females are the most vulnerable to poverty, with 413 males (93.2%) and 64 females (100.0%) in their respective age groups living below the poverty level.
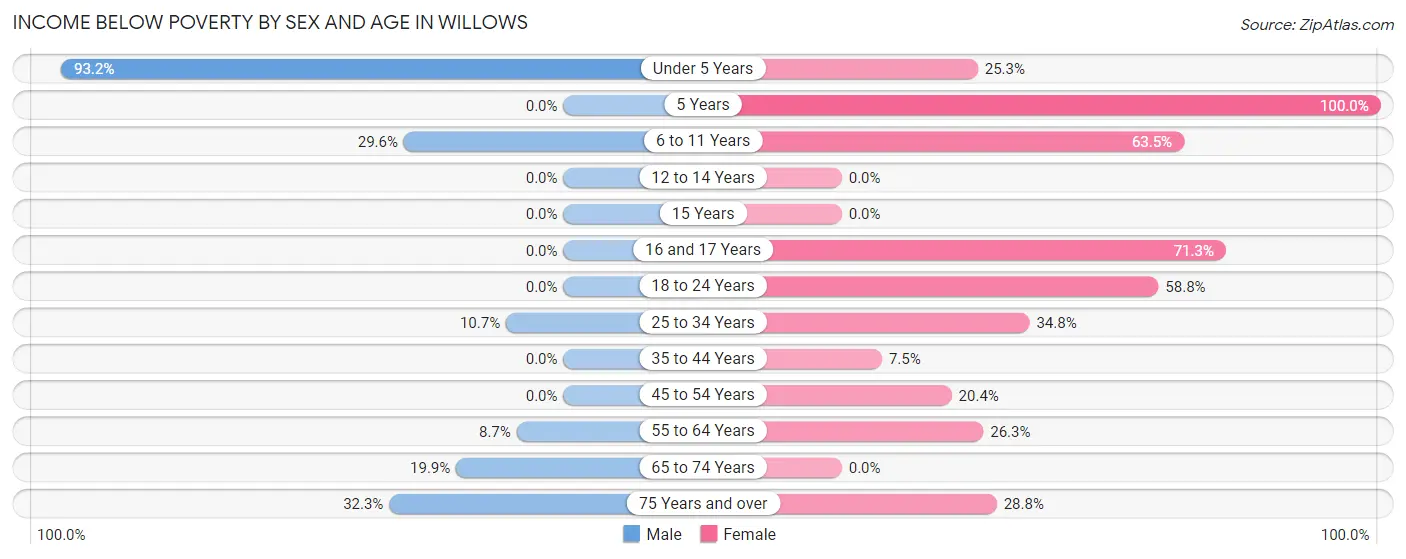
| Age Bracket | Male | Female |
| Under 5 Years | 413 (93.2%) | 25 (25.3%) |
| 5 Years | 0 (0.0%) | 64 (100.0%) |
| 6 to 11 Years | 101 (29.6%) | 127 (63.5%) |
| 12 to 14 Years | 0 (0.0%) | 0 (0.0%) |
| 15 Years | 0 (0.0%) | 0 (0.0%) |
| 16 and 17 Years | 0 (0.0%) | 119 (71.3%) |
| 18 to 24 Years | 0 (0.0%) | 134 (58.8%) |
| 25 to 34 Years | 70 (10.6%) | 139 (34.8%) |
| 35 to 44 Years | 0 (0.0%) | 24 (7.4%) |
| 45 to 54 Years | 0 (0.0%) | 73 (20.4%) |
| 55 to 64 Years | 26 (8.7%) | 67 (26.3%) |
| 65 to 74 Years | 38 (19.9%) | 0 (0.0%) |
| 75 Years and over | 43 (32.3%) | 67 (28.8%) |
| Total | 691 (20.7%) | 839 (30.9%) |
Income Above Poverty by Sex and Age in Willows
According to the poverty statistics in Willows, males aged 5 years and females aged 12 to 14 years are the age groups that are most secure financially, with 100.0% of males and 100.0% of females in these age groups living above the poverty line.
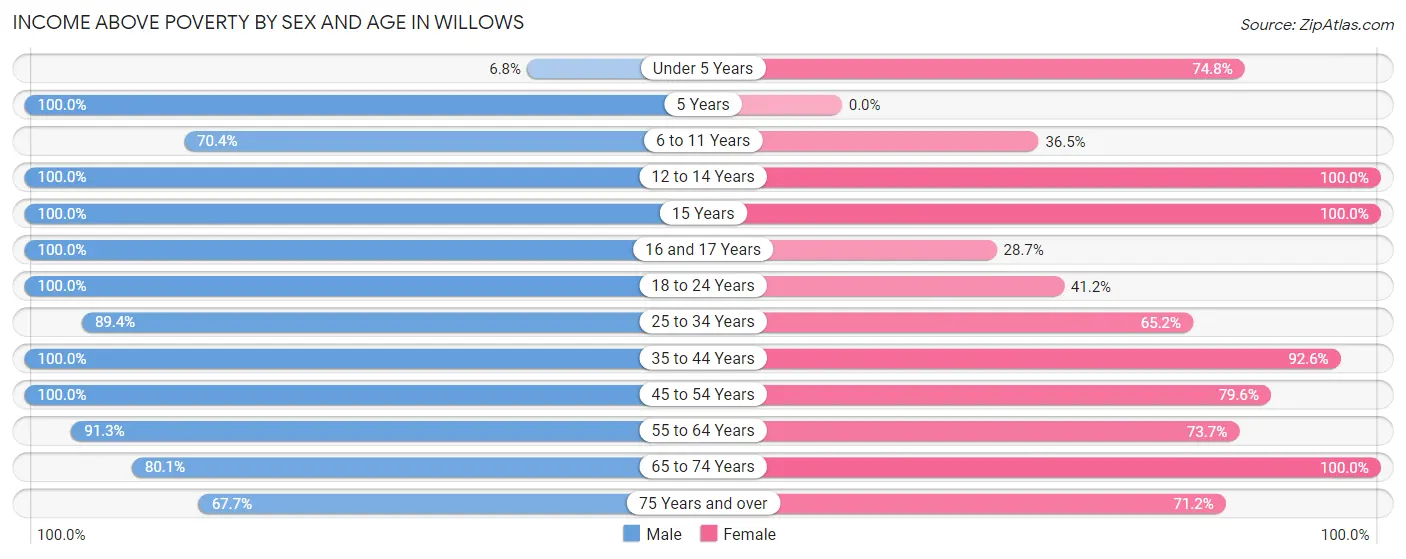
| Age Bracket | Male | Female |
| Under 5 Years | 30 (6.8%) | 74 (74.8%) |
| 5 Years | 27 (100.0%) | 0 (0.0%) |
| 6 to 11 Years | 240 (70.4%) | 73 (36.5%) |
| 12 to 14 Years | 195 (100.0%) | 119 (100.0%) |
| 15 Years | 80 (100.0%) | 39 (100.0%) |
| 16 and 17 Years | 107 (100.0%) | 48 (28.7%) |
| 18 to 24 Years | 243 (100.0%) | 94 (41.2%) |
| 25 to 34 Years | 587 (89.3%) | 260 (65.2%) |
| 35 to 44 Years | 426 (100.0%) | 298 (92.5%) |
| 45 to 54 Years | 201 (100.0%) | 285 (79.6%) |
| 55 to 64 Years | 274 (91.3%) | 188 (73.7%) |
| 65 to 74 Years | 153 (80.1%) | 232 (100.0%) |
| 75 Years and over | 90 (67.7%) | 166 (71.2%) |
| Total | 2,653 (79.3%) | 1,876 (69.1%) |
Income Below Poverty Among Married-Couple Families in Willows
The poverty statistics for married-couple families in Willows show that 21.5% or 163 of the total 758 families live below the poverty line. Families with 5 or more children have the highest poverty rate of 80.5%, comprising of 99 families. On the other hand, families with 3 or 4 children have the lowest poverty rate of 0.0%, which includes 0 families.
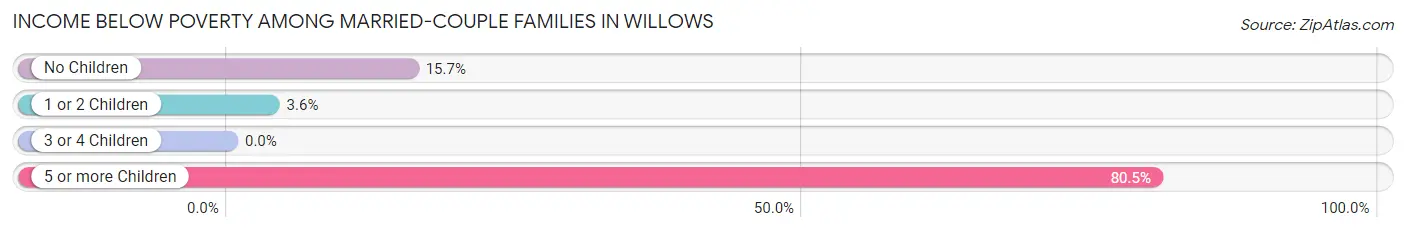
| Children | Above Poverty | Below Poverty |
| No Children | 316 (84.3%) | 59 (15.7%) |
| 1 or 2 Children | 133 (96.4%) | 5 (3.6%) |
| 3 or 4 Children | 122 (100.0%) | 0 (0.0%) |
| 5 or more Children | 24 (19.5%) | 99 (80.5%) |
| Total | 595 (78.5%) | 163 (21.5%) |
Income Below Poverty Among Single-Parent Households in Willows
According to the poverty data in Willows, 49.4% or 43 single-father households and 13.4% or 49 single-mother households are living below the poverty line. Among single-father households, those with 1 or 2 children have the highest poverty rate, with 43 households (58.9%) experiencing poverty. Likewise, among single-mother households, those with 1 or 2 children have the highest poverty rate, with 49 households (19.8%) falling below the poverty line.
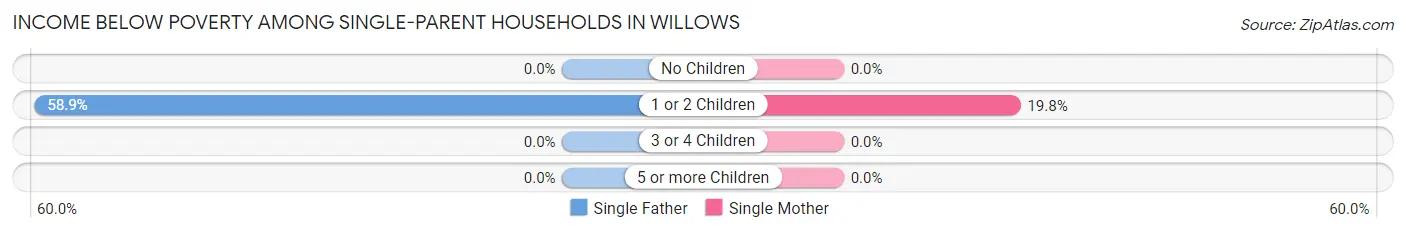
| Children | Single Father | Single Mother |
| No Children | 0 (0.0%) | 0 (0.0%) |
| 1 or 2 Children | 43 (58.9%) | 49 (19.8%) |
| 3 or 4 Children | 0 (0.0%) | 0 (0.0%) |
| 5 or more Children | 0 (0.0%) | 0 (0.0%) |
| Total | 43 (49.4%) | 49 (13.4%) |
Income Below Poverty Among Married-Couple vs Single-Parent Households in Willows
The poverty data for Willows shows that 163 of the married-couple family households (21.5%) and 92 of the single-parent households (20.3%) are living below the poverty level. Within the married-couple family households, those with 5 or more children have the highest poverty rate, with 99 households (80.5%) falling below the poverty line. Among the single-parent households, those with 1 or 2 children have the highest poverty rate, with 92 household (28.7%) living below poverty.
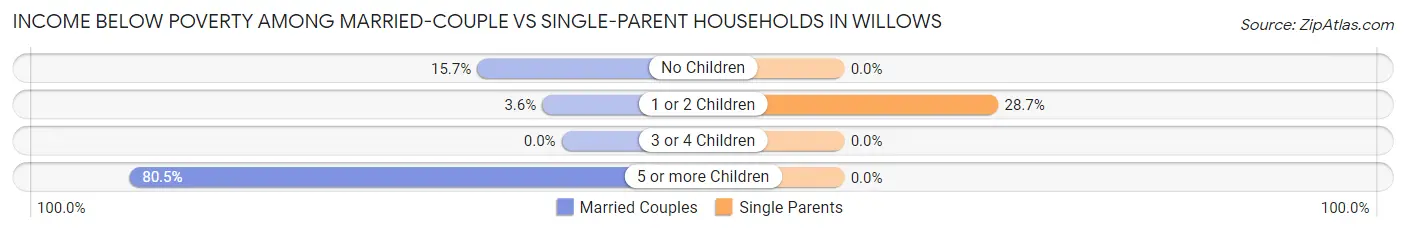
| Children | Married-Couple Families | Single-Parent Households |
| No Children | 59 (15.7%) | 0 (0.0%) |
| 1 or 2 Children | 5 (3.6%) | 92 (28.7%) |
| 3 or 4 Children | 0 (0.0%) | 0 (0.0%) |
| 5 or more Children | 99 (80.5%) | 0 (0.0%) |
| Total | 163 (21.5%) | 92 (20.3%) |
Race in Willows
The most populous races in Willows are White / Caucasian (4,031 | 65.0%), Hispanic or Latino (2,049 | 33.0%), and Two or more Races (951 | 15.3%).
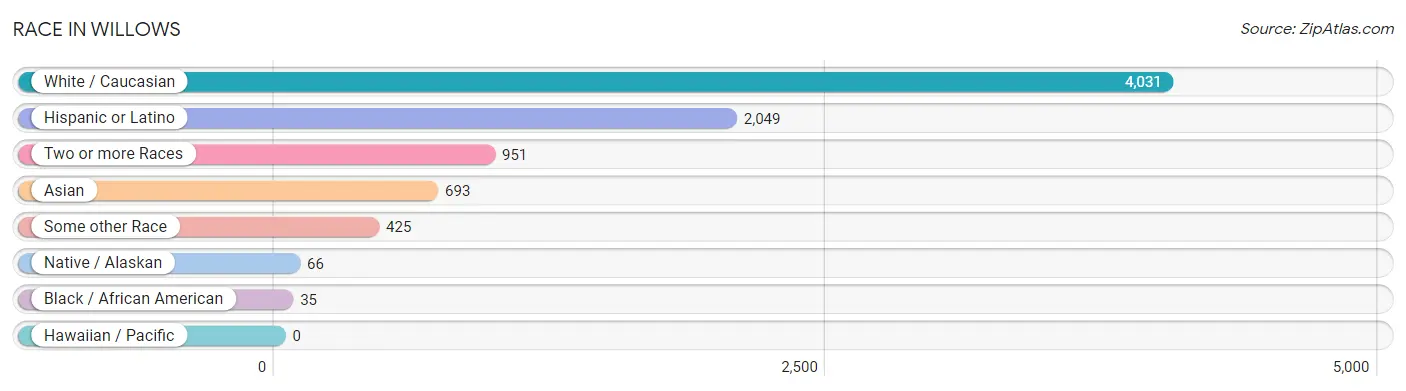
| Race | # Population | % Population |
| Asian | 693 | 11.2% |
| Black / African American | 35 | 0.6% |
| Hawaiian / Pacific | 0 | 0.0% |
| Hispanic or Latino | 2,049 | 33.0% |
| Native / Alaskan | 66 | 1.1% |
| White / Caucasian | 4,031 | 65.0% |
| Two or more Races | 951 | 15.3% |
| Some other Race | 425 | 6.9% |
| Total | 6,201 | 100.0% |
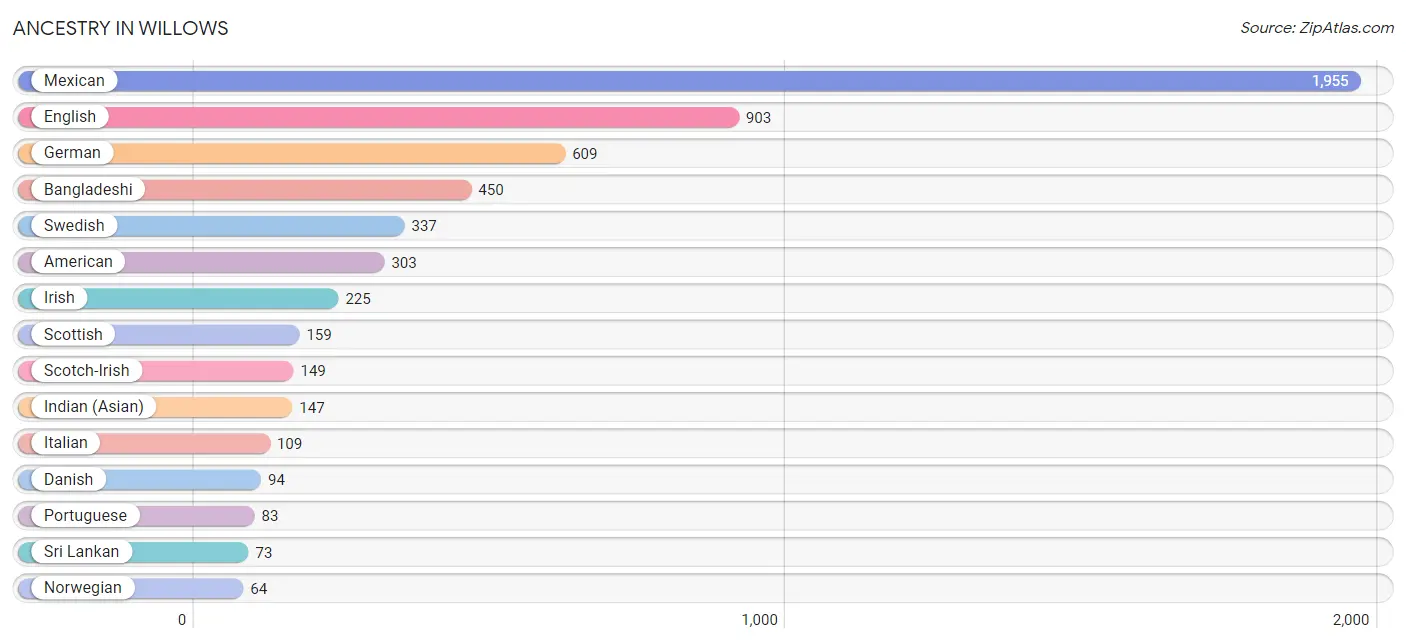
Ancestry in Willows
The most populous ancestries reported in Willows are Mexican (1,955 | 31.5%), English (903 | 14.6%), German (609 | 9.8%), Bangladeshi (450 | 7.3%), and Swedish (337 | 5.4%), together accounting for 68.6% of all Willows residents.
| Ancestry | # Population | % Population |
| American | 303 | 4.9% |
| Bangladeshi | 450 | 7.3% |
| Bhutanese | 40 | 0.6% |
| British | 10 | 0.2% |
| Central American | 9 | 0.2% |
| Cherokee | 19 | 0.3% |
| Chippewa | 8 | 0.1% |
| Choctaw | 10 | 0.2% |
| Creek | 8 | 0.1% |
| Croatian | 13 | 0.2% |
| Cuban | 25 | 0.4% |
| Danish | 94 | 1.5% |
| Dutch | 20 | 0.3% |
| English | 903 | 14.6% |
| European | 17 | 0.3% |
| Finnish | 11 | 0.2% |
| French | 12 | 0.2% |
| German | 609 | 9.8% |
| Guatemalan | 9 | 0.2% |
| Indian (Asian) | 147 | 2.4% |
| Irish | 225 | 3.6% |
| Italian | 109 | 1.8% |
| Korean | 1 | 0.0% |
| Mexican | 1,955 | 31.5% |
| Northern European | 7 | 0.1% |
| Norwegian | 64 | 1.0% |
| Polish | 27 | 0.4% |
| Portuguese | 83 | 1.3% |
| Puerto Rican | 23 | 0.4% |
| Scotch-Irish | 149 | 2.4% |
| Scottish | 159 | 2.6% |
| Sioux | 51 | 0.8% |
| Spaniard | 30 | 0.5% |
| Sri Lankan | 73 | 1.2% |
| Swedish | 337 | 5.4% |
| Ukrainian | 1 | 0.0% |
| Welsh | 10 | 0.2% | View All 37 Rows |
Immigrants in Willows
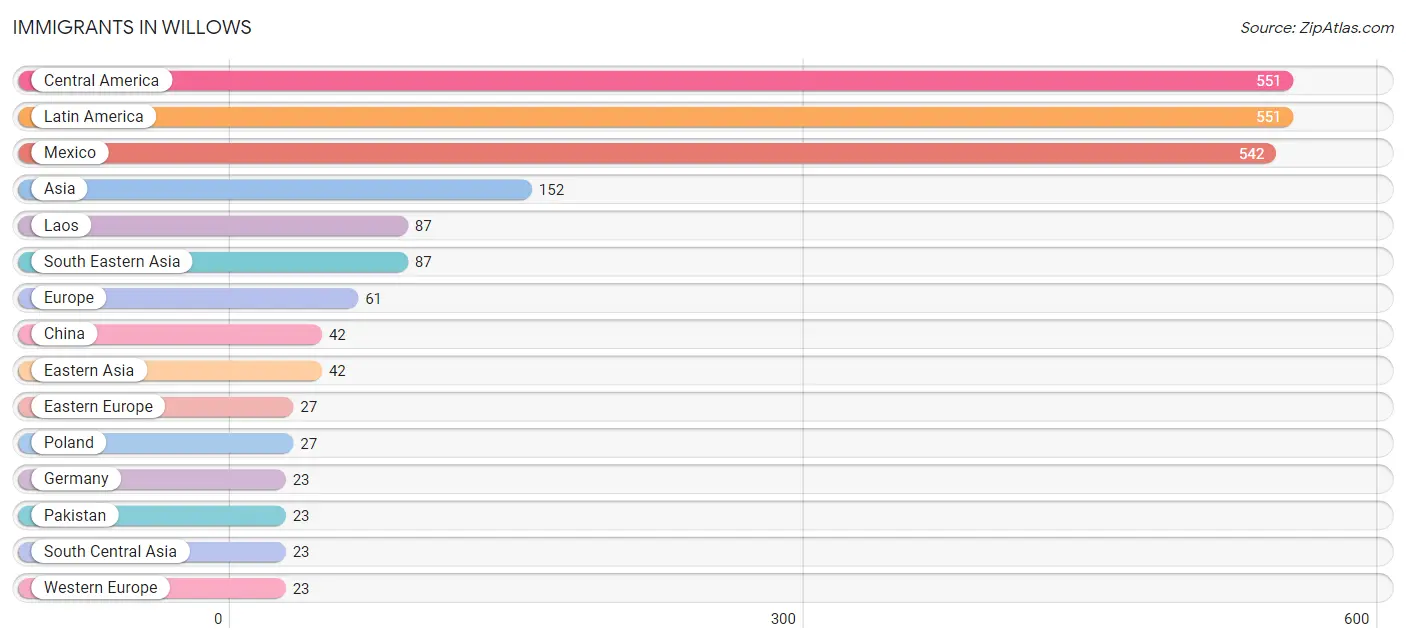
The most numerous immigrant groups reported in Willows came from Central America (551 | 8.9%), Latin America (551 | 8.9%), Mexico (542 | 8.7%), Asia (152 | 2.5%), and Laos (87 | 1.4%), together accounting for 30.4% of all Willows residents.
| Immigration Origin | # Population | % Population |
| Asia | 152 | 2.5% |
| Central America | 551 | 8.9% |
| China | 42 | 0.7% |
| Eastern Asia | 42 | 0.7% |
| Eastern Europe | 27 | 0.4% |
| Europe | 61 | 1.0% |
| Germany | 23 | 0.4% |
| Guatemala | 9 | 0.2% |
| Ireland | 11 | 0.2% |
| Laos | 87 | 1.4% |
| Latin America | 551 | 8.9% |
| Mexico | 542 | 8.7% |
| Northern Europe | 11 | 0.2% |
| Pakistan | 23 | 0.4% |
| Poland | 27 | 0.4% |
| South Central Asia | 23 | 0.4% |
| South Eastern Asia | 87 | 1.4% |
| Western Europe | 23 | 0.4% | View All 18 Rows |
Sex and Age in Willows
Sex and Age in Willows
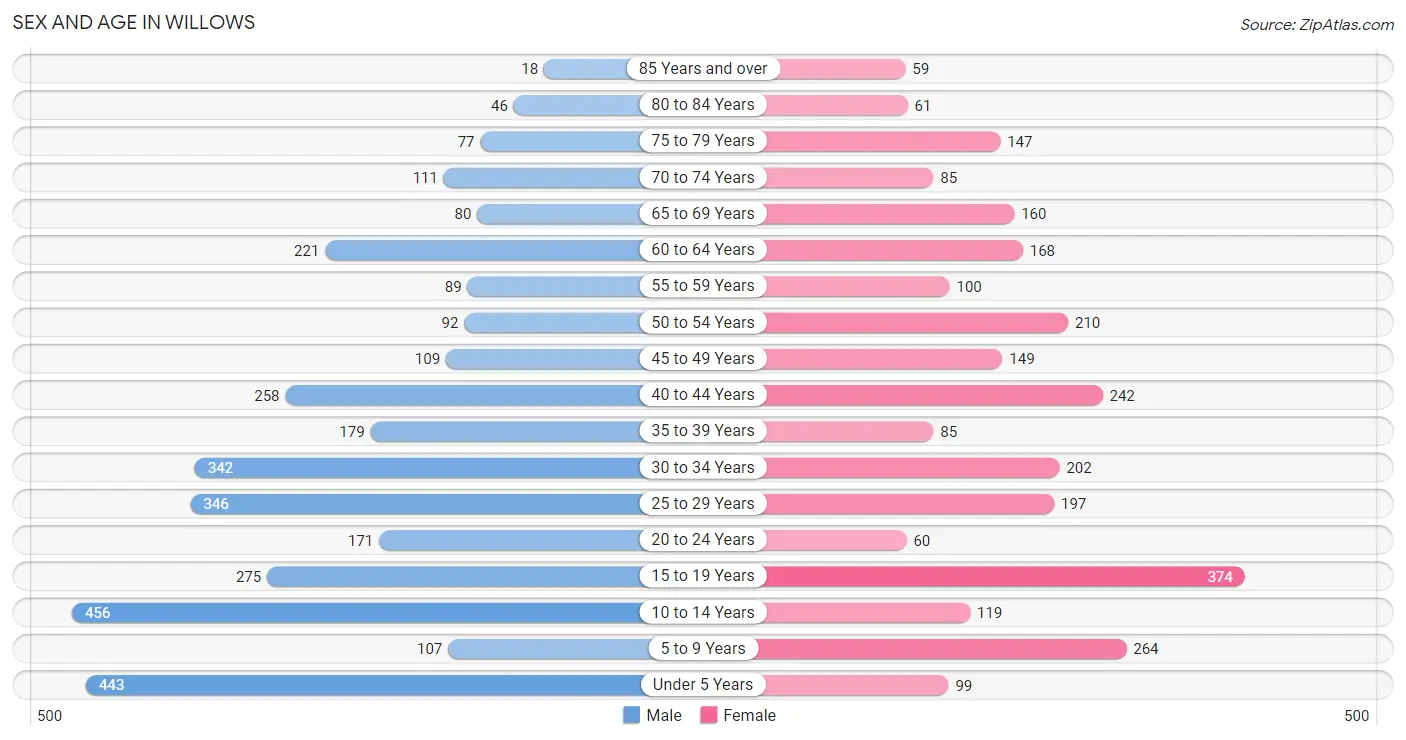
The most populous age groups in Willows are 10 to 14 Years (456 | 13.3%) for men and 15 to 19 Years (374 | 13.5%) for women.
| Age Bracket | Male | Female |
| Under 5 Years | 443 (13.0%) | 99 (3.6%) |
| 5 to 9 Years | 107 (3.1%) | 264 (9.5%) |
| 10 to 14 Years | 456 (13.3%) | 119 (4.3%) |
| 15 to 19 Years | 275 (8.0%) | 374 (13.5%) |
| 20 to 24 Years | 171 (5.0%) | 60 (2.2%) |
| 25 to 29 Years | 346 (10.1%) | 197 (7.1%) |
| 30 to 34 Years | 342 (10.0%) | 202 (7.3%) |
| 35 to 39 Years | 179 (5.2%) | 85 (3.1%) |
| 40 to 44 Years | 258 (7.5%) | 242 (8.7%) |
| 45 to 49 Years | 109 (3.2%) | 149 (5.4%) |
| 50 to 54 Years | 92 (2.7%) | 210 (7.5%) |
| 55 to 59 Years | 89 (2.6%) | 100 (3.6%) |
| 60 to 64 Years | 221 (6.5%) | 168 (6.0%) |
| 65 to 69 Years | 80 (2.3%) | 160 (5.8%) |
| 70 to 74 Years | 111 (3.3%) | 85 (3.1%) |
| 75 to 79 Years | 77 (2.2%) | 147 (5.3%) |
| 80 to 84 Years | 46 (1.3%) | 61 (2.2%) |
| 85 Years and over | 18 (0.5%) | 59 (2.1%) |
| Total | 3,420 (100.0%) | 2,781 (100.0%) |
Families and Households in Willows
Median Family Size in Willows
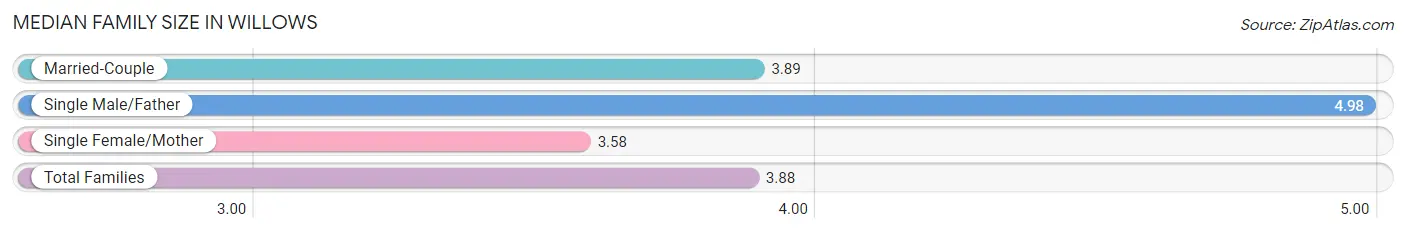
The median family size in Willows is 3.88 persons per family, with single male/father families (87 | 7.2%) accounting for the largest median family size of 4.98 persons per family. On the other hand, single female/mother families (367 | 30.3%) represent the smallest median family size with 3.58 persons per family.
| Family Type | # Families | Family Size |
| Married-Couple | 758 (62.5%) | 3.89 |
| Single Male/Father | 87 (7.2%) | 4.98 |
| Single Female/Mother | 367 (30.3%) | 3.58 |
| Total Families | 1,212 (100.0%) | 3.88 |
Median Household Size in Willows
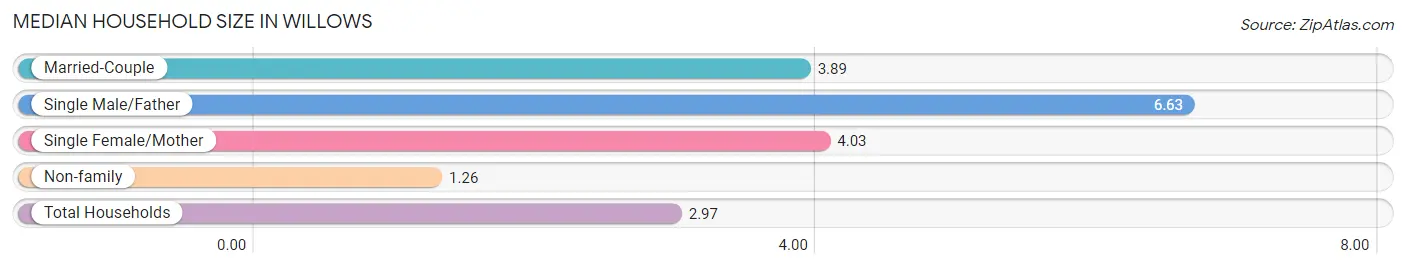
The median household size in Willows is 2.97 persons per household, with single male/father households (87 | 4.3%) accounting for the largest median household size of 6.63 persons per household. non-family households (825 | 40.5%) represent the smallest median household size with 1.26 persons per household.
| Household Type | # Households | Household Size |
| Married-Couple | 758 (37.2%) | 3.89 |
| Single Male/Father | 87 (4.3%) | 6.63 |
| Single Female/Mother | 367 (18.0%) | 4.03 |
| Non-family | 825 (40.5%) | 1.26 |
| Total Households | 2,037 (100.0%) | 2.97 |
Household Size by Marriage Status in Willows
Out of a total of 2,037 households in Willows, 1,212 (59.5%) are family households, while 825 (40.5%) are nonfamily households. The most numerous type of family households are 2-person households, comprising 425, and the most common type of nonfamily households are 1-person households, comprising 698.
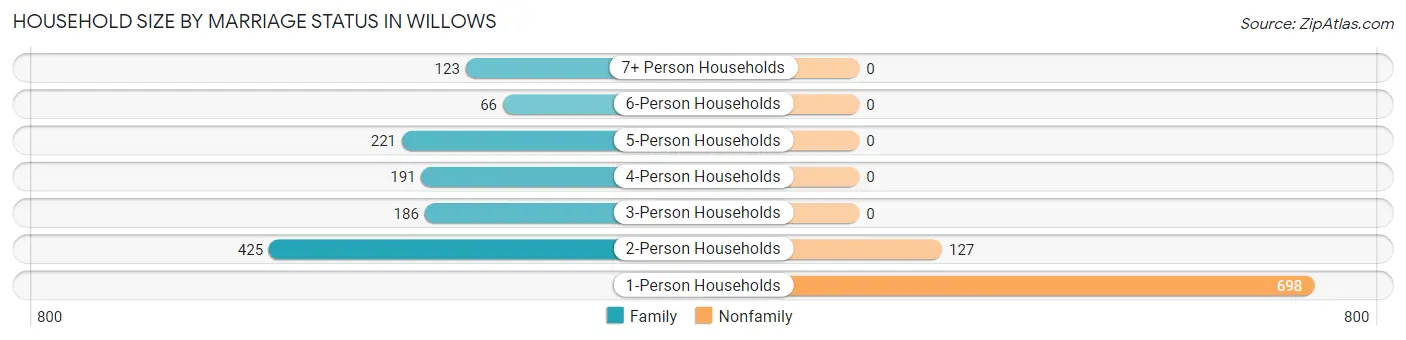
| Household Size | Family Households | Nonfamily Households |
| 1-Person Households | - | 698 (34.3%) |
| 2-Person Households | 425 (20.9%) | 127 (6.2%) |
| 3-Person Households | 186 (9.1%) | 0 (0.0%) |
| 4-Person Households | 191 (9.4%) | 0 (0.0%) |
| 5-Person Households | 221 (10.8%) | 0 (0.0%) |
| 6-Person Households | 66 (3.2%) | 0 (0.0%) |
| 7+ Person Households | 123 (6.0%) | 0 (0.0%) |
| Total | 1,212 (59.5%) | 825 (40.5%) |
Female Fertility in Willows
Fertility by Age in Willows
Average fertility rate in Willows is 130.0 births per 1,000 women. Women in the age bracket of 20 to 34 years have the highest fertility rate with 388.0 births per 1,000 women. Women in the age bracket of 20 to 34 years acount for 100.0% of all women with births.
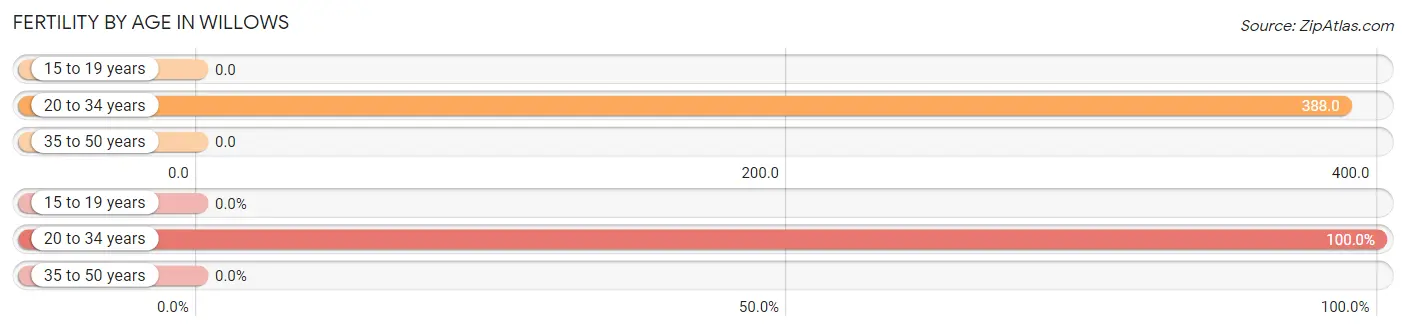
| Age Bracket | Women with Births | Births / 1,000 Women |
| 15 to 19 years | 0 (0.0%) | 0.0 |
| 20 to 34 years | 178 (100.0%) | 388.0 |
| 35 to 50 years | 0 (0.0%) | 0.0 |
| Total | 178 (100.0%) | 130.0 |
Fertility by Age by Marriage Status in Willows
86.0% of women with births (178) in Willows are married. The highest percentage of unmarried women with births falls into 20 to 34 years age bracket with 14.0% of them unmarried at the time of birth, while the lowest percentage of unmarried women with births belong to 20 to 34 years age bracket with 14.0% of them unmarried.
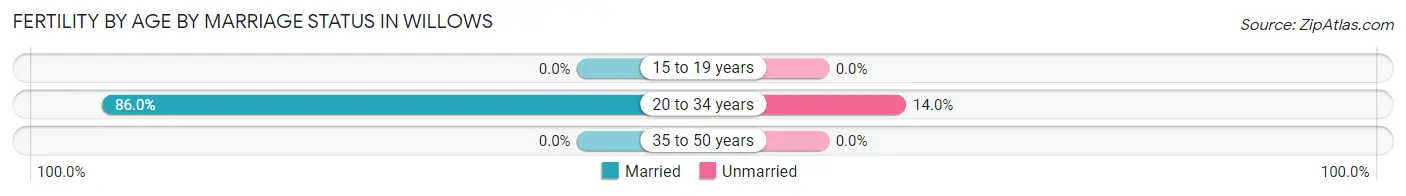
| Age Bracket | Married | Unmarried |
| 15 to 19 years | 0 (0.0%) | 0 (0.0%) |
| 20 to 34 years | 153 (86.0%) | 25 (14.0%) |
| 35 to 50 years | 0 (0.0%) | 0 (0.0%) |
| Total | 153 (86.0%) | 25 (14.0%) |
Fertility by Education in Willows
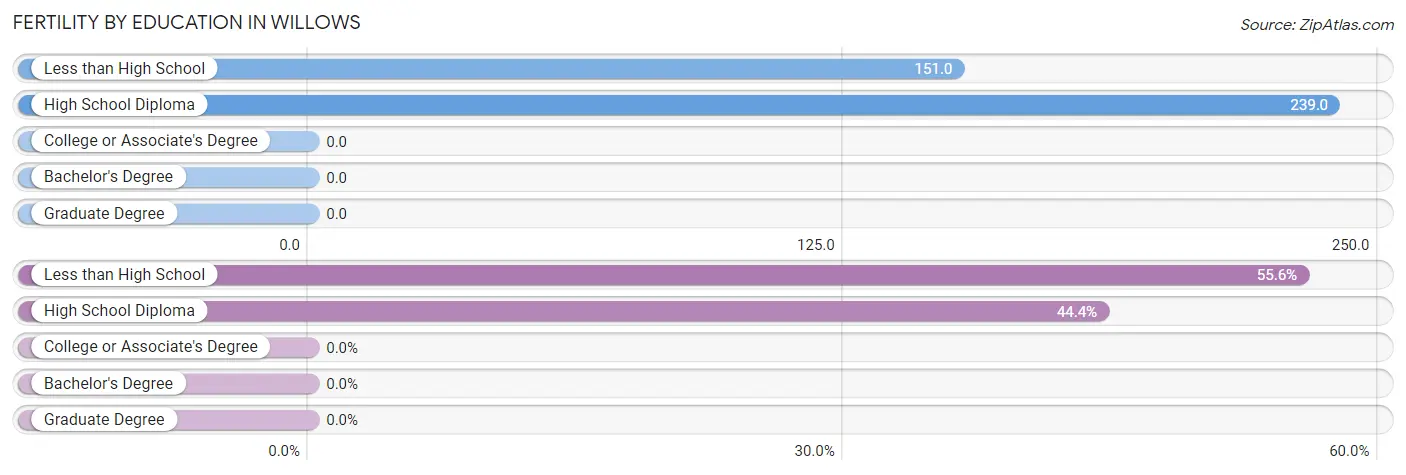
| Educational Attainment | Women with Births | Births / 1,000 Women |
| Less than High School | 99 (55.6%) | 151.0 |
| High School Diploma | 79 (44.4%) | 239.0 |
| College or Associate's Degree | 0 (0.0%) | 0.0 |
| Bachelor's Degree | 0 (0.0%) | 0.0 |
| Graduate Degree | 0 (0.0%) | 0.0 |
| Total | 178 (100.0%) | 130.0 |
Fertility by Education by Marriage Status in Willows
14.0% of women with births in Willows are unmarried. Women with the educational attainment of less than high school are most likely to be married with 100.0% of them married at childbirth, while women with the educational attainment of high school diploma are least likely to be married with 31.7% of them unmarried at childbirth.
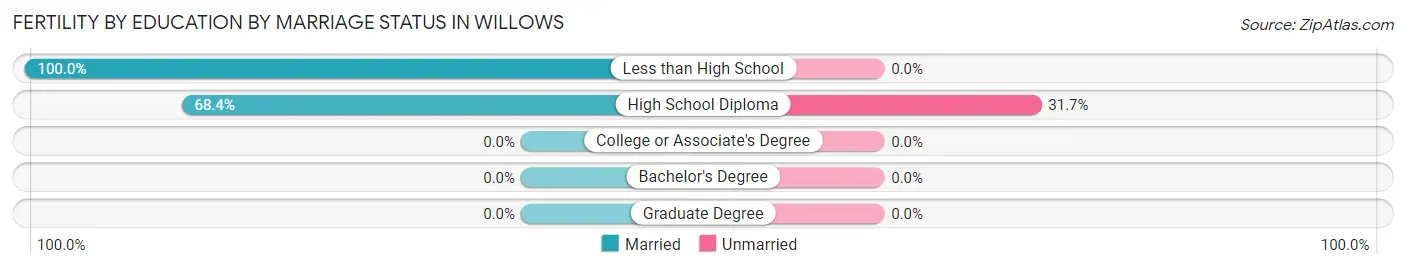
| Educational Attainment | Married | Unmarried |
| Less than High School | 99 (100.0%) | 0 (0.0%) |
| High School Diploma | 54 (68.3%) | 25 (31.7%) |
| College or Associate's Degree | 0 (0.0%) | 0 (0.0%) |
| Bachelor's Degree | 0 (0.0%) | 0 (0.0%) |
| Graduate Degree | 0 (0.0%) | 0 (0.0%) |
| Total | 153 (86.0%) | 25 (14.0%) |
Employment Characteristics in Willows
Employment by Class of Employer in Willows
Among the 2,422 employed individuals in Willows, private company employees (1,776 | 73.3%), local government employees (191 | 7.9%), and federal government employees (184 | 7.6%) make up the most common classes of employment.
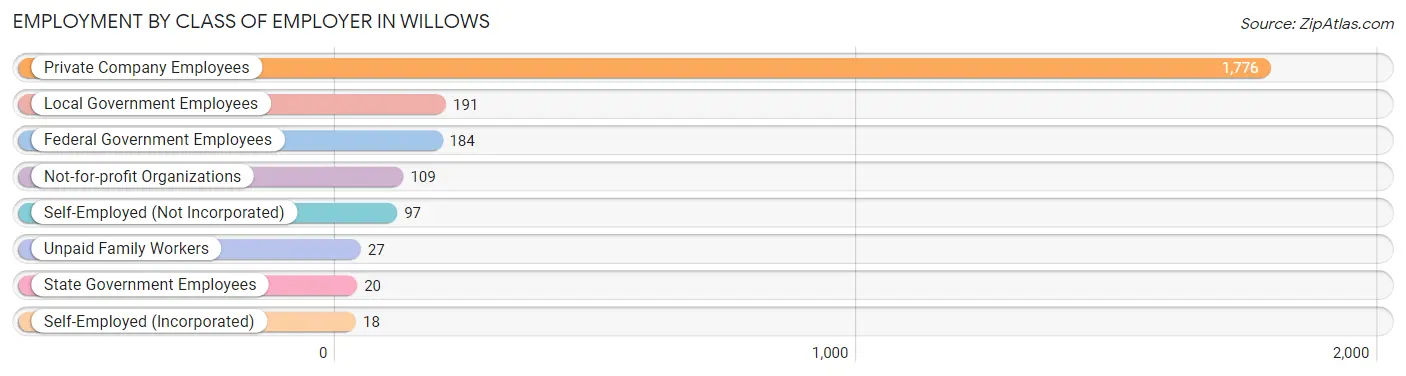
| Employer Class | # Employees | % Employees |
| Private Company Employees | 1,776 | 73.3% |
| Self-Employed (Incorporated) | 18 | 0.7% |
| Self-Employed (Not Incorporated) | 97 | 4.0% |
| Not-for-profit Organizations | 109 | 4.5% |
| Local Government Employees | 191 | 7.9% |
| State Government Employees | 20 | 0.8% |
| Federal Government Employees | 184 | 7.6% |
| Unpaid Family Workers | 27 | 1.1% |
| Total | 2,422 | 100.0% |
Employment Status by Age in Willows
According to the labor force statistics for Willows, out of the total population over 16 years of age (4,594), 61.6% or 2,830 individuals are in the labor force, with 9.2% or 260 of them unemployed. The age group with the highest labor force participation rate is 30 to 34 years, with 94.1% or 512 individuals in the labor force. Within the labor force, the 16 to 19 years age range has the highest percentage of unemployed individuals, with 25.4% or 87 of them being unemployed.
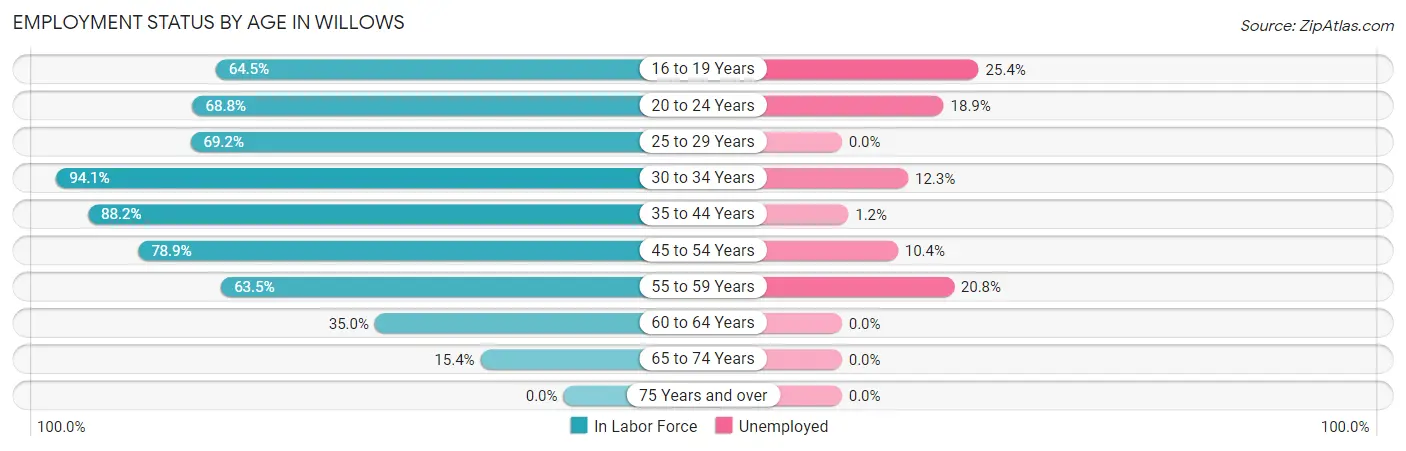
| Age Bracket | In Labor Force | Unemployed |
| 16 to 19 Years | 342 (64.5%) | 87 (25.4%) |
| 20 to 24 Years | 159 (68.8%) | 30 (18.9%) |
| 25 to 29 Years | 376 (69.2%) | 0 (0.0%) |
| 30 to 34 Years | 512 (94.1%) | 63 (12.3%) |
| 35 to 44 Years | 674 (88.2%) | 8 (1.2%) |
| 45 to 54 Years | 442 (78.9%) | 46 (10.4%) |
| 55 to 59 Years | 120 (63.5%) | 25 (20.8%) |
| 60 to 64 Years | 136 (35.0%) | 0 (0.0%) |
| 65 to 74 Years | 67 (15.4%) | 0 (0.0%) |
| 75 Years and over | 0 (0.0%) | 0 (0.0%) |
| Total | 2,830 (61.6%) | 260 (9.2%) |
Employment Status by Educational Attainment in Willows
According to labor force statistics for Willows, 75.6% of individuals (2,260) out of the total population between 25 and 64 years of age (2,989) are in the labor force, with 6.3% or 142 of them being unemployed. The group with the highest labor force participation rate are those with the educational attainment of bachelor's degree or higher, with 92.2% or 437 individuals in the labor force. Within the labor force, individuals with less than high school education have the highest percentage of unemployment, with 18.4% or 44 of them being unemployed.
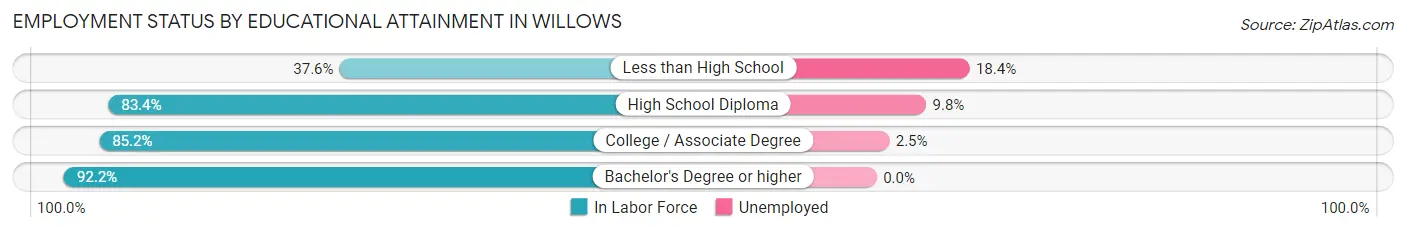
| Educational Attainment | In Labor Force | Unemployed |
| Less than High School | 239 (37.6%) | 117 (18.4%) |
| High School Diploma | 795 (83.4%) | 93 (9.8%) |
| College / Associate Degree | 789 (85.2%) | 23 (2.5%) |
| Bachelor's Degree or higher | 437 (92.2%) | 0 (0.0%) |
| Total | 2,260 (75.6%) | 188 (6.3%) |
Employment Occupations by Sex in Willows
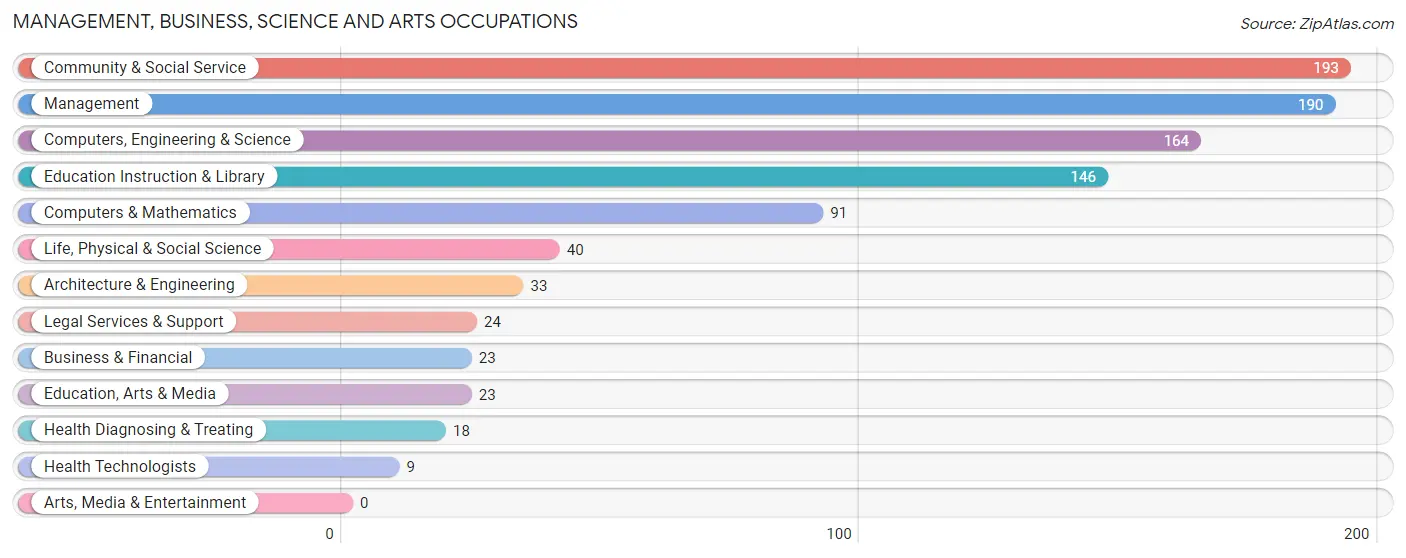
Management, Business, Science and Arts Occupations
The most common Management, Business, Science and Arts occupations in Willows are Community & Social Service (193 | 7.5%), Management (190 | 7.4%), Computers, Engineering & Science (164 | 6.4%), Education Instruction & Library (146 | 5.7%), and Computers & Mathematics (91 | 3.5%).
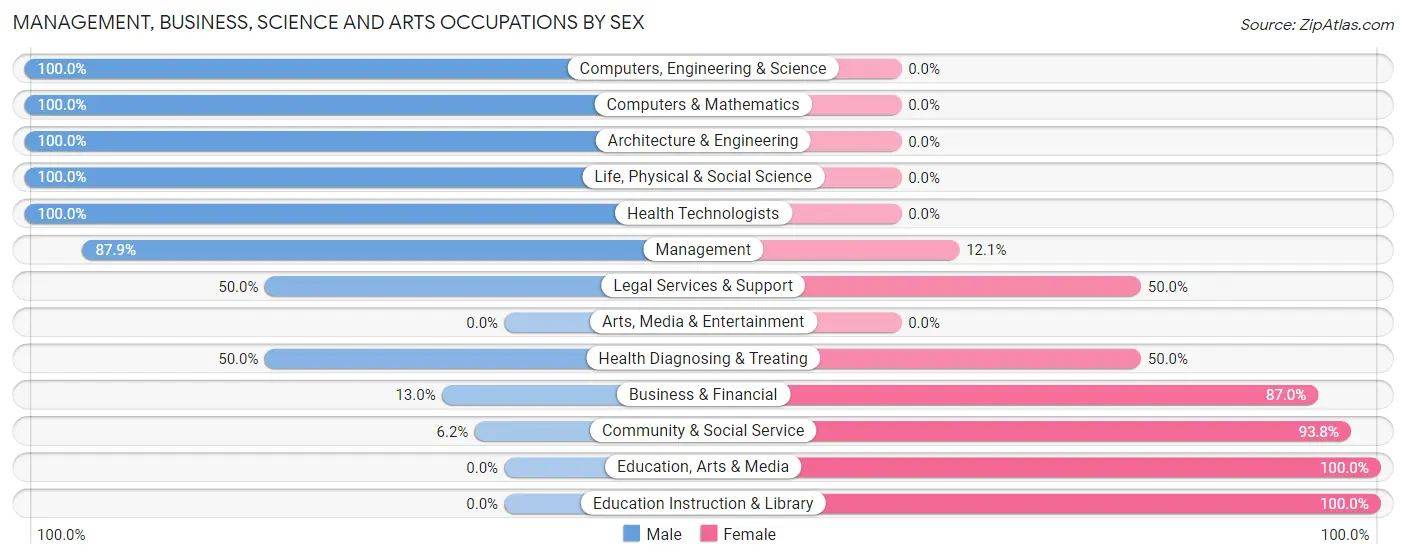
Management, Business, Science and Arts Occupations by Sex
Within the Management, Business, Science and Arts occupations in Willows, the most male-oriented occupations are Computers, Engineering & Science (100.0%), Computers & Mathematics (100.0%), and Architecture & Engineering (100.0%), while the most female-oriented occupations are Education, Arts & Media (100.0%), Education Instruction & Library (100.0%), and Community & Social Service (93.8%).
| Occupation | Male | Female |
| Management | 167 (87.9%) | 23 (12.1%) |
| Business & Financial | 3 (13.0%) | 20 (87.0%) |
| Computers, Engineering & Science | 164 (100.0%) | 0 (0.0%) |
| Computers & Mathematics | 91 (100.0%) | 0 (0.0%) |
| Architecture & Engineering | 33 (100.0%) | 0 (0.0%) |
| Life, Physical & Social Science | 40 (100.0%) | 0 (0.0%) |
| Community & Social Service | 12 (6.2%) | 181 (93.8%) |
| Education, Arts & Media | 0 (0.0%) | 23 (100.0%) |
| Legal Services & Support | 12 (50.0%) | 12 (50.0%) |
| Education Instruction & Library | 0 (0.0%) | 146 (100.0%) |
| Arts, Media & Entertainment | 0 (0.0%) | 0 (0.0%) |
| Health Diagnosing & Treating | 9 (50.0%) | 9 (50.0%) |
| Health Technologists | 9 (100.0%) | 0 (0.0%) |
| Total (Category) | 355 (60.4%) | 233 (39.6%) |
| Total (Overall) | 1,581 (61.5%) | 988 (38.5%) |
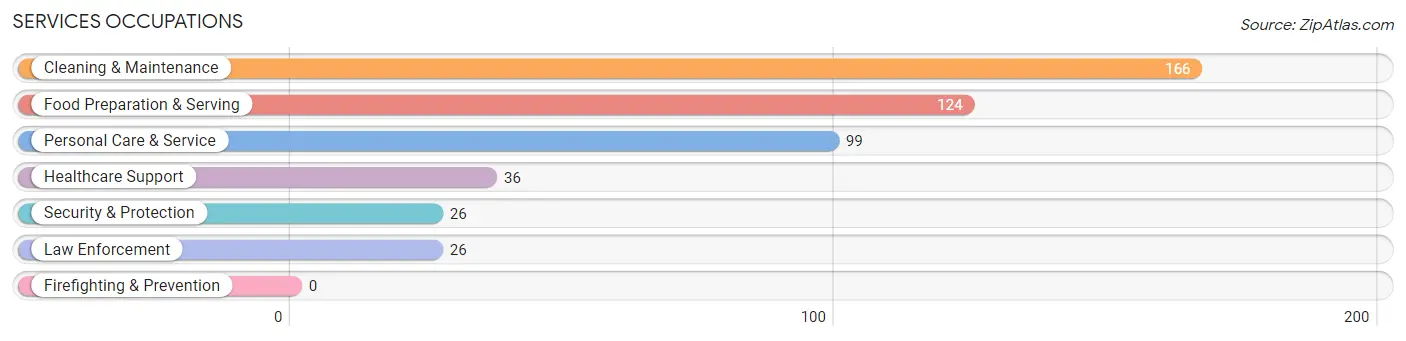
Services Occupations
The most common Services occupations in Willows are Cleaning & Maintenance (166 | 6.5%), Food Preparation & Serving (124 | 4.8%), Personal Care & Service (99 | 3.8%), Healthcare Support (36 | 1.4%), and Security & Protection (26 | 1.0%).
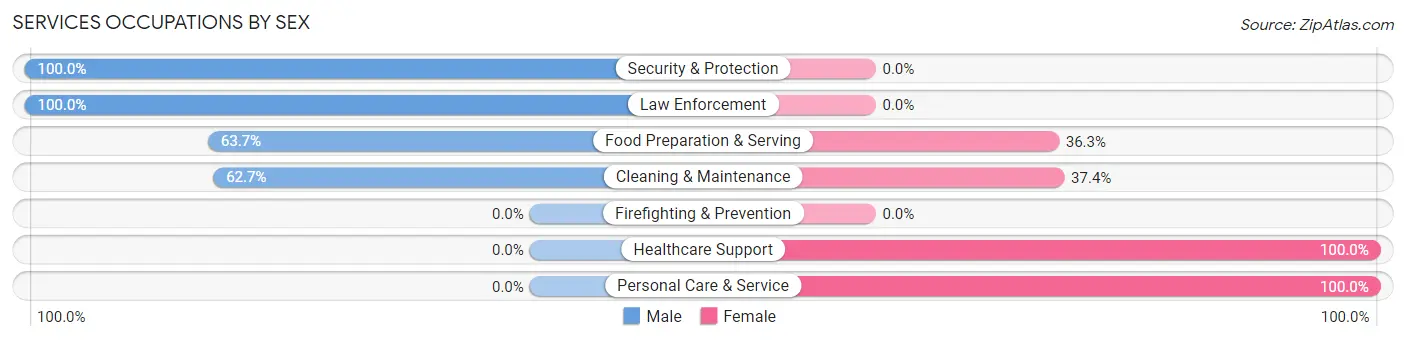
Services Occupations by Sex
Within the Services occupations in Willows, the most male-oriented occupations are Security & Protection (100.0%), Law Enforcement (100.0%), and Food Preparation & Serving (63.7%), while the most female-oriented occupations are Healthcare Support (100.0%), Personal Care & Service (100.0%), and Cleaning & Maintenance (37.3%).
| Occupation | Male | Female |
| Healthcare Support | 0 (0.0%) | 36 (100.0%) |
| Security & Protection | 26 (100.0%) | 0 (0.0%) |
| Firefighting & Prevention | 0 (0.0%) | 0 (0.0%) |
| Law Enforcement | 26 (100.0%) | 0 (0.0%) |
| Food Preparation & Serving | 79 (63.7%) | 45 (36.3%) |
| Cleaning & Maintenance | 104 (62.6%) | 62 (37.3%) |
| Personal Care & Service | 0 (0.0%) | 99 (100.0%) |
| Total (Category) | 209 (46.3%) | 242 (53.7%) |
| Total (Overall) | 1,581 (61.5%) | 988 (38.5%) |
Sales and Office Occupations
The most common Sales and Office occupations in Willows are Office & Administration (348 | 13.6%), and Sales & Related (154 | 6.0%).
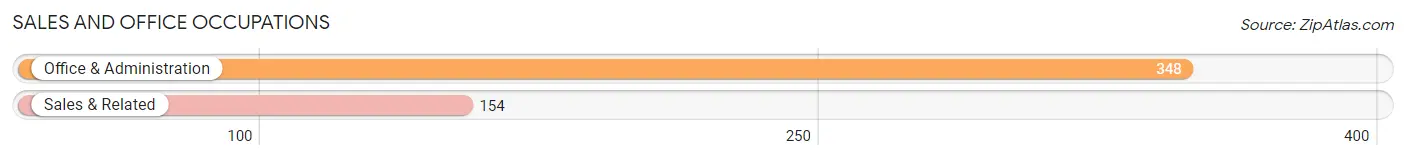
Sales and Office Occupations by Sex
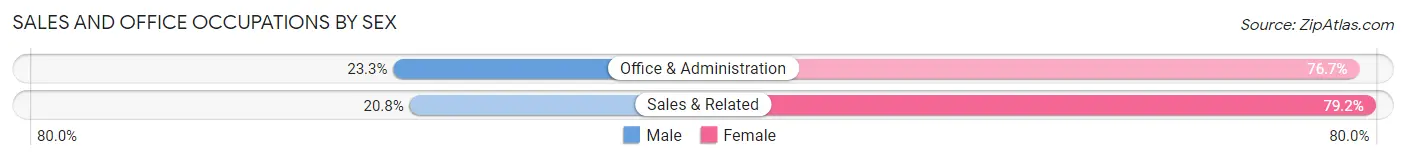
| Occupation | Male | Female |
| Sales & Related | 32 (20.8%) | 122 (79.2%) |
| Office & Administration | 81 (23.3%) | 267 (76.7%) |
| Total (Category) | 113 (22.5%) | 389 (77.5%) |
| Total (Overall) | 1,581 (61.5%) | 988 (38.5%) |
Natural Resources, Construction and Maintenance Occupations
The most common Natural Resources, Construction and Maintenance occupations in Willows are Farming, Fishing & Forestry (241 | 9.4%), Construction & Extraction (152 | 5.9%), and Installation, Maintenance & Repair (41 | 1.6%).
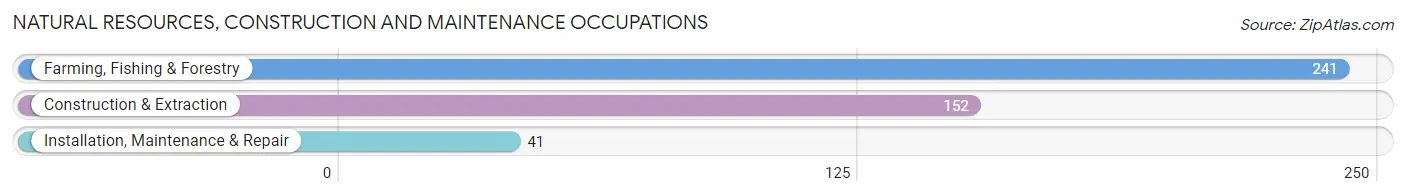
Natural Resources, Construction and Maintenance Occupations by Sex
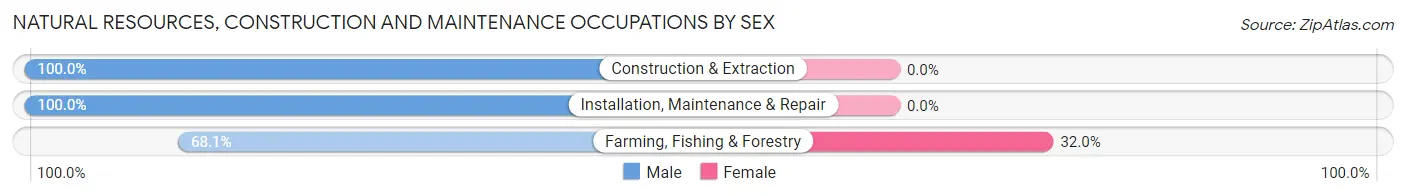
| Occupation | Male | Female |
| Farming, Fishing & Forestry | 164 (68.0%) | 77 (32.0%) |
| Construction & Extraction | 152 (100.0%) | 0 (0.0%) |
| Installation, Maintenance & Repair | 41 (100.0%) | 0 (0.0%) |
| Total (Category) | 357 (82.3%) | 77 (17.7%) |
| Total (Overall) | 1,581 (61.5%) | 988 (38.5%) |
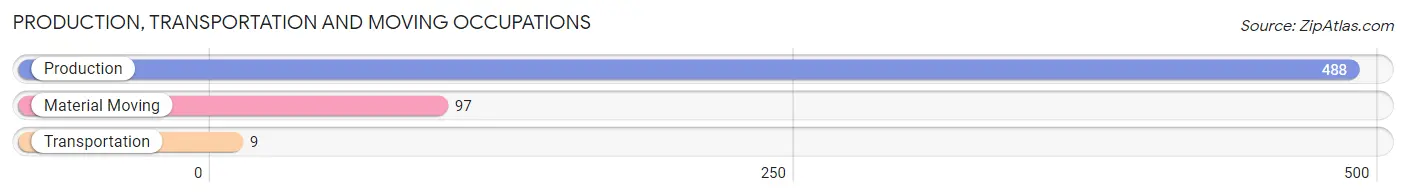
Production, Transportation and Moving Occupations
The most common Production, Transportation and Moving occupations in Willows are Production (488 | 19.0%), Material Moving (97 | 3.8%), and Transportation (9 | 0.4%).
Production, Transportation and Moving Occupations by Sex
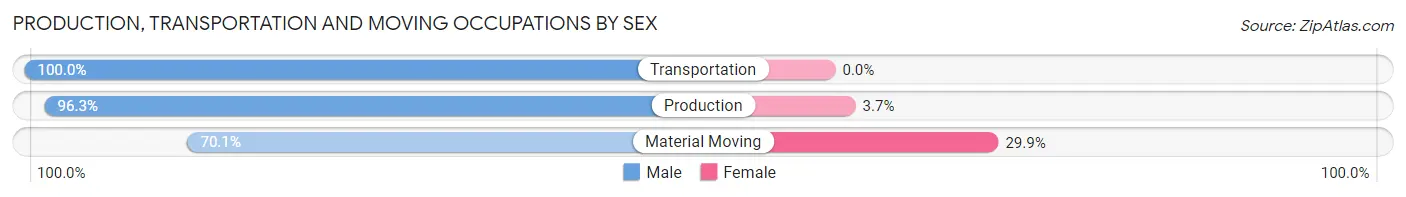
| Occupation | Male | Female |
| Production | 470 (96.3%) | 18 (3.7%) |
| Transportation | 9 (100.0%) | 0 (0.0%) |
| Material Moving | 68 (70.1%) | 29 (29.9%) |
| Total (Category) | 547 (92.1%) | 47 (7.9%) |
| Total (Overall) | 1,581 (61.5%) | 988 (38.5%) |
Employment Industries by Sex in Willows
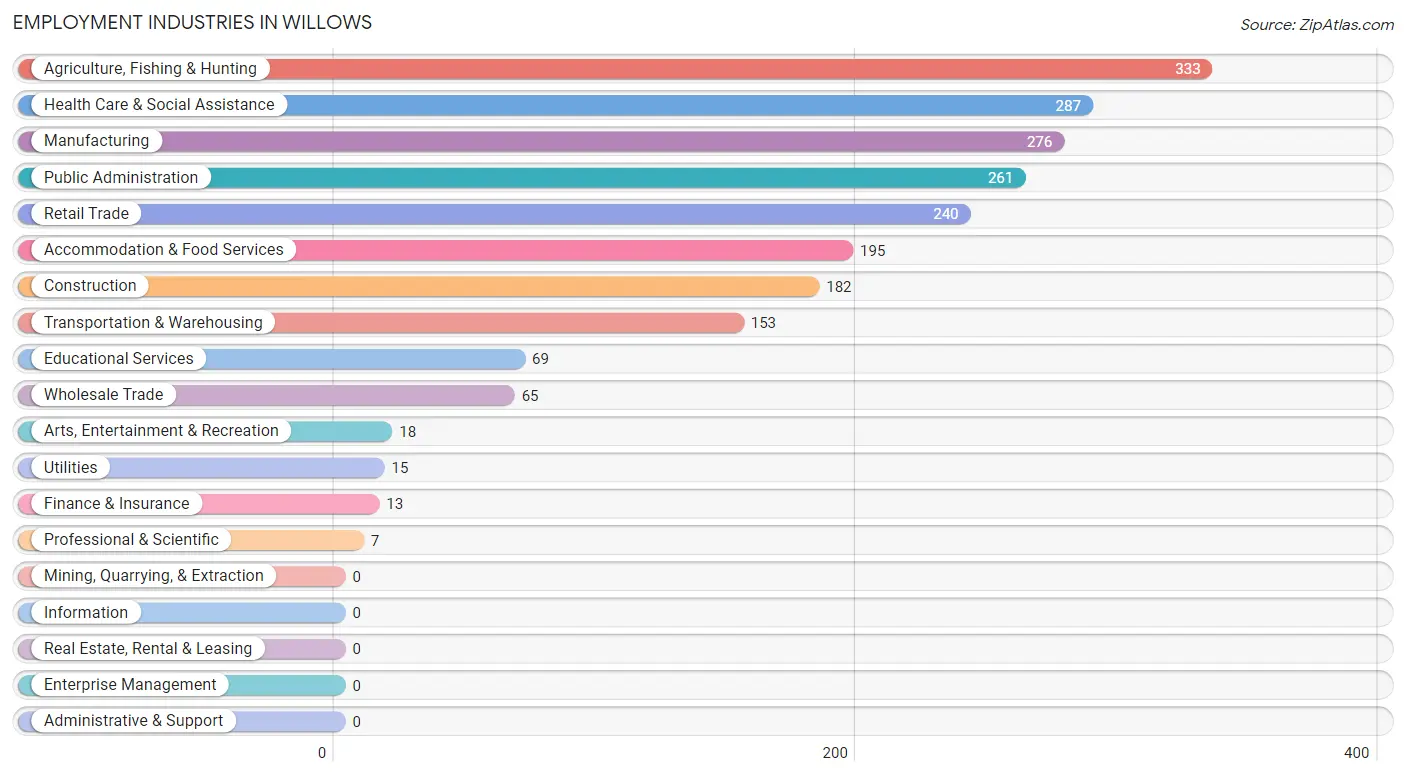
Employment Industries in Willows
The major employment industries in Willows include Agriculture, Fishing & Hunting (333 | 13.0%), Health Care & Social Assistance (287 | 11.2%), Manufacturing (276 | 10.7%), Public Administration (261 | 10.2%), and Retail Trade (240 | 9.3%).
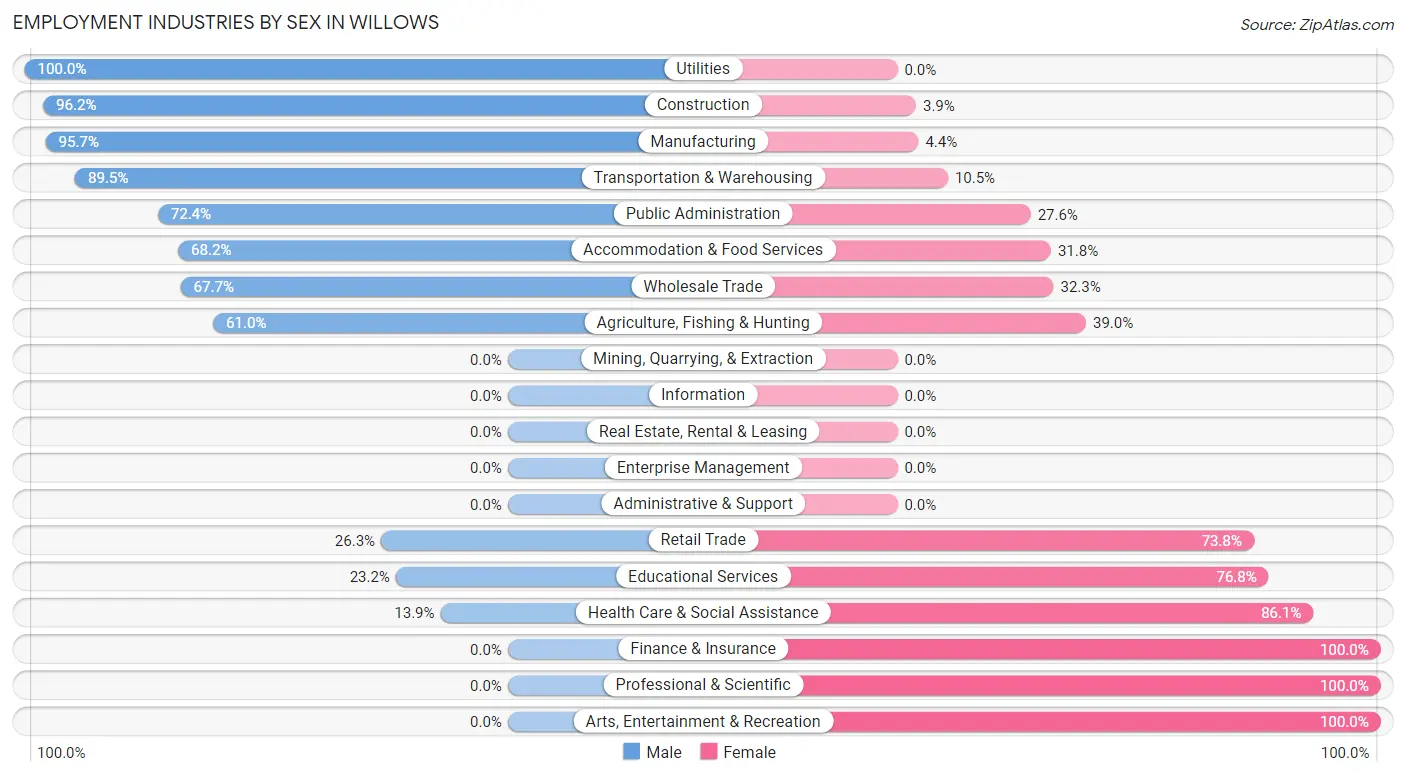
Employment Industries by Sex in Willows
The Willows industries that see more men than women are Utilities (100.0%), Construction (96.2%), and Manufacturing (95.7%), whereas the industries that tend to have a higher number of women are Finance & Insurance (100.0%), Professional & Scientific (100.0%), and Arts, Entertainment & Recreation (100.0%).
| Industry | Male | Female |
| Agriculture, Fishing & Hunting | 203 (61.0%) | 130 (39.0%) |
| Mining, Quarrying, & Extraction | 0 (0.0%) | 0 (0.0%) |
| Construction | 175 (96.2%) | 7 (3.8%) |
| Manufacturing | 264 (95.7%) | 12 (4.3%) |
| Wholesale Trade | 44 (67.7%) | 21 (32.3%) |
| Retail Trade | 63 (26.3%) | 177 (73.8%) |
| Transportation & Warehousing | 137 (89.5%) | 16 (10.5%) |
| Utilities | 15 (100.0%) | 0 (0.0%) |
| Information | 0 (0.0%) | 0 (0.0%) |
| Finance & Insurance | 0 (0.0%) | 13 (100.0%) |
| Real Estate, Rental & Leasing | 0 (0.0%) | 0 (0.0%) |
| Professional & Scientific | 0 (0.0%) | 7 (100.0%) |
| Enterprise Management | 0 (0.0%) | 0 (0.0%) |
| Administrative & Support | 0 (0.0%) | 0 (0.0%) |
| Educational Services | 16 (23.2%) | 53 (76.8%) |
| Health Care & Social Assistance | 40 (13.9%) | 247 (86.1%) |
| Arts, Entertainment & Recreation | 0 (0.0%) | 18 (100.0%) |
| Accommodation & Food Services | 133 (68.2%) | 62 (31.8%) |
| Public Administration | 189 (72.4%) | 72 (27.6%) |
| Total | 1,581 (61.5%) | 988 (38.5%) |
Education in Willows
School Enrollment in Willows
The most common levels of schooling among the 1,582 students in Willows are high school (584 | 36.9%), middle school (430 | 27.2%), and elementary school (371 | 23.4%).
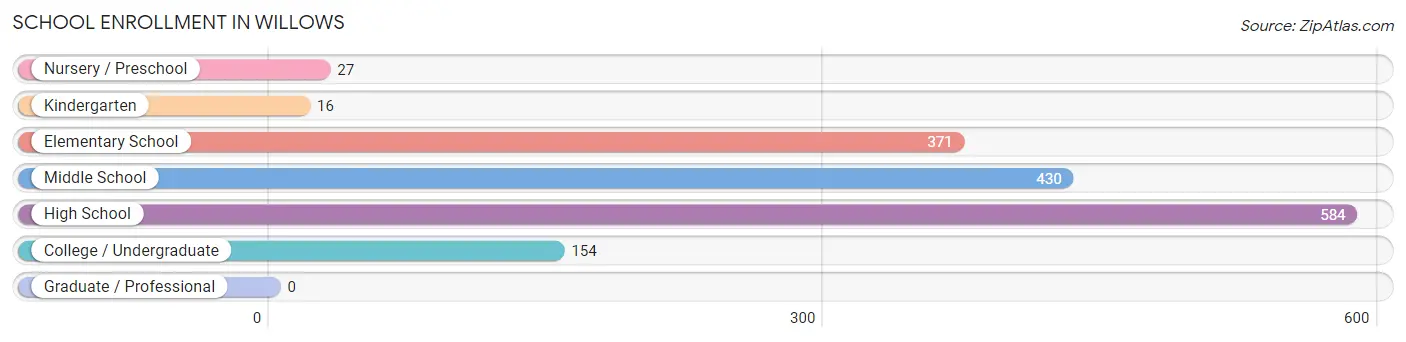
| School Level | # Students | % Students |
| Nursery / Preschool | 27 | 1.7% |
| Kindergarten | 16 | 1.0% |
| Elementary School | 371 | 23.4% |
| Middle School | 430 | 27.2% |
| High School | 584 | 36.9% |
| College / Undergraduate | 154 | 9.7% |
| Graduate / Professional | 0 | 0.0% |
| Total | 1,582 | 100.0% |
School Enrollment by Age by Funding Source in Willows
Out of a total of 1,582 students who are enrolled in schools in Willows, 505 (31.9%) attend a private institution, while the remaining 1,077 (68.1%) are enrolled in public schools. The age group of 10 to 14 year olds has the highest likelihood of being enrolled in private schools, with 307 (53.4% in the age bracket) enrolled. Conversely, the age group of 18 to 19 year olds has the lowest likelihood of being enrolled in a private school, with 150 (100.0% in the age bracket) attending a public institution.
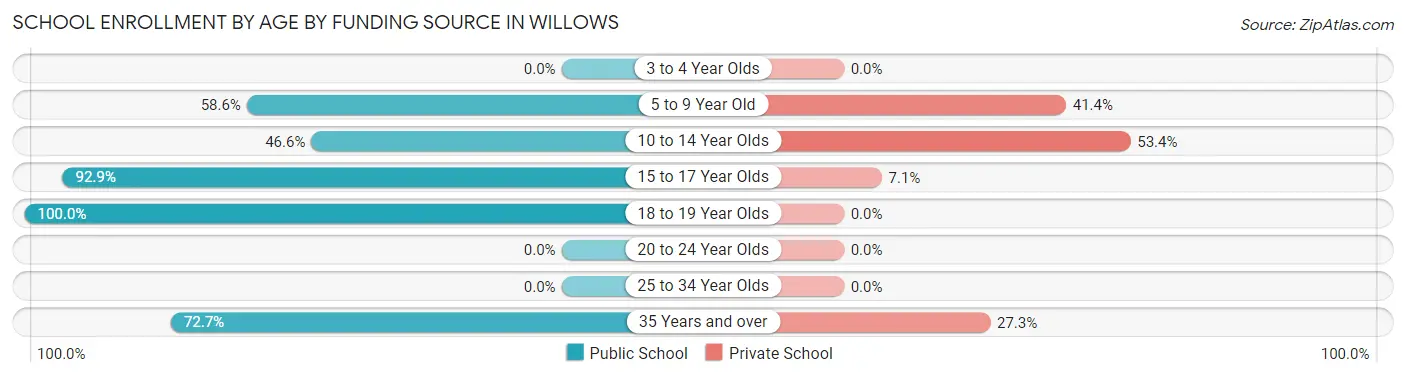
| Age Bracket | Public School | Private School |
| 3 to 4 Year Olds | 0 (0.0%) | 0 (0.0%) |
| 5 to 9 Year Old | 180 (58.6%) | 127 (41.4%) |
| 10 to 14 Year Olds | 268 (46.6%) | 307 (53.4%) |
| 15 to 17 Year Olds | 368 (92.9%) | 28 (7.1%) |
| 18 to 19 Year Olds | 150 (100.0%) | 0 (0.0%) |
| 20 to 24 Year Olds | 0 (0.0%) | 0 (0.0%) |
| 25 to 34 Year Olds | 0 (0.0%) | 0 (0.0%) |
| 35 Years and over | 112 (72.7%) | 42 (27.3%) |
| Total | 1,077 (68.1%) | 505 (31.9%) |
Educational Attainment by Field of Study in Willows
Bio, nature & agricultural (181 | 26.6%), liberal arts & history (129 | 19.0%), engineering (113 | 16.6%), business (71 | 10.4%), and social sciences (64 | 9.4%) are the most common fields of study among 680 individuals in Willows who have obtained a bachelor's degree or higher.
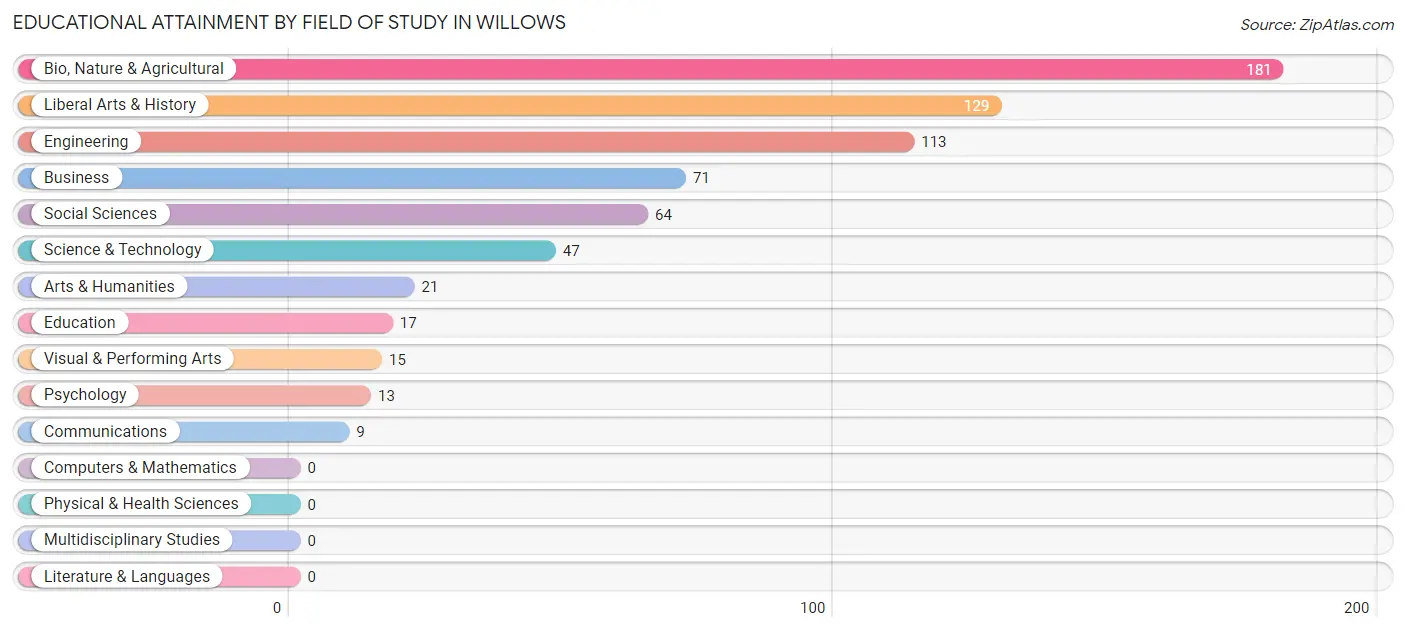
| Field of Study | # Graduates | % Graduates |
| Computers & Mathematics | 0 | 0.0% |
| Bio, Nature & Agricultural | 181 | 26.6% |
| Physical & Health Sciences | 0 | 0.0% |
| Psychology | 13 | 1.9% |
| Social Sciences | 64 | 9.4% |
| Engineering | 113 | 16.6% |
| Multidisciplinary Studies | 0 | 0.0% |
| Science & Technology | 47 | 6.9% |
| Business | 71 | 10.4% |
| Education | 17 | 2.5% |
| Literature & Languages | 0 | 0.0% |
| Liberal Arts & History | 129 | 19.0% |
| Visual & Performing Arts | 15 | 2.2% |
| Communications | 9 | 1.3% |
| Arts & Humanities | 21 | 3.1% |
| Total | 680 | 100.0% |
Transportation & Commute in Willows
Vehicle Availability by Sex in Willows
The most prevalent vehicle ownership categories in Willows are males with 2 vehicles (491, accounting for 34.4%) and females with 2 vehicles (448, making up 50.1%).
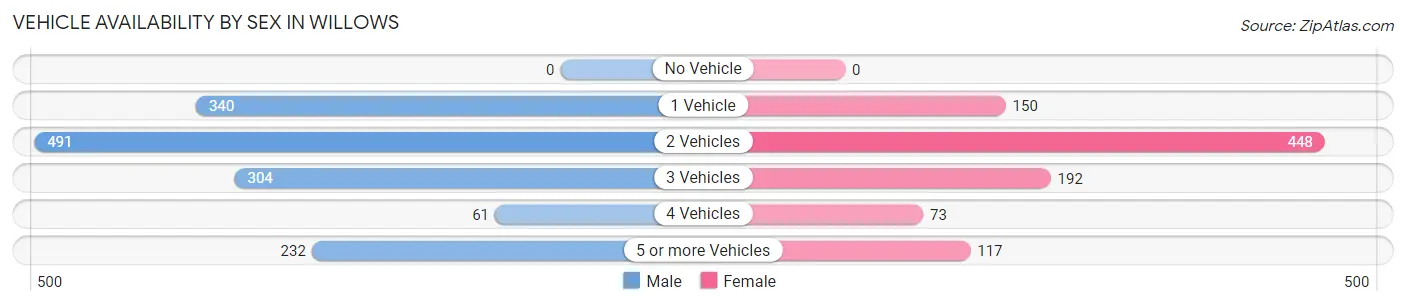
| Vehicles Available | Male | Female |
| No Vehicle | 0 (0.0%) | 0 (0.0%) |
| 1 Vehicle | 340 (23.8%) | 150 (15.3%) |
| 2 Vehicles | 491 (34.4%) | 448 (45.7%) |
| 3 Vehicles | 304 (21.3%) | 192 (19.6%) |
| 4 Vehicles | 61 (4.3%) | 73 (7.4%) |
| 5 or more Vehicles | 232 (16.3%) | 117 (11.9%) |
| Total | 1,428 (100.0%) | 980 (100.0%) |
Commute Time in Willows
The most frequently occuring commute durations in Willows are 5 to 9 minutes (529 commuters, 24.1%), 10 to 14 minutes (348 commuters, 15.9%), and 40 to 44 minutes (283 commuters, 12.9%).
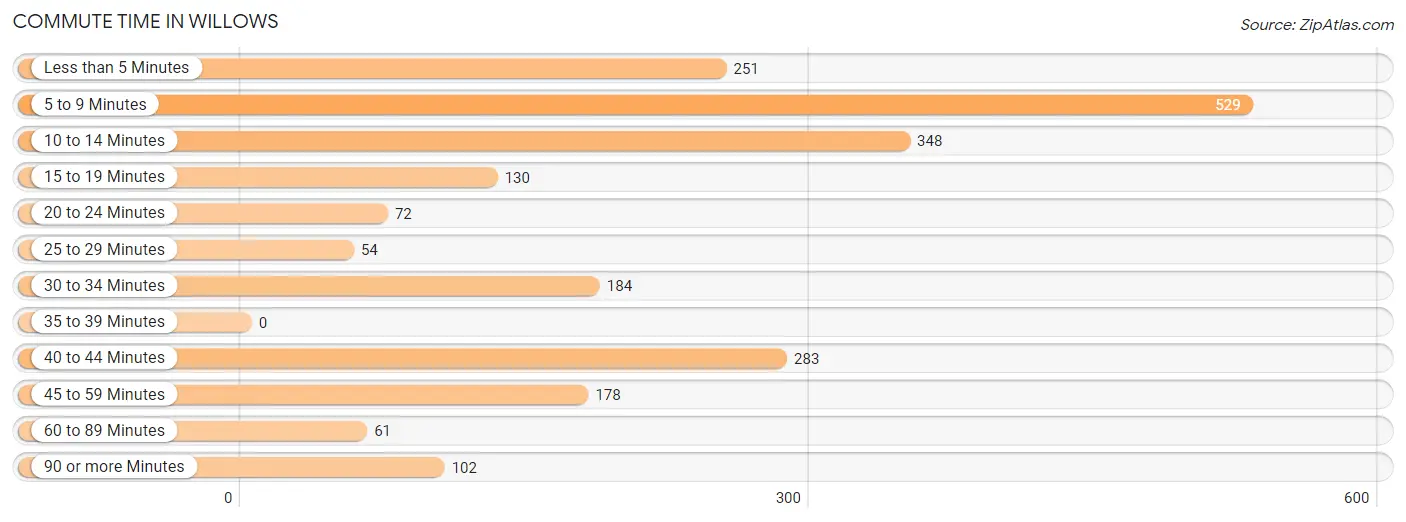
| Commute Time | # Commuters | % Commuters |
| Less than 5 Minutes | 251 | 11.5% |
| 5 to 9 Minutes | 529 | 24.1% |
| 10 to 14 Minutes | 348 | 15.9% |
| 15 to 19 Minutes | 130 | 5.9% |
| 20 to 24 Minutes | 72 | 3.3% |
| 25 to 29 Minutes | 54 | 2.5% |
| 30 to 34 Minutes | 184 | 8.4% |
| 35 to 39 Minutes | 0 | 0.0% |
| 40 to 44 Minutes | 283 | 12.9% |
| 45 to 59 Minutes | 178 | 8.1% |
| 60 to 89 Minutes | 61 | 2.8% |
| 90 or more Minutes | 102 | 4.6% |
Commute Time by Sex in Willows
The most common commute times in Willows are 5 to 9 minutes (301 commuters, 20.9%) for males and 5 to 9 minutes (228 commuters, 30.2%) for females.
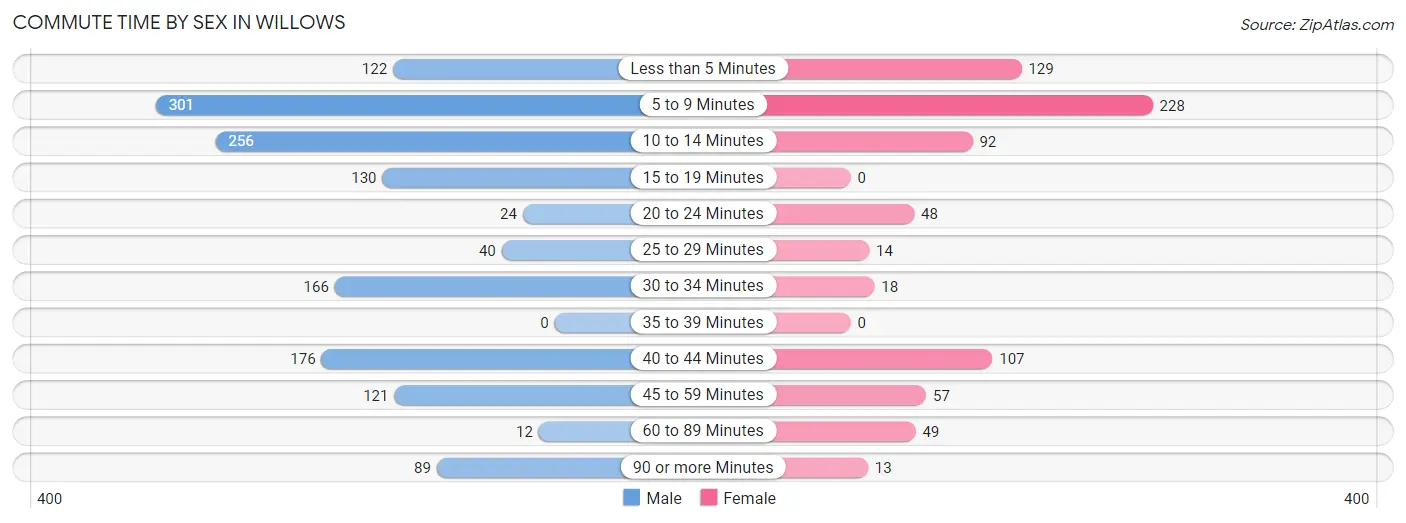
| Commute Time | Male | Female |
| Less than 5 Minutes | 122 (8.5%) | 129 (17.1%) |
| 5 to 9 Minutes | 301 (20.9%) | 228 (30.2%) |
| 10 to 14 Minutes | 256 (17.8%) | 92 (12.2%) |
| 15 to 19 Minutes | 130 (9.0%) | 0 (0.0%) |
| 20 to 24 Minutes | 24 (1.7%) | 48 (6.4%) |
| 25 to 29 Minutes | 40 (2.8%) | 14 (1.8%) |
| 30 to 34 Minutes | 166 (11.6%) | 18 (2.4%) |
| 35 to 39 Minutes | 0 (0.0%) | 0 (0.0%) |
| 40 to 44 Minutes | 176 (12.2%) | 107 (14.2%) |
| 45 to 59 Minutes | 121 (8.4%) | 57 (7.5%) |
| 60 to 89 Minutes | 12 (0.8%) | 49 (6.5%) |
| 90 or more Minutes | 89 (6.2%) | 13 (1.7%) |
Time of Departure to Work by Sex in Willows
The most frequent times of departure to work in Willows are 7:00 AM to 7:29 AM (450, 31.3%) for males and 7:30 AM to 7:59 AM (177, 23.4%) for females.
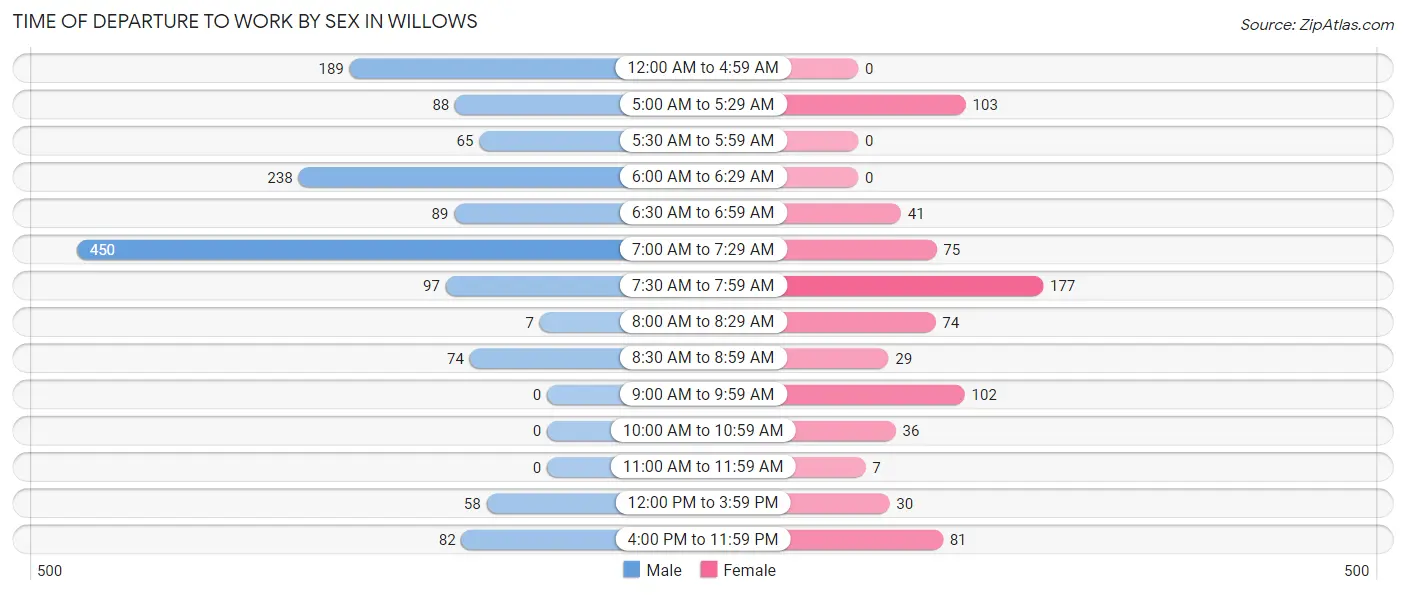
| Time of Departure | Male | Female |
| 12:00 AM to 4:59 AM | 189 (13.2%) | 0 (0.0%) |
| 5:00 AM to 5:29 AM | 88 (6.1%) | 103 (13.6%) |
| 5:30 AM to 5:59 AM | 65 (4.5%) | 0 (0.0%) |
| 6:00 AM to 6:29 AM | 238 (16.6%) | 0 (0.0%) |
| 6:30 AM to 6:59 AM | 89 (6.2%) | 41 (5.4%) |
| 7:00 AM to 7:29 AM | 450 (31.3%) | 75 (9.9%) |
| 7:30 AM to 7:59 AM | 97 (6.8%) | 177 (23.4%) |
| 8:00 AM to 8:29 AM | 7 (0.5%) | 74 (9.8%) |
| 8:30 AM to 8:59 AM | 74 (5.1%) | 29 (3.8%) |
| 9:00 AM to 9:59 AM | 0 (0.0%) | 102 (13.5%) |
| 10:00 AM to 10:59 AM | 0 (0.0%) | 36 (4.8%) |
| 11:00 AM to 11:59 AM | 0 (0.0%) | 7 (0.9%) |
| 12:00 PM to 3:59 PM | 58 (4.0%) | 30 (4.0%) |
| 4:00 PM to 11:59 PM | 82 (5.7%) | 81 (10.7%) |
| Total | 1,437 (100.0%) | 755 (100.0%) |
Housing Occupancy in Willows
Occupancy by Ownership in Willows
Of the total 2,037 dwellings in Willows, owner-occupied units account for 954 (46.8%), while renter-occupied units make up 1,083 (53.2%).
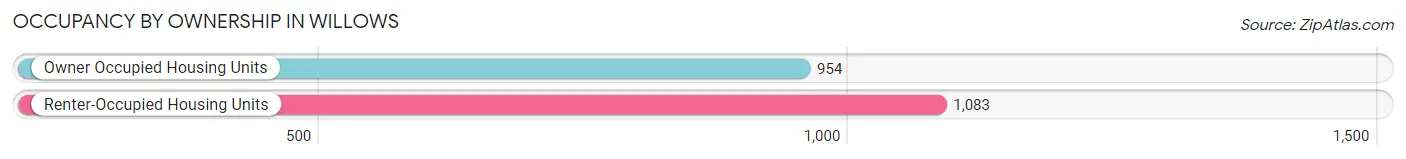
| Occupancy | # Housing Units | % Housing Units |
| Owner Occupied Housing Units | 954 | 46.8% |
| Renter-Occupied Housing Units | 1,083 | 53.2% |
| Total Occupied Housing Units | 2,037 | 100.0% |
Occupancy by Household Size in Willows

| Household Size | # Housing Units | % Housing Units |
| 1-Person Household | 698 | 34.3% |
| 2-Person Household | 552 | 27.1% |
| 3-Person Household | 186 | 9.1% |
| 4+ Person Household | 601 | 29.5% |
| Total Housing Units | 2,037 | 100.0% |
Occupancy by Ownership by Household Size in Willows
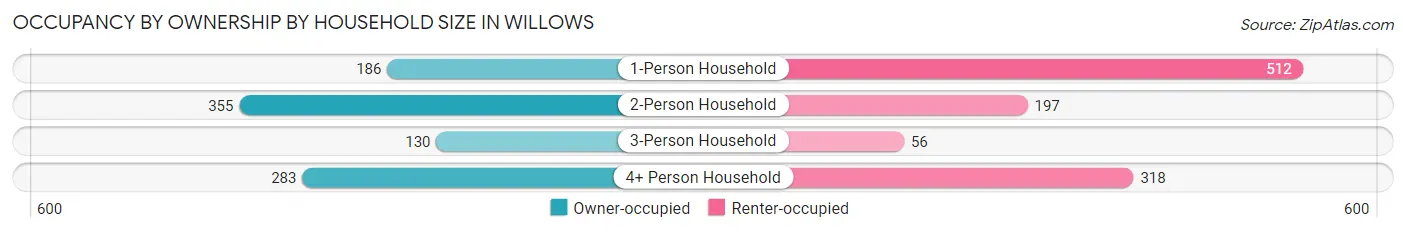
| Household Size | Owner-occupied | Renter-occupied |
| 1-Person Household | 186 (26.7%) | 512 (73.4%) |
| 2-Person Household | 355 (64.3%) | 197 (35.7%) |
| 3-Person Household | 130 (69.9%) | 56 (30.1%) |
| 4+ Person Household | 283 (47.1%) | 318 (52.9%) |
| Total Housing Units | 954 (46.8%) | 1,083 (53.2%) |
Occupancy by Educational Attainment in Willows
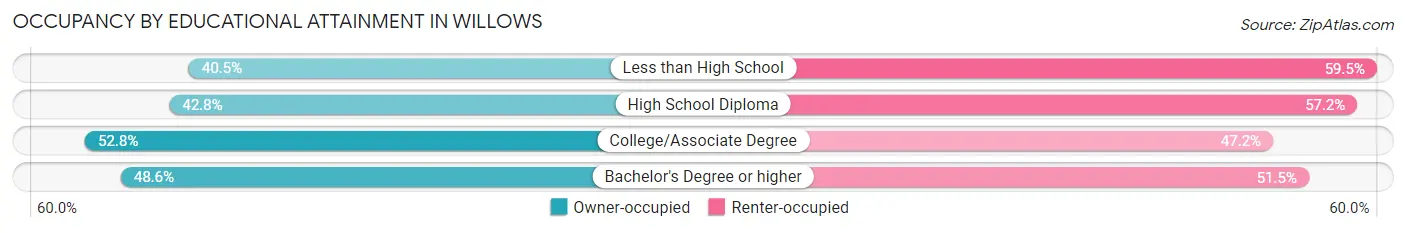
| Household Size | Owner-occupied | Renter-occupied |
| Less than High School | 159 (40.5%) | 234 (59.5%) |
| High School Diploma | 237 (42.8%) | 317 (57.2%) |
| College/Associate Degree | 357 (52.8%) | 319 (47.2%) |
| Bachelor's Degree or higher | 201 (48.5%) | 213 (51.4%) |
Occupancy by Age of Householder in Willows
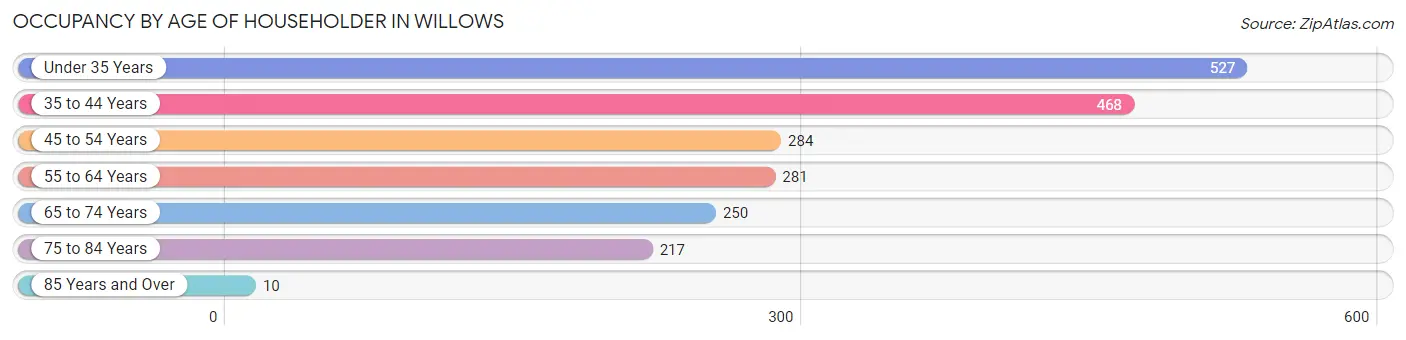
| Age Bracket | # Households | % Households |
| Under 35 Years | 527 | 25.9% |
| 35 to 44 Years | 468 | 23.0% |
| 45 to 54 Years | 284 | 13.9% |
| 55 to 64 Years | 281 | 13.8% |
| 65 to 74 Years | 250 | 12.3% |
| 75 to 84 Years | 217 | 10.6% |
| 85 Years and Over | 10 | 0.5% |
| Total | 2,037 | 100.0% |
Housing Finances in Willows
Median Income by Occupancy in Willows
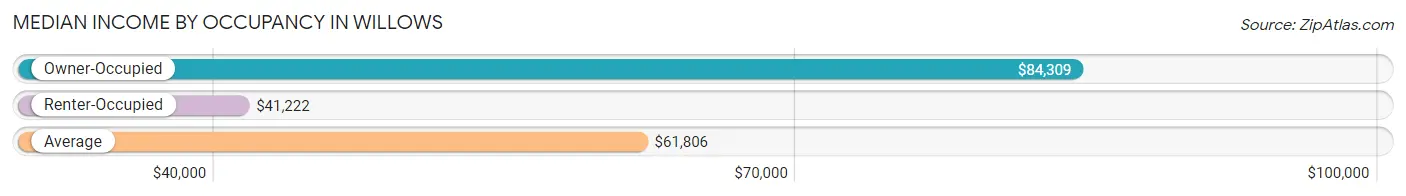
| Occupancy Type | # Households | Median Income |
| Owner-Occupied | 954 (46.8%) | $84,309 |
| Renter-Occupied | 1,083 (53.2%) | $41,222 |
| Average | 2,037 (100.0%) | $61,806 |
Occupancy by Householder Income Bracket in Willows
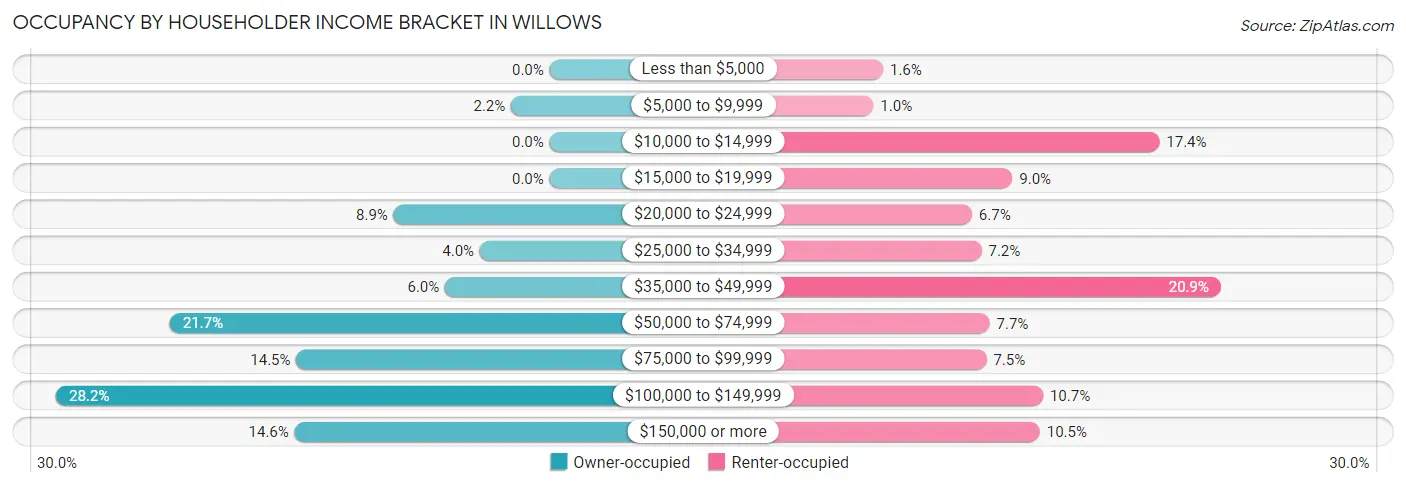
| Income Bracket | Owner-occupied | Renter-occupied |
| Less than $5,000 | 0 (0.0%) | 17 (1.6%) |
| $5,000 to $9,999 | 21 (2.2%) | 11 (1.0%) |
| $10,000 to $14,999 | 0 (0.0%) | 188 (17.4%) |
| $15,000 to $19,999 | 0 (0.0%) | 97 (9.0%) |
| $20,000 to $24,999 | 85 (8.9%) | 72 (6.7%) |
| $25,000 to $34,999 | 38 (4.0%) | 78 (7.2%) |
| $35,000 to $49,999 | 57 (6.0%) | 226 (20.9%) |
| $50,000 to $74,999 | 207 (21.7%) | 83 (7.7%) |
| $75,000 to $99,999 | 138 (14.5%) | 81 (7.5%) |
| $100,000 to $149,999 | 269 (28.2%) | 116 (10.7%) |
| $150,000 or more | 139 (14.6%) | 114 (10.5%) |
| Total | 954 (100.0%) | 1,083 (100.0%) |
Monthly Housing Cost Tiers in Willows
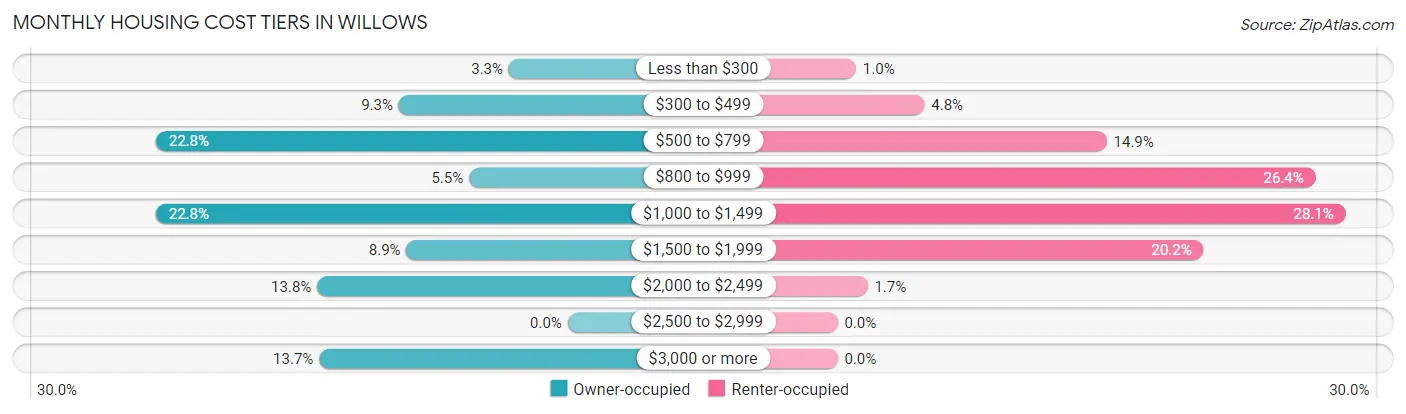
| Monthly Cost | Owner-occupied | Renter-occupied |
| Less than $300 | 31 (3.3%) | 11 (1.0%) |
| $300 to $499 | 89 (9.3%) | 52 (4.8%) |
| $500 to $799 | 217 (22.8%) | 161 (14.9%) |
| $800 to $999 | 52 (5.4%) | 286 (26.4%) |
| $1,000 to $1,499 | 217 (22.8%) | 304 (28.1%) |
| $1,500 to $1,999 | 85 (8.9%) | 219 (20.2%) |
| $2,000 to $2,499 | 132 (13.8%) | 18 (1.7%) |
| $2,500 to $2,999 | 0 (0.0%) | 0 (0.0%) |
| $3,000 or more | 131 (13.7%) | 0 (0.0%) |
| Total | 954 (100.0%) | 1,083 (100.0%) |
Physical Housing Characteristics in Willows
Housing Structures in Willows
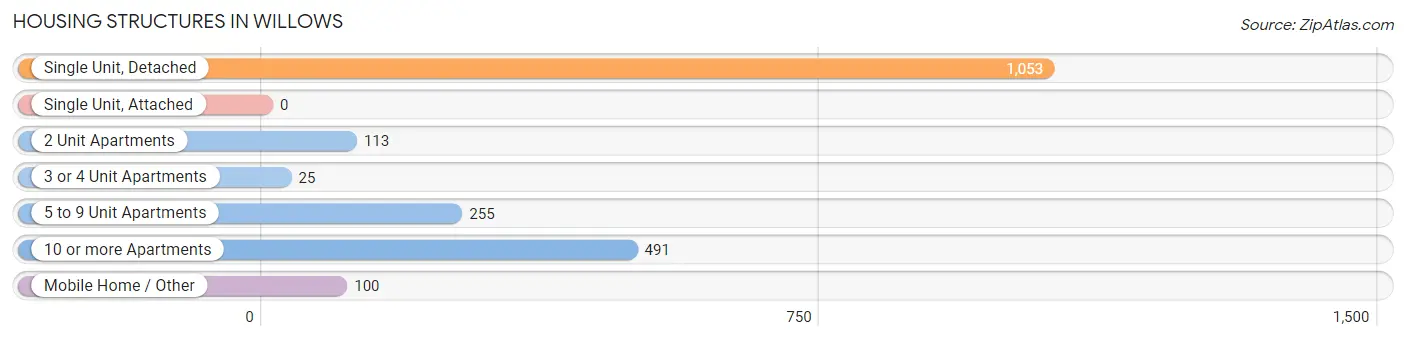
| Structure Type | # Housing Units | % Housing Units |
| Single Unit, Detached | 1,053 | 51.7% |
| Single Unit, Attached | 0 | 0.0% |
| 2 Unit Apartments | 113 | 5.6% |
| 3 or 4 Unit Apartments | 25 | 1.2% |
| 5 to 9 Unit Apartments | 255 | 12.5% |
| 10 or more Apartments | 491 | 24.1% |
| Mobile Home / Other | 100 | 4.9% |
| Total | 2,037 | 100.0% |
Housing Structures by Occupancy in Willows
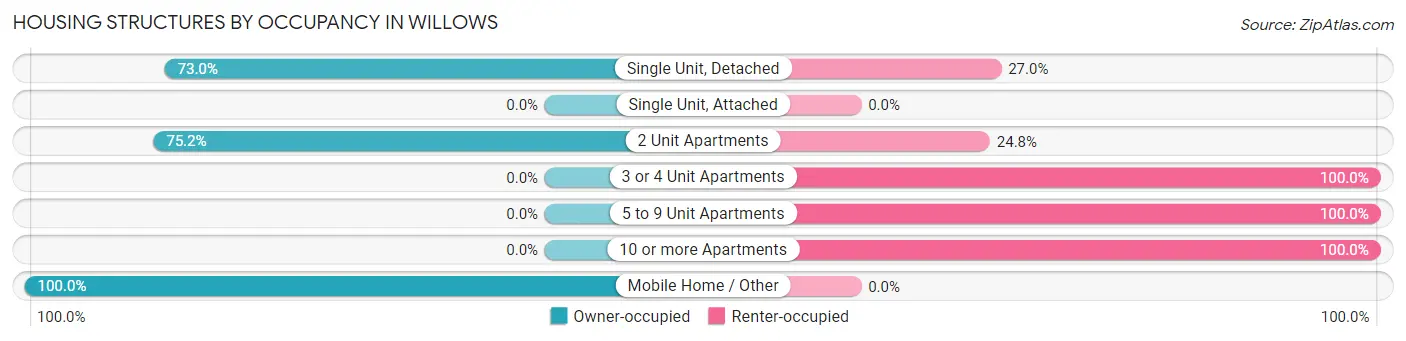
| Structure Type | Owner-occupied | Renter-occupied |
| Single Unit, Detached | 769 (73.0%) | 284 (27.0%) |
| Single Unit, Attached | 0 (0.0%) | 0 (0.0%) |
| 2 Unit Apartments | 85 (75.2%) | 28 (24.8%) |
| 3 or 4 Unit Apartments | 0 (0.0%) | 25 (100.0%) |
| 5 to 9 Unit Apartments | 0 (0.0%) | 255 (100.0%) |
| 10 or more Apartments | 0 (0.0%) | 491 (100.0%) |
| Mobile Home / Other | 100 (100.0%) | 0 (0.0%) |
| Total | 954 (46.8%) | 1,083 (53.2%) |
Housing Structures by Number of Rooms in Willows
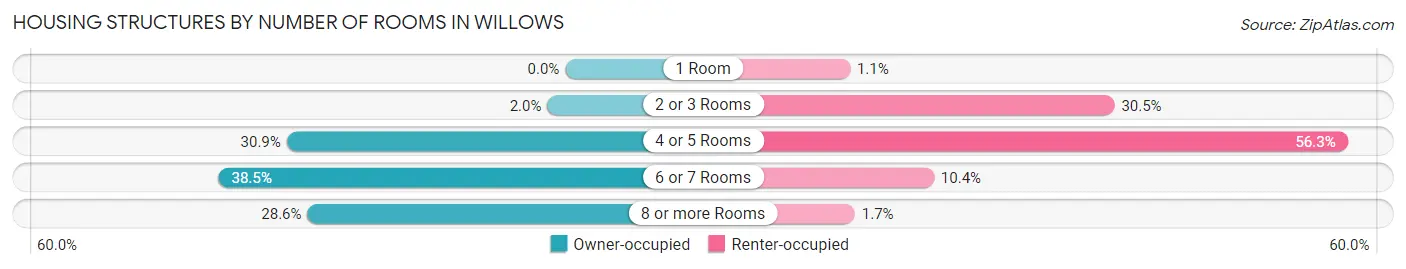
| Number of Rooms | Owner-occupied | Renter-occupied |
| 1 Room | 0 (0.0%) | 12 (1.1%) |
| 2 or 3 Rooms | 19 (2.0%) | 330 (30.5%) |
| 4 or 5 Rooms | 295 (30.9%) | 610 (56.3%) |
| 6 or 7 Rooms | 367 (38.5%) | 113 (10.4%) |
| 8 or more Rooms | 273 (28.6%) | 18 (1.7%) |
| Total | 954 (100.0%) | 1,083 (100.0%) |
Housing Structure by Heating Type in Willows
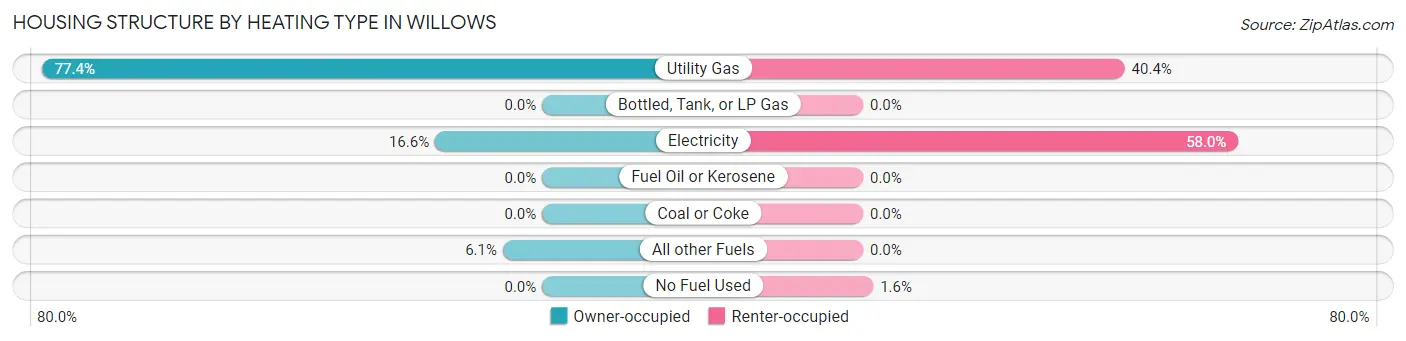
| Heating Type | Owner-occupied | Renter-occupied |
| Utility Gas | 738 (77.4%) | 438 (40.4%) |
| Bottled, Tank, or LP Gas | 0 (0.0%) | 0 (0.0%) |
| Electricity | 158 (16.6%) | 628 (58.0%) |
| Fuel Oil or Kerosene | 0 (0.0%) | 0 (0.0%) |
| Coal or Coke | 0 (0.0%) | 0 (0.0%) |
| All other Fuels | 58 (6.1%) | 0 (0.0%) |
| No Fuel Used | 0 (0.0%) | 17 (1.6%) |
| Total | 954 (100.0%) | 1,083 (100.0%) |
Household Vehicle Usage in Willows
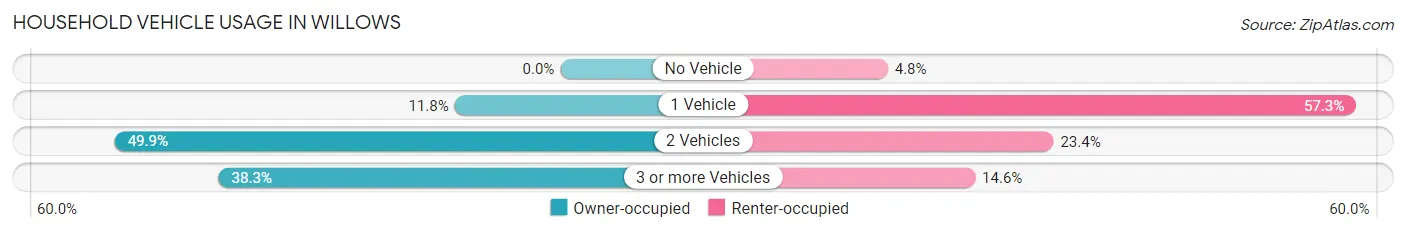
| Vehicles per Household | Owner-occupied | Renter-occupied |
| No Vehicle | 0 (0.0%) | 52 (4.8%) |
| 1 Vehicle | 113 (11.8%) | 620 (57.3%) |
| 2 Vehicles | 476 (49.9%) | 253 (23.4%) |
| 3 or more Vehicles | 365 (38.3%) | 158 (14.6%) |
| Total | 954 (100.0%) | 1,083 (100.0%) |
Real Estate & Mortgages in Willows
Real Estate and Mortgage Overview in Willows
| Characteristic | Without Mortgage | With Mortgage |
| Housing Units | 465 | 489 |
| Median Property Value | $253,100 | $262,700 |
| Median Household Income | $80,982 | $120 |
| Monthly Housing Costs | $618 | $40 |
| Real Estate Taxes | $1,729 | $0 |
Property Value by Mortgage Status in Willows
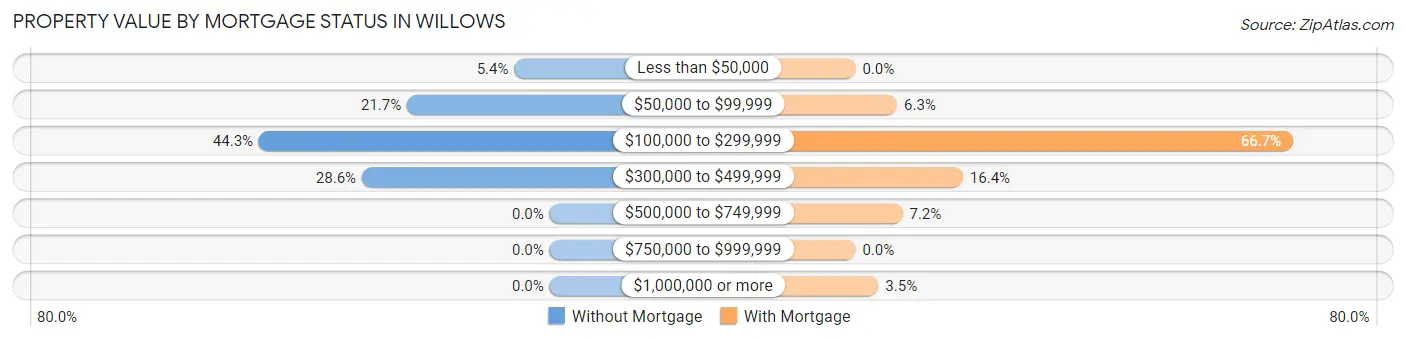
| Property Value | Without Mortgage | With Mortgage |
| Less than $50,000 | 25 (5.4%) | 0 (0.0%) |
| $50,000 to $99,999 | 101 (21.7%) | 31 (6.3%) |
| $100,000 to $299,999 | 206 (44.3%) | 326 (66.7%) |
| $300,000 to $499,999 | 133 (28.6%) | 80 (16.4%) |
| $500,000 to $749,999 | 0 (0.0%) | 35 (7.2%) |
| $750,000 to $999,999 | 0 (0.0%) | 0 (0.0%) |
| $1,000,000 or more | 0 (0.0%) | 17 (3.5%) |
| Total | 465 (100.0%) | 489 (100.0%) |
Household Income by Mortgage Status in Willows
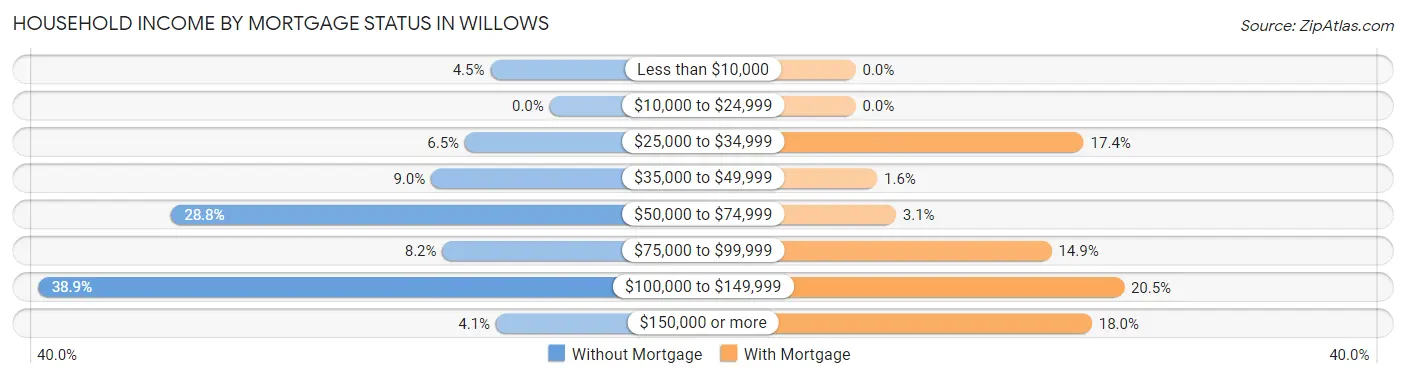
| Household Income | Without Mortgage | With Mortgage |
| Less than $10,000 | 21 (4.5%) | 0 (0.0%) |
| $10,000 to $24,999 | 0 (0.0%) | 0 (0.0%) |
| $25,000 to $34,999 | 30 (6.5%) | 85 (17.4%) |
| $35,000 to $49,999 | 42 (9.0%) | 8 (1.6%) |
| $50,000 to $74,999 | 134 (28.8%) | 15 (3.1%) |
| $75,000 to $99,999 | 38 (8.2%) | 73 (14.9%) |
| $100,000 to $149,999 | 181 (38.9%) | 100 (20.4%) |
| $150,000 or more | 19 (4.1%) | 88 (18.0%) |
| Total | 465 (100.0%) | 489 (100.0%) |
Property Value to Household Income Ratio in Willows
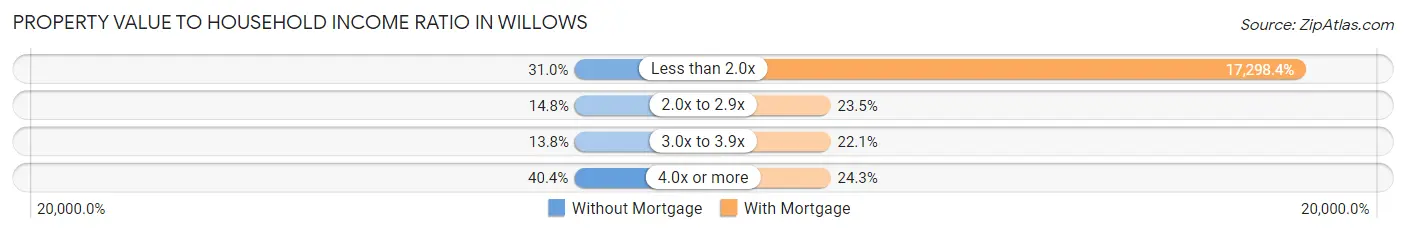
| Value-to-Income Ratio | Without Mortgage | With Mortgage |
| Less than 2.0x | 144 (31.0%) | 84,589 (17,298.4%) |
| 2.0x to 2.9x | 69 (14.8%) | 115 (23.5%) |
| 3.0x to 3.9x | 64 (13.8%) | 108 (22.1%) |
| 4.0x or more | 188 (40.4%) | 119 (24.3%) |
| Total | 465 (100.0%) | 489 (100.0%) |
Real Estate Taxes by Mortgage Status in Willows
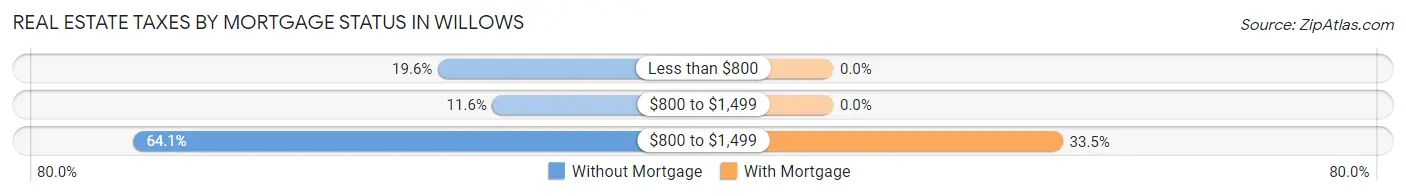
| Property Taxes | Without Mortgage | With Mortgage |
| Less than $800 | 91 (19.6%) | 0 (0.0%) |
| $800 to $1,499 | 54 (11.6%) | 0 (0.0%) |
| $800 to $1,499 | 298 (64.1%) | 164 (33.5%) |
| Total | 465 (100.0%) | 489 (100.0%) |
Health & Disability in Willows
Health Insurance Coverage by Age in Willows
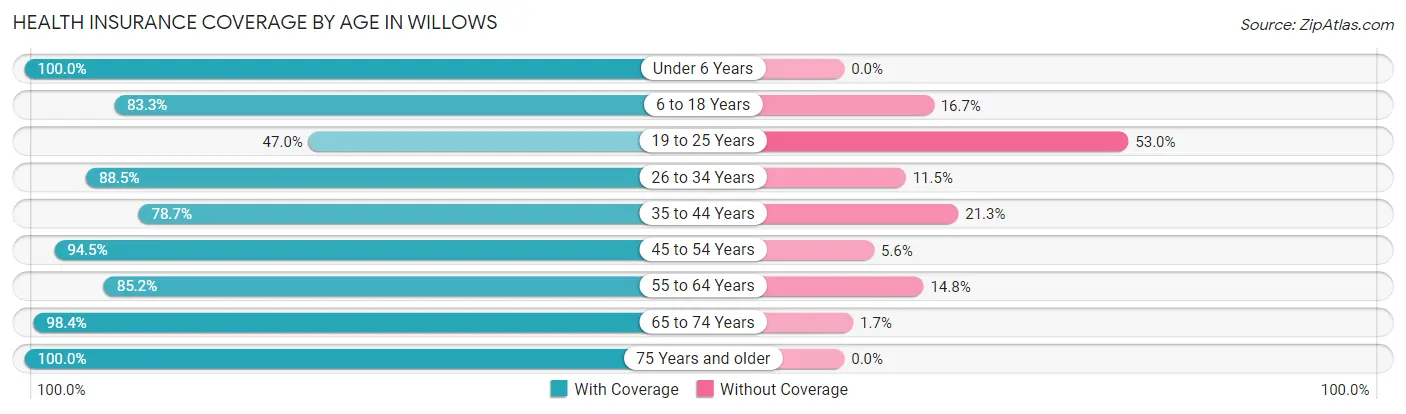
| Age Bracket | With Coverage | Without Coverage |
| Under 6 Years | 633 (100.0%) | 0 (0.0%) |
| 6 to 18 Years | 1,250 (83.3%) | 250 (16.7%) |
| 19 to 25 Years | 103 (47.0%) | 116 (53.0%) |
| 26 to 34 Years | 935 (88.5%) | 121 (11.5%) |
| 35 to 44 Years | 589 (78.7%) | 159 (21.3%) |
| 45 to 54 Years | 528 (94.5%) | 31 (5.6%) |
| 55 to 64 Years | 473 (85.2%) | 82 (14.8%) |
| 65 to 74 Years | 416 (98.4%) | 7 (1.7%) |
| 75 Years and older | 366 (100.0%) | 0 (0.0%) |
| Total | 5,293 (87.4%) | 766 (12.6%) |
Health Insurance Coverage by Citizenship Status in Willows
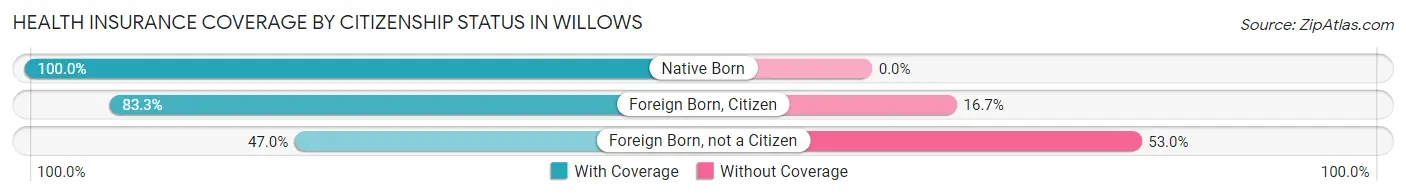
| Citizenship Status | With Coverage | Without Coverage |
| Native Born | 633 (100.0%) | 0 (0.0%) |
| Foreign Born, Citizen | 1,250 (83.3%) | 250 (16.7%) |
| Foreign Born, not a Citizen | 103 (47.0%) | 116 (53.0%) |
Health Insurance Coverage by Household Income in Willows
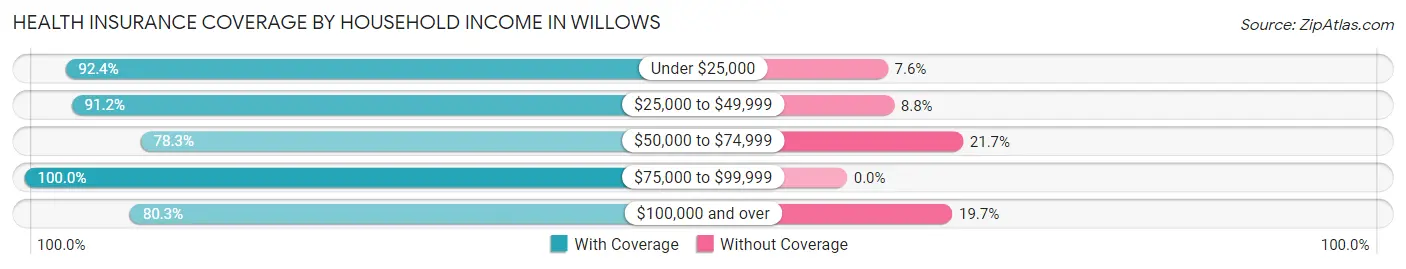
| Household Income | With Coverage | Without Coverage |
| Under $25,000 | 1,512 (92.4%) | 125 (7.6%) |
| $25,000 to $49,999 | 724 (91.2%) | 70 (8.8%) |
| $50,000 to $74,999 | 619 (78.3%) | 172 (21.7%) |
| $75,000 to $99,999 | 835 (100.0%) | 0 (0.0%) |
| $100,000 and over | 1,596 (80.3%) | 392 (19.7%) |
Public vs Private Health Insurance Coverage by Age in Willows
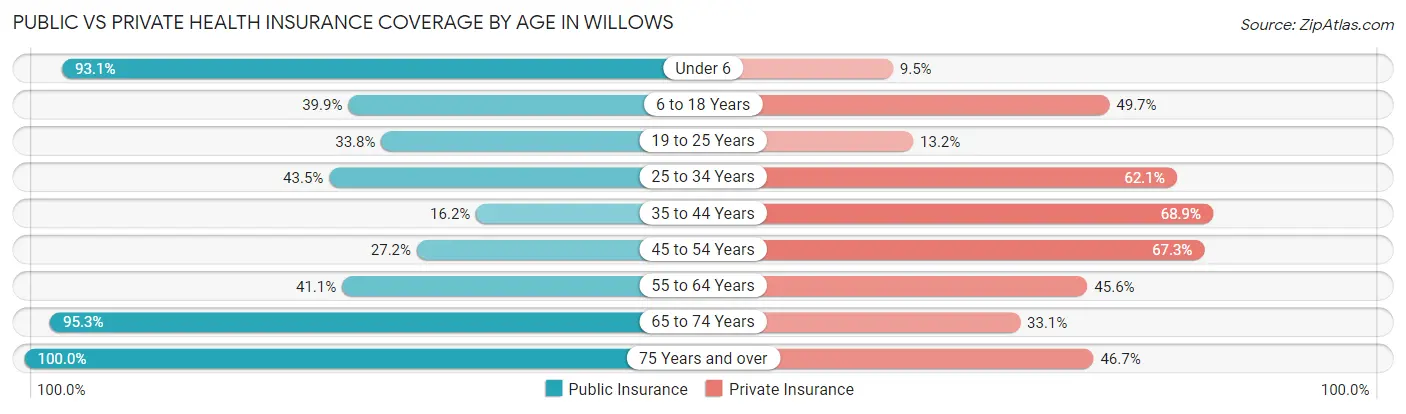
| Age Bracket | Public Insurance | Private Insurance |
| Under 6 | 589 (93.0%) | 60 (9.5%) |
| 6 to 18 Years | 599 (39.9%) | 745 (49.7%) |
| 19 to 25 Years | 74 (33.8%) | 29 (13.2%) |
| 25 to 34 Years | 459 (43.5%) | 656 (62.1%) |
| 35 to 44 Years | 121 (16.2%) | 515 (68.9%) |
| 45 to 54 Years | 152 (27.2%) | 376 (67.3%) |
| 55 to 64 Years | 228 (41.1%) | 253 (45.6%) |
| 65 to 74 Years | 403 (95.3%) | 140 (33.1%) |
| 75 Years and over | 366 (100.0%) | 171 (46.7%) |
| Total | 2,991 (49.4%) | 2,945 (48.6%) |
Disability Status by Sex by Age in Willows
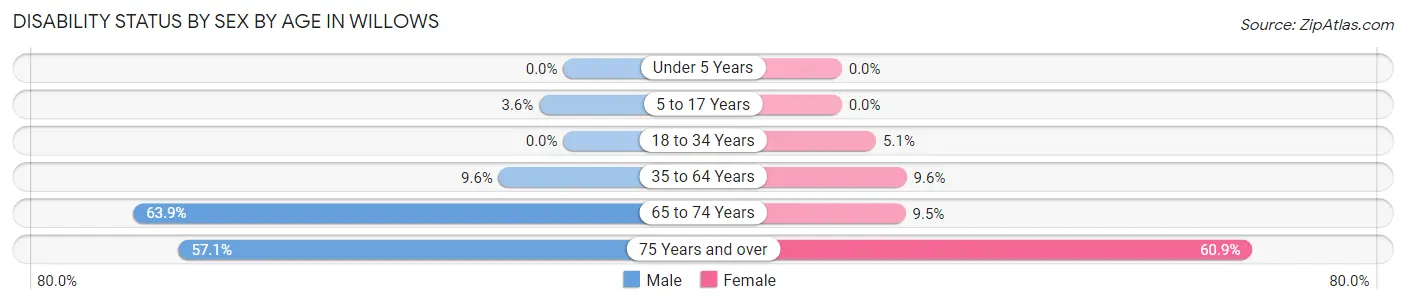
| Age Bracket | Male | Female |
| Under 5 Years | 0 (0.0%) | 0 (0.0%) |
| 5 to 17 Years | 27 (3.6%) | 0 (0.0%) |
| 18 to 34 Years | 0 (0.0%) | 32 (5.1%) |
| 35 to 64 Years | 89 (9.6%) | 90 (9.6%) |
| 65 to 74 Years | 122 (63.9%) | 22 (9.5%) |
| 75 Years and over | 76 (57.1%) | 142 (60.9%) |
Disability Class by Sex by Age in Willows
Disability Class: Hearing Difficulty
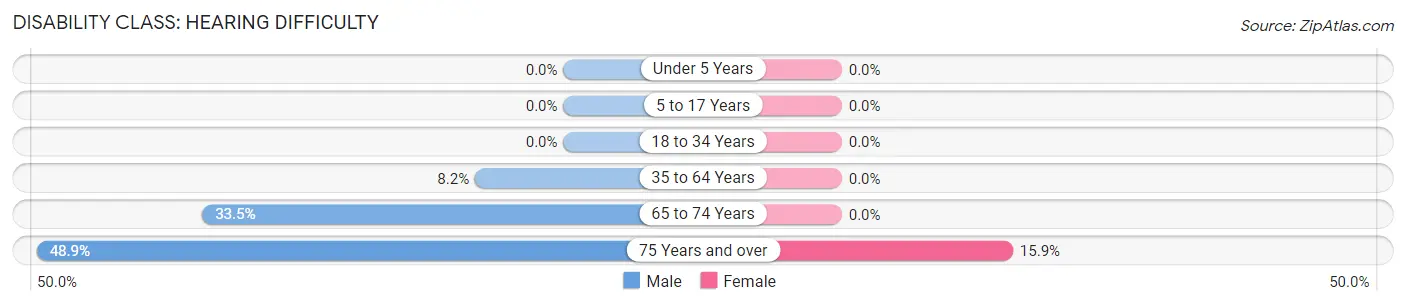
| Age Bracket | Male | Female |
| Under 5 Years | 0 (0.0%) | 0 (0.0%) |
| 5 to 17 Years | 0 (0.0%) | 0 (0.0%) |
| 18 to 34 Years | 0 (0.0%) | 0 (0.0%) |
| 35 to 64 Years | 76 (8.2%) | 0 (0.0%) |
| 65 to 74 Years | 64 (33.5%) | 0 (0.0%) |
| 75 Years and over | 65 (48.9%) | 37 (15.9%) |
Disability Class: Vision Difficulty
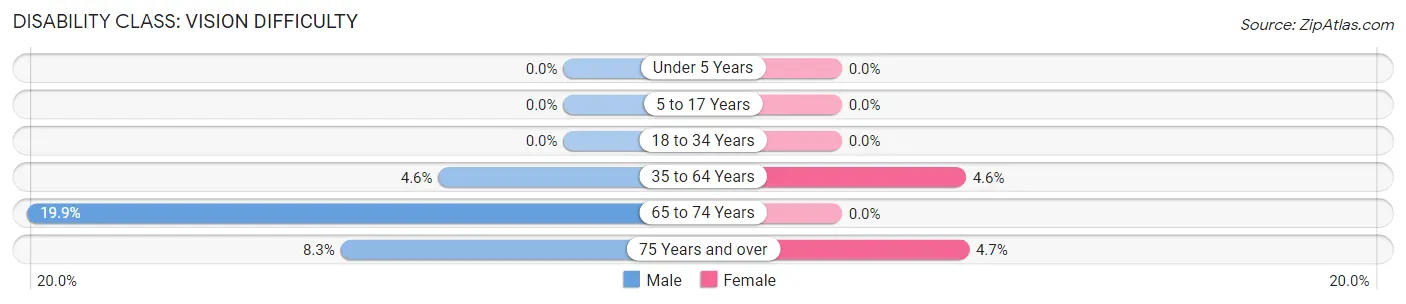
| Age Bracket | Male | Female |
| Under 5 Years | 0 (0.0%) | 0 (0.0%) |
| 5 to 17 Years | 0 (0.0%) | 0 (0.0%) |
| 18 to 34 Years | 0 (0.0%) | 0 (0.0%) |
| 35 to 64 Years | 43 (4.6%) | 43 (4.6%) |
| 65 to 74 Years | 38 (19.9%) | 0 (0.0%) |
| 75 Years and over | 11 (8.3%) | 11 (4.7%) |
Disability Class: Cognitive Difficulty
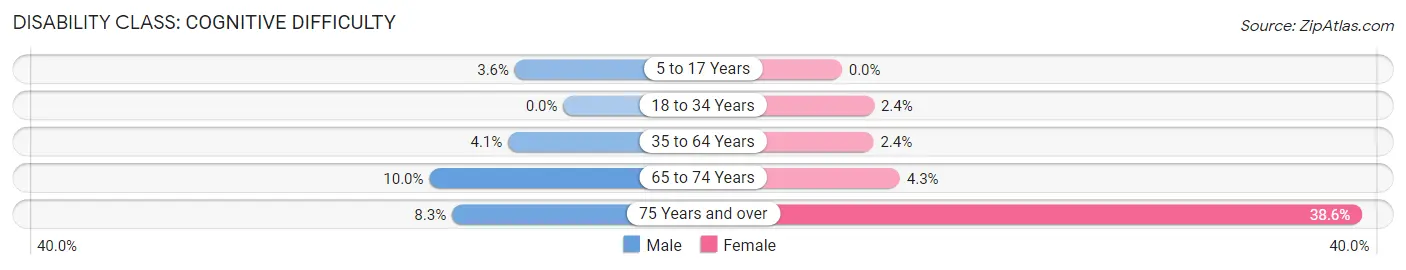
| Age Bracket | Male | Female |
| 5 to 17 Years | 27 (3.6%) | 0 (0.0%) |
| 18 to 34 Years | 0 (0.0%) | 15 (2.4%) |
| 35 to 64 Years | 38 (4.1%) | 22 (2.4%) |
| 65 to 74 Years | 19 (10.0%) | 10 (4.3%) |
| 75 Years and over | 11 (8.3%) | 90 (38.6%) |
Disability Class: Ambulatory Difficulty
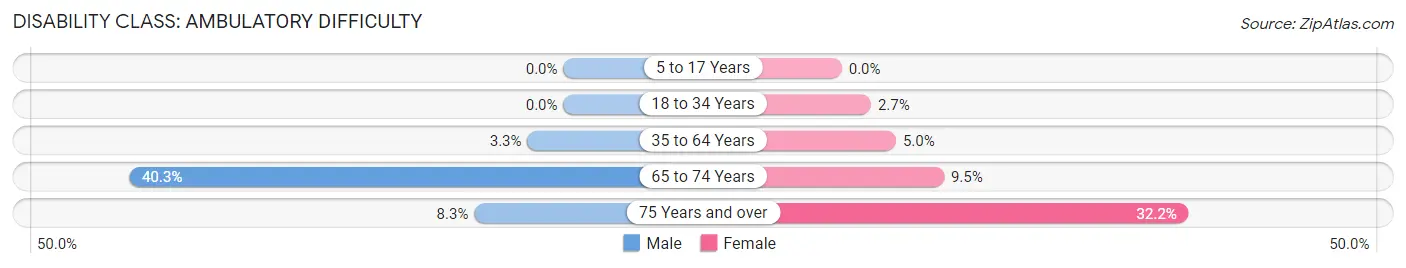
| Age Bracket | Male | Female |
| 5 to 17 Years | 0 (0.0%) | 0 (0.0%) |
| 18 to 34 Years | 0 (0.0%) | 17 (2.7%) |
| 35 to 64 Years | 31 (3.3%) | 47 (5.0%) |
| 65 to 74 Years | 77 (40.3%) | 22 (9.5%) |
| 75 Years and over | 11 (8.3%) | 75 (32.2%) |
Disability Class: Self-Care Difficulty
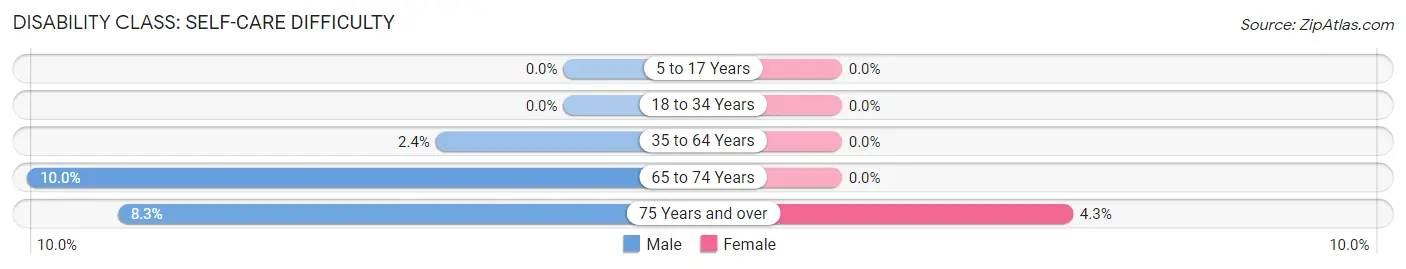
| Age Bracket | Male | Female |
| 5 to 17 Years | 0 (0.0%) | 0 (0.0%) |
| 18 to 34 Years | 0 (0.0%) | 0 (0.0%) |
| 35 to 64 Years | 22 (2.4%) | 0 (0.0%) |
| 65 to 74 Years | 19 (10.0%) | 0 (0.0%) |
| 75 Years and over | 11 (8.3%) | 10 (4.3%) |
Technology Access in Willows
Computing Device Access in Willows
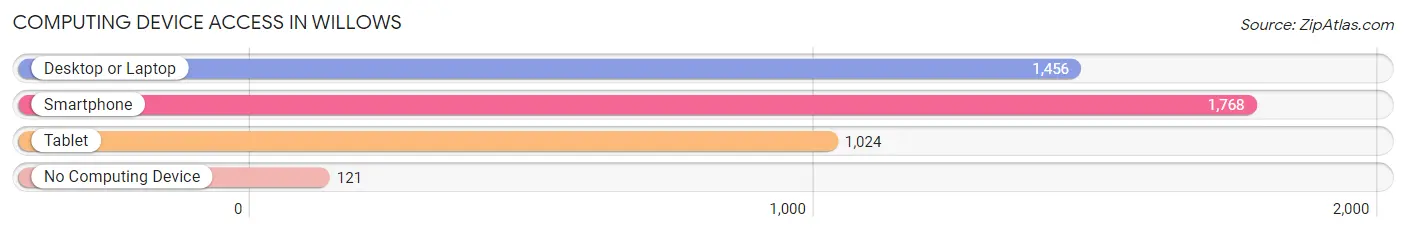
| Device Type | # Households | % Households |
| Desktop or Laptop | 1,456 | 71.5% |
| Smartphone | 1,768 | 86.8% |
| Tablet | 1,024 | 50.3% |
| No Computing Device | 121 | 5.9% |
| Total | 2,037 | 100.0% |
Internet Access in Willows
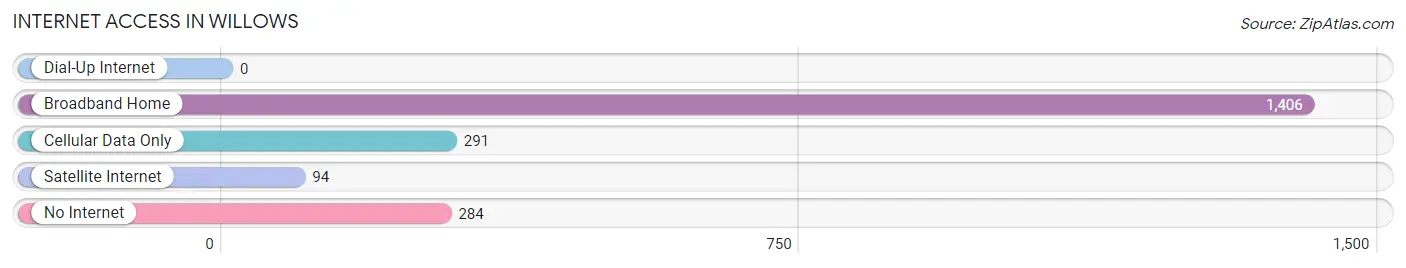
| Internet Type | # Households | % Households |
| Dial-Up Internet | 0 | 0.0% |
| Broadband Home | 1,406 | 69.0% |
| Cellular Data Only | 291 | 14.3% |
| Satellite Internet | 94 | 4.6% |
| No Internet | 284 | 13.9% |
| Total | 2,037 | 100.0% |
Willows Summary
Willows, California is a small city located in Glenn County, California, United States. It is situated in the Sacramento Valley, approximately 40 miles west of Chico and about 120 miles north of Sacramento. The population of Willows was 5,280 at the 2010 census, up from 4,888 at the 2000 census.
History
Willows was founded in 1876 by two brothers, John and George Willows. The brothers had come to California from Ohio in search of gold, but instead found a fertile valley with plenty of water and good soil. They decided to settle in the area and established a trading post, which eventually grew into the city of Willows.
The city was incorporated in 1891 and has since grown to become the largest city in Glenn County. The city is known for its agricultural production, particularly of walnuts, almonds, and prunes.
Geography
Willows is located at 39°30'25" North, 122°10'25" West (39.506944, -122.173611). It is situated in the Sacramento Valley, approximately 40 miles west of Chico and about 120 miles north of Sacramento.
The city has a total area of 2.3 square miles, all of which is land. The city is located on the banks of the Sacramento River, and is surrounded by rolling hills and farmland.
Economy
Willows is a small city with a population of just over 5,000 people. The city is known for its agricultural production, particularly of walnuts, almonds, and prunes. The city is also home to several manufacturing and service businesses, including a lumber mill, a food processing plant, and a printing company.
The city is also home to a number of retail stores, including a Walmart Supercenter, a Home Depot, and a Lowe's. The city also has a number of restaurants, including a McDonald's, a Subway, and a Burger King.
Demographics
As of the 2010 census, the population of Willows was 5,280. The racial makeup of the city was 75.3% White, 0.7% African American, 1.2% Native American, 0.7% Asian, 0.1% Pacific Islander, 19.2% from other races, and 3.0% from two or more races. Hispanic or Latino of any race were 33.2% of the population.
The median income for a household in the city was $35,938, and the median income for a family was $41,944. The per capita income for the city was $17,845. About 17.2% of families and 20.7% of the population were below the poverty line, including 28.2% of those under age 18 and 8.2% of those age 65 or over.
Common Questions
What is Per Capita Income in Willows?
Per Capita income in Willows is $26,702.
What is the Median Family Income in Willows?
Median Family Income in Willows is $65,341.
What is the Median Household income in Willows?
Median Household Income in Willows is $61,806.
What is Income or Wage Gap in Willows?
Income or Wage Gap in Willows is 19.2%.
Women in Willows earn 80.8 cents for every dollar earned by a man.
What is Inequality or Gini Index in Willows?
Inequality or Gini Index in Willows is 0.42.
What is the Total Population of Willows?
Total Population of Willows is 6,201.
What is the Total Male Population of Willows?
Total Male Population of Willows is 3,420.
What is the Total Female Population of Willows?
Total Female Population of Willows is 2,781.
What is the Ratio of Males per 100 Females in Willows?
There are 122.98 Males per 100 Females in Willows.
What is the Ratio of Females per 100 Males in Willows?
There are 81.32 Females per 100 Males in Willows.
What is the Median Population Age in Willows?
Median Population Age in Willows is 32.6 Years.
What is the Average Family Size in Willows
Average Family Size in Willows is 3.9 People.
What is the Average Household Size in Willows
Average Household Size in Willows is 3.0 People.
How Large is the Labor Force in Willows?
There are 2,830 People in the Labor Forcein in Willows.
What is the Percentage of People in the Labor Force in Willows?
61.6% of People are in the Labor Force in Willows.
What is the Unemployment Rate in Willows?
Unemployment Rate in Willows is 9.2%.