Zip Codes with the Highest Percentage of Population with a Degree in Liberal Arts and History in San Gabriel, CA
RELATED REPORTS & OPTIONS
Liberal Arts and History
San Gabriel
Compare Zip Codes
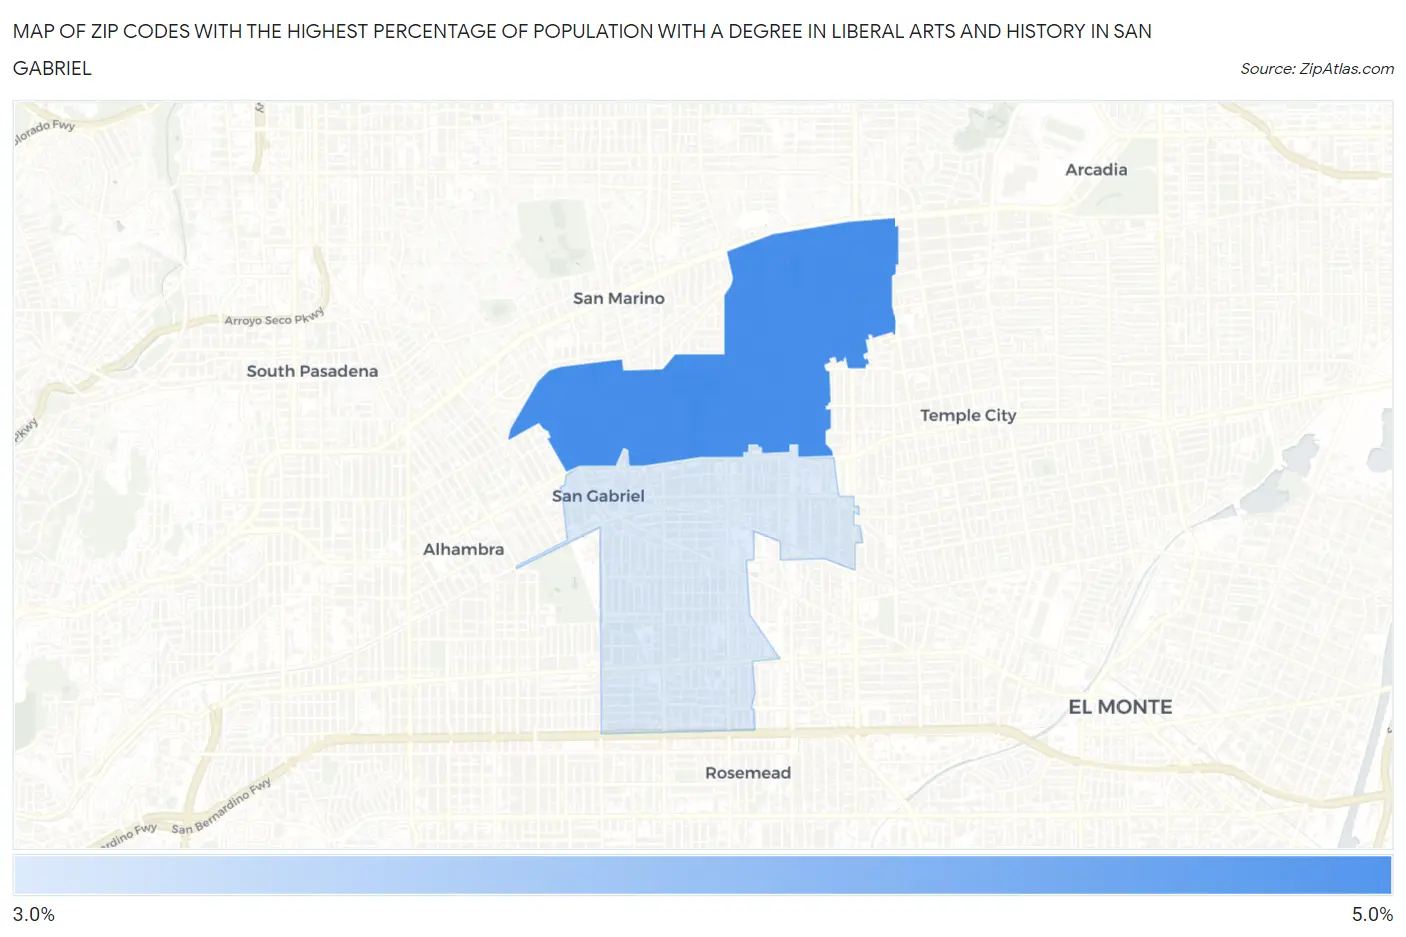
Map of Zip Codes with the Highest Percentage of Population with a Degree in Liberal Arts and History in San Gabriel
3.4%
4.5%
Zip Codes with the Highest Percentage of Population with a Degree in Liberal Arts and History in San Gabriel, CA
| Zip Code | % Graduates | vs State | vs National | |
| 1. | 91775 | 4.5% | 5.5%(-0.973)#1,077 | 4.9%(-0.349)#12,906 |
| 2. | 91776 | 3.4% | 5.5%(-2.12)#1,299 | 4.9%(-1.50)#17,061 |
1
Common Questions
What are the Top Zip Codes with the Highest Percentage of Population with a Degree in Liberal Arts and History in San Gabriel, CA?
Top Zip Codes with the Highest Percentage of Population with a Degree in Liberal Arts and History in San Gabriel, CA are:
What zip code has the Highest Percentage of Population with a Degree in Liberal Arts and History in San Gabriel, CA?
91775 has the Highest Percentage of Population with a Degree in Liberal Arts and History in San Gabriel, CA with 4.5%.
What is the Percentage of Population with a Degree in Liberal Arts and History in San Gabriel, CA?
Percentage of Population with a Degree in Liberal Arts and History in San Gabriel is 3.4%.
What is the Percentage of Population with a Degree in Liberal Arts and History in California?
Percentage of Population with a Degree in Liberal Arts and History in California is 5.5%.
What is the Percentage of Population with a Degree in Liberal Arts and History in the United States?
Percentage of Population with a Degree in Liberal Arts and History in the United States is 4.9%.