Zip Codes with the Highest Percentage of Population with a Degree in Liberal Arts and History in Santa Clarita, CA
RELATED REPORTS & OPTIONS
Liberal Arts and History
Santa Clarita
Compare Zip Codes
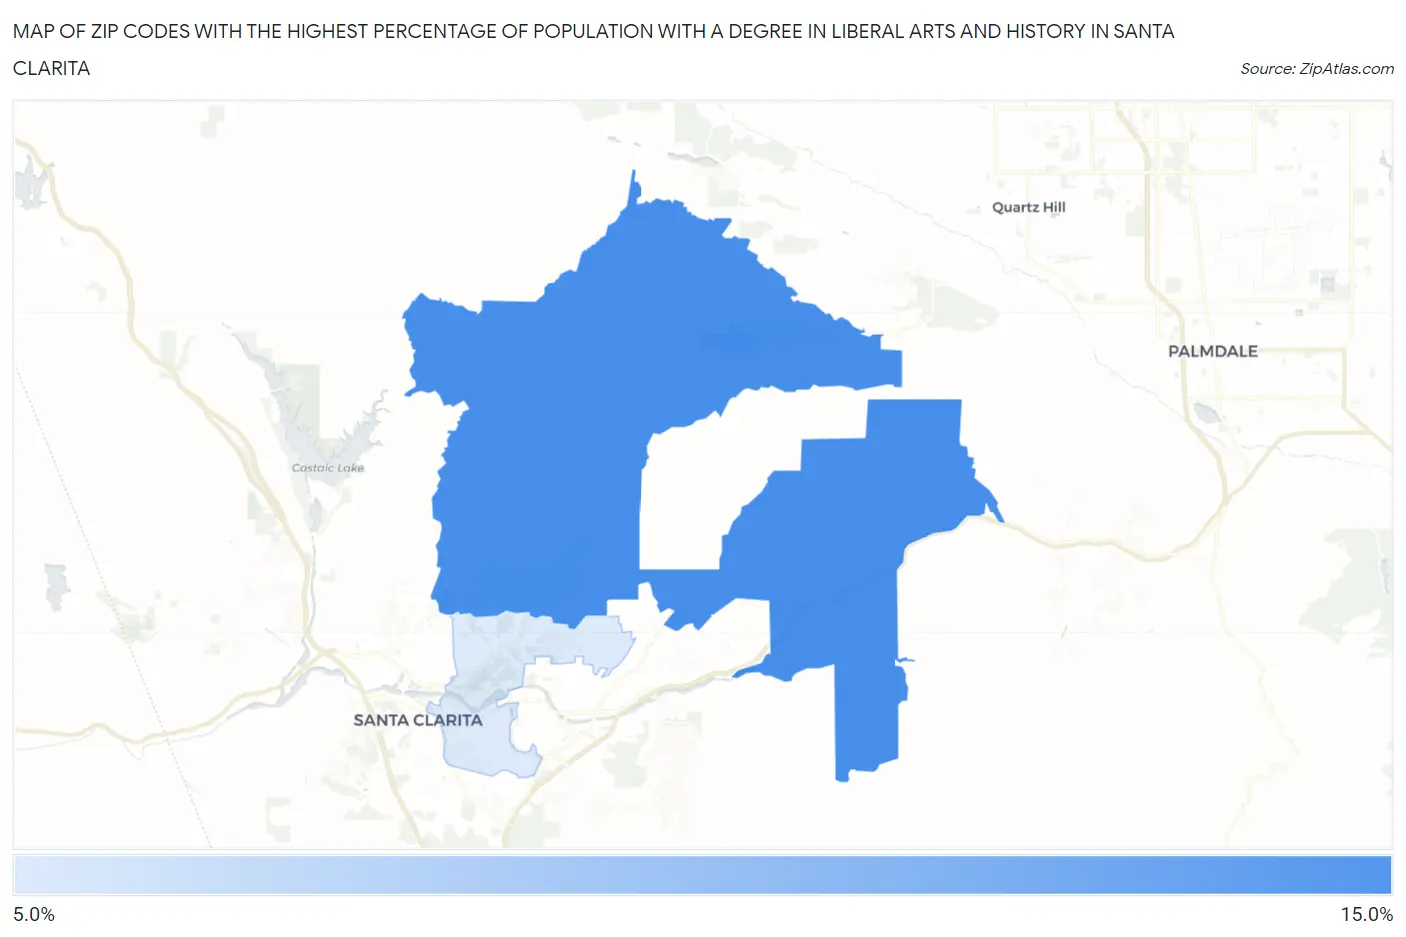
Map of Zip Codes with the Highest Percentage of Population with a Degree in Liberal Arts and History in Santa Clarita
5.4%
10.5%
Zip Codes with the Highest Percentage of Population with a Degree in Liberal Arts and History in Santa Clarita, CA
| Zip Code | % Graduates | vs State | vs National | |
| 1. | 91390 | 10.5% | 5.5%(+4.98)#204 | 4.9%(+5.61)#2,825 |
| 2. | 91350 | 5.4% | 5.5%(-0.126)#891 | 4.9%(+0.498)#10,207 |
1
Common Questions
What are the Top Zip Codes with the Highest Percentage of Population with a Degree in Liberal Arts and History in Santa Clarita, CA?
Top Zip Codes with the Highest Percentage of Population with a Degree in Liberal Arts and History in Santa Clarita, CA are:
What zip code has the Highest Percentage of Population with a Degree in Liberal Arts and History in Santa Clarita, CA?
91390 has the Highest Percentage of Population with a Degree in Liberal Arts and History in Santa Clarita, CA with 10.5%.
What is the Percentage of Population with a Degree in Liberal Arts and History in Santa Clarita, CA?
Percentage of Population with a Degree in Liberal Arts and History in Santa Clarita is 6.8%.
What is the Percentage of Population with a Degree in Liberal Arts and History in California?
Percentage of Population with a Degree in Liberal Arts and History in California is 5.5%.
What is the Percentage of Population with a Degree in Liberal Arts and History in the United States?
Percentage of Population with a Degree in Liberal Arts and History in the United States is 4.9%.