Cities with the Highest Percentage of Population with a Degree in Liberal Arts and History in Washington
RELATED REPORTS & OPTIONS
Liberal Arts and History
Washington
Compare Cities
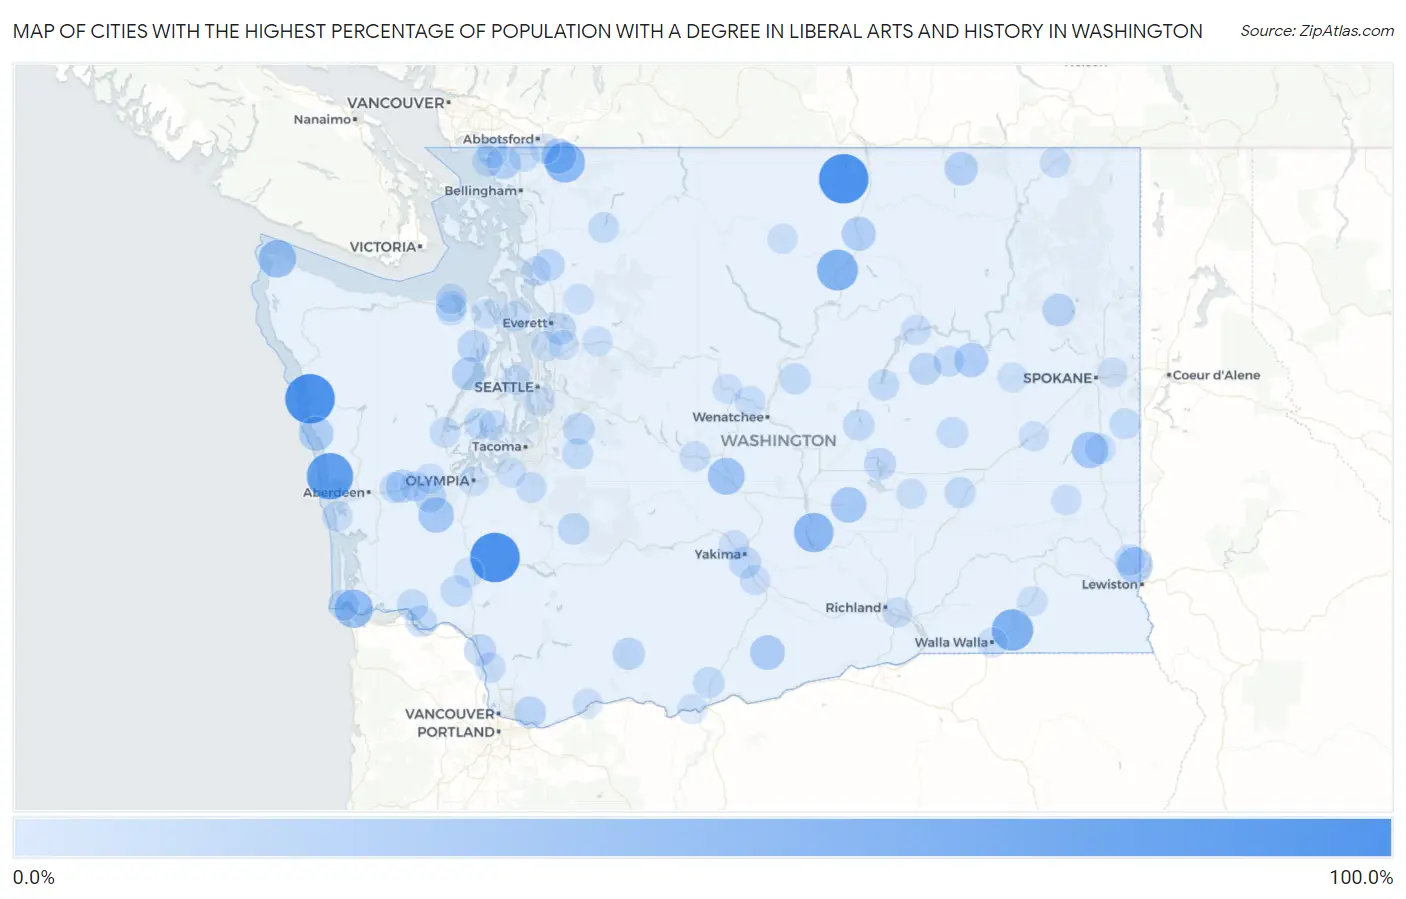
Map of Cities with the Highest Percentage of Population with a Degree in Liberal Arts and History in Washington
0.0%
100.0%
Cities with the Highest Percentage of Population with a Degree in Liberal Arts and History in Washington
| City | % Graduates | vs State | vs National | |
| 1. | Onalaska | 100.0% | 5.1%(+94.9)#1 | 4.9%(+95.1)#9 |
| 2. | Queets | 100.0% | 5.1%(+94.9)#2 | 4.9%(+95.1)#51 |
| 3. | Loomis | 100.0% | 5.1%(+94.9)#3 | 4.9%(+95.1)#54 |
| 4. | Ocean City | 84.6% | 5.1%(+79.5)#4 | 4.9%(+79.7)#100 |
| 5. | Dixie | 61.5% | 5.1%(+56.4)#5 | 4.9%(+56.7)#165 |
| 6. | Malott | 59.3% | 5.1%(+54.1)#6 | 4.9%(+54.4)#182 |
| 7. | Maple Falls | 55.0% | 5.1%(+49.9)#7 | 4.9%(+50.1)#202 |
| 8. | Mattawa | 52.6% | 5.1%(+47.5)#8 | 4.9%(+47.8)#212 |
| 9. | Chinook | 46.7% | 5.1%(+41.5)#9 | 4.9%(+41.8)#294 |
| 10. | Neah Bay | 43.3% | 5.1%(+38.1)#10 | 4.9%(+38.4)#329 |
| 11. | Thorp | 40.0% | 5.1%(+34.9)#11 | 4.9%(+35.1)#385 |
| 12. | Malden | 36.8% | 5.1%(+31.7)#12 | 4.9%(+32.0)#440 |
| 13. | Royal City | 34.1% | 5.1%(+29.0)#13 | 4.9%(+29.2)#506 |
| 14. | Uniontown | 34.0% | 5.1%(+28.9)#14 | 4.9%(+29.2)#508 |
| 15. | Oakville | 33.3% | 5.1%(+28.2)#15 | 4.9%(+28.5)#518 |
| 16. | Peaceful Valley | 30.9% | 5.1%(+25.8)#16 | 4.9%(+26.1)#626 |
| 17. | Bickleton | 30.0% | 5.1%(+24.9)#17 | 4.9%(+25.1)#659 |
| 18. | Taholah | 28.6% | 5.1%(+23.4)#18 | 4.9%(+23.7)#703 |
| 19. | Creston | 27.8% | 5.1%(+22.6)#19 | 4.9%(+22.9)#748 |
| 20. | Riverside | 26.7% | 5.1%(+21.5)#20 | 4.9%(+21.8)#810 |
| 21. | Curlew | 25.0% | 5.1%(+19.9)#21 | 4.9%(+20.1)#914 |
| 22. | Custer | 24.0% | 5.1%(+18.9)#22 | 4.9%(+19.1)#965 |
| 23. | Brinnon | 23.7% | 5.1%(+18.5)#23 | 4.9%(+18.8)#982 |
| 24. | Brady | 23.3% | 5.1%(+18.2)#24 | 4.9%(+18.5)#1,010 |
| 25. | Springdale | 21.1% | 5.1%(+15.9)#25 | 4.9%(+16.2)#1,184 |
| 26. | Quilcene | 19.4% | 5.1%(+14.2)#26 | 4.9%(+14.5)#1,351 |
| 27. | Trout Lake | 19.1% | 5.1%(+13.9)#27 | 4.9%(+14.2)#1,383 |
| 28. | Porter | 19.0% | 5.1%(+13.8)#28 | 4.9%(+14.1)#1,403 |
| 29. | Almira | 18.9% | 5.1%(+13.8)#29 | 4.9%(+14.0)#1,406 |
| 30. | Kalama | 18.1% | 5.1%(+12.9)#30 | 4.9%(+13.2)#1,510 |
| 31. | Fobes Hill | 18.0% | 5.1%(+12.8)#31 | 4.9%(+13.1)#1,519 |
| 32. | Fern Prairie | 17.7% | 5.1%(+12.5)#32 | 4.9%(+12.8)#1,553 |
| 33. | Union Gap | 17.5% | 5.1%(+12.4)#33 | 4.9%(+12.7)#1,570 |
| 34. | Lake Mcmurray | 17.5% | 5.1%(+12.3)#34 | 4.9%(+12.6)#1,580 |
| 35. | Beacon Hill | 17.3% | 5.1%(+12.2)#35 | 4.9%(+12.5)#1,610 |
| 36. | Ravensdale | 17.2% | 5.1%(+12.1)#36 | 4.9%(+12.4)#1,622 |
| 37. | Cascade Valley | 17.2% | 5.1%(+12.0)#37 | 4.9%(+12.3)#1,631 |
| 38. | Ashford | 16.7% | 5.1%(+11.5)#38 | 4.9%(+11.8)#1,701 |
| 39. | East Cathlamet | 15.9% | 5.1%(+10.8)#39 | 4.9%(+11.1)#1,863 |
| 40. | Ryderwood | 15.9% | 5.1%(+10.7)#40 | 4.9%(+11.0)#1,877 |
| 41. | Skamokawa Valley | 15.8% | 5.1%(+10.6)#41 | 4.9%(+10.9)#1,897 |
| 42. | Lakeview | 15.6% | 5.1%(+10.5)#42 | 4.9%(+10.7)#1,927 |
| 43. | Waterville | 15.5% | 5.1%(+10.4)#43 | 4.9%(+10.7)#1,938 |
| 44. | Goldendale | 15.1% | 5.1%(+9.97)#44 | 4.9%(+10.2)#2,026 |
| 45. | Lind | 14.6% | 5.1%(+9.44)#45 | 4.9%(+9.71)#2,136 |
| 46. | Odessa | 14.5% | 5.1%(+9.31)#46 | 4.9%(+9.59)#2,158 |
| 47. | Fairfield | 14.4% | 5.1%(+9.29)#47 | 4.9%(+9.56)#2,166 |
| 48. | Allyn | 14.3% | 5.1%(+9.19)#48 | 4.9%(+9.47)#2,181 |
| 49. | Ilwaco | 14.2% | 5.1%(+9.04)#49 | 4.9%(+9.32)#2,267 |
| 50. | Colton | 14.0% | 5.1%(+8.87)#50 | 4.9%(+9.15)#2,298 |
| 51. | Wilbur | 13.9% | 5.1%(+8.77)#51 | 4.9%(+9.04)#2,327 |
| 52. | Blaine | 13.9% | 5.1%(+8.73)#52 | 4.9%(+9.01)#2,336 |
| 53. | Enumclaw | 13.7% | 5.1%(+8.59)#53 | 4.9%(+8.86)#2,376 |
| 54. | Birch Bay | 13.7% | 5.1%(+8.59)#54 | 4.9%(+8.86)#2,379 |
| 55. | Montesano | 13.7% | 5.1%(+8.54)#55 | 4.9%(+8.82)#2,391 |
| 56. | Coulee City | 13.5% | 5.1%(+8.31)#56 | 4.9%(+8.59)#2,461 |
| 57. | Bell Hill | 13.4% | 5.1%(+8.22)#57 | 4.9%(+8.50)#2,492 |
| 58. | Concrete | 13.2% | 5.1%(+8.06)#58 | 4.9%(+8.34)#2,552 |
| 59. | Sequim | 13.0% | 5.1%(+7.82)#59 | 4.9%(+8.10)#2,622 |
| 60. | Rosalia | 12.7% | 5.1%(+7.53)#60 | 4.9%(+7.80)#2,706 |
| 61. | Cashmere | 12.6% | 5.1%(+7.48)#61 | 4.9%(+7.75)#2,723 |
| 62. | Grayland | 12.2% | 5.1%(+7.03)#62 | 4.9%(+7.30)#2,901 |
| 63. | South Creek | 12.1% | 5.1%(+7.00)#63 | 4.9%(+7.28)#2,908 |
| 64. | Woodland | 12.1% | 5.1%(+7.00)#64 | 4.9%(+7.27)#2,911 |
| 65. | South Cle Elum | 12.1% | 5.1%(+6.95)#65 | 4.9%(+7.22)#2,928 |
| 66. | Skokomish | 11.9% | 5.1%(+6.76)#66 | 4.9%(+7.03)#3,013 |
| 67. | Lynden | 11.7% | 5.1%(+6.55)#67 | 4.9%(+6.82)#3,109 |
| 68. | Jamestown | 11.7% | 5.1%(+6.51)#68 | 4.9%(+6.79)#3,124 |
| 69. | Freeland | 11.7% | 5.1%(+6.51)#69 | 4.9%(+6.78)#3,125 |
| 70. | Sumas | 11.5% | 5.1%(+6.33)#70 | 4.9%(+6.60)#3,192 |
| 71. | Northport | 11.3% | 5.1%(+6.17)#71 | 4.9%(+6.45)#3,262 |
| 72. | Wapato | 11.2% | 5.1%(+6.04)#72 | 4.9%(+6.31)#3,312 |
| 73. | Endicott | 11.1% | 5.1%(+5.96)#73 | 4.9%(+6.24)#3,360 |
| 74. | Lake Ketchum | 11.0% | 5.1%(+5.85)#74 | 4.9%(+6.13)#3,427 |
| 75. | Gleed | 11.0% | 5.1%(+5.81)#75 | 4.9%(+6.09)#3,444 |
| 76. | Grand Coulee | 10.7% | 5.1%(+5.54)#76 | 4.9%(+5.81)#3,585 |
| 77. | West Pasco | 10.7% | 5.1%(+5.53)#77 | 4.9%(+5.81)#3,589 |
| 78. | Elma | 10.5% | 5.1%(+5.39)#78 | 4.9%(+5.67)#3,672 |
| 79. | Mccleary | 10.5% | 5.1%(+5.38)#79 | 4.9%(+5.65)#3,679 |
| 80. | Warden | 10.1% | 5.1%(+4.97)#80 | 4.9%(+5.25)#3,907 |
| 81. | Larch Way | 10.0% | 5.1%(+4.87)#81 | 4.9%(+5.14)#3,959 |
| 82. | Port Hadlock Irondale | 9.9% | 5.1%(+4.76)#82 | 4.9%(+5.04)#4,047 |
| 83. | Boulevard Park | 9.9% | 5.1%(+4.72)#83 | 4.9%(+5.00)#4,067 |
| 84. | Stansberry Lake | 9.8% | 5.1%(+4.68)#84 | 4.9%(+4.96)#4,089 |
| 85. | Davenport | 9.8% | 5.1%(+4.66)#85 | 4.9%(+4.93)#4,101 |
| 86. | Millwood | 9.8% | 5.1%(+4.64)#86 | 4.9%(+4.91)#4,115 |
| 87. | Winthrop | 9.8% | 5.1%(+4.63)#87 | 4.9%(+4.91)#4,120 |
| 88. | Winlock | 9.8% | 5.1%(+4.62)#88 | 4.9%(+4.90)#4,126 |
| 89. | Cathcart | 9.7% | 5.1%(+4.56)#89 | 4.9%(+4.84)#4,165 |
| 90. | Canyon Creek | 9.7% | 5.1%(+4.53)#90 | 4.9%(+4.81)#4,182 |
| 91. | Walla Walla | 9.6% | 5.1%(+4.48)#91 | 4.9%(+4.75)#4,235 |
| 92. | Stevenson | 9.6% | 5.1%(+4.43)#92 | 4.9%(+4.70)#4,273 |
| 93. | Olympia | 9.6% | 5.1%(+4.40)#93 | 4.9%(+4.68)#4,286 |
| 94. | Wishram | 9.5% | 5.1%(+4.38)#94 | 4.9%(+4.65)#4,305 |
| 95. | Bainbridge Island | 9.5% | 5.1%(+4.33)#95 | 4.9%(+4.61)#4,348 |
| 96. | Leavenworth | 9.4% | 5.1%(+4.30)#96 | 4.9%(+4.57)#4,367 |
| 97. | Sultan | 9.4% | 5.1%(+4.20)#97 | 4.9%(+4.48)#4,438 |
| 98. | Sprague | 9.3% | 5.1%(+4.15)#98 | 4.9%(+4.43)#4,477 |
| 99. | Fort Lewis | 9.3% | 5.1%(+4.13)#99 | 4.9%(+4.41)#4,484 |
| 100. | Dayton | 9.3% | 5.1%(+4.11)#100 | 4.9%(+4.38)#4,508 |
Common Questions
What are the Top 10 Cities with the Highest Percentage of Population with a Degree in Liberal Arts and History in Washington?
Top 10 Cities with the Highest Percentage of Population with a Degree in Liberal Arts and History in Washington are:
#1
100.0%
#2
100.0%
#3
100.0%
#4
84.6%
#5
61.5%
#6
59.3%
#7
55.0%
#8
52.6%
#9
46.7%
#10
43.3%
What city has the Highest Percentage of Population with a Degree in Liberal Arts and History in Washington?
Onalaska has the Highest Percentage of Population with a Degree in Liberal Arts and History in Washington with 100.0%.
What is the Percentage of Population with a Degree in Liberal Arts and History in the State of Washington?
Percentage of Population with a Degree in Liberal Arts and History in Washington is 5.1%.
What is the Percentage of Population with a Degree in Liberal Arts and History in the United States?
Percentage of Population with a Degree in Liberal Arts and History in the United States is 4.9%.