Cities with the Highest Percentage of Population with a Degree in Liberal Arts and History in Michigan
RELATED REPORTS & OPTIONS
Liberal Arts and History
Michigan
Compare Cities
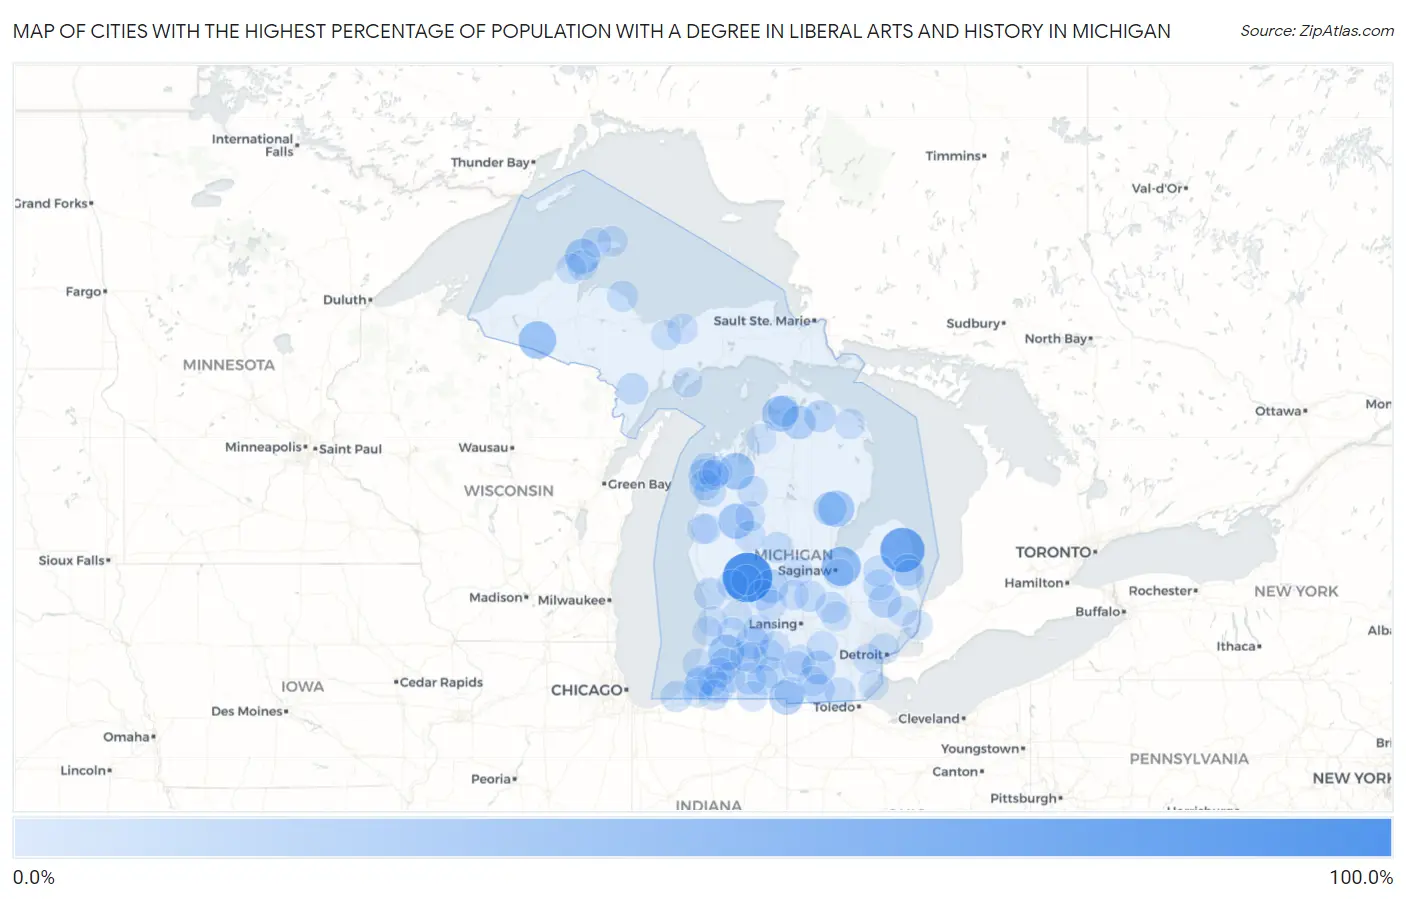
Map of Cities with the Highest Percentage of Population with a Degree in Liberal Arts and History in Michigan
0.0%
100.0%
Cities with the Highest Percentage of Population with a Degree in Liberal Arts and History in Michigan
| City | % Graduates | vs State | vs National | |
| 1. | Pierson | 100.0% | 4.0%(+96.0)#1 | 4.9%(+95.1)#48 |
| 2. | Minden City | 75.0% | 4.0%(+71.0)#2 | 4.9%(+70.1)#118 |
| 3. | Robin Glen Indiantown | 50.0% | 4.0%(+46.0)#3 | 4.9%(+45.1)#227 |
| 4. | Ramsay | 46.2% | 4.0%(+42.2)#4 | 4.9%(+41.3)#297 |
| 5. | Watersmeet | 42.9% | 4.0%(+38.9)#5 | 4.9%(+38.0)#335 |
| 6. | Grawn | 38.7% | 4.0%(+34.7)#6 | 4.9%(+33.8)#402 |
| 7. | Prescott | 36.8% | 4.0%(+32.9)#7 | 4.9%(+32.0)#437 |
| 8. | Gobles | 35.2% | 4.0%(+31.2)#8 | 4.9%(+30.3)#478 |
| 9. | Bay View | 33.8% | 4.0%(+29.8)#9 | 4.9%(+28.9)#513 |
| 10. | Luther | 33.3% | 4.0%(+29.4)#10 | 4.9%(+28.5)#529 |
| 11. | Ahmeek | 32.4% | 4.0%(+28.5)#11 | 4.9%(+27.6)#582 |
| 12. | Montgomery | 28.6% | 4.0%(+24.6)#12 | 4.9%(+23.7)#709 |
| 13. | Fulton | 26.8% | 4.0%(+22.8)#13 | 4.9%(+22.0)#798 |
| 14. | Sheridan | 25.0% | 4.0%(+21.0)#14 | 4.9%(+20.1)#887 |
| 15. | Wolverine | 25.0% | 4.0%(+21.0)#15 | 4.9%(+20.1)#907 |
| 16. | Napoleon | 24.4% | 4.0%(+20.5)#16 | 4.9%(+19.6)#939 |
| 17. | Skidway Lake | 24.1% | 4.0%(+20.2)#17 | 4.9%(+19.3)#955 |
| 18. | Cannonsburg | 23.8% | 4.0%(+19.8)#18 | 4.9%(+18.9)#975 |
| 19. | Imlay City | 23.3% | 4.0%(+19.3)#19 | 4.9%(+18.4)#1,013 |
| 20. | Elberta | 23.3% | 4.0%(+19.3)#20 | 4.9%(+18.4)#1,017 |
| 21. | Paris | 21.2% | 4.0%(+17.2)#21 | 4.9%(+16.3)#1,176 |
| 22. | Delton | 20.7% | 4.0%(+16.7)#22 | 4.9%(+15.8)#1,220 |
| 23. | Onaway | 18.2% | 4.0%(+14.2)#23 | 4.9%(+13.3)#1,478 |
| 24. | Mohawk | 18.2% | 4.0%(+14.2)#24 | 4.9%(+13.3)#1,491 |
| 25. | Bear Lake | 17.4% | 4.0%(+13.4)#25 | 4.9%(+12.5)#1,601 |
| 26. | Fruitport | 17.4% | 4.0%(+13.4)#26 | 4.9%(+12.5)#1,606 |
| 27. | Powers | 16.7% | 4.0%(+12.7)#27 | 4.9%(+11.8)#1,714 |
| 28. | Clayton | 16.7% | 4.0%(+12.7)#28 | 4.9%(+11.8)#1,732 |
| 29. | Paw Paw | 16.2% | 4.0%(+12.2)#29 | 4.9%(+11.3)#1,808 |
| 30. | Cassopolis | 16.2% | 4.0%(+12.2)#30 | 4.9%(+11.3)#1,822 |
| 31. | Carsonville | 16.1% | 4.0%(+12.1)#31 | 4.9%(+11.3)#1,829 |
| 32. | Mendon | 16.1% | 4.0%(+12.1)#32 | 4.9%(+11.2)#1,839 |
| 33. | Crystal Downs Country Club | 15.8% | 4.0%(+11.8)#33 | 4.9%(+10.9)#1,899 |
| 34. | Conway | 15.6% | 4.0%(+11.6)#34 | 4.9%(+10.8)#1,921 |
| 35. | Berrien Springs | 15.5% | 4.0%(+11.5)#35 | 4.9%(+10.6)#1,950 |
| 36. | Brownlee Park | 15.4% | 4.0%(+11.4)#36 | 4.9%(+10.5)#1,963 |
| 37. | Vernon | 15.4% | 4.0%(+11.4)#37 | 4.9%(+10.5)#1,968 |
| 38. | New Buffalo | 15.2% | 4.0%(+11.2)#38 | 4.9%(+10.4)#2,003 |
| 39. | Burlington | 15.0% | 4.0%(+11.0)#39 | 4.9%(+10.1)#2,051 |
| 40. | Eau Claire | 14.8% | 4.0%(+10.9)#40 | 4.9%(+9.97)#2,076 |
| 41. | Weidman | 14.7% | 4.0%(+10.7)#41 | 4.9%(+9.83)#2,103 |
| 42. | Elsie | 14.6% | 4.0%(+10.6)#42 | 4.9%(+9.71)#2,131 |
| 43. | Highland Park | 14.4% | 4.0%(+10.4)#43 | 4.9%(+9.52)#2,176 |
| 44. | Kingston | 14.3% | 4.0%(+10.3)#44 | 4.9%(+9.41)#2,211 |
| 45. | Big Bay | 14.0% | 4.0%(+10.0)#45 | 4.9%(+9.13)#2,301 |
| 46. | North Branch | 13.7% | 4.0%(+9.72)#46 | 4.9%(+8.83)#2,389 |
| 47. | Arcadia | 13.6% | 4.0%(+9.65)#47 | 4.9%(+8.76)#2,424 |
| 48. | Reading | 12.9% | 4.0%(+8.92)#48 | 4.9%(+8.03)#2,642 |
| 49. | Galesburg | 12.8% | 4.0%(+8.78)#49 | 4.9%(+7.89)#2,680 |
| 50. | Marcellus | 12.6% | 4.0%(+8.62)#50 | 4.9%(+7.73)#2,726 |
| 51. | Hersey | 12.5% | 4.0%(+8.52)#51 | 4.9%(+7.63)#2,771 |
| 52. | Hastings | 12.5% | 4.0%(+8.47)#52 | 4.9%(+7.58)#2,808 |
| 53. | Blissfield | 12.3% | 4.0%(+8.36)#53 | 4.9%(+7.47)#2,840 |
| 54. | Stockbridge | 12.3% | 4.0%(+8.35)#54 | 4.9%(+7.46)#2,844 |
| 55. | Belding | 12.1% | 4.0%(+8.13)#55 | 4.9%(+7.24)#2,922 |
| 56. | Kent City | 11.7% | 4.0%(+7.72)#56 | 4.9%(+6.83)#3,106 |
| 57. | Parma | 11.7% | 4.0%(+7.67)#57 | 4.9%(+6.78)#3,130 |
| 58. | Manton | 11.6% | 4.0%(+7.65)#58 | 4.9%(+6.76)#3,140 |
| 59. | Copper Harbor | 11.6% | 4.0%(+7.65)#59 | 4.9%(+6.76)#3,145 |
| 60. | Lake Linden | 11.6% | 4.0%(+7.59)#60 | 4.9%(+6.70)#3,156 |
| 61. | Applegate | 11.5% | 4.0%(+7.56)#61 | 4.9%(+6.67)#3,174 |
| 62. | Honor | 11.4% | 4.0%(+7.45)#62 | 4.9%(+6.56)#3,215 |
| 63. | Marine City | 11.4% | 4.0%(+7.43)#63 | 4.9%(+6.54)#3,219 |
| 64. | Lake Michigan Beach | 11.1% | 4.0%(+7.16)#64 | 4.9%(+6.27)#3,326 |
| 65. | Scottville | 11.1% | 4.0%(+7.13)#65 | 4.9%(+6.24)#3,337 |
| 66. | Sherwood | 11.1% | 4.0%(+7.13)#66 | 4.9%(+6.24)#3,356 |
| 67. | Posen | 11.1% | 4.0%(+7.13)#67 | 4.9%(+6.24)#3,371 |
| 68. | Concord | 10.9% | 4.0%(+6.96)#68 | 4.9%(+6.07)#3,454 |
| 69. | Decatur | 10.9% | 4.0%(+6.94)#69 | 4.9%(+6.05)#3,472 |
| 70. | Edwardsburg | 10.8% | 4.0%(+6.80)#70 | 4.9%(+5.91)#3,550 |
| 71. | Benzonia | 10.8% | 4.0%(+6.79)#71 | 4.9%(+5.90)#3,554 |
| 72. | Sturgis | 10.7% | 4.0%(+6.67)#72 | 4.9%(+5.78)#3,599 |
| 73. | Cutlerville | 10.6% | 4.0%(+6.62)#73 | 4.9%(+5.73)#3,633 |
| 74. | Munising | 10.6% | 4.0%(+6.59)#74 | 4.9%(+5.70)#3,653 |
| 75. | Ionia | 10.6% | 4.0%(+6.57)#75 | 4.9%(+5.68)#3,662 |
| 76. | Tustin | 10.3% | 4.0%(+6.36)#76 | 4.9%(+5.47)#3,796 |
| 77. | Memphis | 10.3% | 4.0%(+6.34)#77 | 4.9%(+5.45)#3,804 |
| 78. | St Louis | 10.3% | 4.0%(+6.29)#78 | 4.9%(+5.40)#3,820 |
| 79. | Byron | 10.2% | 4.0%(+6.25)#79 | 4.9%(+5.36)#3,851 |
| 80. | Millburg | 10.2% | 4.0%(+6.25)#80 | 4.9%(+5.36)#3,852 |
| 81. | Addison | 10.1% | 4.0%(+6.14)#81 | 4.9%(+5.25)#3,904 |
| 82. | Hancock | 10.1% | 4.0%(+6.12)#82 | 4.9%(+5.24)#3,916 |
| 83. | Maple Rapids | 10.0% | 4.0%(+6.02)#83 | 4.9%(+5.13)#3,976 |
| 84. | Sand Lake | 10.0% | 4.0%(+6.02)#84 | 4.9%(+5.13)#3,987 |
| 85. | Eagle Harbor | 10.0% | 4.0%(+6.02)#85 | 4.9%(+5.13)#4,014 |
| 86. | Chatham | 10.0% | 4.0%(+6.02)#86 | 4.9%(+5.13)#4,017 |
| 87. | Buchanan | 10.0% | 4.0%(+5.97)#87 | 4.9%(+5.08)#4,030 |
| 88. | Central Lake | 9.8% | 4.0%(+5.82)#88 | 4.9%(+4.93)#4,103 |
| 89. | Eastwood | 9.8% | 4.0%(+5.81)#89 | 4.9%(+4.92)#4,113 |
| 90. | Dowagiac | 9.7% | 4.0%(+5.74)#90 | 4.9%(+4.85)#4,161 |
| 91. | Holland | 9.7% | 4.0%(+5.74)#91 | 4.9%(+4.85)#4,162 |
| 92. | Hopkins | 9.7% | 4.0%(+5.73)#92 | 4.9%(+4.84)#4,168 |
| 93. | Douglas | 9.6% | 4.0%(+5.65)#93 | 4.9%(+4.76)#4,228 |
| 94. | Wayne | 9.6% | 4.0%(+5.61)#94 | 4.9%(+4.72)#4,256 |
| 95. | Custer | 9.5% | 4.0%(+5.54)#95 | 4.9%(+4.65)#4,317 |
| 96. | Garden | 9.5% | 4.0%(+5.54)#96 | 4.9%(+4.65)#4,327 |
| 97. | Bellevue | 9.4% | 4.0%(+5.42)#97 | 4.9%(+4.53)#4,397 |
| 98. | Hartland | 9.4% | 4.0%(+5.39)#98 | 4.9%(+4.50)#4,414 |
| 99. | Stony Point | 9.3% | 4.0%(+5.31)#99 | 4.9%(+4.42)#4,481 |
| 100. | Bridgeport | 9.2% | 4.0%(+5.24)#100 | 4.9%(+4.35)#4,541 |
Common Questions
What are the Top 10 Cities with the Highest Percentage of Population with a Degree in Liberal Arts and History in Michigan?
Top 10 Cities with the Highest Percentage of Population with a Degree in Liberal Arts and History in Michigan are:
#1
100.0%
#2
75.0%
#3
50.0%
#4
42.9%
#5
38.7%
#6
36.8%
#7
35.2%
#8
33.8%
#9
33.3%
#10
32.4%
What city has the Highest Percentage of Population with a Degree in Liberal Arts and History in Michigan?
Pierson has the Highest Percentage of Population with a Degree in Liberal Arts and History in Michigan with 100.0%.
What is the Percentage of Population with a Degree in Liberal Arts and History in the State of Michigan?
Percentage of Population with a Degree in Liberal Arts and History in Michigan is 4.0%.
What is the Percentage of Population with a Degree in Liberal Arts and History in the United States?
Percentage of Population with a Degree in Liberal Arts and History in the United States is 4.9%.