Zip Codes with the Highest Percentage of Population with a Degree in Liberal Arts and History in Newport Beach, CA
RELATED REPORTS & OPTIONS
Liberal Arts and History
Newport Beach
Compare Zip Codes
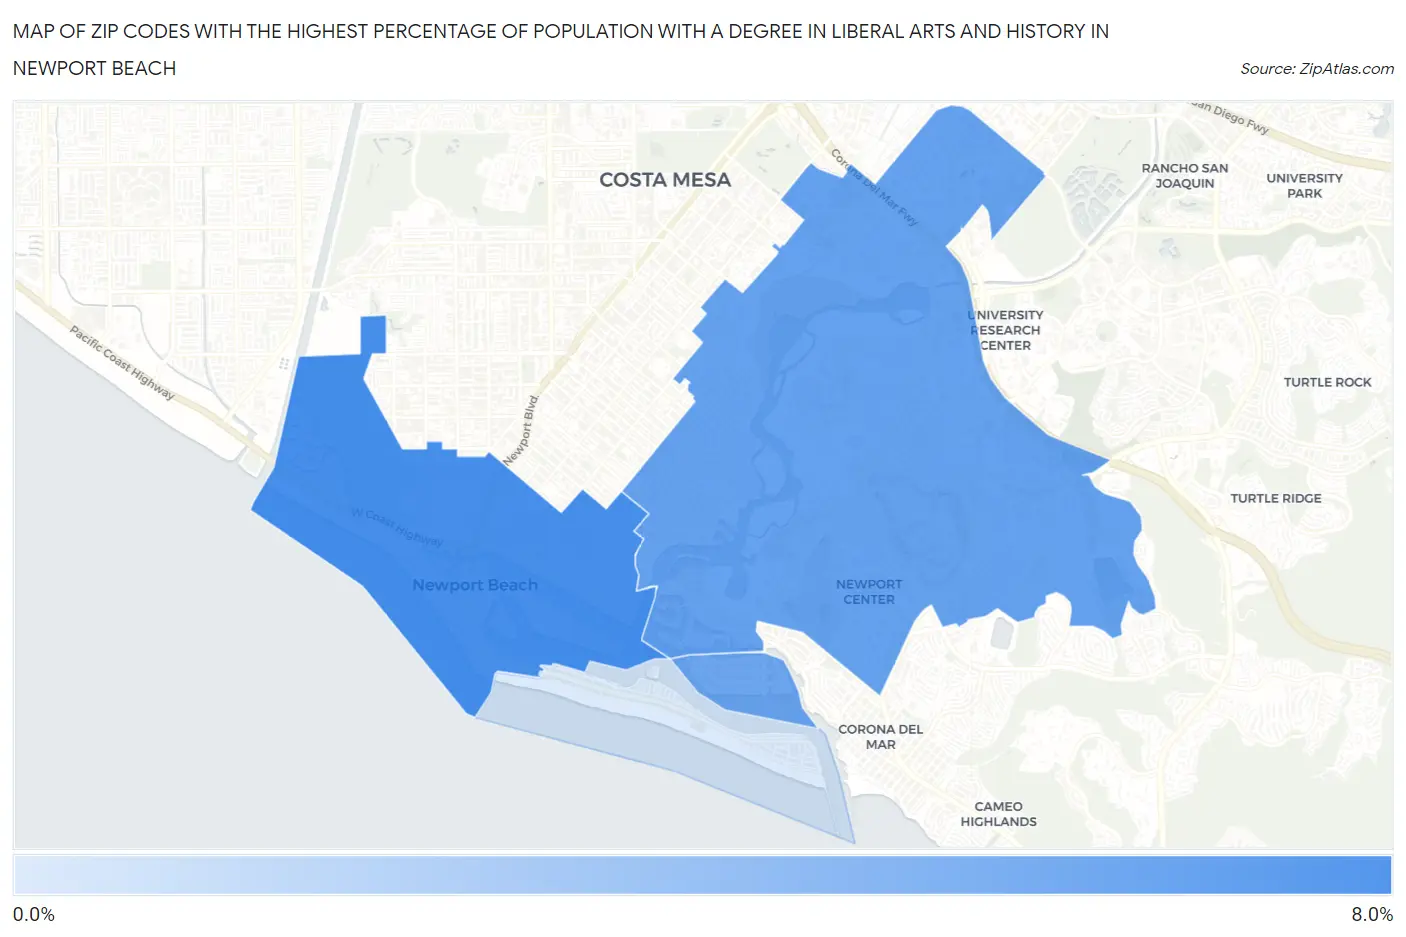
Map of Zip Codes with the Highest Percentage of Population with a Degree in Liberal Arts and History in Newport Beach
0.91%
6.1%
Zip Codes with the Highest Percentage of Population with a Degree in Liberal Arts and History in Newport Beach, CA
| Zip Code | % Graduates | vs State | vs National | |
| 1. | 92663 | 6.1% | 5.5%(+0.637)#707 | 4.9%(+1.26)#8,173 |
| 2. | 92660 | 5.1% | 5.5%(-0.399)#959 | 4.9%(+0.225)#11,043 |
| 3. | 92662 | 4.7% | 5.5%(-0.790)#1,035 | 4.9%(-0.166)#12,301 |
| 4. | 92661 | 0.91% | 5.5%(-4.59)#1,465 | 4.9%(-3.96)#23,538 |
1
Common Questions
What are the Top 3 Zip Codes with the Highest Percentage of Population with a Degree in Liberal Arts and History in Newport Beach, CA?
Top 3 Zip Codes with the Highest Percentage of Population with a Degree in Liberal Arts and History in Newport Beach, CA are:
What zip code has the Highest Percentage of Population with a Degree in Liberal Arts and History in Newport Beach, CA?
92663 has the Highest Percentage of Population with a Degree in Liberal Arts and History in Newport Beach, CA with 6.1%.
What is the Percentage of Population with a Degree in Liberal Arts and History in Newport Beach, CA?
Percentage of Population with a Degree in Liberal Arts and History in Newport Beach is 5.1%.
What is the Percentage of Population with a Degree in Liberal Arts and History in California?
Percentage of Population with a Degree in Liberal Arts and History in California is 5.5%.
What is the Percentage of Population with a Degree in Liberal Arts and History in the United States?
Percentage of Population with a Degree in Liberal Arts and History in the United States is 4.9%.