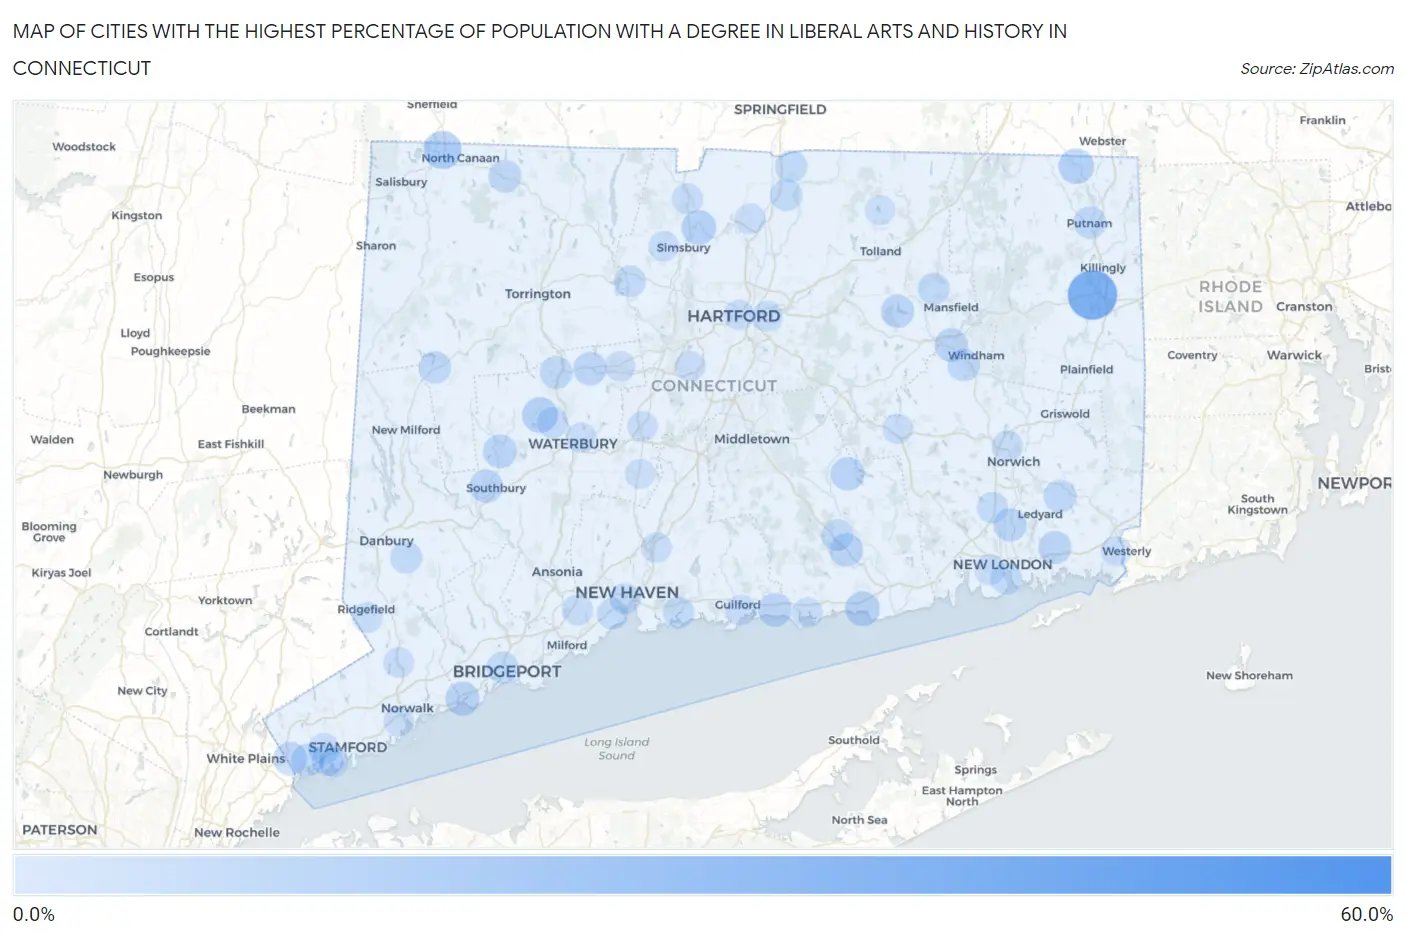
Cities with the Highest Percentage of Population with a Degree in Liberal Arts and History in Connecticut
RELATED REPORTS & OPTIONS
Liberal Arts and History
Connecticut
Compare Cities
Map of Cities with the Highest Percentage of Population with a Degree in Liberal Arts and History in Connecticut
0.0%
60.0%
Cities with the Highest Percentage of Population with a Degree in Liberal Arts and History in Connecticut
| City | % Graduates | vs State | vs National | |
| 1. | Dodgingtown | 53.3% | 5.5%(+47.8)#1 | 4.9%(+48.5)#211 |
| 2. | East Brooklyn | 34.4% | 5.5%(+28.9)#2 | 4.9%(+29.5)#500 |
| 3. | Sail Harbor | 27.6% | 5.5%(+22.1)#3 | 4.9%(+22.7)#759 |
| 4. | Lake Chaffee | 17.1% | 5.5%(+11.6)#4 | 4.9%(+12.2)#1,644 |
| 5. | Canaan | 16.8% | 5.5%(+11.4)#5 | 4.9%(+12.0)#1,679 |
| 6. | Old Hill | 16.6% | 5.5%(+11.1)#6 | 4.9%(+11.7)#1,766 |
| 7. | Bogus Hill | 16.3% | 5.5%(+10.8)#7 | 4.9%(+11.4)#1,796 |
| 8. | Watertown | 13.4% | 5.5%(+7.92)#8 | 4.9%(+8.54)#2,483 |
| 9. | Quinebaug | 13.2% | 5.5%(+7.76)#9 | 4.9%(+8.37)#2,544 |
| 10. | Tariffville | 12.2% | 5.5%(+6.76)#10 | 4.9%(+7.37)#2,871 |
| 11. | Saybrook Manor | 12.2% | 5.5%(+6.71)#11 | 4.9%(+7.32)#2,887 |
| 12. | Southport | 11.3% | 5.5%(+5.83)#12 | 4.9%(+6.44)#3,265 |
| 13. | Cornwall Bridge | 11.3% | 5.5%(+5.80)#13 | 4.9%(+6.42)#3,273 |
| 14. | Stonington Borough | 10.8% | 5.5%(+5.33)#14 | 4.9%(+5.95)#3,525 |
| 15. | Weston | 10.8% | 5.5%(+5.29)#15 | 4.9%(+5.90)#3,552 |
| 16. | Bantam Borough | 10.7% | 5.5%(+5.26)#16 | 4.9%(+5.87)#3,562 |
| 17. | Moodus | 10.6% | 5.5%(+5.16)#17 | 4.9%(+5.78)#3,603 |
| 18. | Madison Center | 10.6% | 5.5%(+5.14)#18 | 4.9%(+5.75)#3,619 |
| 19. | Woodbury Center | 10.6% | 5.5%(+5.13)#19 | 4.9%(+5.75)#3,622 |
| 20. | Deep River Center | 10.5% | 5.5%(+5.06)#20 | 4.9%(+5.67)#3,668 |
| 21. | Glenville | 10.4% | 5.5%(+4.96)#21 | 4.9%(+5.57)#3,739 |
| 22. | Terryville | 10.4% | 5.5%(+4.87)#22 | 4.9%(+5.49)#3,777 |
| 23. | Heritage Village | 10.2% | 5.5%(+4.71)#23 | 4.9%(+5.33)#3,866 |
| 24. | Coventry Lake | 10.0% | 5.5%(+4.54)#24 | 4.9%(+5.15)#3,957 |
| 25. | Old Mystic | 9.9% | 5.5%(+4.41)#25 | 4.9%(+5.03)#4,055 |
| 26. | Candlewood Orchards | 9.9% | 5.5%(+4.41)#26 | 4.9%(+5.02)#4,059 |
| 27. | Willimantic | 9.9% | 5.5%(+4.37)#27 | 4.9%(+4.98)#4,077 |
| 28. | Gales Ferry | 9.8% | 5.5%(+4.31)#28 | 4.9%(+4.93)#4,107 |
| 29. | Staples | 9.8% | 5.5%(+4.28)#29 | 4.9%(+4.89)#4,129 |
| 30. | Greenwich | 9.6% | 5.5%(+4.10)#30 | 4.9%(+4.71)#4,265 |
| 31. | Sacred Heart University | 9.5% | 5.5%(+4.04)#31 | 4.9%(+4.65)#4,299 |
| 32. | Mashantucket | 9.5% | 5.5%(+4.04)#32 | 4.9%(+4.65)#4,330 |
| 33. | Cornwall | 9.5% | 5.5%(+4.04)#33 | 4.9%(+4.65)#4,331 |
| 34. | Norfolk | 9.5% | 5.5%(+4.00)#34 | 4.9%(+4.62)#4,341 |
| 35. | Thomaston | 9.3% | 5.5%(+3.81)#35 | 4.9%(+4.43)#4,470 |
| 36. | Putnam | 9.2% | 5.5%(+3.71)#36 | 4.9%(+4.32)#4,561 |
| 37. | Bridgewater | 9.1% | 5.5%(+3.60)#37 | 4.9%(+4.22)#4,677 |
| 38. | New Preston | 9.0% | 5.5%(+3.51)#38 | 4.9%(+4.13)#4,733 |
| 39. | South Windham | 9.0% | 5.5%(+3.49)#39 | 4.9%(+4.11)#4,746 |
| 40. | Sherwood Manor | 8.6% | 5.5%(+3.13)#40 | 4.9%(+3.75)#5,046 |
| 41. | Ridgebury | 8.6% | 5.5%(+3.08)#41 | 4.9%(+3.70)#5,086 |
| 42. | Southwood Acres | 8.6% | 5.5%(+3.06)#42 | 4.9%(+3.68)#5,092 |
| 43. | Saugatuck | 8.5% | 5.5%(+3.06)#43 | 4.9%(+3.67)#5,096 |
| 44. | Murray | 8.5% | 5.5%(+3.05)#44 | 4.9%(+3.67)#5,099 |
| 45. | Quasset Lake | 8.3% | 5.5%(+2.85)#45 | 4.9%(+3.46)#5,317 |
| 46. | Bridgeport | 8.3% | 5.5%(+2.84)#46 | 4.9%(+3.46)#5,342 |
| 47. | Chester Center | 8.2% | 5.5%(+2.75)#47 | 4.9%(+3.36)#5,421 |
| 48. | Coleytown | 8.2% | 5.5%(+2.74)#48 | 4.9%(+3.36)#5,425 |
| 49. | Bethel | 8.2% | 5.5%(+2.74)#49 | 4.9%(+3.35)#5,431 |
| 50. | Noroton Heights | 8.2% | 5.5%(+2.74)#50 | 4.9%(+3.35)#5,434 |
| 51. | Riverside | 8.2% | 5.5%(+2.68)#51 | 4.9%(+3.29)#5,500 |
| 52. | Storrs | 8.1% | 5.5%(+2.64)#52 | 4.9%(+3.26)#5,537 |
| 53. | Poplar Plains | 8.0% | 5.5%(+2.51)#53 | 4.9%(+3.12)#5,673 |
| 54. | Compo | 7.9% | 5.5%(+2.43)#54 | 4.9%(+3.05)#5,746 |
| 55. | Collinsville | 7.8% | 5.5%(+2.35)#55 | 4.9%(+2.97)#5,830 |
| 56. | Branford Center | 7.6% | 5.5%(+2.13)#56 | 4.9%(+2.75)#6,080 |
| 57. | West Haven | 7.5% | 5.5%(+2.05)#57 | 4.9%(+2.66)#6,179 |
| 58. | New London | 7.5% | 5.5%(+2.04)#58 | 4.9%(+2.66)#6,182 |
| 59. | Oakville | 7.5% | 5.5%(+1.98)#59 | 4.9%(+2.60)#6,236 |
| 60. | Stepney | 7.3% | 5.5%(+1.82)#60 | 4.9%(+2.44)#6,455 |
| 61. | Oxoboxo River | 7.3% | 5.5%(+1.82)#61 | 4.9%(+2.43)#6,459 |
| 62. | Rock Ridge | 7.3% | 5.5%(+1.81)#62 | 4.9%(+2.42)#6,472 |
| 63. | New Haven | 7.1% | 5.5%(+1.65)#63 | 4.9%(+2.27)#6,699 |
| 64. | Norwich | 7.1% | 5.5%(+1.61)#64 | 4.9%(+2.22)#6,749 |
| 65. | Cos Cob | 7.1% | 5.5%(+1.61)#65 | 4.9%(+2.22)#6,750 |
| 66. | Salmon Brook | 7.0% | 5.5%(+1.55)#66 | 4.9%(+2.16)#6,830 |
| 67. | Oronoque | 6.8% | 5.5%(+1.36)#67 | 4.9%(+1.98)#7,093 |
| 68. | Naugatuck Borough | 6.6% | 5.5%(+1.14)#68 | 4.9%(+1.75)#7,418 |
| 69. | Orange | 6.5% | 5.5%(+0.976)#69 | 4.9%(+1.59)#7,636 |
| 70. | East Hartford | 6.5% | 5.5%(+0.970)#70 | 4.9%(+1.59)#7,647 |
| 71. | Windsor Locks | 6.4% | 5.5%(+0.935)#71 | 4.9%(+1.55)#7,709 |
| 72. | Guilford Center | 6.4% | 5.5%(+0.893)#72 | 4.9%(+1.51)#7,776 |
| 73. | Wilton Center | 6.3% | 5.5%(+0.794)#73 | 4.9%(+1.41)#7,923 |
| 74. | Fenwick Borough | 6.2% | 5.5%(+0.762)#74 | 4.9%(+1.38)#8,010 |
| 75. | Tokeneke | 6.2% | 5.5%(+0.754)#75 | 4.9%(+1.37)#8,017 |
| 76. | Daniels Farm | 6.2% | 5.5%(+0.754)#76 | 4.9%(+1.37)#8,018 |
| 77. | Ridgefield | 6.2% | 5.5%(+0.678)#77 | 4.9%(+1.29)#8,127 |
| 78. | Hartford | 6.2% | 5.5%(+0.674)#78 | 4.9%(+1.29)#8,133 |
| 79. | Lordship | 6.2% | 5.5%(+0.672)#79 | 4.9%(+1.29)#8,136 |
| 80. | Stratford Downtown | 6.1% | 5.5%(+0.639)#80 | 4.9%(+1.25)#8,183 |
| 81. | Pawcatuck | 6.1% | 5.5%(+0.610)#81 | 4.9%(+1.23)#8,219 |
| 82. | North Haven | 6.1% | 5.5%(+0.602)#82 | 4.9%(+1.22)#8,237 |
| 83. | Greens Farms | 6.1% | 5.5%(+0.583)#83 | 4.9%(+1.20)#8,264 |
| 84. | West Simsbury | 6.0% | 5.5%(+0.487)#84 | 4.9%(+1.10)#8,441 |
| 85. | Waterford | 5.9% | 5.5%(+0.459)#85 | 4.9%(+1.07)#8,482 |
| 86. | Westport | 5.9% | 5.5%(+0.458)#86 | 4.9%(+1.07)#8,489 |
| 87. | Colchester | 5.9% | 5.5%(+0.448)#87 | 4.9%(+1.06)#8,511 |
| 88. | New Britain | 5.9% | 5.5%(+0.429)#88 | 4.9%(+1.04)#8,539 |
| 89. | Waterbury | 5.9% | 5.5%(+0.425)#89 | 4.9%(+1.04)#8,546 |
| 90. | Norwalk | 5.9% | 5.5%(+0.419)#90 | 4.9%(+1.03)#8,554 |
| 91. | Plantsville | 5.9% | 5.5%(+0.407)#91 | 4.9%(+1.02)#8,567 |
| 92. | Bristol | 5.9% | 5.5%(+0.394)#92 | 4.9%(+1.01)#8,639 |
| 93. | Clinton | 5.9% | 5.5%(+0.372)#93 | 4.9%(+0.988)#8,664 |
| 94. | Sandy Hook | 5.6% | 5.5%(+0.152)#94 | 4.9%(+0.767)#9,083 |
| 95. | Woodmont Borough | 5.5% | 5.5%(+0.009)#95 | 4.9%(+0.625)#9,369 |
| 96. | Old Greenwich | 5.5% | 5.5%(-0.005)#96 | 4.9%(+0.611)#9,393 |
| 97. | Newtown Borough | 5.5% | 5.5%(-0.025)#97 | 4.9%(+0.590)#9,440 |
| 98. | Crystal Lake | 5.4% | 5.5%(-0.115)#98 | 4.9%(+0.501)#9,610 |
| 99. | Cheshire Village | 5.4% | 5.5%(-0.127)#99 | 4.9%(+0.489)#9,629 |
| 100. | Mill Plain | 5.3% | 5.5%(-0.236)#100 | 4.9%(+0.379)#9,890 |
Common Questions
What are the Top 10 Cities with the Highest Percentage of Population with a Degree in Liberal Arts and History in Connecticut?
Top 10 Cities with the Highest Percentage of Population with a Degree in Liberal Arts and History in Connecticut are:
#1
34.4%
#2
16.8%
#3
13.4%
#4
13.2%
#5
12.2%
#6
12.2%
#7
11.3%
#8
10.6%
#9
10.6%
#10
10.6%
What city has the Highest Percentage of Population with a Degree in Liberal Arts and History in Connecticut?
East Brooklyn has the Highest Percentage of Population with a Degree in Liberal Arts and History in Connecticut with 34.4%.
What is the Percentage of Population with a Degree in Liberal Arts and History in the State of Connecticut?
Percentage of Population with a Degree in Liberal Arts and History in Connecticut is 5.5%.
What is the Percentage of Population with a Degree in Liberal Arts and History in the United States?
Percentage of Population with a Degree in Liberal Arts and History in the United States is 4.9%.