Cities with the Highest Poverty Level Among Children Under the Age of 5 in Maryland
RELATED REPORTS & OPTIONS
Highest Poverty | Child 0-5
Maryland
Compare Cities
Map of Cities with the Highest Poverty Level Among Children Under the Age of 5 in Maryland
0.0%
100.0%
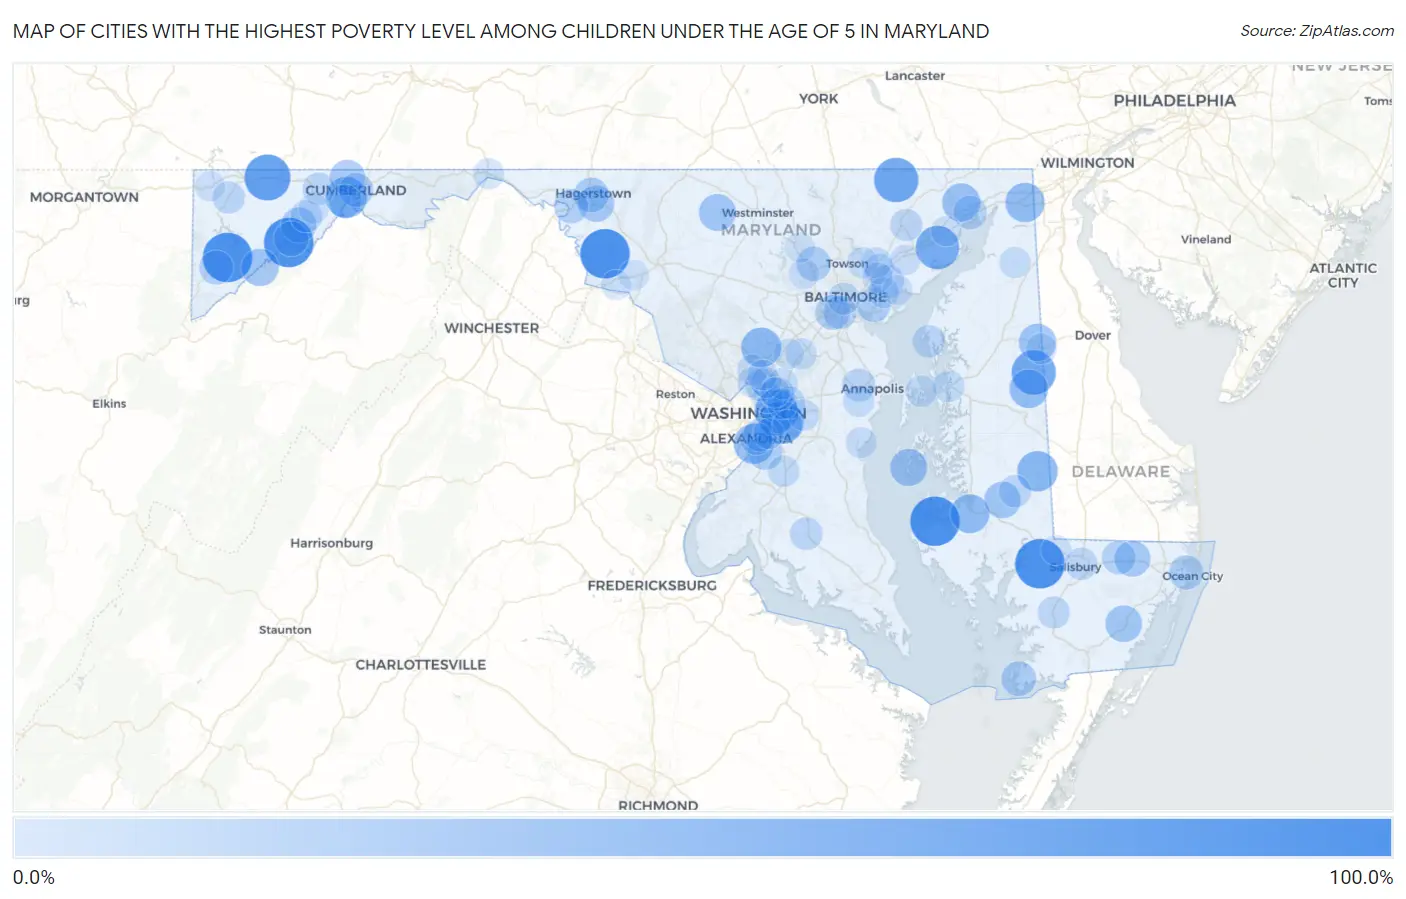
Cities with the Highest Poverty Level Among Children Under the Age of 5 in Maryland
| City | Child Poverty | vs State | vs National | |
| 1. | Crumpton | 100.0% | 12.3%(+87.7)#1 | 18.1%(+81.9)#397 |
| 2. | Deer Park | 100.0% | 12.3%(+87.7)#2 | 18.1%(+81.9)#416 |
| 3. | Madison | 100.0% | 12.3%(+87.7)#3 | 18.1%(+81.9)#557 |
| 4. | Rohrersville | 100.0% | 12.3%(+87.7)#4 | 18.1%(+81.9)#574 |
| 5. | Quantico | 100.0% | 12.3%(+87.7)#5 | 18.1%(+81.9)#612 |
| 6. | Luke | 100.0% | 12.3%(+87.7)#6 | 18.1%(+81.9)#773 |
| 7. | Grantsville | 84.4% | 12.3%(+72.1)#7 | 18.1%(+66.3)#1,176 |
| 8. | Pylesville | 77.2% | 12.3%(+64.9)#8 | 18.1%(+59.1)#1,436 |
| 9. | Goldsboro | 76.7% | 12.3%(+64.4)#9 | 18.1%(+58.6)#1,463 |
| 10. | Perryman | 72.8% | 12.3%(+60.5)#10 | 18.1%(+54.7)#1,642 |
| 11. | Fairmount Heights | 71.4% | 12.3%(+59.2)#11 | 18.1%(+53.4)#1,692 |
| 12. | District Heights | 69.8% | 12.3%(+57.5)#12 | 18.1%(+51.7)#1,796 |
| 13. | Bowling Green | 63.2% | 12.3%(+50.9)#13 | 18.1%(+45.1)#2,242 |
| 14. | Federalsburg | 59.9% | 12.3%(+47.7)#14 | 18.1%(+41.9)#2,553 |
| 15. | Spencerville | 58.4% | 12.3%(+46.2)#15 | 18.1%(+40.4)#2,654 |
| 16. | National Harbor | 58.4% | 12.3%(+46.2)#16 | 18.1%(+40.3)#2,655 |
| 17. | Elkton | 54.8% | 12.3%(+42.5)#17 | 18.1%(+36.7)#2,983 |
| 18. | Cambridge | 53.4% | 12.3%(+41.2)#18 | 18.1%(+35.4)#3,093 |
| 19. | Greensboro | 52.1% | 12.3%(+39.9)#19 | 18.1%(+34.0)#3,225 |
| 20. | Port Deposit | 50.0% | 12.3%(+37.7)#20 | 18.1%(+31.9)#3,443 |
| 21. | Kitzmiller | 47.1% | 12.3%(+34.8)#21 | 18.1%(+29.0)#3,872 |
| 22. | Templeville | 46.9% | 12.3%(+34.6)#22 | 18.1%(+28.8)#3,891 |
| 23. | Tilghman Island | 45.5% | 12.3%(+33.2)#23 | 18.1%(+27.4)#4,084 |
| 24. | Union Bridge | 44.9% | 12.3%(+32.6)#24 | 18.1%(+26.8)#4,160 |
| 25. | Snow Hill | 43.6% | 12.3%(+31.4)#25 | 18.1%(+25.6)#4,343 |
| 26. | East New Market | 43.5% | 12.3%(+31.2)#26 | 18.1%(+25.4)#4,374 |
| 27. | Funkstown | 42.1% | 12.3%(+29.8)#27 | 18.1%(+24.0)#4,573 |
| 28. | Willards | 40.2% | 12.3%(+27.9)#28 | 18.1%(+22.1)#4,831 |
| 29. | Corriganville | 38.7% | 12.3%(+26.5)#29 | 18.1%(+20.6)#5,113 |
| 30. | Barton | 38.2% | 12.3%(+26.0)#30 | 18.1%(+20.2)#5,185 |
| 31. | Hagerstown | 35.8% | 12.3%(+23.6)#31 | 18.1%(+17.8)#5,606 |
| 32. | Westernport | 35.8% | 12.3%(+23.5)#32 | 18.1%(+17.7)#5,620 |
| 33. | Crisfield | 35.6% | 12.3%(+23.4)#33 | 18.1%(+17.6)#5,660 |
| 34. | Friendly | 35.6% | 12.3%(+23.3)#34 | 18.1%(+17.5)#5,665 |
| 35. | Lansdowne | 35.0% | 12.3%(+22.7)#35 | 18.1%(+16.9)#5,775 |
| 36. | Garrison | 34.5% | 12.3%(+22.3)#36 | 18.1%(+16.4)#5,862 |
| 37. | West Ocean City | 34.0% | 12.3%(+21.8)#37 | 18.1%(+16.0)#5,944 |
| 38. | Williamsport | 33.9% | 12.3%(+21.7)#38 | 18.1%(+15.9)#5,966 |
| 39. | Cumberland | 33.5% | 12.3%(+21.2)#39 | 18.1%(+15.4)#6,033 |
| 40. | Loch Lynn Heights | 33.3% | 12.3%(+21.1)#40 | 18.1%(+15.3)#6,109 |
| 41. | Dundalk | 32.6% | 12.3%(+20.3)#41 | 18.1%(+14.5)#6,291 |
| 42. | Pittsville | 31.3% | 12.3%(+19.0)#42 | 18.1%(+13.2)#6,523 |
| 43. | Coral Hills | 31.2% | 12.3%(+18.9)#43 | 18.1%(+13.1)#6,549 |
| 44. | Potomac Park | 30.4% | 12.3%(+18.2)#44 | 18.1%(+12.4)#6,706 |
| 45. | Perryville | 30.2% | 12.3%(+17.9)#45 | 18.1%(+12.1)#6,769 |
| 46. | Baltimore Highlands | 29.7% | 12.3%(+17.5)#46 | 18.1%(+11.7)#6,879 |
| 47. | Middle River | 29.2% | 12.3%(+16.9)#47 | 18.1%(+11.1)#6,992 |
| 48. | East Riverdale | 28.6% | 12.3%(+16.3)#48 | 18.1%(+10.5)#7,125 |
| 49. | Glassmanor | 28.5% | 12.3%(+16.2)#49 | 18.1%(+10.4)#7,201 |
| 50. | Parole | 27.8% | 12.3%(+15.5)#50 | 18.1%(+9.71)#7,356 |
| 51. | Rock Hall | 27.0% | 12.3%(+14.7)#51 | 18.1%(+8.92)#7,569 |
| 52. | Langley Park | 27.0% | 12.3%(+14.7)#52 | 18.1%(+8.91)#7,572 |
| 53. | Glenarden | 26.9% | 12.3%(+14.6)#53 | 18.1%(+8.79)#7,602 |
| 54. | Charlotte Hall | 26.7% | 12.3%(+14.4)#54 | 18.1%(+8.60)#7,640 |
| 55. | Forest Heights | 26.1% | 12.3%(+13.8)#55 | 18.1%(+8.02)#7,774 |
| 56. | Hurlock | 26.1% | 12.3%(+13.8)#56 | 18.1%(+8.02)#7,776 |
| 57. | Frostburg | 25.5% | 12.3%(+13.2)#57 | 18.1%(+7.43)#7,918 |
| 58. | Salisbury | 25.3% | 12.3%(+13.0)#58 | 18.1%(+7.19)#7,977 |
| 59. | Bel Air | 25.0% | 12.3%(+12.7)#59 | 18.1%(+6.94)#8,000 |
| 60. | Accident | 25.0% | 12.3%(+12.7)#60 | 18.1%(+6.94)#8,067 |
| 61. | Princess Anne | 24.6% | 12.3%(+12.4)#61 | 18.1%(+6.56)#8,187 |
| 62. | Baltimore | 24.6% | 12.3%(+12.3)#62 | 18.1%(+6.50)#8,204 |
| 63. | Lonaconing | 24.6% | 12.3%(+12.3)#63 | 18.1%(+6.50)#8,207 |
| 64. | Queenstown | 22.7% | 12.3%(+10.4)#64 | 18.1%(+4.62)#8,717 |
| 65. | Brandywine | 22.6% | 12.3%(+10.3)#65 | 18.1%(+4.50)#8,755 |
| 66. | Woodlawn Cdp Baltimore County | 21.9% | 12.3%(+9.65)#66 | 18.1%(+3.85)#8,957 |
| 67. | Chester | 21.5% | 12.3%(+9.25)#67 | 18.1%(+3.44)#9,091 |
| 68. | Kettering | 21.5% | 12.3%(+9.21)#68 | 18.1%(+3.41)#9,102 |
| 69. | Maryland City | 21.0% | 12.3%(+8.73)#69 | 18.1%(+2.92)#9,277 |
| 70. | Brentwood | 20.8% | 12.3%(+8.59)#70 | 18.1%(+2.78)#9,305 |
| 71. | Cecilton | 20.8% | 12.3%(+8.58)#71 | 18.1%(+2.77)#9,310 |
| 72. | Edgewater | 20.8% | 12.3%(+8.52)#72 | 18.1%(+2.72)#9,328 |
| 73. | Essex | 20.4% | 12.3%(+8.16)#73 | 18.1%(+2.35)#9,436 |
| 74. | Greenbelt | 20.2% | 12.3%(+7.95)#74 | 18.1%(+2.15)#9,487 |
| 75. | Perry Hall | 20.2% | 12.3%(+7.93)#75 | 18.1%(+2.12)#9,492 |
| 76. | Kemp Mill | 20.0% | 12.3%(+7.74)#76 | 18.1%(+1.94)#9,517 |
| 77. | Carney | 19.9% | 12.3%(+7.68)#77 | 18.1%(+1.87)#9,617 |
| 78. | Hancock | 19.8% | 12.3%(+7.59)#78 | 18.1%(+1.78)#9,629 |
| 79. | Deale | 19.5% | 12.3%(+7.24)#79 | 18.1%(+1.43)#9,730 |
| 80. | Marydel | 19.2% | 12.3%(+6.97)#80 | 18.1%(+1.17)#9,825 |
| 81. | Landover | 19.1% | 12.3%(+6.89)#81 | 18.1%(+1.08)#9,845 |
| 82. | Adelphi | 19.0% | 12.3%(+6.74)#82 | 18.1%(+0.929)#9,898 |
| 83. | Marlow Heights | 18.9% | 12.3%(+6.69)#83 | 18.1%(+0.885)#9,909 |
| 84. | Silver Spring | 18.7% | 12.3%(+6.42)#84 | 18.1%(+0.613)#9,992 |
| 85. | Randallstown | 18.5% | 12.3%(+6.22)#85 | 18.1%(+0.416)#10,059 |
| 86. | Hillandale | 18.4% | 12.3%(+6.14)#86 | 18.1%(+0.331)#10,087 |
| 87. | White Marsh | 17.9% | 12.3%(+5.62)#87 | 18.1%(-0.184)#10,249 |
| 88. | Rossville | 17.9% | 12.3%(+5.60)#88 | 18.1%(-0.202)#10,253 |
| 89. | Joppatowne | 17.8% | 12.3%(+5.55)#89 | 18.1%(-0.261)#10,283 |
| 90. | Laurel | 17.4% | 12.3%(+5.11)#90 | 18.1%(-0.693)#10,440 |
| 91. | Hebron | 17.1% | 12.3%(+4.89)#91 | 18.1%(-0.920)#10,509 |
| 92. | Aberdeen | 17.1% | 12.3%(+4.85)#92 | 18.1%(-0.952)#10,515 |
| 93. | Jefferson | 17.0% | 12.3%(+4.74)#93 | 18.1%(-1.07)#10,546 |
| 94. | Riverdale Park | 16.8% | 12.3%(+4.50)#94 | 18.1%(-1.31)#10,611 |
| 95. | Midland | 16.7% | 12.3%(+4.41)#95 | 18.1%(-1.40)#10,656 |
| 96. | Friendsville | 16.7% | 12.3%(+4.41)#96 | 18.1%(-1.40)#10,668 |
| 97. | Rosemont | 16.7% | 12.3%(+4.41)#97 | 18.1%(-1.40)#10,678 |
| 98. | Forestville | 16.6% | 12.3%(+4.37)#98 | 18.1%(-1.43)#10,705 |
| 99. | Bowleys Quarters | 16.6% | 12.3%(+4.36)#99 | 18.1%(-1.45)#10,707 |
| 100. | Reisterstown | 16.6% | 12.3%(+4.31)#100 | 18.1%(-1.50)#10,720 |
Common Questions
What are the Top 10 Cities with the Highest Poverty Level Among Children Under the Age of 5 in Maryland?
Top 10 Cities with the Highest Poverty Level Among Children Under the Age of 5 in Maryland are:
#1
100.0%
#2
100.0%
#3
100.0%
#4
100.0%
#5
100.0%
#6
84.4%
#7
77.2%
#8
76.7%
#9
72.8%
#10
71.4%
What city has the Highest Poverty Level Among Children Under the Age of 5 in Maryland?
Deer Park has the Highest Poverty Level Among Children Under the Age of 5 in Maryland with 100.0%.
What is the Poverty Level Among Children Under the Age of 5 in the State of Maryland?
Poverty Level Among Children Under the Age of 5 in Maryland is 12.3%.
What is the Poverty Level Among Children Under the Age of 5 in the United States?
Poverty Level Among Children Under the Age of 5 in the United States is 18.1%.