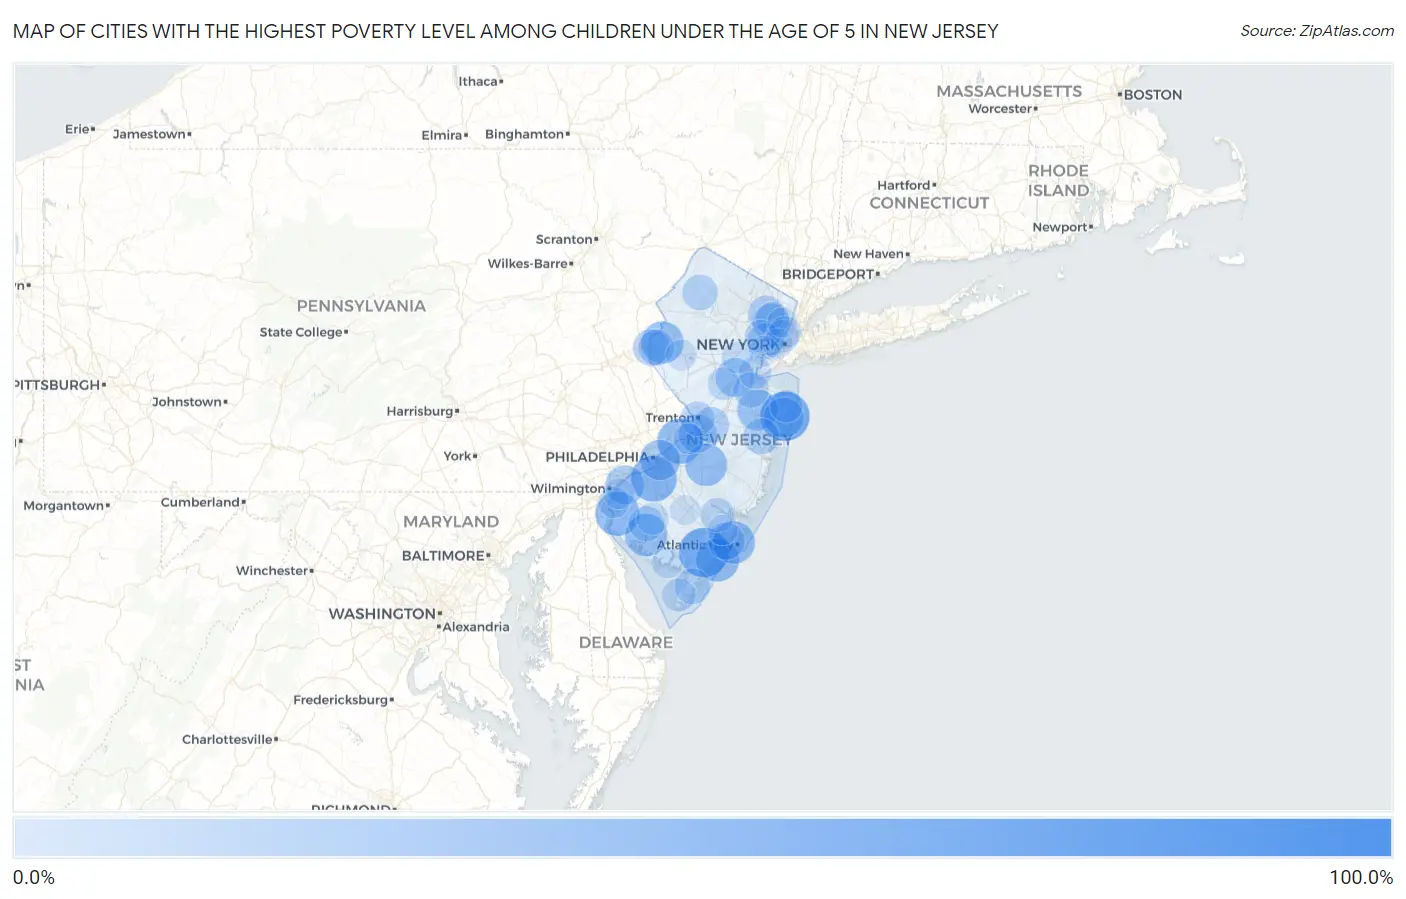
Cities with the Highest Poverty Level Among Children Under the Age of 5 in New Jersey
RELATED REPORTS & OPTIONS
Highest Poverty | Child 0-5
New Jersey
Compare Cities
Map of Cities with the Highest Poverty Level Among Children Under the Age of 5 in New Jersey
0.0%
100.0%
Cities with the Highest Poverty Level Among Children Under the Age of 5 in New Jersey
| City | Child Poverty | vs State | vs National | |
| 1. | Union | 100.0% | 14.3%(+85.7)#1 | 18.1%(+81.9)#23 |
| 2. | West Park | 100.0% | 14.3%(+85.7)#2 | 18.1%(+81.9)#87 |
| 3. | Harrisonville | 100.0% | 14.3%(+85.7)#3 | 18.1%(+81.9)#440 |
| 4. | Seaside Heights Borough | 85.2% | 14.3%(+70.9)#4 | 18.1%(+67.1)#1,156 |
| 5. | Arrowhead Lake | 81.8% | 14.3%(+67.5)#5 | 18.1%(+63.8)#1,274 |
| 6. | Corbin City | 72.9% | 14.3%(+58.6)#6 | 18.1%(+54.9)#1,640 |
| 7. | Loch Arbour | 72.7% | 14.3%(+58.4)#7 | 18.1%(+54.7)#1,649 |
| 8. | Oak Valley | 62.9% | 14.3%(+48.6)#8 | 18.1%(+44.8)#2,265 |
| 9. | Beverly | 61.0% | 14.3%(+46.7)#9 | 18.1%(+43.0)#2,427 |
| 10. | Dunellen Borough | 59.2% | 14.3%(+44.9)#10 | 18.1%(+41.2)#2,589 |
| 11. | Salem | 58.4% | 14.3%(+44.1)#11 | 18.1%(+40.3)#2,658 |
| 12. | Neptune City Borough | 57.5% | 14.3%(+43.2)#12 | 18.1%(+39.4)#2,732 |
| 13. | Ocean City | 55.8% | 14.3%(+41.5)#13 | 18.1%(+37.8)#2,882 |
| 14. | Silver Lake Cdp Essex County | 53.9% | 14.3%(+39.6)#14 | 18.1%(+35.8)#3,042 |
| 15. | Atlantic City | 53.6% | 14.3%(+39.3)#15 | 18.1%(+35.6)#3,072 |
| 16. | Shiloh Borough | 52.9% | 14.3%(+38.7)#16 | 18.1%(+34.9)#3,149 |
| 17. | Bridgeton | 52.9% | 14.3%(+38.6)#17 | 18.1%(+34.8)#3,152 |
| 18. | New Village | 52.6% | 14.3%(+38.4)#18 | 18.1%(+34.6)#3,178 |
| 19. | Woodlynne Borough | 52.3% | 14.3%(+38.0)#19 | 18.1%(+34.3)#3,202 |
| 20. | Somerdale Borough | 52.0% | 14.3%(+37.7)#20 | 18.1%(+33.9)#3,234 |
| 21. | Leisuretowne | 51.7% | 14.3%(+37.4)#21 | 18.1%(+33.7)#3,257 |
| 22. | Victory Gardens Borough | 48.6% | 14.3%(+34.3)#22 | 18.1%(+30.5)#3,684 |
| 23. | East Freehold | 48.6% | 14.3%(+34.3)#23 | 18.1%(+30.5)#3,686 |
| 24. | Camden | 47.8% | 14.3%(+33.6)#24 | 18.1%(+29.8)#3,772 |
| 25. | Asbury Park | 47.0% | 14.3%(+32.7)#25 | 18.1%(+29.0)#3,875 |
| 26. | Woodbine Borough | 47.0% | 14.3%(+32.7)#26 | 18.1%(+28.9)#3,881 |
| 27. | Sunset Lake | 47.0% | 14.3%(+32.7)#27 | 18.1%(+28.9)#3,882 |
| 28. | Pedricktown | 44.3% | 14.3%(+30.0)#28 | 18.1%(+26.2)#4,251 |
| 29. | New Brunswick | 43.0% | 14.3%(+28.7)#29 | 18.1%(+24.9)#4,429 |
| 30. | Lindenwold Borough | 42.7% | 14.3%(+28.4)#30 | 18.1%(+24.6)#4,494 |
| 31. | Mount Ephraim Borough | 42.5% | 14.3%(+28.2)#31 | 18.1%(+24.4)#4,520 |
| 32. | Roebling | 41.8% | 14.3%(+27.5)#32 | 18.1%(+23.7)#4,617 |
| 33. | Crosswicks | 41.3% | 14.3%(+27.0)#33 | 18.1%(+23.2)#4,687 |
| 34. | Penns Grove Borough | 40.9% | 14.3%(+26.7)#34 | 18.1%(+22.9)#4,729 |
| 35. | Manville Borough | 39.8% | 14.3%(+25.5)#35 | 18.1%(+21.7)#4,935 |
| 36. | Gouldtown | 38.9% | 14.3%(+24.6)#36 | 18.1%(+20.9)#5,075 |
| 37. | Pleasantville | 38.5% | 14.3%(+24.3)#37 | 18.1%(+20.5)#5,128 |
| 38. | Passaic | 37.4% | 14.3%(+23.2)#38 | 18.1%(+19.4)#5,326 |
| 39. | Phillipsburg | 37.1% | 14.3%(+22.9)#39 | 18.1%(+19.1)#5,376 |
| 40. | Kenilworth Borough | 37.0% | 14.3%(+22.7)#40 | 18.1%(+18.9)#5,403 |
| 41. | Paterson | 36.1% | 14.3%(+21.8)#41 | 18.1%(+18.0)#5,565 |
| 42. | Lakewood | 35.6% | 14.3%(+21.4)#42 | 18.1%(+17.6)#5,656 |
| 43. | Groveville | 35.2% | 14.3%(+20.9)#43 | 18.1%(+17.1)#5,755 |
| 44. | Audubon Park Borough | 35.0% | 14.3%(+20.7)#44 | 18.1%(+16.9)#5,780 |
| 45. | Newark | 34.9% | 14.3%(+20.6)#45 | 18.1%(+16.8)#5,793 |
| 46. | Greenwich | 34.8% | 14.3%(+20.5)#46 | 18.1%(+16.8)#5,805 |
| 47. | Pompton Plains | 34.7% | 14.3%(+20.4)#47 | 18.1%(+16.6)#5,831 |
| 48. | Cape May Court House | 34.6% | 14.3%(+20.3)#48 | 18.1%(+16.5)#5,848 |
| 49. | Newton | 34.0% | 14.3%(+19.7)#49 | 18.1%(+15.9)#5,955 |
| 50. | Wrightstown Borough | 33.9% | 14.3%(+19.6)#50 | 18.1%(+15.8)#5,976 |
| 51. | Brownville | 33.3% | 14.3%(+19.1)#51 | 18.1%(+15.3)#6,050 |
| 52. | Seabrook Farms | 33.3% | 14.3%(+19.1)#52 | 18.1%(+15.3)#6,056 |
| 53. | Elmwood Park Borough | 32.2% | 14.3%(+17.9)#53 | 18.1%(+14.1)#6,359 |
| 54. | Westville Borough | 31.7% | 14.3%(+17.4)#54 | 18.1%(+13.6)#6,450 |
| 55. | Trenton | 30.9% | 14.3%(+16.7)#55 | 18.1%(+12.9)#6,601 |
| 56. | Wharton Borough | 30.6% | 14.3%(+16.3)#56 | 18.1%(+12.5)#6,673 |
| 57. | Egg Harbor City | 30.6% | 14.3%(+16.3)#57 | 18.1%(+12.5)#6,678 |
| 58. | Woodland Park Borough | 29.3% | 14.3%(+15.0)#58 | 18.1%(+11.2)#6,982 |
| 59. | Ampere North | 28.9% | 14.3%(+14.6)#59 | 18.1%(+10.8)#7,075 |
| 60. | Hampton Borough | 28.7% | 14.3%(+14.5)#60 | 18.1%(+10.7)#7,099 |
| 61. | Garfield | 28.1% | 14.3%(+13.8)#61 | 18.1%(+10.0)#7,284 |
| 62. | Villas | 27.8% | 14.3%(+13.5)#62 | 18.1%(+9.76)#7,349 |
| 63. | Pine Hill Borough | 27.7% | 14.3%(+13.5)#63 | 18.1%(+9.68)#7,379 |
| 64. | Newport | 27.0% | 14.3%(+12.7)#64 | 18.1%(+8.96)#7,556 |
| 65. | East Orange | 26.8% | 14.3%(+12.5)#65 | 18.1%(+8.76)#7,611 |
| 66. | Franklin Park | 26.6% | 14.3%(+12.3)#66 | 18.1%(+8.56)#7,670 |
| 67. | Perth Amboy | 26.5% | 14.3%(+12.2)#67 | 18.1%(+8.45)#7,690 |
| 68. | Freehold Borough | 26.4% | 14.3%(+12.2)#68 | 18.1%(+8.37)#7,702 |
| 69. | Union City | 26.4% | 14.3%(+12.1)#69 | 18.1%(+8.32)#7,711 |
| 70. | South River Borough | 26.4% | 14.3%(+12.1)#70 | 18.1%(+8.31)#7,715 |
| 71. | Long Branch | 26.2% | 14.3%(+11.9)#71 | 18.1%(+8.16)#7,753 |
| 72. | West New York | 25.4% | 14.3%(+11.1)#72 | 18.1%(+7.33)#7,946 |
| 73. | Fairview Borough | 25.3% | 14.3%(+11.1)#73 | 18.1%(+7.28)#7,958 |
| 74. | Olivet | 25.2% | 14.3%(+10.9)#74 | 18.1%(+7.12)#7,987 |
| 75. | Port Morris | 25.0% | 14.3%(+10.7)#75 | 18.1%(+6.94)#8,035 |
| 76. | Rockaway Borough | 24.5% | 14.3%(+10.2)#76 | 18.1%(+6.46)#8,220 |
| 77. | Plainfield | 23.4% | 14.3%(+9.14)#77 | 18.1%(+5.36)#8,512 |
| 78. | Keasbey | 23.2% | 14.3%(+8.95)#78 | 18.1%(+5.17)#8,553 |
| 79. | Pennsville | 22.8% | 14.3%(+8.56)#79 | 18.1%(+4.77)#8,679 |
| 80. | Port Norris | 22.8% | 14.3%(+8.49)#80 | 18.1%(+4.71)#8,692 |
| 81. | Sewell | 22.2% | 14.3%(+7.94)#81 | 18.1%(+4.16)#8,845 |
| 82. | Pemberton Borough | 22.2% | 14.3%(+7.94)#82 | 18.1%(+4.16)#8,849 |
| 83. | East Newark Borough | 21.7% | 14.3%(+7.42)#83 | 18.1%(+3.64)#9,035 |
| 84. | Clinton | 21.5% | 14.3%(+7.26)#84 | 18.1%(+3.48)#9,081 |
| 85. | Carneys Point | 21.4% | 14.3%(+7.12)#85 | 18.1%(+3.34)#9,150 |
| 86. | Carteret Borough | 21.4% | 14.3%(+7.12)#86 | 18.1%(+3.34)#9,151 |
| 87. | Haworth Borough | 21.3% | 14.3%(+7.00)#87 | 18.1%(+3.21)#9,176 |
| 88. | Glassboro Borough | 21.1% | 14.3%(+6.78)#88 | 18.1%(+2.99)#9,244 |
| 89. | Burlington | 21.0% | 14.3%(+6.73)#89 | 18.1%(+2.94)#9,269 |
| 90. | Elizabeth | 20.6% | 14.3%(+6.34)#90 | 18.1%(+2.56)#9,367 |
| 91. | Lawnside Borough | 20.4% | 14.3%(+6.11)#91 | 18.1%(+2.33)#9,449 |
| 92. | South Bound Brook Borough | 20.3% | 14.3%(+6.01)#92 | 18.1%(+2.22)#9,471 |
| 93. | Pomona | 20.2% | 14.3%(+5.88)#93 | 18.1%(+2.10)#9,498 |
| 94. | Keansburg Borough | 20.0% | 14.3%(+5.72)#94 | 18.1%(+1.94)#9,518 |
| 95. | South Toms River Borough | 19.9% | 14.3%(+5.66)#95 | 18.1%(+1.87)#9,615 |
| 96. | Jersey City | 19.9% | 14.3%(+5.63)#96 | 18.1%(+1.85)#9,619 |
| 97. | Ridgefield Park | 19.8% | 14.3%(+5.51)#97 | 18.1%(+1.72)#9,644 |
| 98. | Paulsboro Borough | 19.6% | 14.3%(+5.31)#98 | 18.1%(+1.53)#9,696 |
| 99. | Collings Lakes | 19.4% | 14.3%(+5.15)#99 | 18.1%(+1.37)#9,755 |
| 100. | Glen Gardner Borough | 19.3% | 14.3%(+5.02)#100 | 18.1%(+1.24)#9,804 |
Common Questions
What are the Top 10 Cities with the Highest Poverty Level Among Children Under the Age of 5 in New Jersey?
Top 10 Cities with the Highest Poverty Level Among Children Under the Age of 5 in New Jersey are:
#1
72.9%
#2
72.7%
#3
62.9%
#4
61.0%
#5
58.4%
#6
55.8%
#7
53.6%
#8
52.9%
#9
52.6%
#10
51.7%
What city has the Highest Poverty Level Among Children Under the Age of 5 in New Jersey?
Corbin City has the Highest Poverty Level Among Children Under the Age of 5 in New Jersey with 72.9%.
What is the Poverty Level Among Children Under the Age of 5 in the State of New Jersey?
Poverty Level Among Children Under the Age of 5 in New Jersey is 14.3%.
What is the Poverty Level Among Children Under the Age of 5 in the United States?
Poverty Level Among Children Under the Age of 5 in the United States is 18.1%.