Cities with the Highest Poverty Level Among Children Under the Age of 5 in Indiana
RELATED REPORTS & OPTIONS
Highest Poverty | Child 0-5
Indiana
Compare Cities
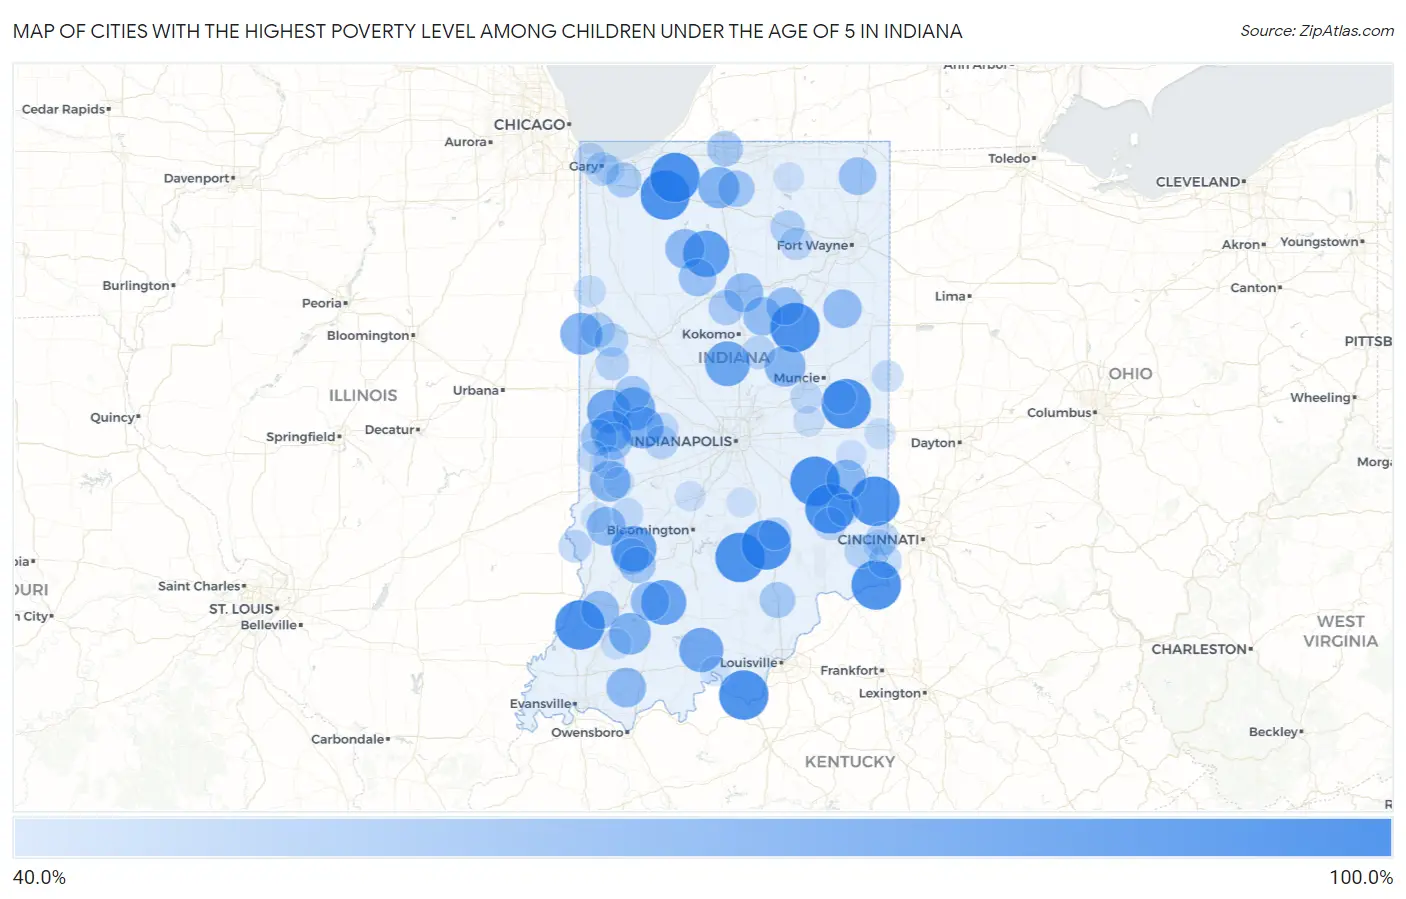
Map of Cities with the Highest Poverty Level Among Children Under the Age of 5 in Indiana
0.0%
100.0%
Cities with the Highest Poverty Level Among Children Under the Age of 5 in Indiana
| City | Child Poverty | vs State | vs National | |
| 1. | Milroy | 100.0% | 18.4%(+81.6)#1 | 18.1%(+81.9)#250 |
| 2. | Lewis | 100.0% | 18.4%(+81.6)#2 | 18.1%(+81.9)#275 |
| 3. | Hanna | 100.0% | 18.4%(+81.6)#3 | 18.1%(+81.9)#296 |
| 4. | Servia | 100.0% | 18.4%(+81.6)#4 | 18.1%(+81.9)#371 |
| 5. | Amity | 100.0% | 18.4%(+81.6)#5 | 18.1%(+81.9)#417 |
| 6. | Lake Holiday Hideaway | 100.0% | 18.4%(+81.6)#7 | 18.1%(+81.9)#426 |
| 7. | New Point | 100.0% | 18.4%(+81.6)#8 | 18.1%(+81.9)#427 |
| 8. | Freetown | 100.0% | 18.4%(+81.6)#9 | 18.1%(+81.9)#503 |
| 9. | Losantville | 100.0% | 18.4%(+81.6)#10 | 18.1%(+81.9)#510 |
| 10. | Kingsbury | 100.0% | 18.4%(+81.6)#11 | 18.1%(+81.9)#536 |
| 11. | Marion | 100.0% | 18.4%(+81.6)#12 | 18.1%(+81.9)#565 |
| 12. | Cedar Grove | 100.0% | 18.4%(+81.6)#13 | 18.1%(+81.9)#568 |
| 13. | Burnett | 100.0% | 18.4%(+81.6)#14 | 18.1%(+81.9)#576 |
| 14. | Jonesville | 100.0% | 18.4%(+81.6)#15 | 18.1%(+81.9)#584 |
| 15. | Adams | 100.0% | 18.4%(+81.6)#16 | 18.1%(+81.9)#592 |
| 16. | Alford | 100.0% | 18.4%(+81.6)#17 | 18.1%(+81.9)#598 |
| 17. | Decker | 100.0% | 18.4%(+81.6)#18 | 18.1%(+81.9)#621 |
| 18. | Deer Creek | 100.0% | 18.4%(+81.6)#19 | 18.1%(+81.9)#629 |
| 19. | Otisco | 100.0% | 18.4%(+81.6)#20 | 18.1%(+81.9)#729 |
| 20. | Hobbs | 100.0% | 18.4%(+81.6)#21 | 18.1%(+81.9)#779 |
| 21. | Florence | 100.0% | 18.4%(+81.6)#22 | 18.1%(+81.9)#810 |
| 22. | Pleasantville | 100.0% | 18.4%(+81.6)#23 | 18.1%(+81.9)#816 |
| 23. | Laconia | 100.0% | 18.4%(+81.6)#24 | 18.1%(+81.9)#845 |
| 24. | Kewanna | 90.5% | 18.4%(+72.1)#25 | 18.1%(+72.4)#1,016 |
| 25. | Switz City | 87.5% | 18.4%(+69.1)#26 | 18.1%(+69.4)#1,079 |
| 26. | Shoals | 86.7% | 18.4%(+68.2)#27 | 18.1%(+68.6)#1,107 |
| 27. | Kempton | 85.7% | 18.4%(+67.3)#28 | 18.1%(+67.7)#1,140 |
| 28. | English | 83.8% | 18.4%(+65.4)#29 | 18.1%(+65.7)#1,196 |
| 29. | Kingman | 81.2% | 18.4%(+62.8)#30 | 18.1%(+63.2)#1,288 |
| 30. | Alamo | 80.0% | 18.4%(+61.6)#31 | 18.1%(+61.9)#1,359 |
| 31. | Russellville | 77.3% | 18.4%(+58.8)#32 | 18.1%(+59.2)#1,433 |
| 32. | Ambia | 76.9% | 18.4%(+58.5)#33 | 18.1%(+58.9)#1,454 |
| 33. | Otwell | 76.3% | 18.4%(+57.8)#34 | 18.1%(+58.2)#1,477 |
| 34. | La Paz | 75.0% | 18.4%(+56.6)#35 | 18.1%(+56.9)#1,522 |
| 35. | Bloomingdale | 73.9% | 18.4%(+55.5)#36 | 18.1%(+55.9)#1,588 |
| 36. | Seelyville | 73.3% | 18.4%(+54.9)#37 | 18.1%(+55.3)#1,619 |
| 37. | Orestes | 73.3% | 18.4%(+54.9)#38 | 18.1%(+55.3)#1,622 |
| 38. | Laurel | 71.6% | 18.4%(+53.2)#39 | 18.1%(+53.5)#1,689 |
| 39. | Tennyson | 70.0% | 18.4%(+51.6)#40 | 18.1%(+51.9)#1,788 |
| 40. | Winamac | 69.5% | 18.4%(+51.0)#41 | 18.1%(+51.4)#1,813 |
| 41. | Peru | 67.6% | 18.4%(+49.1)#42 | 18.1%(+49.5)#1,923 |
| 42. | Hymera | 67.4% | 18.4%(+49.0)#43 | 18.1%(+49.4)#1,930 |
| 43. | Loogootee | 67.4% | 18.4%(+48.9)#44 | 18.1%(+49.3)#1,938 |
| 44. | Amboy | 66.7% | 18.4%(+48.2)#45 | 18.1%(+48.6)#1,994 |
| 45. | Poneto | 66.7% | 18.4%(+48.2)#46 | 18.1%(+48.6)#2,020 |
| 46. | Monroe City | 65.6% | 18.4%(+47.2)#47 | 18.1%(+47.5)#2,074 |
| 47. | Scott | 65.0% | 18.4%(+46.6)#48 | 18.1%(+46.9)#2,118 |
| 48. | La Fontaine | 64.8% | 18.4%(+46.4)#49 | 18.1%(+46.7)#2,129 |
| 49. | Hudson | 64.2% | 18.4%(+45.7)#50 | 18.1%(+46.1)#2,175 |
| 50. | Royal Center | 63.6% | 18.4%(+45.2)#51 | 18.1%(+45.6)#2,202 |
| 51. | Rockville | 62.0% | 18.4%(+43.6)#52 | 18.1%(+44.0)#2,338 |
| 52. | Bremen | 61.0% | 18.4%(+42.6)#53 | 18.1%(+42.9)#2,429 |
| 53. | Montezuma | 60.0% | 18.4%(+41.6)#54 | 18.1%(+41.9)#2,499 |
| 54. | Lyons | 60.0% | 18.4%(+41.6)#55 | 18.1%(+41.9)#2,502 |
| 55. | Newberry | 60.0% | 18.4%(+41.6)#56 | 18.1%(+41.9)#2,540 |
| 56. | Waynetown | 58.5% | 18.4%(+40.1)#57 | 18.1%(+40.4)#2,651 |
| 57. | Roseland | 58.3% | 18.4%(+39.9)#58 | 18.1%(+40.3)#2,665 |
| 58. | Scottsburg | 58.3% | 18.4%(+39.9)#59 | 18.1%(+40.2)#2,675 |
| 59. | Barbee | 57.1% | 18.4%(+38.7)#60 | 18.1%(+39.1)#2,752 |
| 60. | Walton | 56.8% | 18.4%(+38.3)#61 | 18.1%(+38.7)#2,793 |
| 61. | Salt Creek Commons | 56.4% | 18.4%(+37.9)#62 | 18.1%(+38.3)#2,830 |
| 62. | Boswell | 55.7% | 18.4%(+37.3)#63 | 18.1%(+37.6)#2,894 |
| 63. | Pierceton | 54.2% | 18.4%(+35.7)#64 | 18.1%(+36.1)#3,022 |
| 64. | Dillsboro | 52.7% | 18.4%(+34.3)#65 | 18.1%(+34.6)#3,172 |
| 65. | Liberty Mills | 52.5% | 18.4%(+34.1)#66 | 18.1%(+34.4)#3,186 |
| 66. | Pine Village | 52.4% | 18.4%(+34.0)#67 | 18.1%(+34.3)#3,197 |
| 67. | Rising Sun | 52.3% | 18.4%(+33.9)#68 | 18.1%(+34.3)#3,205 |
| 68. | Gary | 52.1% | 18.4%(+33.6)#69 | 18.1%(+34.0)#3,228 |
| 69. | Lawrenceburg | 51.7% | 18.4%(+33.3)#70 | 18.1%(+33.6)#3,263 |
| 70. | Windfall City | 51.6% | 18.4%(+33.2)#71 | 18.1%(+33.6)#3,272 |
| 71. | Bainbridge | 51.3% | 18.4%(+32.9)#72 | 18.1%(+33.2)#3,308 |
| 72. | Attica | 51.0% | 18.4%(+32.6)#73 | 18.1%(+32.9)#3,326 |
| 73. | Rosedale | 50.0% | 18.4%(+31.6)#74 | 18.1%(+31.9)#3,442 |
| 74. | Elizabethtown | 50.0% | 18.4%(+31.6)#75 | 18.1%(+31.9)#3,495 |
| 75. | Napoleon | 50.0% | 18.4%(+31.6)#76 | 18.1%(+31.9)#3,504 |
| 76. | Merom | 50.0% | 18.4%(+31.6)#77 | 18.1%(+31.9)#3,534 |
| 77. | Blountsville | 50.0% | 18.4%(+31.6)#78 | 18.1%(+31.9)#3,560 |
| 78. | South Whitley | 49.3% | 18.4%(+30.9)#79 | 18.1%(+31.3)#3,617 |
| 79. | Williamsburg | 49.1% | 18.4%(+30.7)#80 | 18.1%(+31.0)#3,637 |
| 80. | Batesville | 48.2% | 18.4%(+29.8)#81 | 18.1%(+30.2)#3,722 |
| 81. | Roachdale | 47.9% | 18.4%(+29.5)#82 | 18.1%(+29.9)#3,763 |
| 82. | Middletown | 47.5% | 18.4%(+29.1)#83 | 18.1%(+29.5)#3,807 |
| 83. | East Chicago | 47.3% | 18.4%(+28.8)#84 | 18.1%(+29.2)#3,838 |
| 84. | Union City | 46.7% | 18.4%(+28.2)#85 | 18.1%(+28.6)#3,912 |
| 85. | Clinton | 46.6% | 18.4%(+28.1)#86 | 18.1%(+28.5)#3,937 |
| 86. | Clay City | 46.4% | 18.4%(+28.0)#87 | 18.1%(+28.4)#3,952 |
| 87. | Kentland | 46.0% | 18.4%(+27.6)#88 | 18.1%(+27.9)#4,021 |
| 88. | Aurora | 45.8% | 18.4%(+27.4)#89 | 18.1%(+27.8)#4,039 |
| 89. | Homer | 45.2% | 18.4%(+26.7)#90 | 18.1%(+27.1)#4,123 |
| 90. | Winslow | 45.0% | 18.4%(+26.6)#91 | 18.1%(+26.9)#4,138 |
| 91. | Staunton | 44.8% | 18.4%(+26.4)#92 | 18.1%(+26.8)#4,167 |
| 92. | Richmond | 44.7% | 18.4%(+26.2)#93 | 18.1%(+26.6)#4,191 |
| 93. | Farmersburg | 43.8% | 18.4%(+25.3)#94 | 18.1%(+25.7)#4,317 |
| 94. | Kennard | 43.8% | 18.4%(+25.3)#95 | 18.1%(+25.7)#4,322 |
| 95. | Millersburg | 43.1% | 18.4%(+24.7)#96 | 18.1%(+25.0)#4,419 |
| 96. | Paragon | 42.9% | 18.4%(+24.4)#97 | 18.1%(+24.8)#4,455 |
| 97. | Connersville | 42.5% | 18.4%(+24.1)#98 | 18.1%(+24.5)#4,515 |
| 98. | Lake Station | 41.8% | 18.4%(+23.4)#99 | 18.1%(+23.8)#4,607 |
| 99. | Prince S Lakes | 41.7% | 18.4%(+23.2)#100 | 18.1%(+23.6)#4,630 |
| 100. | Leavenworth | 41.7% | 18.4%(+23.2)#101 | 18.1%(+23.6)#4,638 |
Common Questions
What are the Top 10 Cities with the Highest Poverty Level Among Children Under the Age of 5 in Indiana?
Top 10 Cities with the Highest Poverty Level Among Children Under the Age of 5 in Indiana are:
#1
100.0%
#2
100.0%
#3
100.0%
#4
100.0%
#5
100.0%
#6
100.0%
#7
100.0%
#8
100.0%
#9
100.0%
#10
100.0%
What city has the Highest Poverty Level Among Children Under the Age of 5 in Indiana?
Milroy has the Highest Poverty Level Among Children Under the Age of 5 in Indiana with 100.0%.
What is the Poverty Level Among Children Under the Age of 5 in the State of Indiana?
Poverty Level Among Children Under the Age of 5 in Indiana is 18.4%.
What is the Poverty Level Among Children Under the Age of 5 in the United States?
Poverty Level Among Children Under the Age of 5 in the United States is 18.1%.