Dobbins, CA Map & Demographics
Dobbins Map
Dobbins Overview
$27,949
PER CAPITA INCOME
$48,609
AVG FAMILY INCOME
$48,984
AVG HOUSEHOLD INCOME
0.38
INEQUALITY / GINI INDEX
420
TOTAL POPULATION
250
MALE POPULATION
170
FEMALE POPULATION
147.06
MALES / 100 FEMALES
68.00
FEMALES / 100 MALES
59.5
MEDIAN AGE
1.8
AVG FAMILY SIZE
2.0
AVG HOUSEHOLD SIZE
200
LABOR FORCE [ PEOPLE ]
51.0%
PERCENT IN LABOR FORCE
3.0%
UNEMPLOYMENT RATE
Dobbins Zip Codes
Dobbins Area Codes
Income in Dobbins
Income Overview in Dobbins
Per Capita Income in Dobbins is $27,949, while median incomes of families and households are $48,609 and $48,984 respectively.
| Characteristic | Number | Measure |
| Per Capita Income | 420 | $27,949 |
| Median Family Income | 171 | $48,609 |
| Mean Family Income | 171 | $57,833 |
| Median Household Income | 195 | $48,984 |
| Mean Household Income | 195 | $60,976 |
| Income Deficit | 171 | $0 |
| Wage / Income Gap (%) | 420 | 0.00% |
| Wage / Income Gap ($) | 420 | 100.00¢ per $1 |
| Gini / Inequality Index | 420 | 0.38 |
Earnings by Sex in Dobbins
| Sex | Number | Average Earnings |
| Male | 208 (88.1%) | $0 |
| Female | 28 (11.9%) | $0 |
| Total | 236 (100.0%) | $0 |
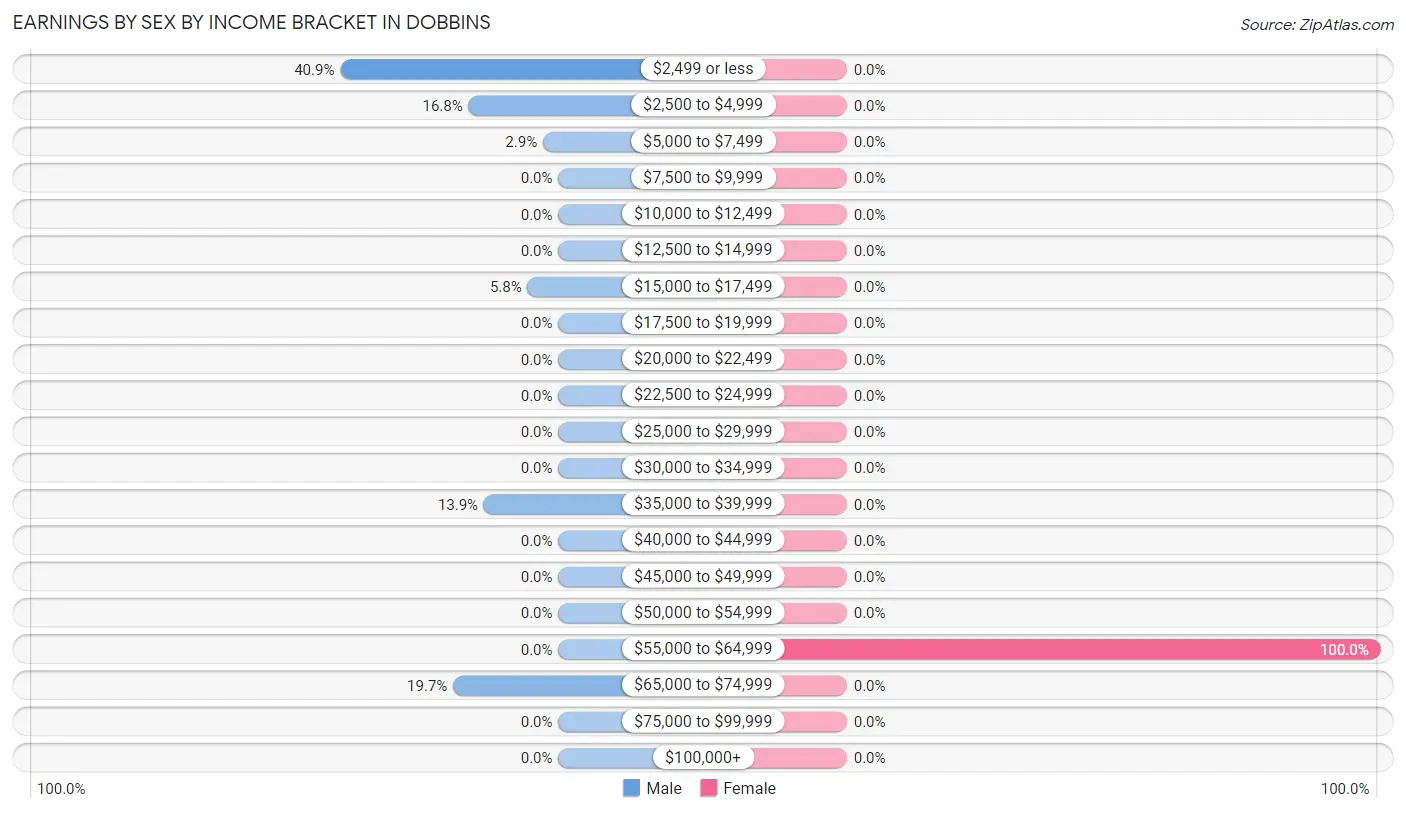
Earnings by Sex by Income Bracket in Dobbins
The most common earnings brackets in Dobbins are $2,499 or less for men (85 | 40.9%) and $55,000 to $64,999 for women (28 | 100.0%).
| Income | Male | Female |
| $2,499 or less | 85 (40.9%) | 0 (0.0%) |
| $2,500 to $4,999 | 35 (16.8%) | 0 (0.0%) |
| $5,000 to $7,499 | 6 (2.9%) | 0 (0.0%) |
| $7,500 to $9,999 | 0 (0.0%) | 0 (0.0%) |
| $10,000 to $12,499 | 0 (0.0%) | 0 (0.0%) |
| $12,500 to $14,999 | 0 (0.0%) | 0 (0.0%) |
| $15,000 to $17,499 | 12 (5.8%) | 0 (0.0%) |
| $17,500 to $19,999 | 0 (0.0%) | 0 (0.0%) |
| $20,000 to $22,499 | 0 (0.0%) | 0 (0.0%) |
| $22,500 to $24,999 | 0 (0.0%) | 0 (0.0%) |
| $25,000 to $29,999 | 0 (0.0%) | 0 (0.0%) |
| $30,000 to $34,999 | 0 (0.0%) | 0 (0.0%) |
| $35,000 to $39,999 | 29 (13.9%) | 0 (0.0%) |
| $40,000 to $44,999 | 0 (0.0%) | 0 (0.0%) |
| $45,000 to $49,999 | 0 (0.0%) | 0 (0.0%) |
| $50,000 to $54,999 | 0 (0.0%) | 0 (0.0%) |
| $55,000 to $64,999 | 0 (0.0%) | 28 (100.0%) |
| $65,000 to $74,999 | 41 (19.7%) | 0 (0.0%) |
| $75,000 to $99,999 | 0 (0.0%) | 0 (0.0%) |
| $100,000+ | 0 (0.0%) | 0 (0.0%) |
| Total | 208 (100.0%) | 28 (100.0%) |
Earnings by Sex by Educational Attainment in Dobbins
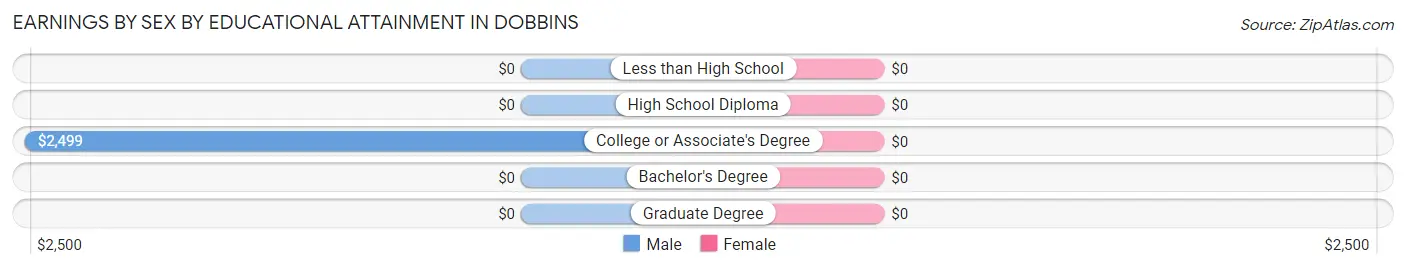
| Educational Attainment | Male Income | Female Income |
| Less than High School | - | - |
| High School Diploma | - | - |
| College or Associate's Degree | $2,499 | $0 |
| Bachelor's Degree | - | - |
| Graduate Degree | - | - |
| Total | - | - |
Family Income in Dobbins
Family Income Brackets in Dobbins
According to the Dobbins family income data, there are 80 families falling into the $35,000 to $49,999 income range, which is the most common income bracket and makes up 46.8% of all families.
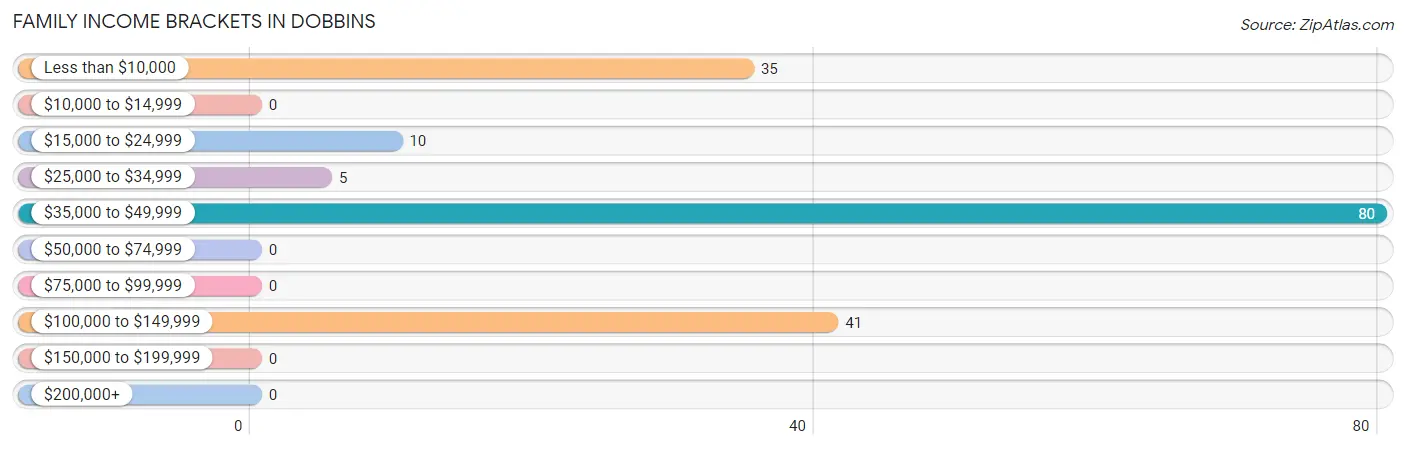
| Income Bracket | # Families | % Families |
| Less than $10,000 | 35 | 20.5% |
| $10,000 to $14,999 | 0 | 0.0% |
| $15,000 to $24,999 | 10 | 5.8% |
| $25,000 to $34,999 | 5 | 2.9% |
| $35,000 to $49,999 | 80 | 46.8% |
| $50,000 to $74,999 | 0 | 0.0% |
| $75,000 to $99,999 | 0 | 0.0% |
| $100,000 to $149,999 | 41 | 24.0% |
| $150,000 to $199,999 | 0 | 0.0% |
| $200,000+ | 0 | 0.0% |
Family Income by Famaliy Size in Dobbins
2-person families (171 | 100.0%) account for the highest median family income in Dobbins with $48,609 per family, while 2-person families (171 | 100.0%) have the highest median income of $24,304 per family member.
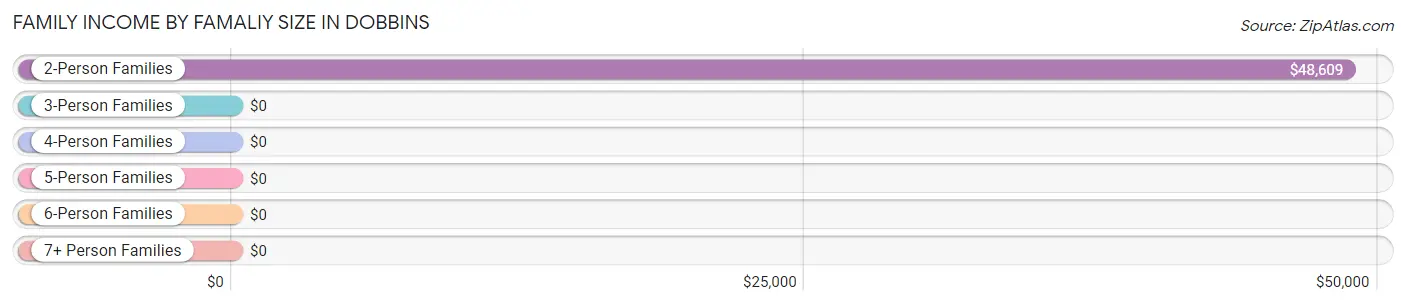
| Income Bracket | # Families | Median Income |
| 2-Person Families | 171 (100.0%) | $48,609 |
| 3-Person Families | 0 (0.0%) | $0 |
| 4-Person Families | 0 (0.0%) | $0 |
| 5-Person Families | 0 (0.0%) | $0 |
| 6-Person Families | 0 (0.0%) | $0 |
| 7+ Person Families | 0 (0.0%) | $0 |
| Total | 171 (100.0%) | $48,609 |
Family Income by Number of Earners in Dobbins
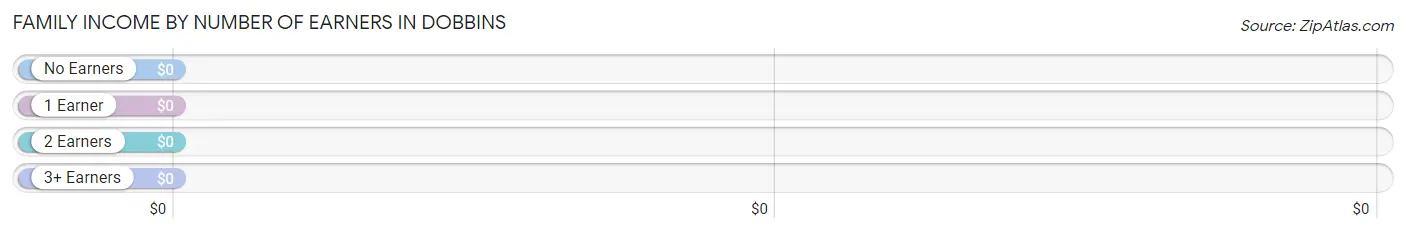
| Number of Earners | # Families | Median Income |
| No Earners | 15 (8.8%) | $0 |
| 1 Earner | 115 (67.2%) | $0 |
| 2 Earners | 41 (24.0%) | $0 |
| 3+ Earners | 0 (0.0%) | $0 |
| Total | 171 (100.0%) | $48,609 |
Household Income in Dobbins
Household Income Brackets in Dobbins
With 80 households falling in the category, the $35,000 to $49,999 income range is the most frequent in Dobbins, accounting for 41.0% of all households.
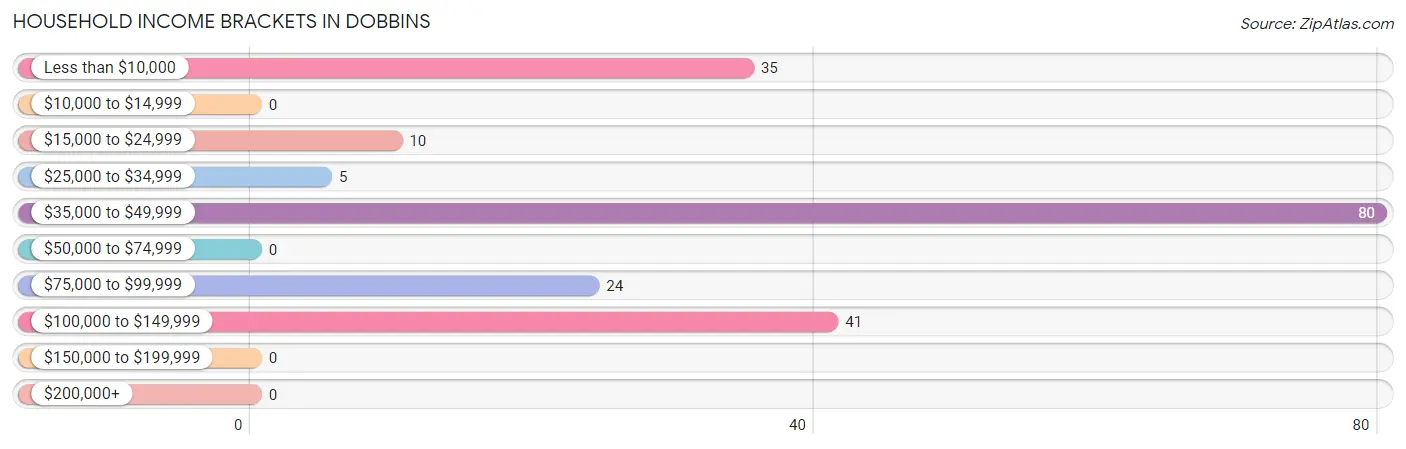
| Income Bracket | # Households | % Households |
| Less than $10,000 | 35 | 17.9% |
| $10,000 to $14,999 | 0 | 0.0% |
| $15,000 to $24,999 | 10 | 5.1% |
| $25,000 to $34,999 | 5 | 2.6% |
| $35,000 to $49,999 | 80 | 41.0% |
| $50,000 to $74,999 | 0 | 0.0% |
| $75,000 to $99,999 | 24 | 12.3% |
| $100,000 to $149,999 | 41 | 21.0% |
| $150,000 to $199,999 | 0 | 0.0% |
| $200,000+ | 0 | 0.0% |
Household Income by Householder Age in Dobbins
The median household income in Dobbins is $48,984, with the highest median household income of $130,213 found in the 45 to 64 years age bracket for the primary householder. A total of 75 households (38.5%) fall into this category.
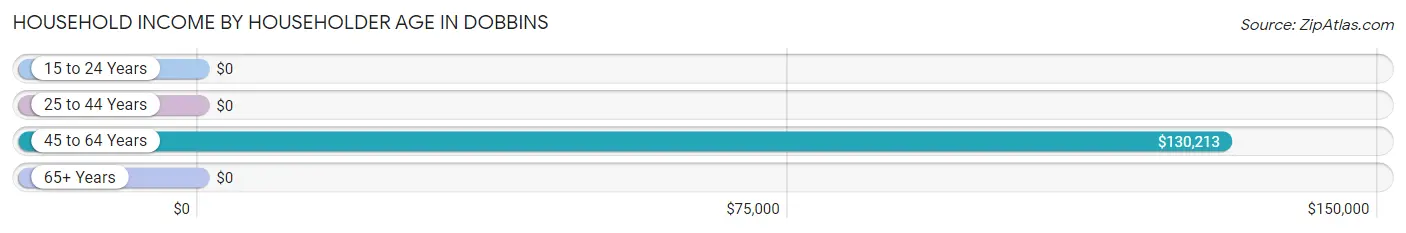
| Income Bracket | # Households | Median Income |
| 15 to 24 Years | 0 (0.0%) | $0 |
| 25 to 44 Years | 35 (17.9%) | $0 |
| 45 to 64 Years | 75 (38.5%) | $130,213 |
| 65+ Years | 85 (43.6%) | $0 |
| Total | 195 (100.0%) | $48,984 |
Poverty in Dobbins
Income Below Poverty by Sex and Age in Dobbins
With 27.2% poverty level for males and 18.2% for females among the residents of Dobbins, under 5 year old males and 18 to 24 year old females are the most vulnerable to poverty, with 28 males (100.0%) and 25 females (100.0%) in their respective age groups living below the poverty level.
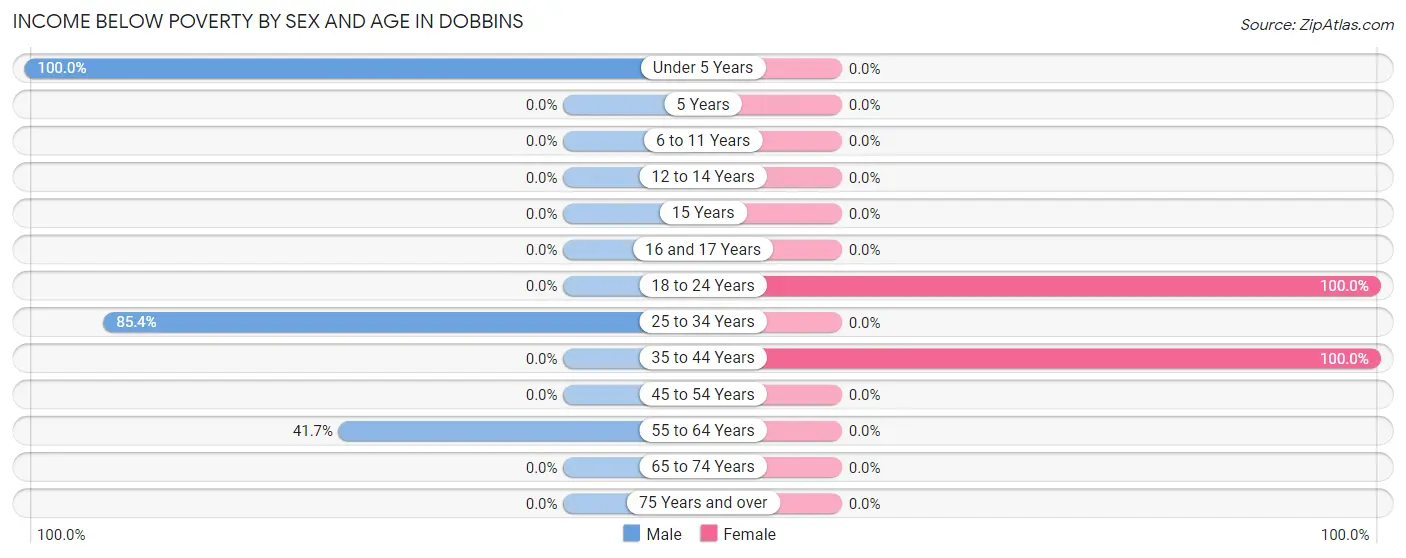
| Age Bracket | Male | Female |
| Under 5 Years | 28 (100.0%) | 0 (0.0%) |
| 5 Years | 0 (0.0%) | 0 (0.0%) |
| 6 to 11 Years | 0 (0.0%) | 0 (0.0%) |
| 12 to 14 Years | 0 (0.0%) | 0 (0.0%) |
| 15 Years | 0 (0.0%) | 0 (0.0%) |
| 16 and 17 Years | 0 (0.0%) | 0 (0.0%) |
| 18 to 24 Years | 0 (0.0%) | 25 (100.0%) |
| 25 to 34 Years | 35 (85.4%) | 0 (0.0%) |
| 35 to 44 Years | 0 (0.0%) | 6 (100.0%) |
| 45 to 54 Years | 0 (0.0%) | 0 (0.0%) |
| 55 to 64 Years | 5 (41.7%) | 0 (0.0%) |
| 65 to 74 Years | 0 (0.0%) | 0 (0.0%) |
| 75 Years and over | 0 (0.0%) | 0 (0.0%) |
| Total | 68 (27.2%) | 31 (18.2%) |
Income Above Poverty by Sex and Age in Dobbins
According to the poverty statistics in Dobbins, males aged 35 to 44 years and females aged 45 to 54 years are the age groups that are most secure financially, with 100.0% of males and 100.0% of females in these age groups living above the poverty line.
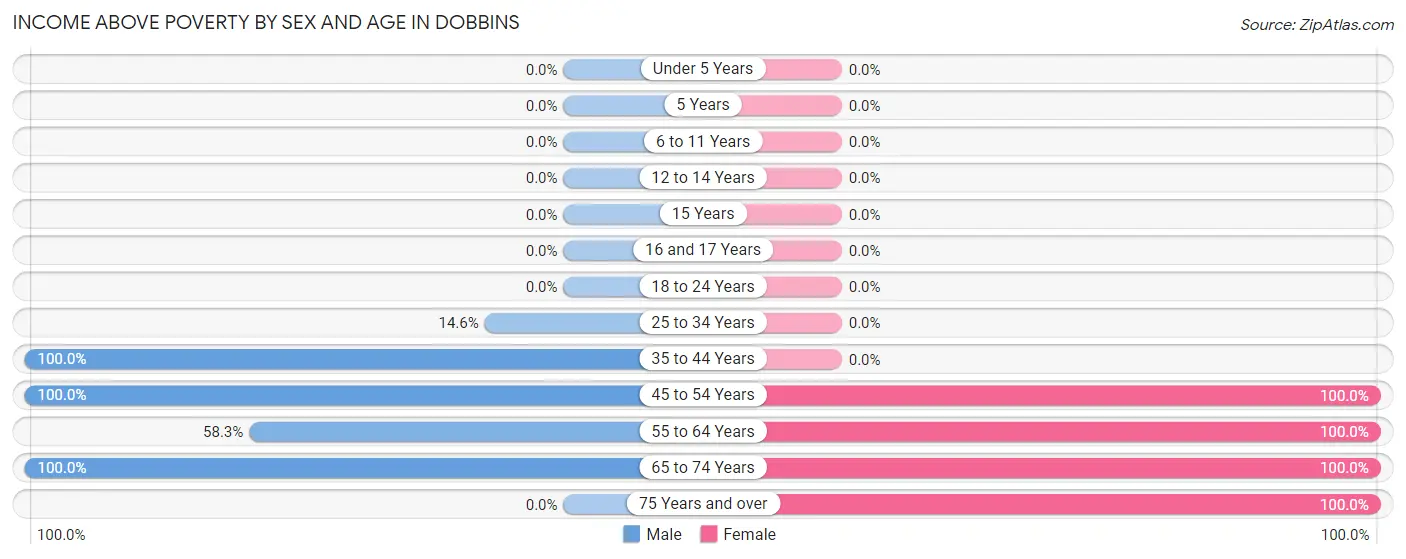
| Age Bracket | Male | Female |
| Under 5 Years | 0 (0.0%) | 0 (0.0%) |
| 5 Years | 0 (0.0%) | 0 (0.0%) |
| 6 to 11 Years | 0 (0.0%) | 0 (0.0%) |
| 12 to 14 Years | 0 (0.0%) | 0 (0.0%) |
| 15 Years | 0 (0.0%) | 0 (0.0%) |
| 16 and 17 Years | 0 (0.0%) | 0 (0.0%) |
| 18 to 24 Years | 0 (0.0%) | 0 (0.0%) |
| 25 to 34 Years | 6 (14.6%) | 0 (0.0%) |
| 35 to 44 Years | 29 (100.0%) | 0 (0.0%) |
| 45 to 54 Years | 41 (100.0%) | 28 (100.0%) |
| 55 to 64 Years | 7 (58.3%) | 34 (100.0%) |
| 65 to 74 Years | 99 (100.0%) | 5 (100.0%) |
| 75 Years and over | 0 (0.0%) | 72 (100.0%) |
| Total | 182 (72.8%) | 139 (81.8%) |
Income Below Poverty Among Married-Couple Families in Dobbins
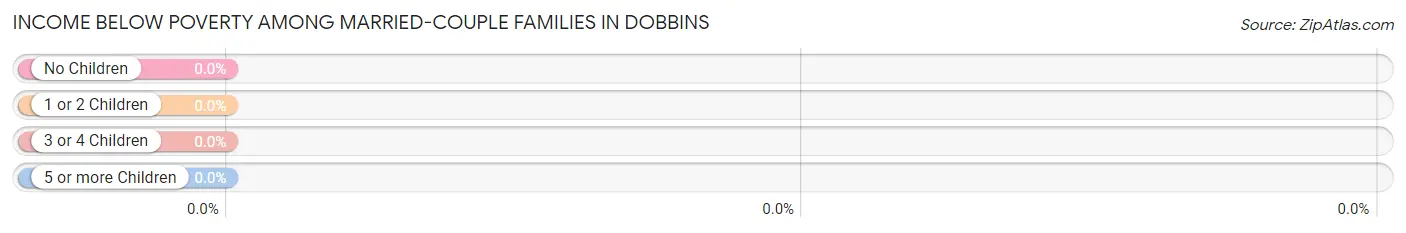
| Children | Above Poverty | Below Poverty |
| No Children | 136 (100.0%) | 0 (0.0%) |
| 1 or 2 Children | 0 (0.0%) | 0 (0.0%) |
| 3 or 4 Children | 0 (0.0%) | 0 (0.0%) |
| 5 or more Children | 0 (0.0%) | 0 (0.0%) |
| Total | 136 (100.0%) | 0 (0.0%) |
Income Below Poverty Among Single-Parent Households in Dobbins
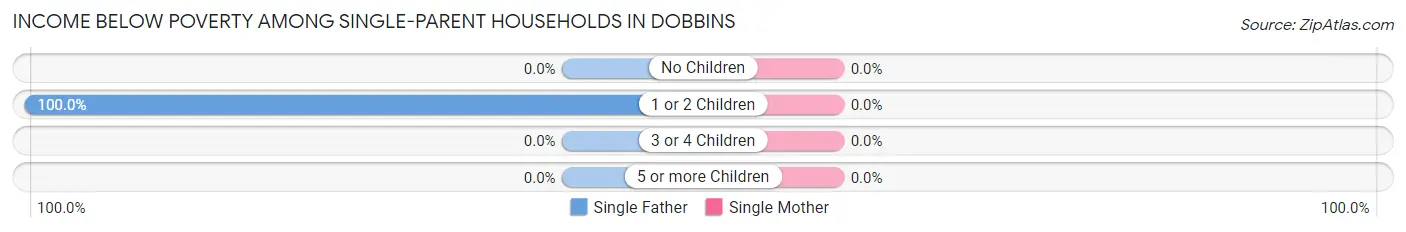
| Children | Single Father | Single Mother |
| No Children | 0 (0.0%) | 0 (0.0%) |
| 1 or 2 Children | 35 (100.0%) | 0 (0.0%) |
| 3 or 4 Children | 0 (0.0%) | 0 (0.0%) |
| 5 or more Children | 0 (0.0%) | 0 (0.0%) |
| Total | 35 (100.0%) | 0 (0.0%) |
Income Below Poverty Among Married-Couple vs Single-Parent Households in Dobbins
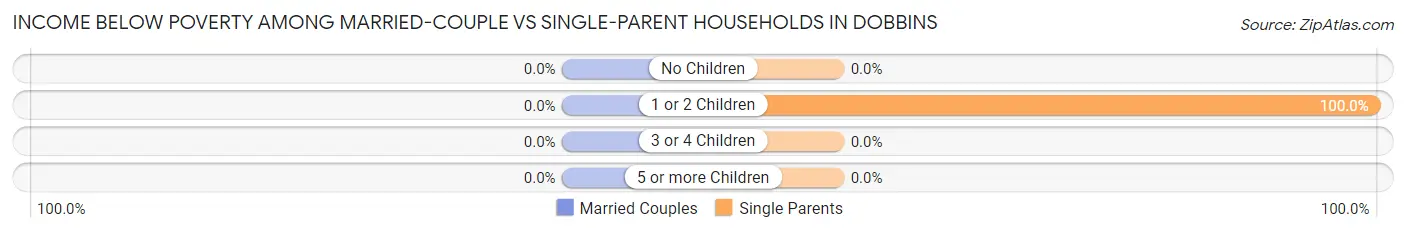
| Children | Married-Couple Families | Single-Parent Households |
| No Children | 0 (0.0%) | 0 (0.0%) |
| 1 or 2 Children | 0 (0.0%) | 35 (100.0%) |
| 3 or 4 Children | 0 (0.0%) | 0 (0.0%) |
| 5 or more Children | 0 (0.0%) | 0 (0.0%) |
| Total | 0 (0.0%) | 35 (100.0%) |
Race in Dobbins
The most populous races in Dobbins are White / Caucasian (414 | 98.6%), Hispanic or Latino (6 | 1.4%), and Some other Race (6 | 1.4%).
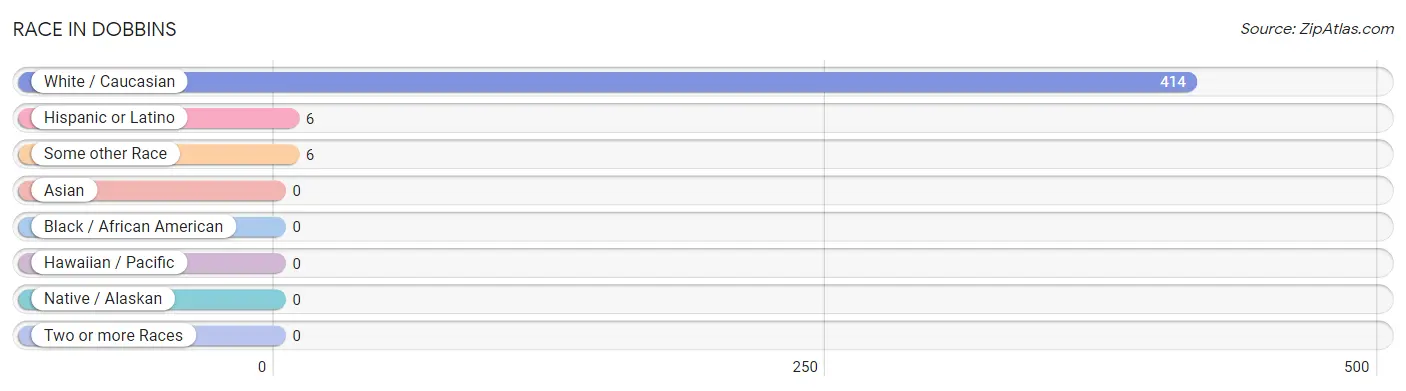
| Race | # Population | % Population |
| Asian | 0 | 0.0% |
| Black / African American | 0 | 0.0% |
| Hawaiian / Pacific | 0 | 0.0% |
| Hispanic or Latino | 6 | 1.4% |
| Native / Alaskan | 0 | 0.0% |
| White / Caucasian | 414 | 98.6% |
| Two or more Races | 0 | 0.0% |
| Some other Race | 6 | 1.4% |
| Total | 420 | 100.0% |
Ancestry in Dobbins
The most populous ancestries reported in Dobbins are Irish (109 | 26.0%), Polish (80 | 19.1%), Scandinavian (72 | 17.1%), Scotch-Irish (72 | 17.1%), and American (69 | 16.4%), together accounting for 95.7% of all Dobbins residents.
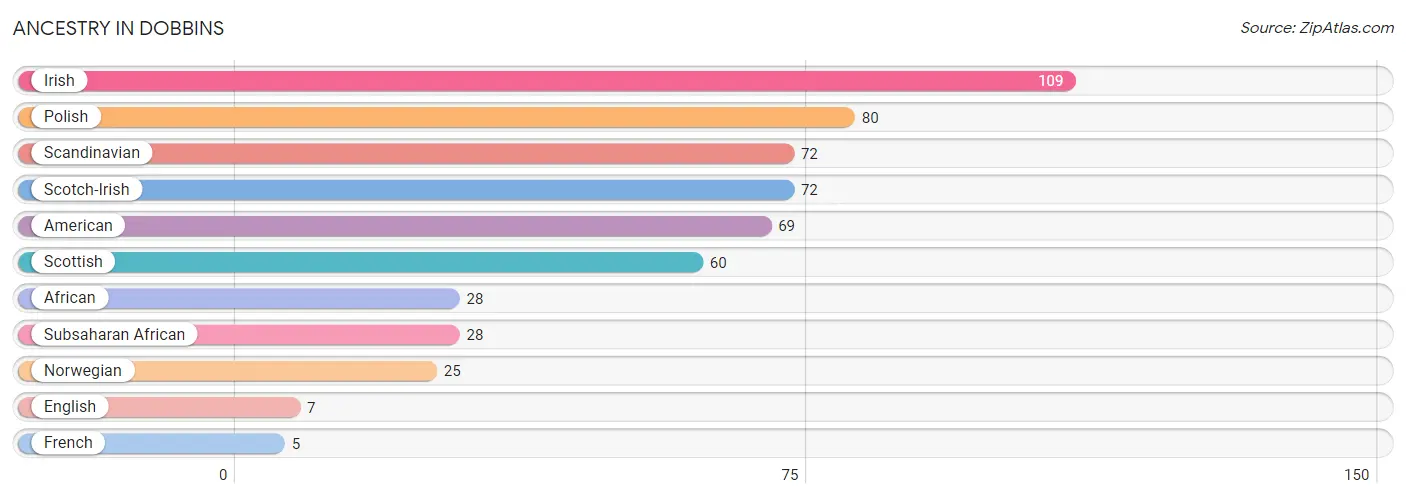
| Ancestry | # Population | % Population |
| African | 28 | 6.7% |
| American | 69 | 16.4% |
| English | 7 | 1.7% |
| French | 5 | 1.2% |
| Irish | 109 | 26.0% |
| Norwegian | 25 | 5.9% |
| Polish | 80 | 19.1% |
| Scandinavian | 72 | 17.1% |
| Scotch-Irish | 72 | 17.1% |
| Scottish | 60 | 14.3% |
| Subsaharan African | 28 | 6.7% | View All 11 Rows |
Immigrants in Dobbins

| Immigration Origin | # Population | % Population | View All 0 Rows |
Sex and Age in Dobbins
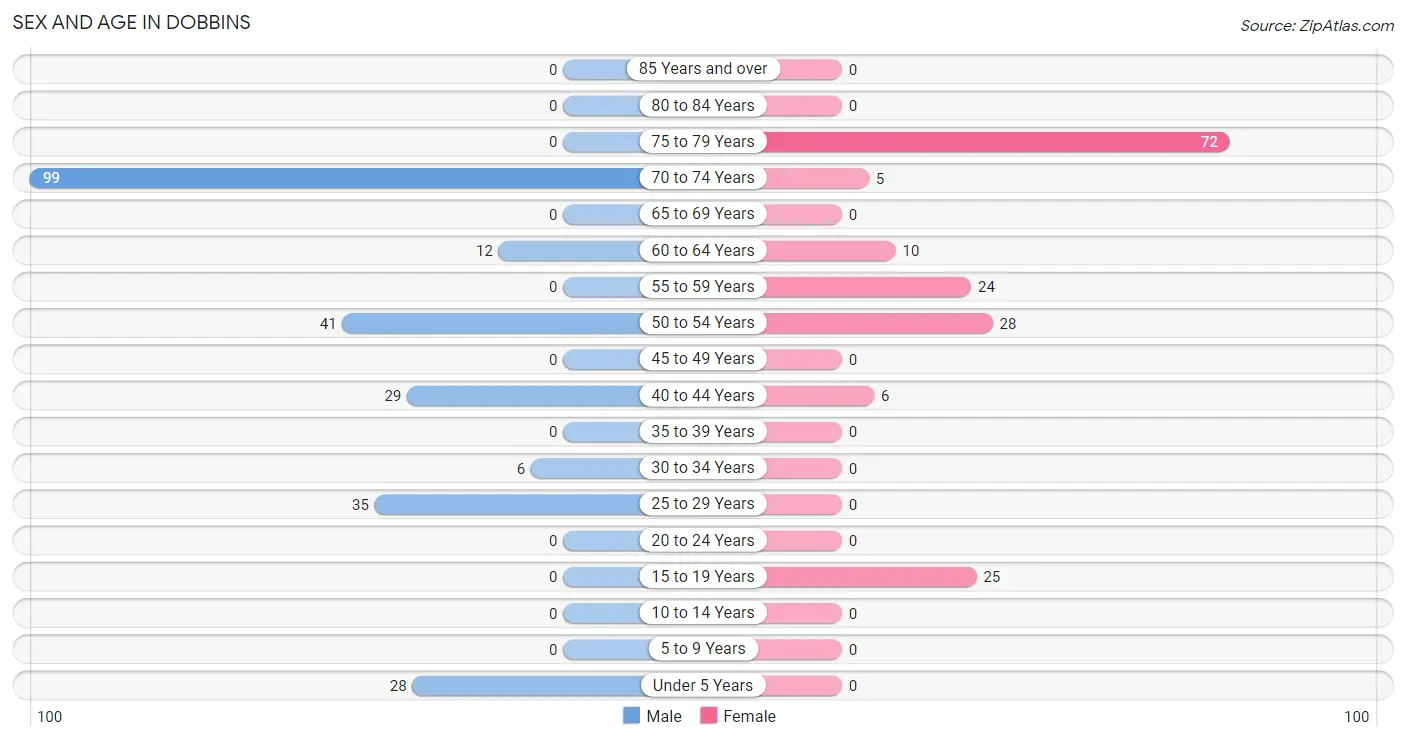
Sex and Age in Dobbins
The most populous age groups in Dobbins are 70 to 74 Years (99 | 39.6%) for men and 75 to 79 Years (72 | 42.3%) for women.
| Age Bracket | Male | Female |
| Under 5 Years | 28 (11.2%) | 0 (0.0%) |
| 5 to 9 Years | 0 (0.0%) | 0 (0.0%) |
| 10 to 14 Years | 0 (0.0%) | 0 (0.0%) |
| 15 to 19 Years | 0 (0.0%) | 25 (14.7%) |
| 20 to 24 Years | 0 (0.0%) | 0 (0.0%) |
| 25 to 29 Years | 35 (14.0%) | 0 (0.0%) |
| 30 to 34 Years | 6 (2.4%) | 0 (0.0%) |
| 35 to 39 Years | 0 (0.0%) | 0 (0.0%) |
| 40 to 44 Years | 29 (11.6%) | 6 (3.5%) |
| 45 to 49 Years | 0 (0.0%) | 0 (0.0%) |
| 50 to 54 Years | 41 (16.4%) | 28 (16.5%) |
| 55 to 59 Years | 0 (0.0%) | 24 (14.1%) |
| 60 to 64 Years | 12 (4.8%) | 10 (5.9%) |
| 65 to 69 Years | 0 (0.0%) | 0 (0.0%) |
| 70 to 74 Years | 99 (39.6%) | 5 (2.9%) |
| 75 to 79 Years | 0 (0.0%) | 72 (42.3%) |
| 80 to 84 Years | 0 (0.0%) | 0 (0.0%) |
| 85 Years and over | 0 (0.0%) | 0 (0.0%) |
| Total | 250 (100.0%) | 170 (100.0%) |
Families and Households in Dobbins
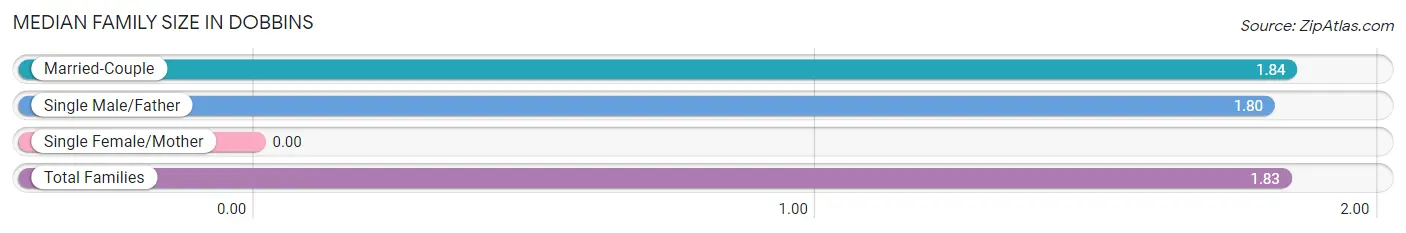
Median Family Size in Dobbins
| Family Type | # Families | Family Size |
| Married-Couple | 136 (79.5%) | 1.84 |
| Single Male/Father | 35 (20.5%) | 1.80 |
| Single Female/Mother | 0 (0.0%) | - |
| Total Families | 171 (100.0%) | 1.83 |
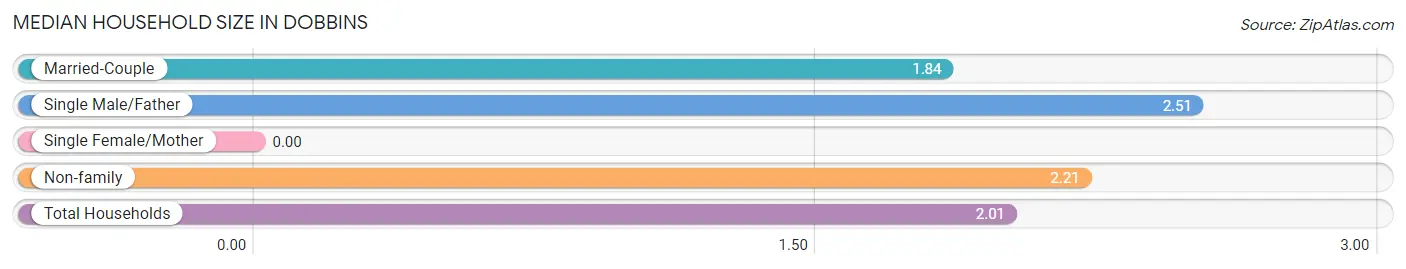
Median Household Size in Dobbins
| Household Type | # Households | Household Size |
| Married-Couple | 136 (69.7%) | 1.84 |
| Single Male/Father | 35 (17.9%) | 2.51 |
| Single Female/Mother | 0 (0.0%) | - |
| Non-family | 24 (12.3%) | 2.21 |
| Total Households | 195 (100.0%) | 2.01 |
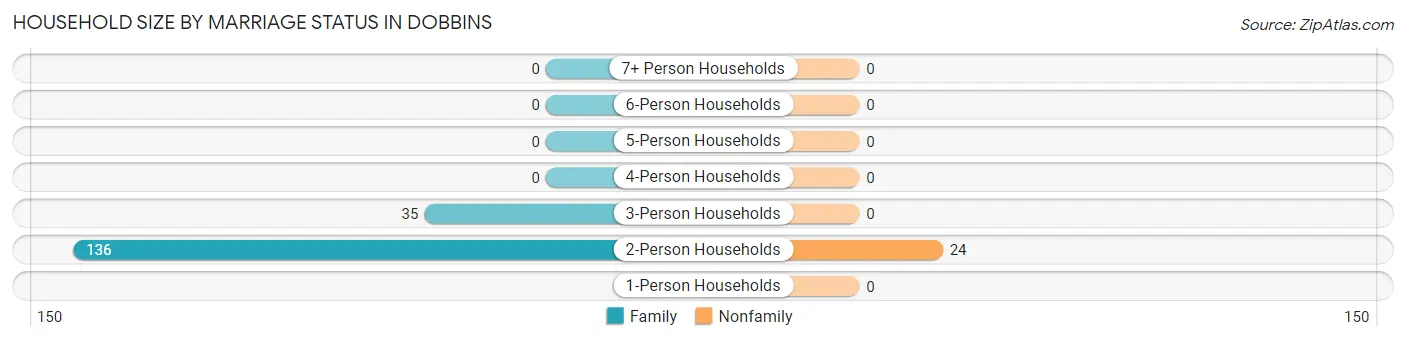
Household Size by Marriage Status in Dobbins
Out of a total of 195 households in Dobbins, 171 (87.7%) are family households, while 24 (12.3%) are nonfamily households. The most numerous type of family households are 2-person households, comprising 136, and the most common type of nonfamily households are 2-person households, comprising 24.
| Household Size | Family Households | Nonfamily Households |
| 1-Person Households | - | 0 (0.0%) |
| 2-Person Households | 136 (69.7%) | 24 (12.3%) |
| 3-Person Households | 35 (17.9%) | 0 (0.0%) |
| 4-Person Households | 0 (0.0%) | 0 (0.0%) |
| 5-Person Households | 0 (0.0%) | 0 (0.0%) |
| 6-Person Households | 0 (0.0%) | 0 (0.0%) |
| 7+ Person Households | 0 (0.0%) | 0 (0.0%) |
| Total | 171 (87.7%) | 24 (12.3%) |
Female Fertility in Dobbins
Fertility by Age in Dobbins
| Age Bracket | Women with Births | Births / 1,000 Women |
| 15 to 19 years | 0 (0.0%) | 0.0 |
| 20 to 34 years | 0 (0.0%) | 0.0 |
| 35 to 50 years | 0 (0.0%) | 0.0 |
| Total | 0 (0.0%) | 0.0 |
Fertility by Age by Marriage Status in Dobbins
| Age Bracket | Married | Unmarried |
| 15 to 19 years | 0 (0.0%) | 0 (0.0%) |
| 20 to 34 years | 0 (0.0%) | 0 (0.0%) |
| 35 to 50 years | 0 (0.0%) | 0 (0.0%) |
| Total | 0 (0.0%) | 0 (0.0%) |
Fertility by Education in Dobbins
| Educational Attainment | Women with Births | Births / 1,000 Women |
| Less than High School | 0 (0.0%) | 0.0 |
| High School Diploma | 0 (0.0%) | 0.0 |
| College or Associate's Degree | 0 (0.0%) | 0.0 |
| Bachelor's Degree | 0 (0.0%) | 0.0 |
| Graduate Degree | 0 (0.0%) | 0.0 |
| Total | 0 (0.0%) | 0.0 |
Fertility by Education by Marriage Status in Dobbins
| Educational Attainment | Married | Unmarried |
| Less than High School | 0 (0.0%) | 0 (0.0%) |
| High School Diploma | 0 (0.0%) | 0 (0.0%) |
| College or Associate's Degree | 0 (0.0%) | 0 (0.0%) |
| Bachelor's Degree | 0 (0.0%) | 0 (0.0%) |
| Graduate Degree | 0 (0.0%) | 0 (0.0%) |
| Total | 0 (0.0%) | 0 (0.0%) |
Employment Characteristics in Dobbins
Employment by Class of Employer in Dobbins
Among the 194 employed individuals in Dobbins, not-for-profit organizations (113 | 58.3%), private company employees (46 | 23.7%), and self-employed (not incorporated) (35 | 18.0%) make up the most common classes of employment.
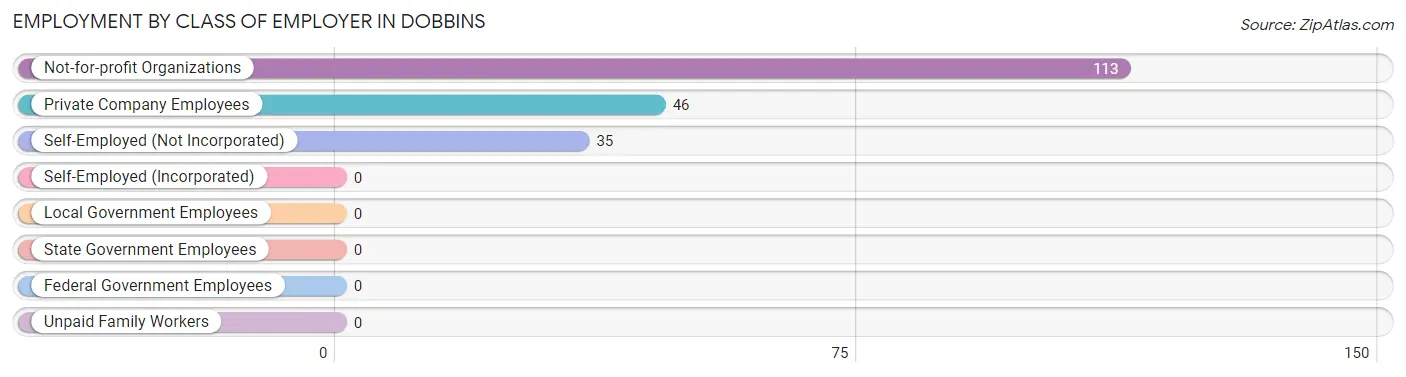
| Employer Class | # Employees | % Employees |
| Private Company Employees | 46 | 23.7% |
| Self-Employed (Incorporated) | 0 | 0.0% |
| Self-Employed (Not Incorporated) | 35 | 18.0% |
| Not-for-profit Organizations | 113 | 58.3% |
| Local Government Employees | 0 | 0.0% |
| State Government Employees | 0 | 0.0% |
| Federal Government Employees | 0 | 0.0% |
| Unpaid Family Workers | 0 | 0.0% |
| Total | 194 | 100.0% |
Employment Status by Age in Dobbins
According to the labor force statistics for Dobbins, out of the total population over 16 years of age (392), 51.0% or 200 individuals are in the labor force, with 3.0% or 6 of them unemployed. The age group with the highest labor force participation rate is 25 to 29 years, with 100.0% or 35 individuals in the labor force. Within the labor force, the 30 to 34 years age range has the highest percentage of unemployed individuals, with 100.0% or 6 of them being unemployed.
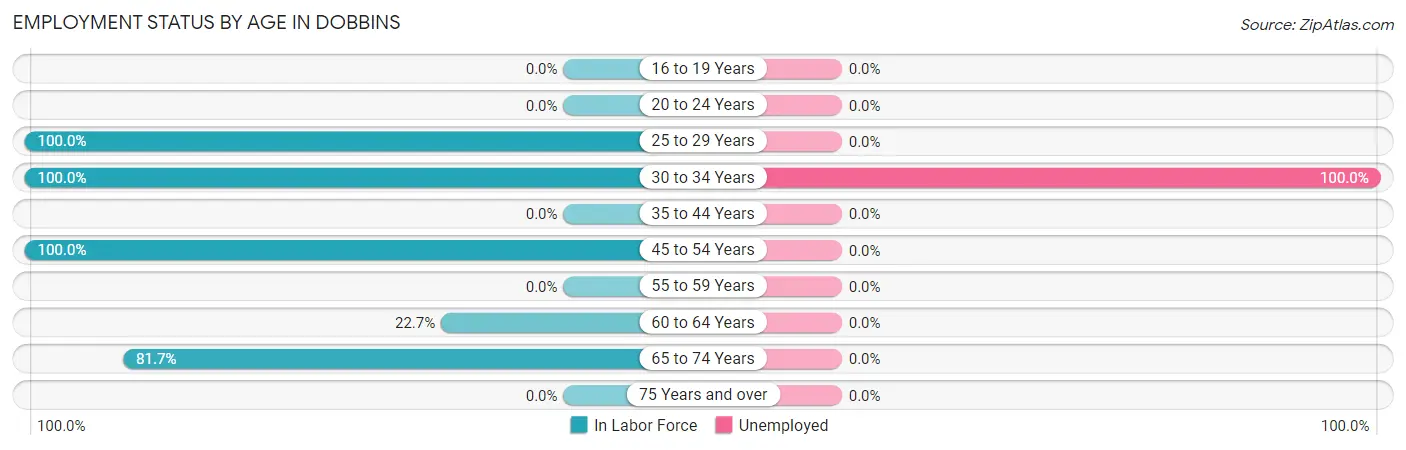
| Age Bracket | In Labor Force | Unemployed |
| 16 to 19 Years | 0 (0.0%) | 0 (0.0%) |
| 20 to 24 Years | 0 (0.0%) | 0 (0.0%) |
| 25 to 29 Years | 35 (100.0%) | 0 (0.0%) |
| 30 to 34 Years | 6 (100.0%) | 6 (100.0%) |
| 35 to 44 Years | 0 (0.0%) | 0 (0.0%) |
| 45 to 54 Years | 69 (100.0%) | 0 (0.0%) |
| 55 to 59 Years | 0 (0.0%) | 0 (0.0%) |
| 60 to 64 Years | 5 (22.7%) | 0 (0.0%) |
| 65 to 74 Years | 85 (81.7%) | 0 (0.0%) |
| 75 Years and over | 0 (0.0%) | 0 (0.0%) |
| Total | 200 (51.0%) | 6 (3.0%) |
Employment Status by Educational Attainment in Dobbins
According to labor force statistics for Dobbins, 60.2% of individuals (115) out of the total population between 25 and 64 years of age (191) are in the labor force, with 5.2% or 6 of them being unemployed. The group with the highest labor force participation rate are those with the educational attainment of less than high school, with 100.0% or 6 individuals in the labor force. Within the labor force, individuals with less than high school education have the highest percentage of unemployment, with 100.0% or 6 of them being unemployed.
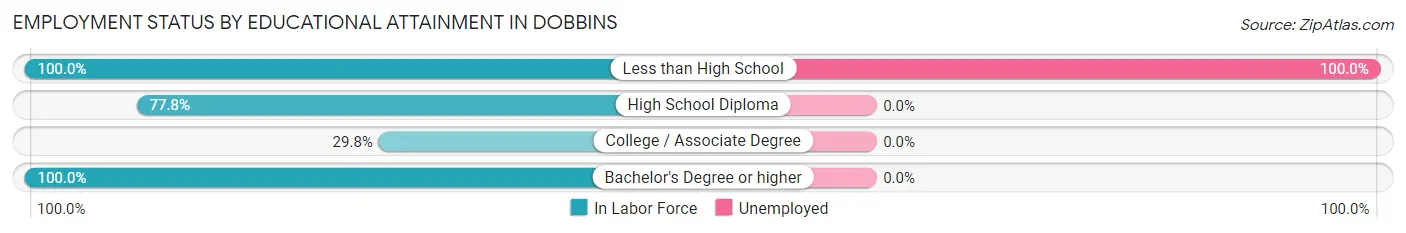
| Educational Attainment | In Labor Force | Unemployed |
| Less than High School | 6 (100.0%) | 6 (100.0%) |
| High School Diploma | 35 (77.8%) | 0 (0.0%) |
| College / Associate Degree | 28 (29.8%) | 0 (0.0%) |
| Bachelor's Degree or higher | 46 (100.0%) | 0 (0.0%) |
| Total | 115 (60.2%) | 10 (5.2%) |
Employment Occupations by Sex in Dobbins
Management, Business, Science and Arts Occupations
The most common Management, Business, Science and Arts occupations in Dobbins are Management (35 | 18.0%), Community & Social Service (28 | 14.4%), and Education Instruction & Library (28 | 14.4%).
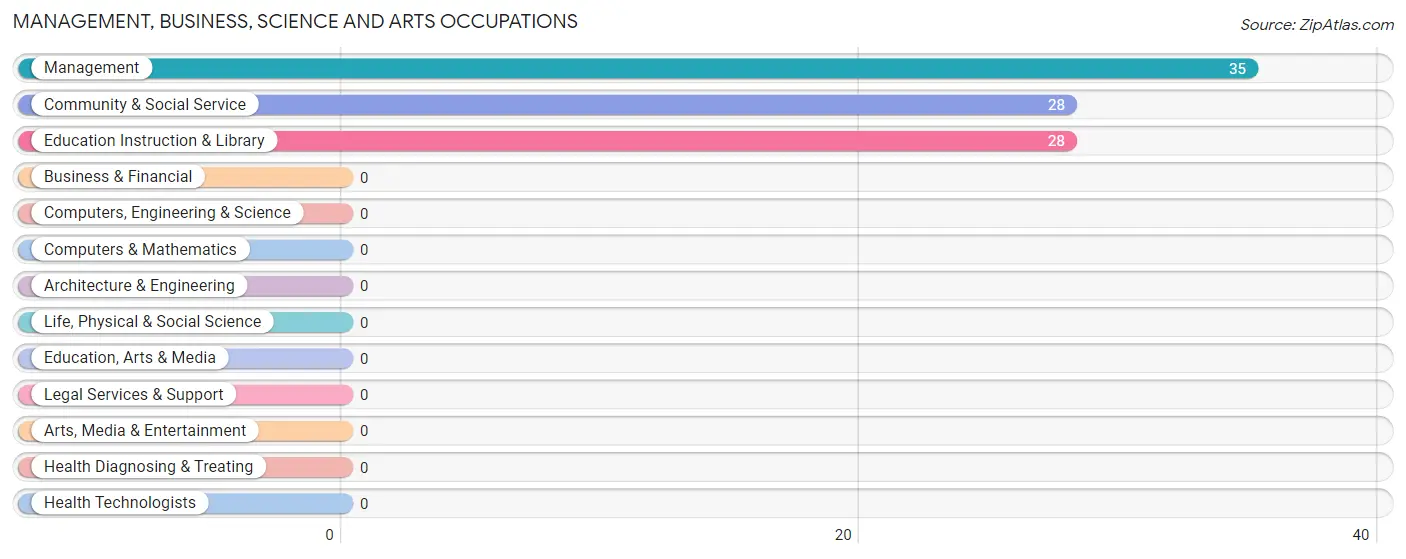
Management, Business, Science and Arts Occupations by Sex
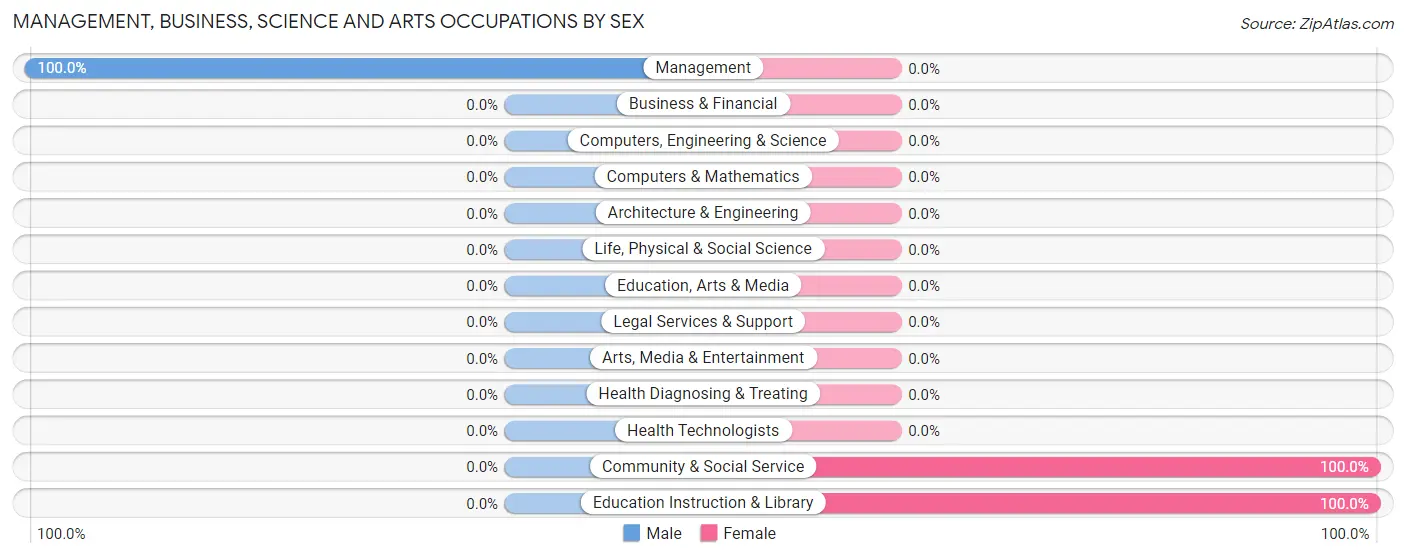
| Occupation | Male | Female |
| Management | 35 (100.0%) | 0 (0.0%) |
| Business & Financial | 0 (0.0%) | 0 (0.0%) |
| Computers, Engineering & Science | 0 (0.0%) | 0 (0.0%) |
| Computers & Mathematics | 0 (0.0%) | 0 (0.0%) |
| Architecture & Engineering | 0 (0.0%) | 0 (0.0%) |
| Life, Physical & Social Science | 0 (0.0%) | 0 (0.0%) |
| Community & Social Service | 0 (0.0%) | 28 (100.0%) |
| Education, Arts & Media | 0 (0.0%) | 0 (0.0%) |
| Legal Services & Support | 0 (0.0%) | 0 (0.0%) |
| Education Instruction & Library | 0 (0.0%) | 28 (100.0%) |
| Arts, Media & Entertainment | 0 (0.0%) | 0 (0.0%) |
| Health Diagnosing & Treating | 0 (0.0%) | 0 (0.0%) |
| Health Technologists | 0 (0.0%) | 0 (0.0%) |
| Total (Category) | 35 (55.6%) | 28 (44.4%) |
| Total (Overall) | 166 (85.6%) | 28 (14.4%) |
Services Occupations
The most common Services occupations in Dobbins are , and Food Preparation & Serving (5 | 2.6%).
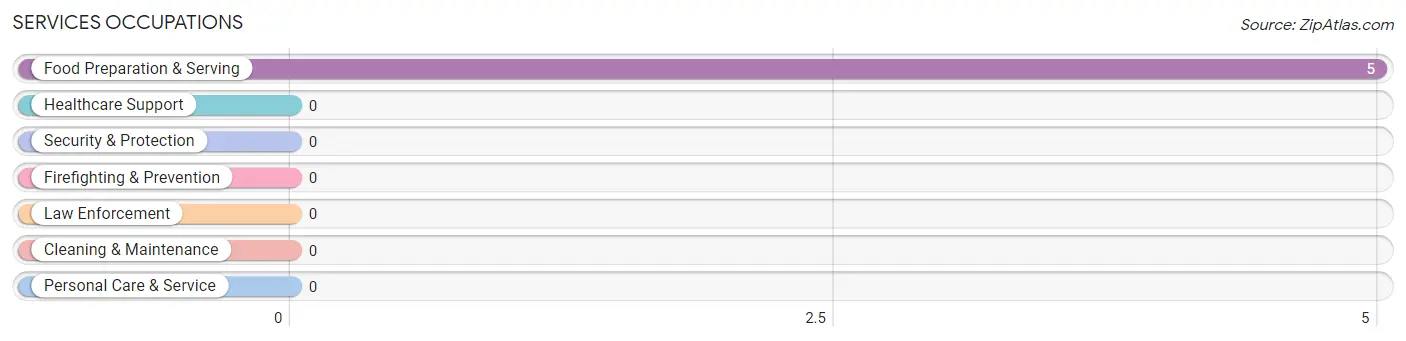
Services Occupations by Sex
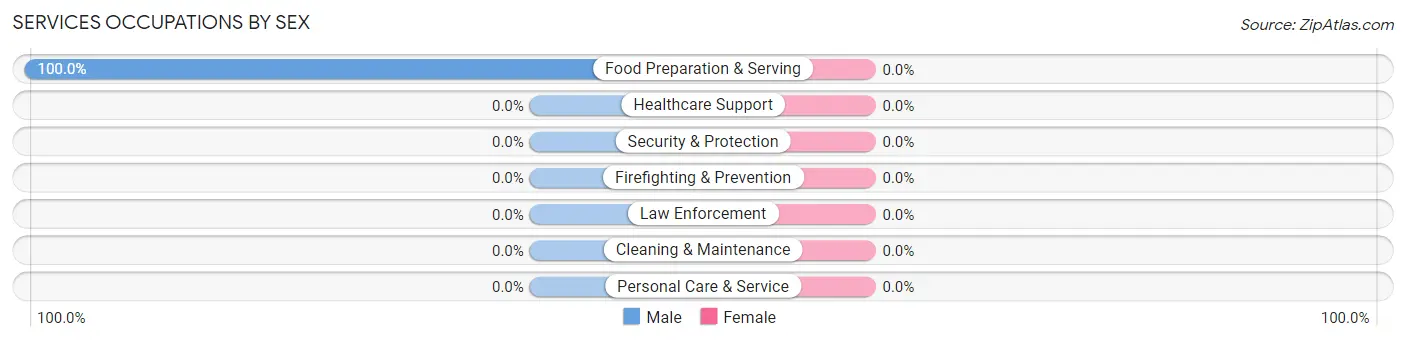
| Occupation | Male | Female |
| Healthcare Support | 0 (0.0%) | 0 (0.0%) |
| Security & Protection | 0 (0.0%) | 0 (0.0%) |
| Firefighting & Prevention | 0 (0.0%) | 0 (0.0%) |
| Law Enforcement | 0 (0.0%) | 0 (0.0%) |
| Food Preparation & Serving | 5 (100.0%) | 0 (0.0%) |
| Cleaning & Maintenance | 0 (0.0%) | 0 (0.0%) |
| Personal Care & Service | 0 (0.0%) | 0 (0.0%) |
| Total (Category) | 5 (100.0%) | 0 (0.0%) |
| Total (Overall) | 166 (85.6%) | 28 (14.4%) |
Sales and Office Occupations
The most common Sales and Office occupations in Dobbins are , and Office & Administration (80 | 41.2%).
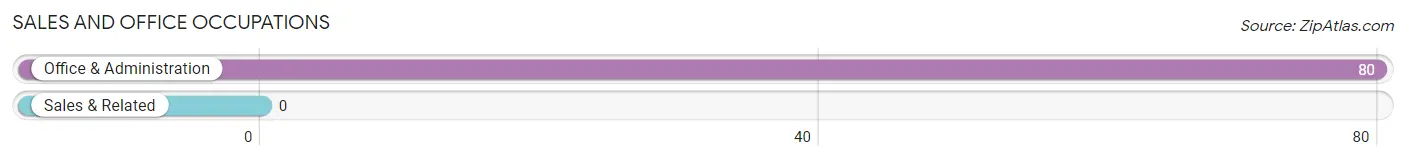
Sales and Office Occupations by Sex
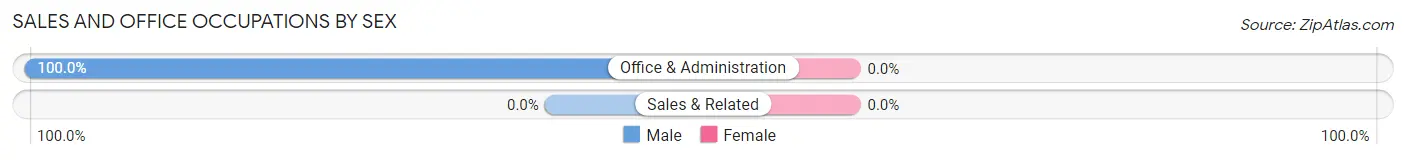
| Occupation | Male | Female |
| Sales & Related | 0 (0.0%) | 0 (0.0%) |
| Office & Administration | 80 (100.0%) | 0 (0.0%) |
| Total (Category) | 80 (100.0%) | 0 (0.0%) |
| Total (Overall) | 166 (85.6%) | 28 (14.4%) |
Natural Resources, Construction and Maintenance Occupations
The most common Natural Resources, Construction and Maintenance occupations in Dobbins are , and Construction & Extraction (5 | 2.6%).
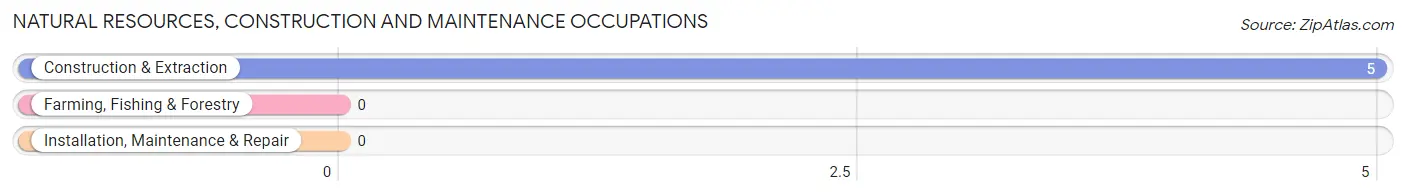
Natural Resources, Construction and Maintenance Occupations by Sex
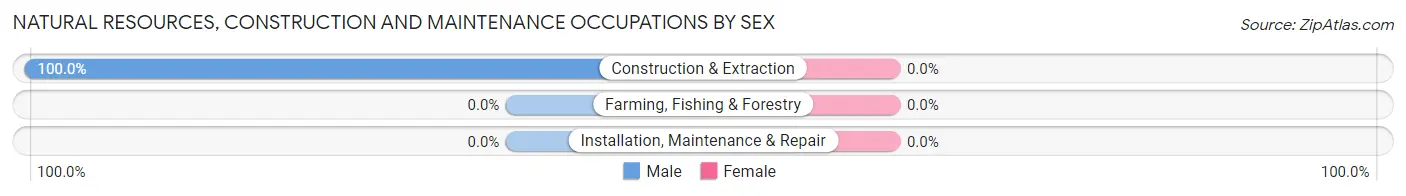
| Occupation | Male | Female |
| Farming, Fishing & Forestry | 0 (0.0%) | 0 (0.0%) |
| Construction & Extraction | 5 (100.0%) | 0 (0.0%) |
| Installation, Maintenance & Repair | 0 (0.0%) | 0 (0.0%) |
| Total (Category) | 5 (100.0%) | 0 (0.0%) |
| Total (Overall) | 166 (85.6%) | 28 (14.4%) |
Production, Transportation and Moving Occupations
The most common Production, Transportation and Moving occupations in Dobbins are , and Material Moving (41 | 21.1%).
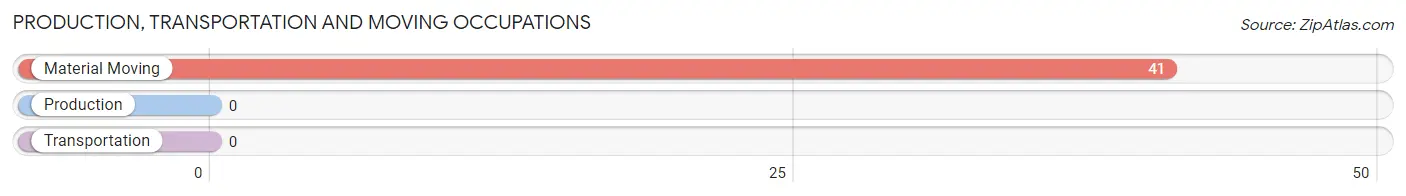
Production, Transportation and Moving Occupations by Sex
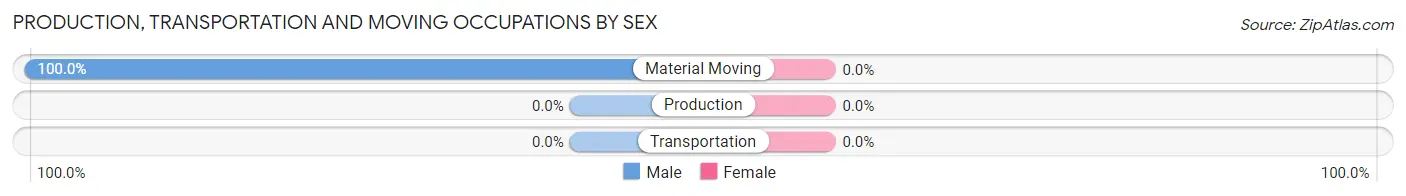
| Occupation | Male | Female |
| Production | 0 (0.0%) | 0 (0.0%) |
| Transportation | 0 (0.0%) | 0 (0.0%) |
| Material Moving | 41 (100.0%) | 0 (0.0%) |
| Total (Category) | 41 (100.0%) | 0 (0.0%) |
| Total (Overall) | 166 (85.6%) | 28 (14.4%) |
Employment Industries by Sex in Dobbins
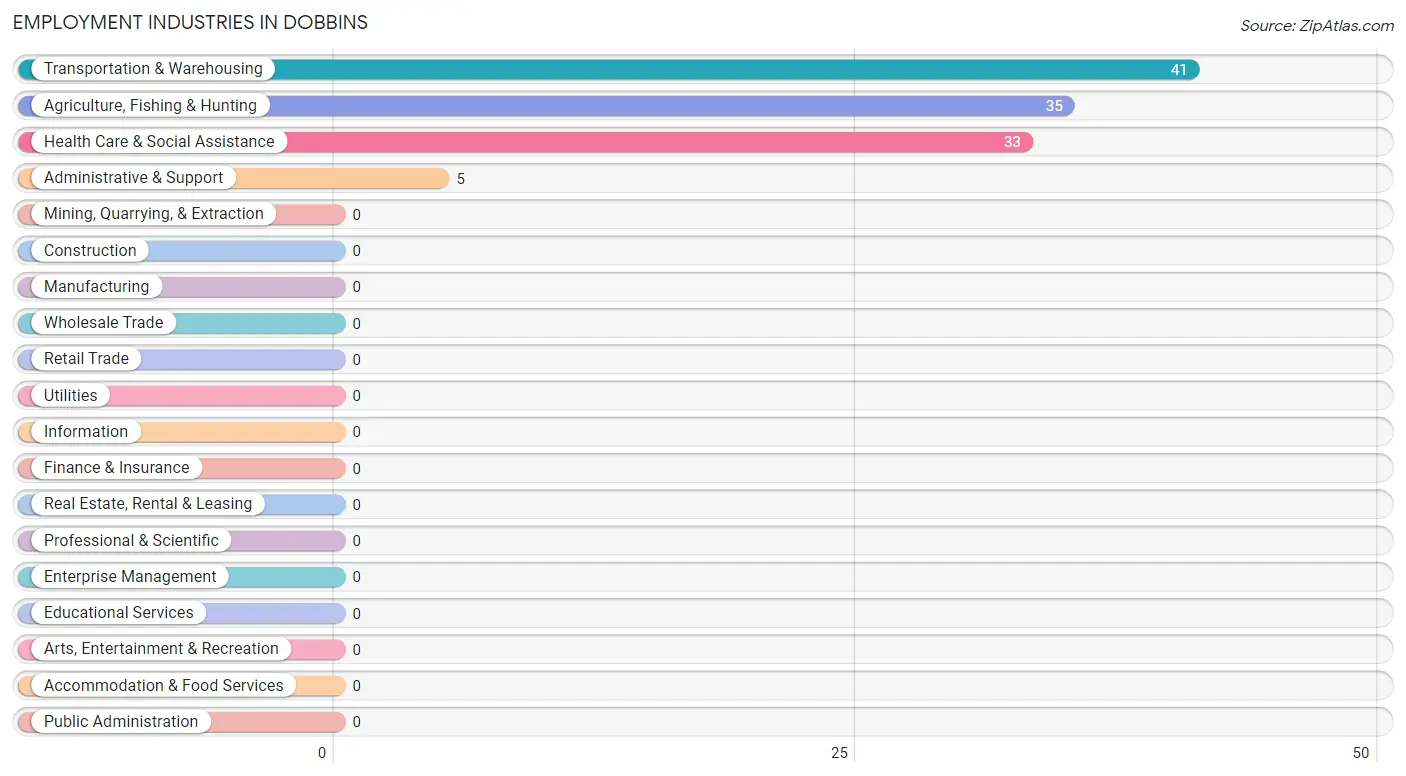
Employment Industries in Dobbins
The major employment industries in Dobbins include Transportation & Warehousing (41 | 21.1%), Agriculture, Fishing & Hunting (35 | 18.0%), Health Care & Social Assistance (33 | 17.0%), and Administrative & Support (5 | 2.6%).
Employment Industries by Sex in Dobbins
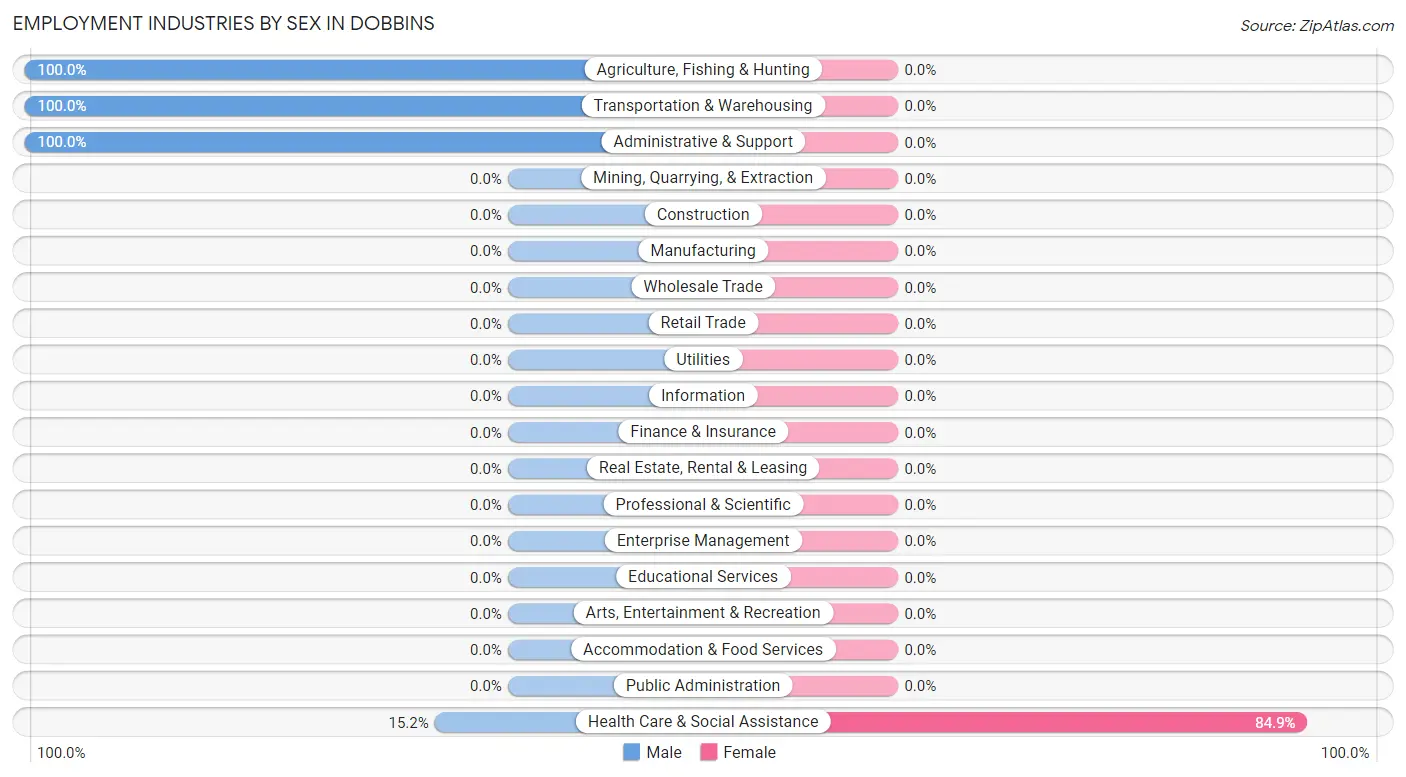
| Industry | Male | Female |
| Agriculture, Fishing & Hunting | 35 (100.0%) | 0 (0.0%) |
| Mining, Quarrying, & Extraction | 0 (0.0%) | 0 (0.0%) |
| Construction | 0 (0.0%) | 0 (0.0%) |
| Manufacturing | 0 (0.0%) | 0 (0.0%) |
| Wholesale Trade | 0 (0.0%) | 0 (0.0%) |
| Retail Trade | 0 (0.0%) | 0 (0.0%) |
| Transportation & Warehousing | 41 (100.0%) | 0 (0.0%) |
| Utilities | 0 (0.0%) | 0 (0.0%) |
| Information | 0 (0.0%) | 0 (0.0%) |
| Finance & Insurance | 0 (0.0%) | 0 (0.0%) |
| Real Estate, Rental & Leasing | 0 (0.0%) | 0 (0.0%) |
| Professional & Scientific | 0 (0.0%) | 0 (0.0%) |
| Enterprise Management | 0 (0.0%) | 0 (0.0%) |
| Administrative & Support | 5 (100.0%) | 0 (0.0%) |
| Educational Services | 0 (0.0%) | 0 (0.0%) |
| Health Care & Social Assistance | 5 (15.1%) | 28 (84.9%) |
| Arts, Entertainment & Recreation | 0 (0.0%) | 0 (0.0%) |
| Accommodation & Food Services | 0 (0.0%) | 0 (0.0%) |
| Public Administration | 0 (0.0%) | 0 (0.0%) |
| Total | 166 (85.6%) | 28 (14.4%) |
Education in Dobbins
School Enrollment in Dobbins
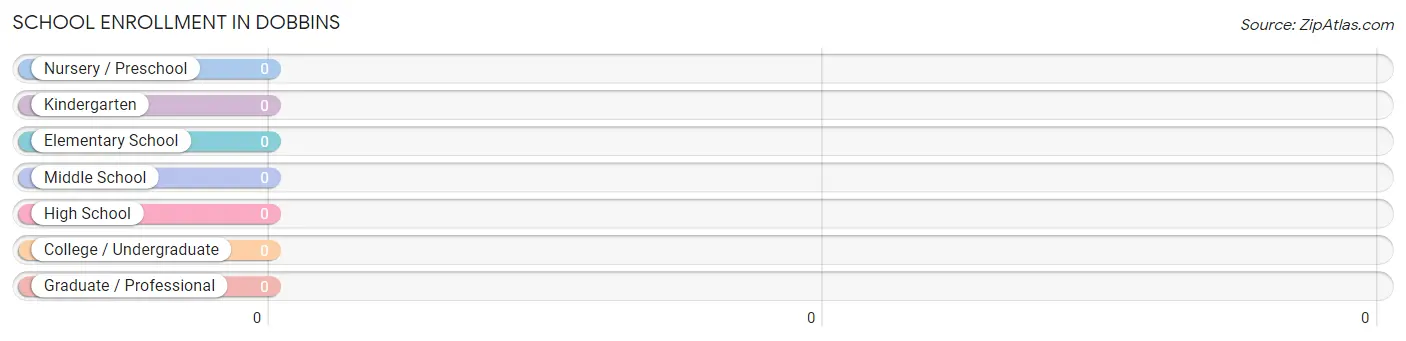
| School Level | # Students | % Students |
| Nursery / Preschool | 0 | 0.0% |
| Kindergarten | 0 | 0.0% |
| Elementary School | 0 | 0.0% |
| Middle School | 0 | 0.0% |
| High School | 0 | 0.0% |
| College / Undergraduate | 0 | 0.0% |
| Graduate / Professional | 0 | 0.0% |
| Total | 0 | 0.0% |
School Enrollment by Age by Funding Source in Dobbins
| Age Bracket | Public School | Private School |
| 3 to 4 Year Olds | 0 (0.0%) | 0 (0.0%) |
| 5 to 9 Year Old | 0 (0.0%) | 0 (0.0%) |
| 10 to 14 Year Olds | 0 (0.0%) | 0 (0.0%) |
| 15 to 17 Year Olds | 0 (0.0%) | 0 (0.0%) |
| 18 to 19 Year Olds | 0 (0.0%) | 0 (0.0%) |
| 20 to 24 Year Olds | 0 (0.0%) | 0 (0.0%) |
| 25 to 34 Year Olds | 0 (0.0%) | 0 (0.0%) |
| 35 Years and over | 0 (0.0%) | 0 (0.0%) |
| Total | 0 (0.0%) | 0 (0.0%) |
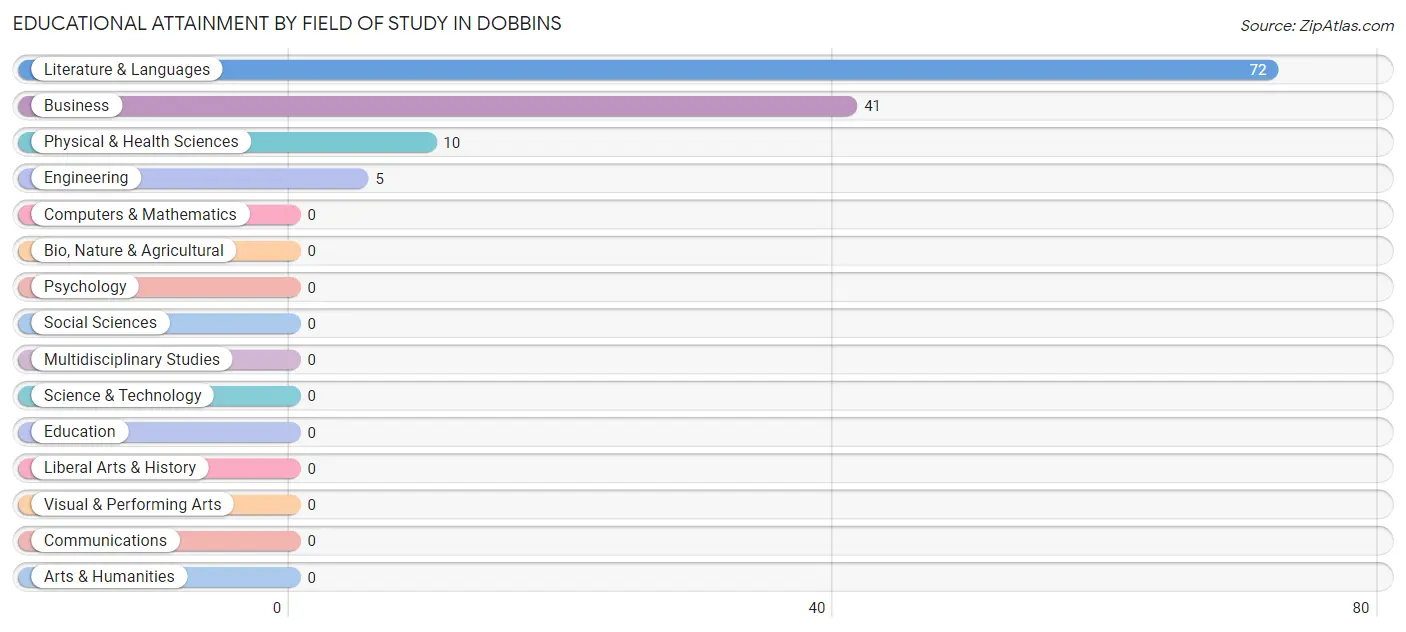
Educational Attainment by Field of Study in Dobbins
Literature & languages (72 | 56.2%), business (41 | 32.0%), physical & health sciences (10 | 7.8%), and engineering (5 | 3.9%) are the most common fields of study among 128 individuals in Dobbins who have obtained a bachelor's degree or higher.
| Field of Study | # Graduates | % Graduates |
| Computers & Mathematics | 0 | 0.0% |
| Bio, Nature & Agricultural | 0 | 0.0% |
| Physical & Health Sciences | 10 | 7.8% |
| Psychology | 0 | 0.0% |
| Social Sciences | 0 | 0.0% |
| Engineering | 5 | 3.9% |
| Multidisciplinary Studies | 0 | 0.0% |
| Science & Technology | 0 | 0.0% |
| Business | 41 | 32.0% |
| Education | 0 | 0.0% |
| Literature & Languages | 72 | 56.2% |
| Liberal Arts & History | 0 | 0.0% |
| Visual & Performing Arts | 0 | 0.0% |
| Communications | 0 | 0.0% |
| Arts & Humanities | 0 | 0.0% |
| Total | 128 | 100.0% |
Transportation & Commute in Dobbins
Vehicle Availability by Sex in Dobbins
The most prevalent vehicle ownership categories in Dobbins are males with 2 vehicles (121, accounting for 77.6%) and females with 2 vehicles (28, making up 432.1%).
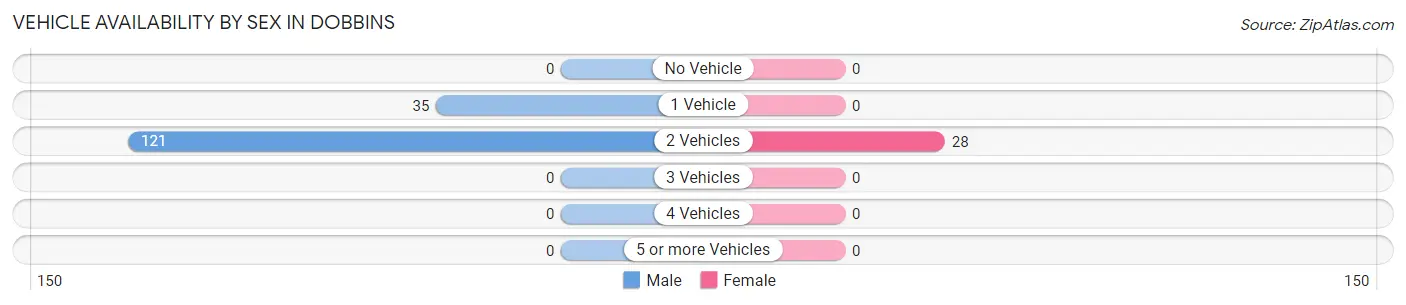
| Vehicles Available | Male | Female |
| No Vehicle | 0 (0.0%) | 0 (0.0%) |
| 1 Vehicle | 35 (22.4%) | 0 (0.0%) |
| 2 Vehicles | 121 (77.6%) | 28 (100.0%) |
| 3 Vehicles | 0 (0.0%) | 0 (0.0%) |
| 4 Vehicles | 0 (0.0%) | 0 (0.0%) |
| 5 or more Vehicles | 0 (0.0%) | 0 (0.0%) |
| Total | 156 (100.0%) | 28 (100.0%) |
Commute Time in Dobbins
The most frequently occuring commute durations in Dobbins are 15 to 19 minutes (85 commuters, 43.8%), 90 or more minutes (41 commuters, 21.1%), and 20 to 24 minutes (35 commuters, 18.0%).
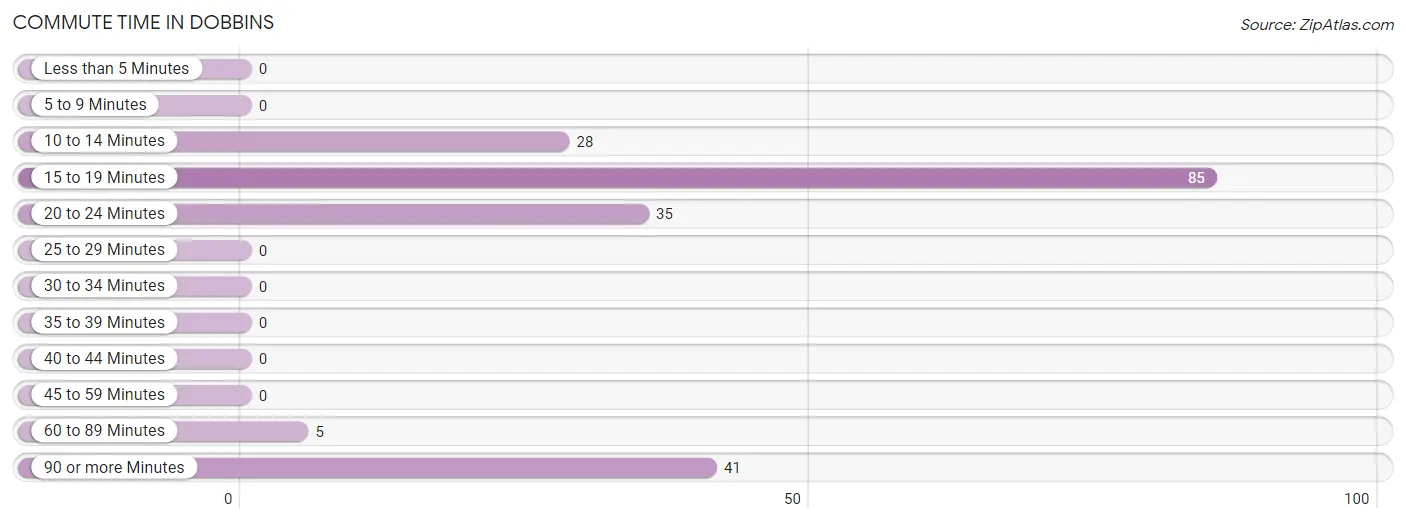
| Commute Time | # Commuters | % Commuters |
| Less than 5 Minutes | 0 | 0.0% |
| 5 to 9 Minutes | 0 | 0.0% |
| 10 to 14 Minutes | 28 | 14.4% |
| 15 to 19 Minutes | 85 | 43.8% |
| 20 to 24 Minutes | 35 | 18.0% |
| 25 to 29 Minutes | 0 | 0.0% |
| 30 to 34 Minutes | 0 | 0.0% |
| 35 to 39 Minutes | 0 | 0.0% |
| 40 to 44 Minutes | 0 | 0.0% |
| 45 to 59 Minutes | 0 | 0.0% |
| 60 to 89 Minutes | 5 | 2.6% |
| 90 or more Minutes | 41 | 21.1% |
Commute Time by Sex in Dobbins
The most common commute times in Dobbins are 15 to 19 minutes (85 commuters, 51.2%) for males and 10 to 14 minutes (28 commuters, 100.0%) for females.
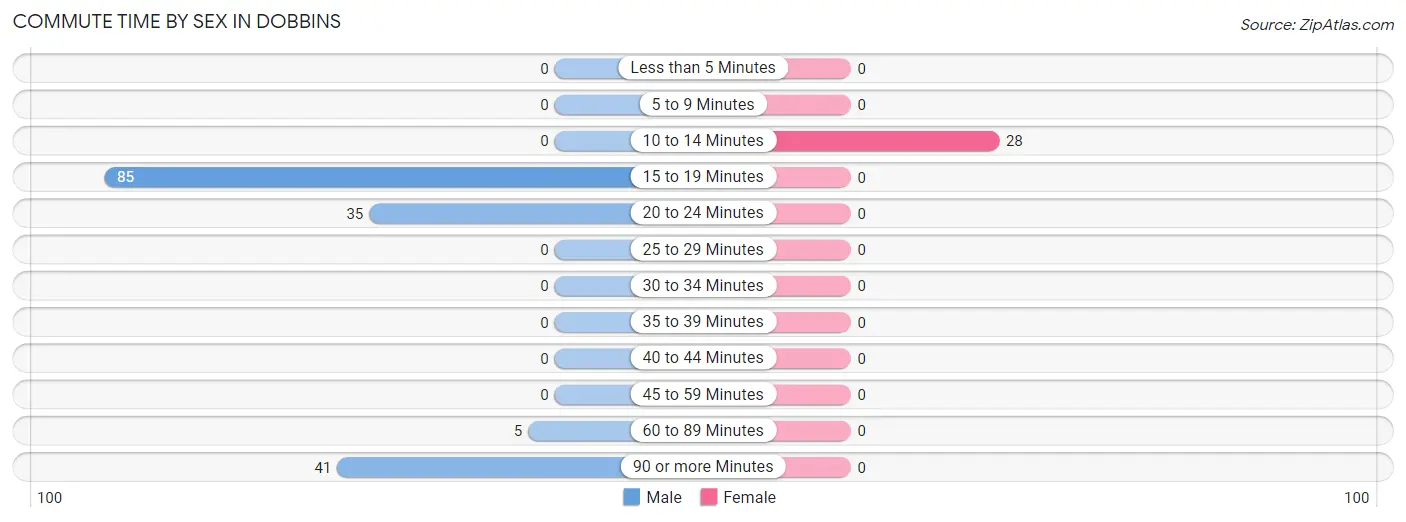
| Commute Time | Male | Female |
| Less than 5 Minutes | 0 (0.0%) | 0 (0.0%) |
| 5 to 9 Minutes | 0 (0.0%) | 0 (0.0%) |
| 10 to 14 Minutes | 0 (0.0%) | 28 (100.0%) |
| 15 to 19 Minutes | 85 (51.2%) | 0 (0.0%) |
| 20 to 24 Minutes | 35 (21.1%) | 0 (0.0%) |
| 25 to 29 Minutes | 0 (0.0%) | 0 (0.0%) |
| 30 to 34 Minutes | 0 (0.0%) | 0 (0.0%) |
| 35 to 39 Minutes | 0 (0.0%) | 0 (0.0%) |
| 40 to 44 Minutes | 0 (0.0%) | 0 (0.0%) |
| 45 to 59 Minutes | 0 (0.0%) | 0 (0.0%) |
| 60 to 89 Minutes | 5 (3.0%) | 0 (0.0%) |
| 90 or more Minutes | 41 (24.7%) | 0 (0.0%) |
Time of Departure to Work by Sex in Dobbins
The most frequent times of departure to work in Dobbins are 9:00 AM to 9:59 AM (80, 48.2%) for males and 7:30 AM to 7:59 AM (28, 100.0%) for females.
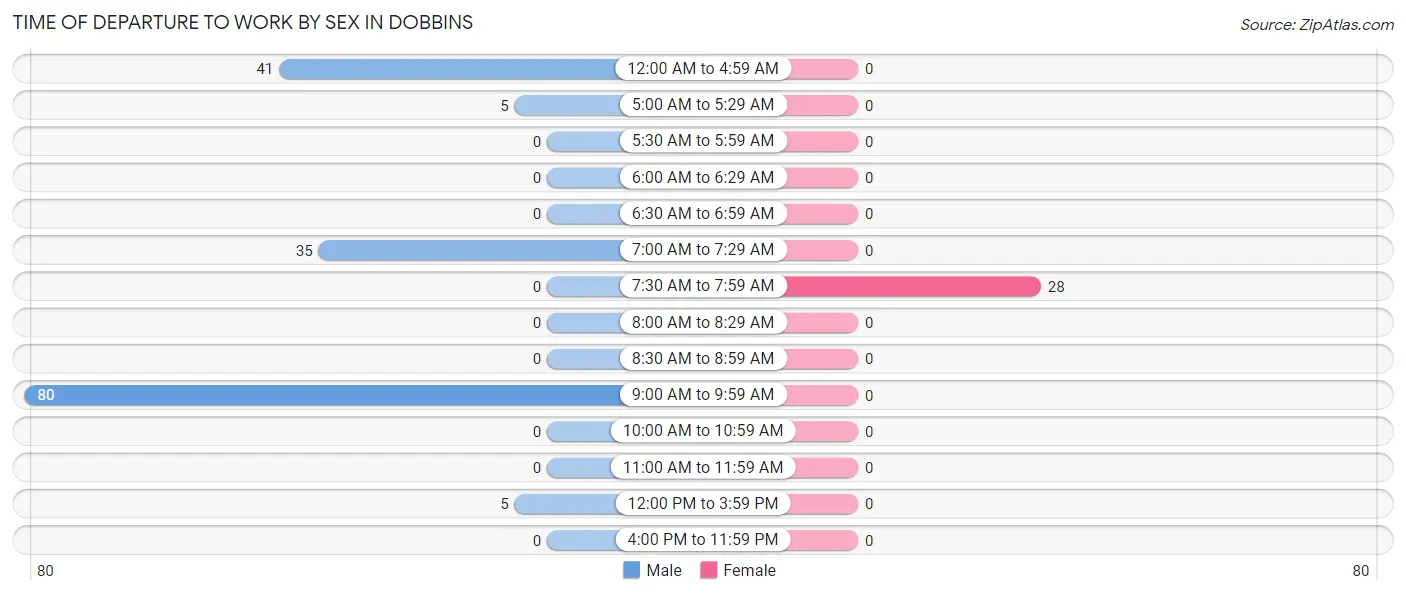
| Time of Departure | Male | Female |
| 12:00 AM to 4:59 AM | 41 (24.7%) | 0 (0.0%) |
| 5:00 AM to 5:29 AM | 5 (3.0%) | 0 (0.0%) |
| 5:30 AM to 5:59 AM | 0 (0.0%) | 0 (0.0%) |
| 6:00 AM to 6:29 AM | 0 (0.0%) | 0 (0.0%) |
| 6:30 AM to 6:59 AM | 0 (0.0%) | 0 (0.0%) |
| 7:00 AM to 7:29 AM | 35 (21.1%) | 0 (0.0%) |
| 7:30 AM to 7:59 AM | 0 (0.0%) | 28 (100.0%) |
| 8:00 AM to 8:29 AM | 0 (0.0%) | 0 (0.0%) |
| 8:30 AM to 8:59 AM | 0 (0.0%) | 0 (0.0%) |
| 9:00 AM to 9:59 AM | 80 (48.2%) | 0 (0.0%) |
| 10:00 AM to 10:59 AM | 0 (0.0%) | 0 (0.0%) |
| 11:00 AM to 11:59 AM | 0 (0.0%) | 0 (0.0%) |
| 12:00 PM to 3:59 PM | 5 (3.0%) | 0 (0.0%) |
| 4:00 PM to 11:59 PM | 0 (0.0%) | 0 (0.0%) |
| Total | 166 (100.0%) | 28 (100.0%) |
Housing Occupancy in Dobbins
Occupancy by Ownership in Dobbins
Of the total 195 dwellings in Dobbins, owner-occupied units account for 171 (87.7%), while renter-occupied units make up 24 (12.3%).
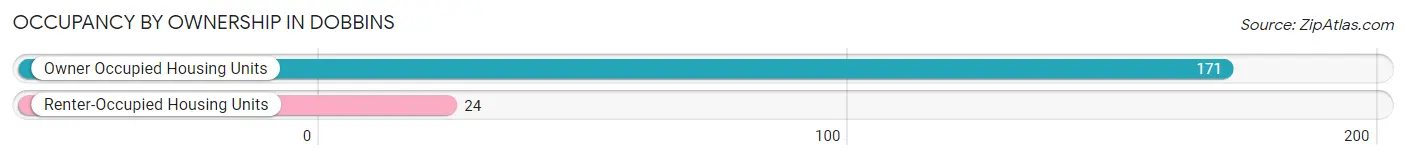
| Occupancy | # Housing Units | % Housing Units |
| Owner Occupied Housing Units | 171 | 87.7% |
| Renter-Occupied Housing Units | 24 | 12.3% |
| Total Occupied Housing Units | 195 | 100.0% |
Occupancy by Household Size in Dobbins
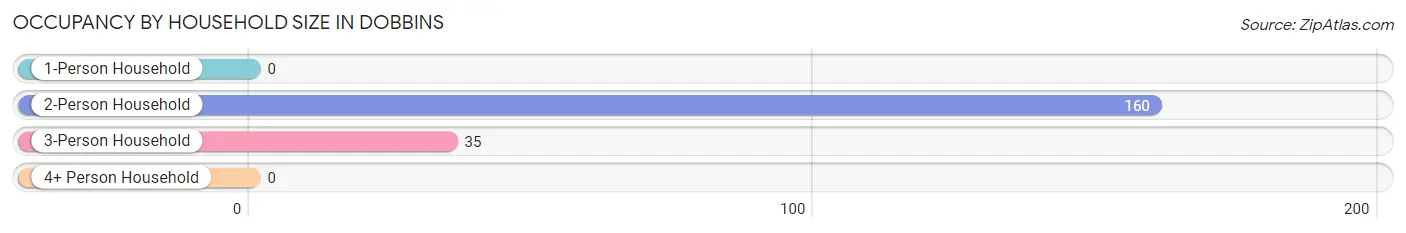
| Household Size | # Housing Units | % Housing Units |
| 1-Person Household | 0 | 0.0% |
| 2-Person Household | 160 | 82.1% |
| 3-Person Household | 35 | 17.9% |
| 4+ Person Household | 0 | 0.0% |
| Total Housing Units | 195 | 100.0% |
Occupancy by Ownership by Household Size in Dobbins
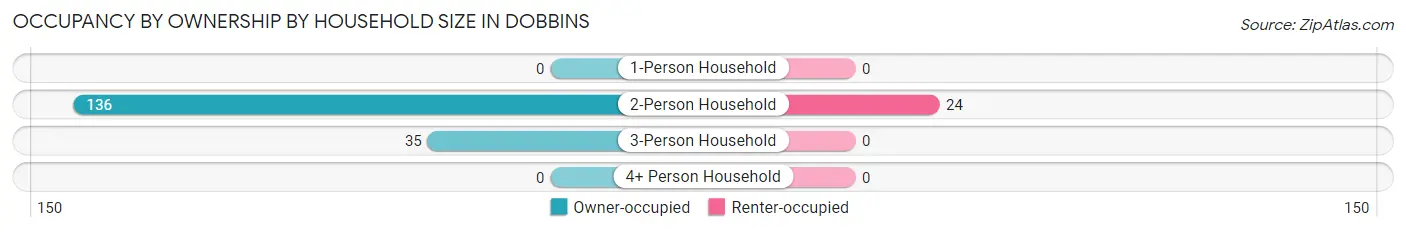
| Household Size | Owner-occupied | Renter-occupied |
| 1-Person Household | 0 (0.0%) | 0 (0.0%) |
| 2-Person Household | 136 (85.0%) | 24 (15.0%) |
| 3-Person Household | 35 (100.0%) | 0 (0.0%) |
| 4+ Person Household | 0 (0.0%) | 0 (0.0%) |
| Total Housing Units | 171 (87.7%) | 24 (12.3%) |
Occupancy by Educational Attainment in Dobbins
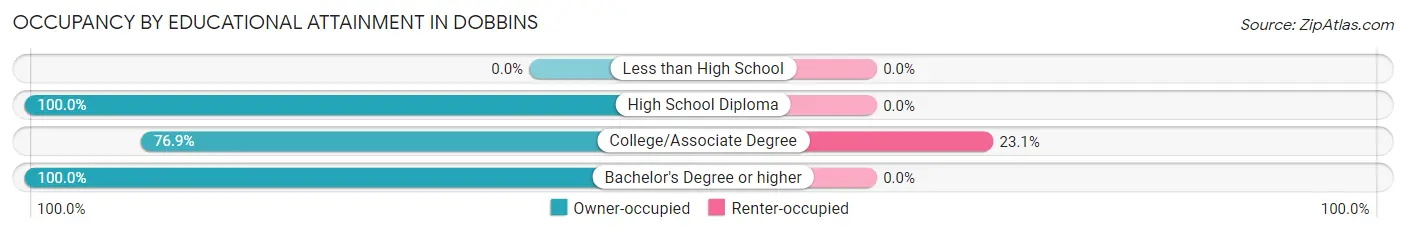
| Household Size | Owner-occupied | Renter-occupied |
| Less than High School | 0 (0.0%) | 0 (0.0%) |
| High School Diploma | 50 (100.0%) | 0 (0.0%) |
| College/Associate Degree | 80 (76.9%) | 24 (23.1%) |
| Bachelor's Degree or higher | 41 (100.0%) | 0 (0.0%) |
Occupancy by Age of Householder in Dobbins
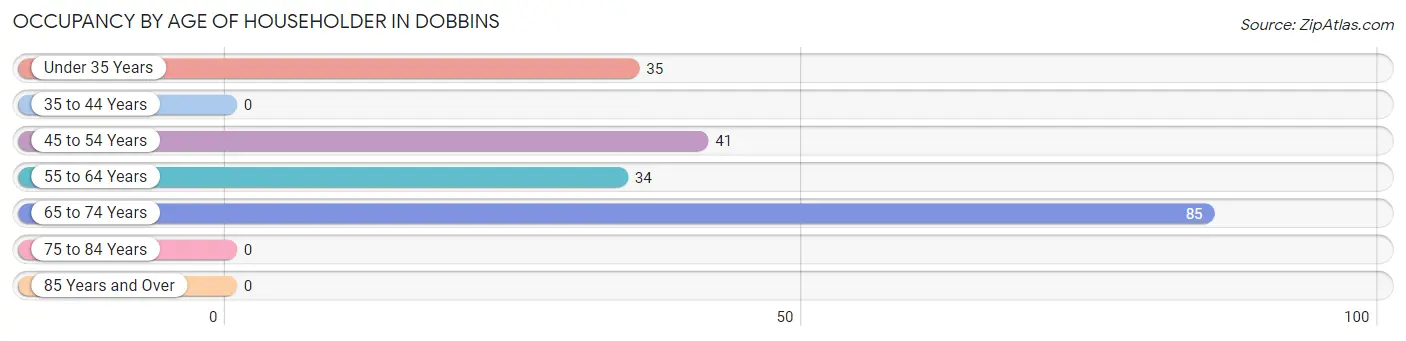
| Age Bracket | # Households | % Households |
| Under 35 Years | 35 | 17.9% |
| 35 to 44 Years | 0 | 0.0% |
| 45 to 54 Years | 41 | 21.0% |
| 55 to 64 Years | 34 | 17.4% |
| 65 to 74 Years | 85 | 43.6% |
| 75 to 84 Years | 0 | 0.0% |
| 85 Years and Over | 0 | 0.0% |
| Total | 195 | 100.0% |
Housing Finances in Dobbins
Median Income by Occupancy in Dobbins
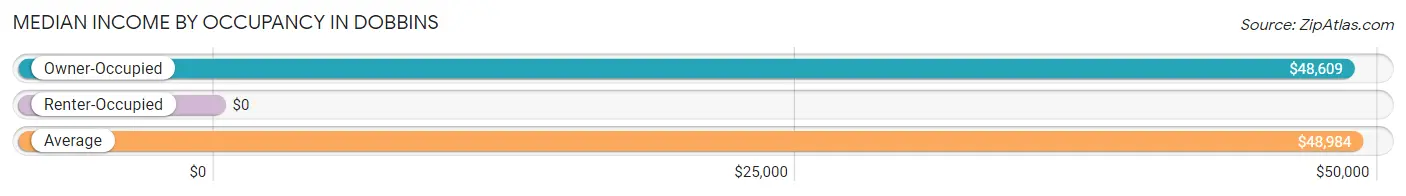
| Occupancy Type | # Households | Median Income |
| Owner-Occupied | 171 (87.7%) | $48,609 |
| Renter-Occupied | 24 (12.3%) | $0 |
| Average | 195 (100.0%) | $48,984 |
Occupancy by Householder Income Bracket in Dobbins
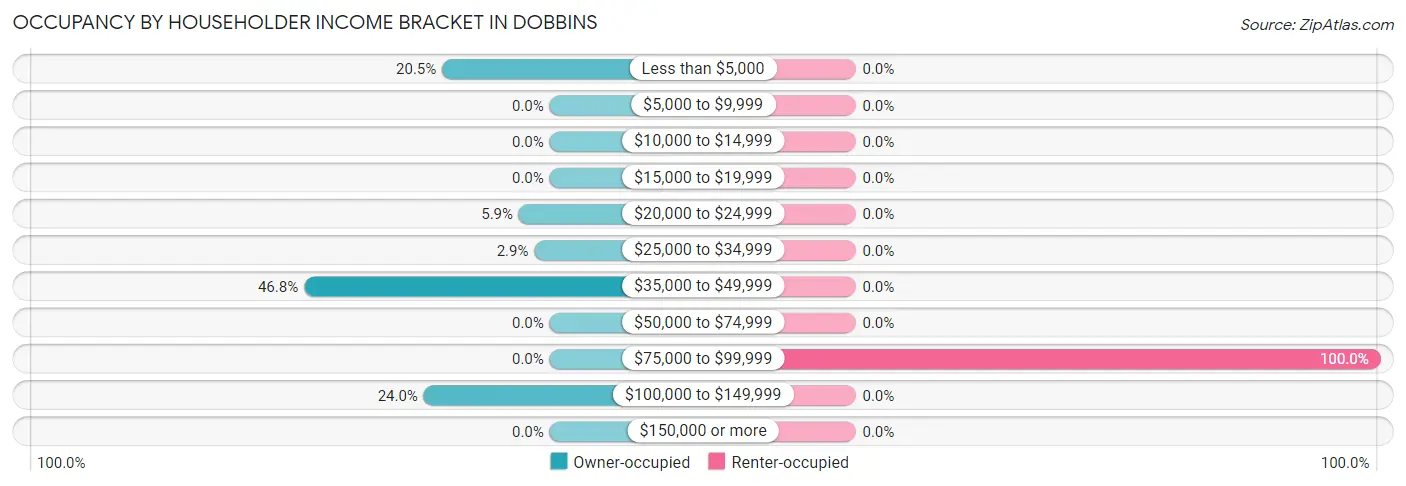
| Income Bracket | Owner-occupied | Renter-occupied |
| Less than $5,000 | 35 (20.5%) | 0 (0.0%) |
| $5,000 to $9,999 | 0 (0.0%) | 0 (0.0%) |
| $10,000 to $14,999 | 0 (0.0%) | 0 (0.0%) |
| $15,000 to $19,999 | 0 (0.0%) | 0 (0.0%) |
| $20,000 to $24,999 | 10 (5.9%) | 0 (0.0%) |
| $25,000 to $34,999 | 5 (2.9%) | 0 (0.0%) |
| $35,000 to $49,999 | 80 (46.8%) | 0 (0.0%) |
| $50,000 to $74,999 | 0 (0.0%) | 0 (0.0%) |
| $75,000 to $99,999 | 0 (0.0%) | 24 (100.0%) |
| $100,000 to $149,999 | 41 (24.0%) | 0 (0.0%) |
| $150,000 or more | 0 (0.0%) | 0 (0.0%) |
| Total | 171 (100.0%) | 24 (100.0%) |
Monthly Housing Cost Tiers in Dobbins
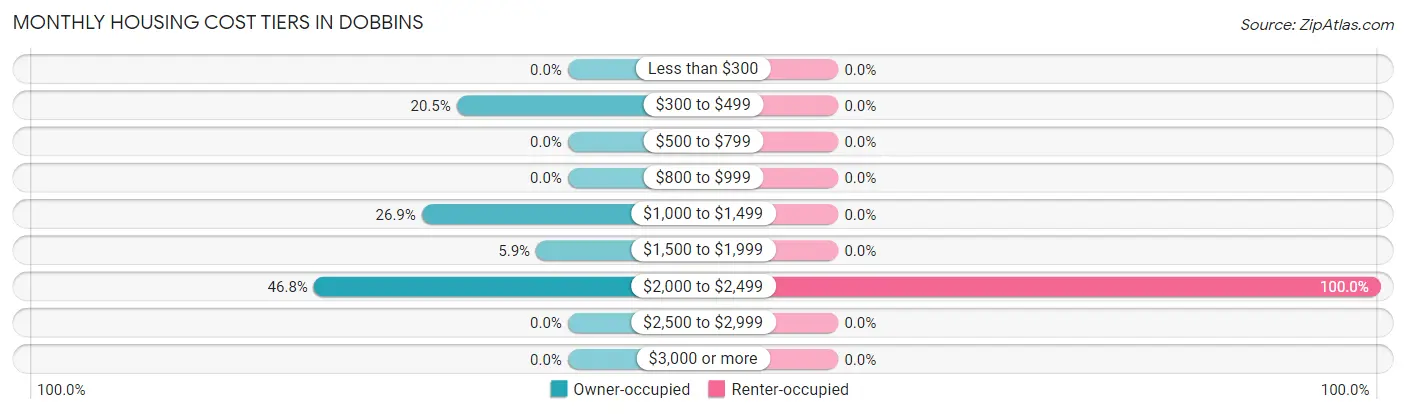
| Monthly Cost | Owner-occupied | Renter-occupied |
| Less than $300 | 0 (0.0%) | 0 (0.0%) |
| $300 to $499 | 35 (20.5%) | 0 (0.0%) |
| $500 to $799 | 0 (0.0%) | 0 (0.0%) |
| $800 to $999 | 0 (0.0%) | 0 (0.0%) |
| $1,000 to $1,499 | 46 (26.9%) | 0 (0.0%) |
| $1,500 to $1,999 | 10 (5.9%) | 0 (0.0%) |
| $2,000 to $2,499 | 80 (46.8%) | 24 (100.0%) |
| $2,500 to $2,999 | 0 (0.0%) | 0 (0.0%) |
| $3,000 or more | 0 (0.0%) | 0 (0.0%) |
| Total | 171 (100.0%) | 24 (100.0%) |
Physical Housing Characteristics in Dobbins
Housing Structures in Dobbins
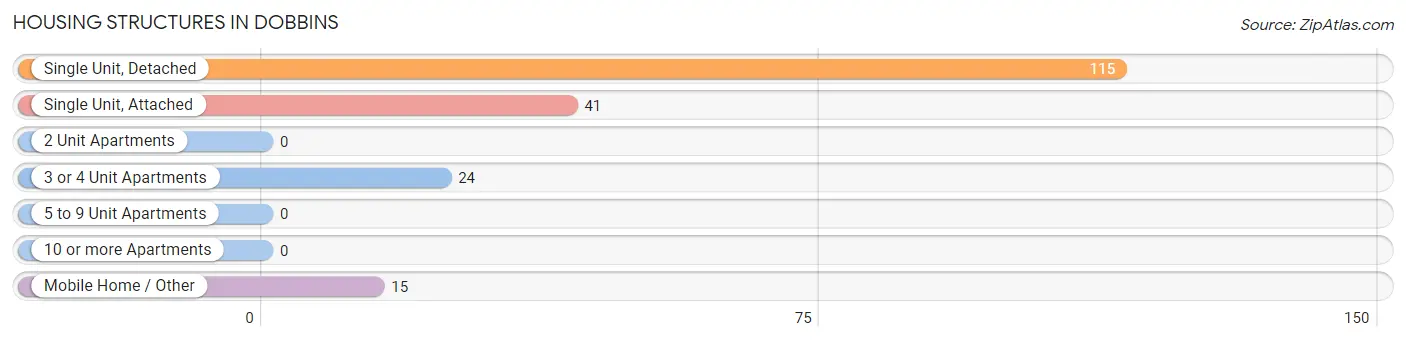
| Structure Type | # Housing Units | % Housing Units |
| Single Unit, Detached | 115 | 59.0% |
| Single Unit, Attached | 41 | 21.0% |
| 2 Unit Apartments | 0 | 0.0% |
| 3 or 4 Unit Apartments | 24 | 12.3% |
| 5 to 9 Unit Apartments | 0 | 0.0% |
| 10 or more Apartments | 0 | 0.0% |
| Mobile Home / Other | 15 | 7.7% |
| Total | 195 | 100.0% |
Housing Structures by Occupancy in Dobbins
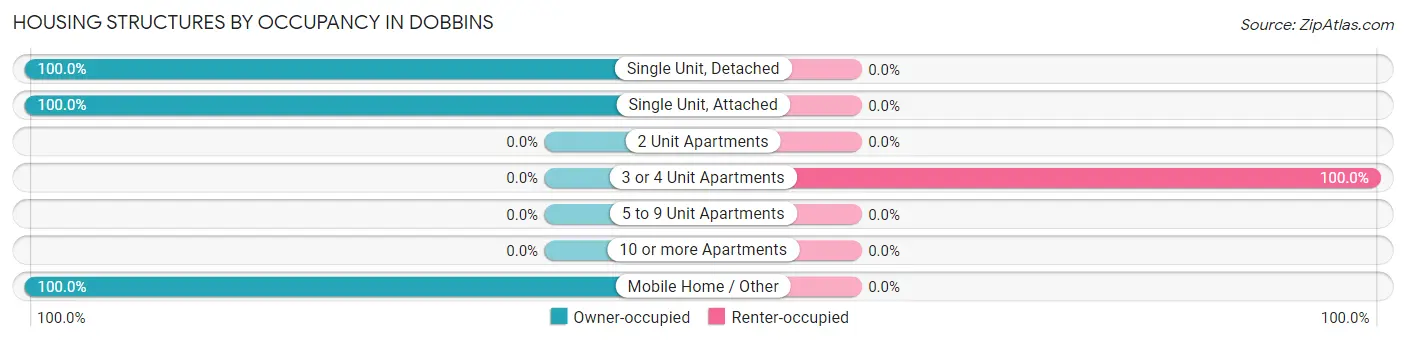
| Structure Type | Owner-occupied | Renter-occupied |
| Single Unit, Detached | 115 (100.0%) | 0 (0.0%) |
| Single Unit, Attached | 41 (100.0%) | 0 (0.0%) |
| 2 Unit Apartments | 0 (0.0%) | 0 (0.0%) |
| 3 or 4 Unit Apartments | 0 (0.0%) | 24 (100.0%) |
| 5 to 9 Unit Apartments | 0 (0.0%) | 0 (0.0%) |
| 10 or more Apartments | 0 (0.0%) | 0 (0.0%) |
| Mobile Home / Other | 15 (100.0%) | 0 (0.0%) |
| Total | 171 (87.7%) | 24 (12.3%) |
Housing Structures by Number of Rooms in Dobbins
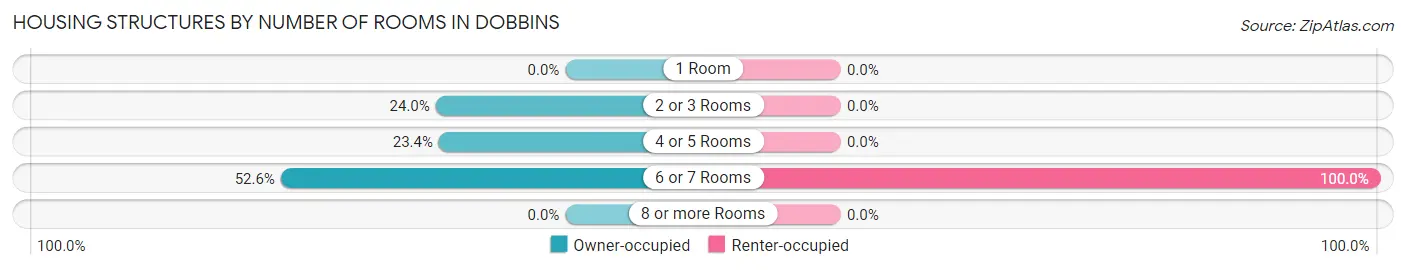
| Number of Rooms | Owner-occupied | Renter-occupied |
| 1 Room | 0 (0.0%) | 0 (0.0%) |
| 2 or 3 Rooms | 41 (24.0%) | 0 (0.0%) |
| 4 or 5 Rooms | 40 (23.4%) | 0 (0.0%) |
| 6 or 7 Rooms | 90 (52.6%) | 24 (100.0%) |
| 8 or more Rooms | 0 (0.0%) | 0 (0.0%) |
| Total | 171 (100.0%) | 24 (100.0%) |
Housing Structure by Heating Type in Dobbins
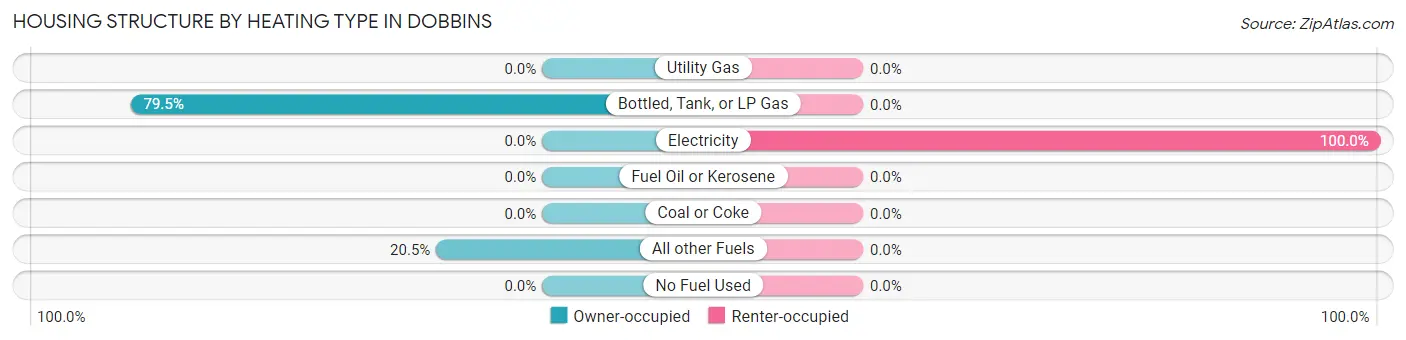
| Heating Type | Owner-occupied | Renter-occupied |
| Utility Gas | 0 (0.0%) | 0 (0.0%) |
| Bottled, Tank, or LP Gas | 136 (79.5%) | 0 (0.0%) |
| Electricity | 0 (0.0%) | 24 (100.0%) |
| Fuel Oil or Kerosene | 0 (0.0%) | 0 (0.0%) |
| Coal or Coke | 0 (0.0%) | 0 (0.0%) |
| All other Fuels | 35 (20.5%) | 0 (0.0%) |
| No Fuel Used | 0 (0.0%) | 0 (0.0%) |
| Total | 171 (100.0%) | 24 (100.0%) |
Household Vehicle Usage in Dobbins
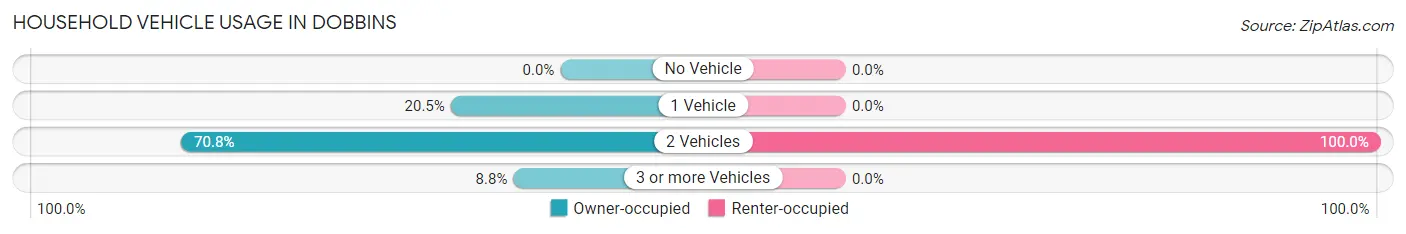
| Vehicles per Household | Owner-occupied | Renter-occupied |
| No Vehicle | 0 (0.0%) | 0 (0.0%) |
| 1 Vehicle | 35 (20.5%) | 0 (0.0%) |
| 2 Vehicles | 121 (70.8%) | 24 (100.0%) |
| 3 or more Vehicles | 15 (8.8%) | 0 (0.0%) |
| Total | 171 (100.0%) | 24 (100.0%) |
Real Estate & Mortgages in Dobbins
Real Estate and Mortgage Overview in Dobbins
| Characteristic | Without Mortgage | With Mortgage |
| Housing Units | 40 | 131 |
| Median Property Value | - | - |
| Median Household Income | - | - |
| Monthly Housing Costs | - | - |
| Real Estate Taxes | - | - |
Property Value by Mortgage Status in Dobbins
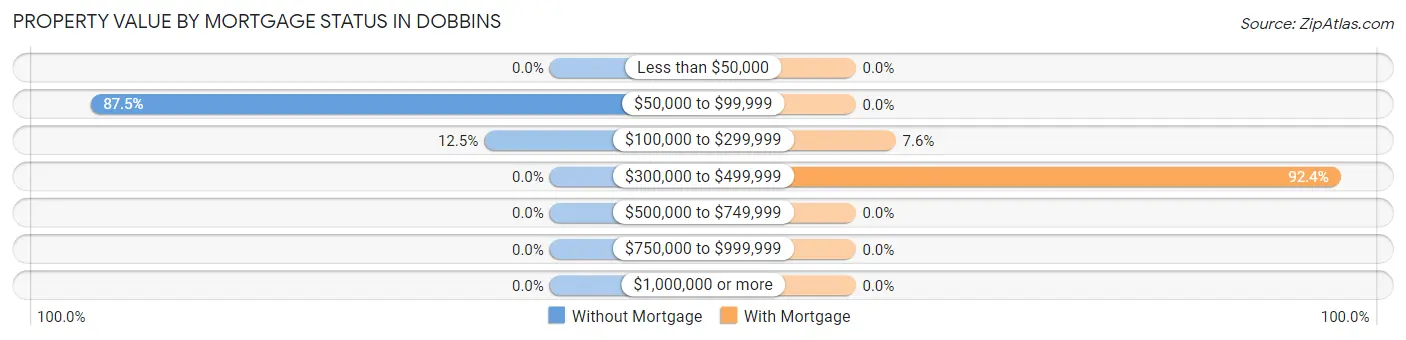
| Property Value | Without Mortgage | With Mortgage |
| Less than $50,000 | 0 (0.0%) | 0 (0.0%) |
| $50,000 to $99,999 | 35 (87.5%) | 0 (0.0%) |
| $100,000 to $299,999 | 5 (12.5%) | 10 (7.6%) |
| $300,000 to $499,999 | 0 (0.0%) | 121 (92.4%) |
| $500,000 to $749,999 | 0 (0.0%) | 0 (0.0%) |
| $750,000 to $999,999 | 0 (0.0%) | 0 (0.0%) |
| $1,000,000 or more | 0 (0.0%) | 0 (0.0%) |
| Total | 40 (100.0%) | 131 (100.0%) |
Household Income by Mortgage Status in Dobbins
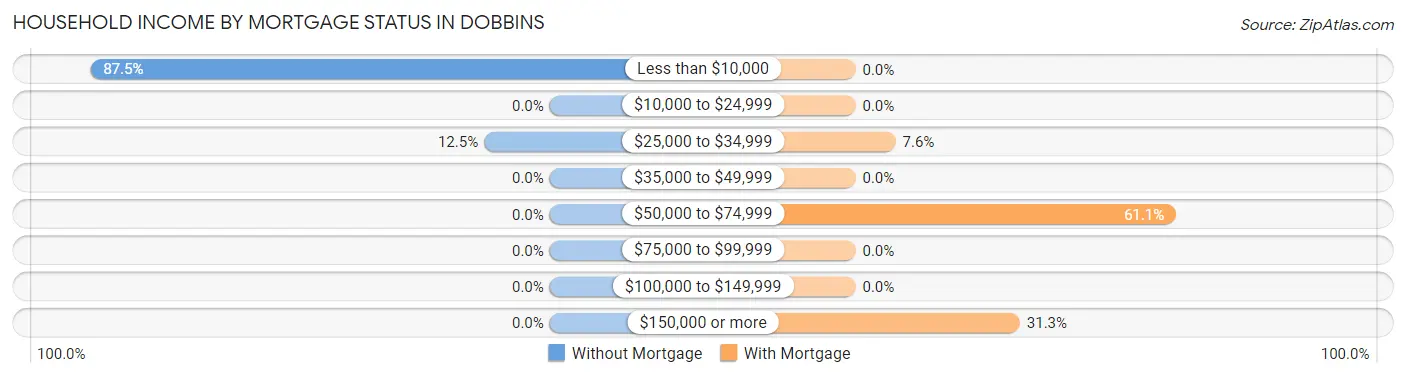
| Household Income | Without Mortgage | With Mortgage |
| Less than $10,000 | 35 (87.5%) | 0 (0.0%) |
| $10,000 to $24,999 | 0 (0.0%) | 0 (0.0%) |
| $25,000 to $34,999 | 5 (12.5%) | 10 (7.6%) |
| $35,000 to $49,999 | 0 (0.0%) | 0 (0.0%) |
| $50,000 to $74,999 | 0 (0.0%) | 80 (61.1%) |
| $75,000 to $99,999 | 0 (0.0%) | 0 (0.0%) |
| $100,000 to $149,999 | 0 (0.0%) | 0 (0.0%) |
| $150,000 or more | 0 (0.0%) | 41 (31.3%) |
| Total | 40 (100.0%) | 131 (100.0%) |
Property Value to Household Income Ratio in Dobbins
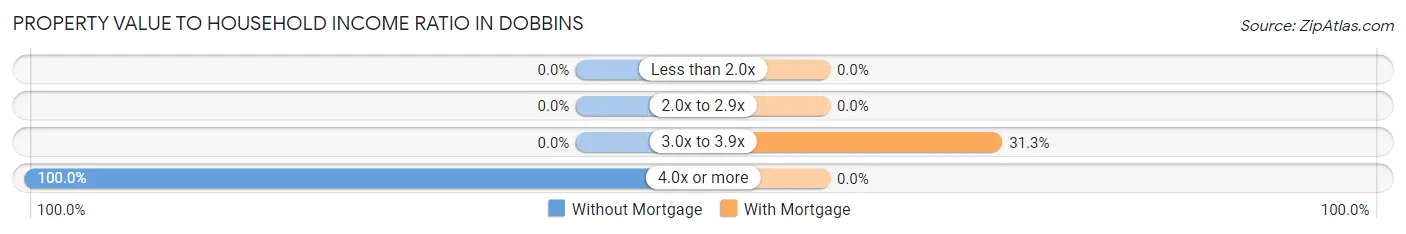
| Value-to-Income Ratio | Without Mortgage | With Mortgage |
| Less than 2.0x | 0 (0.0%) | 0 (0.0%) |
| 2.0x to 2.9x | 0 (0.0%) | 0 (0.0%) |
| 3.0x to 3.9x | 0 (0.0%) | 41 (31.3%) |
| 4.0x or more | 40 (100.0%) | 0 (0.0%) |
| Total | 40 (100.0%) | 131 (100.0%) |
Real Estate Taxes by Mortgage Status in Dobbins
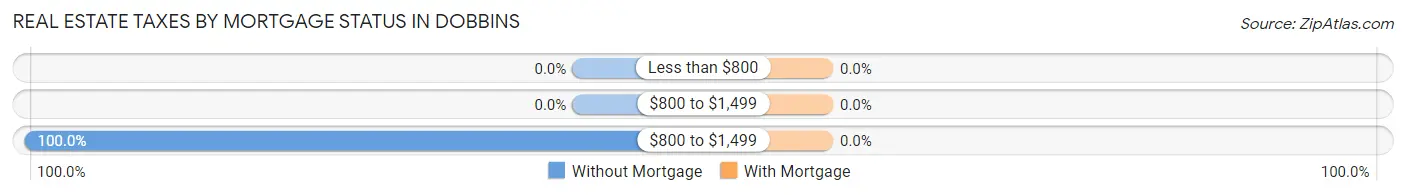
| Property Taxes | Without Mortgage | With Mortgage |
| Less than $800 | 0 (0.0%) | 0 (0.0%) |
| $800 to $1,499 | 0 (0.0%) | 0 (0.0%) |
| $800 to $1,499 | 40 (100.0%) | 0 (0.0%) |
| Total | 40 (100.0%) | 131 (100.0%) |
Health & Disability in Dobbins
Health Insurance Coverage by Age in Dobbins
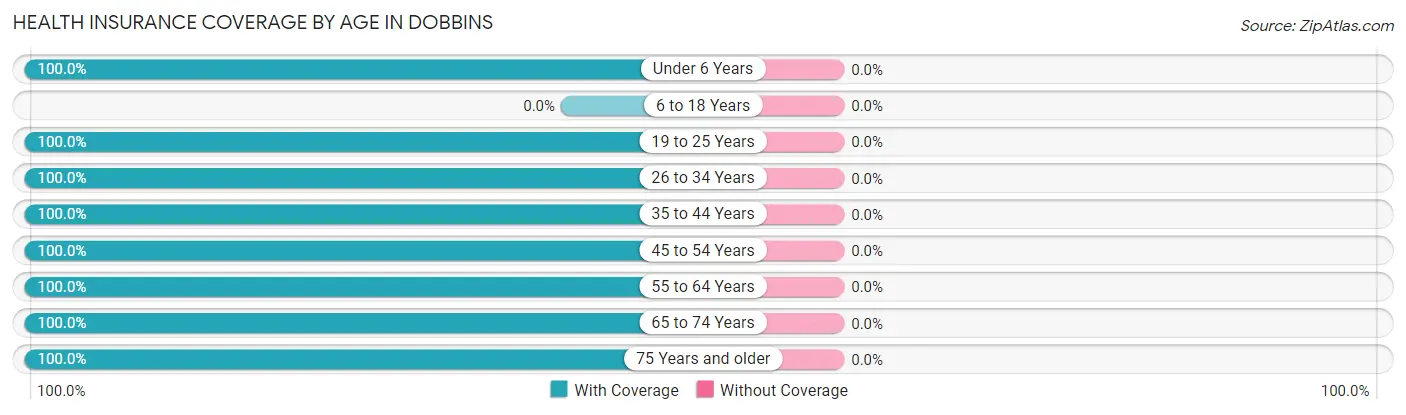
| Age Bracket | With Coverage | Without Coverage |
| Under 6 Years | 28 (100.0%) | 0 (0.0%) |
| 6 to 18 Years | 0 (0.0%) | 0 (0.0%) |
| 19 to 25 Years | 60 (100.0%) | 0 (0.0%) |
| 26 to 34 Years | 6 (100.0%) | 0 (0.0%) |
| 35 to 44 Years | 35 (100.0%) | 0 (0.0%) |
| 45 to 54 Years | 69 (100.0%) | 0 (0.0%) |
| 55 to 64 Years | 46 (100.0%) | 0 (0.0%) |
| 65 to 74 Years | 104 (100.0%) | 0 (0.0%) |
| 75 Years and older | 72 (100.0%) | 0 (0.0%) |
| Total | 420 (100.0%) | 0 (0.0%) |
Health Insurance Coverage by Citizenship Status in Dobbins
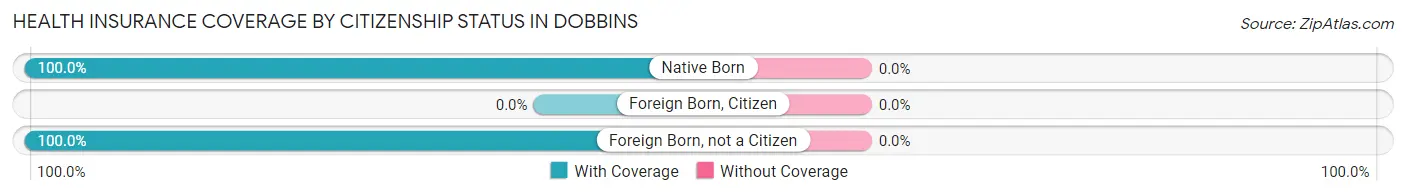
| Citizenship Status | With Coverage | Without Coverage |
| Native Born | 28 (100.0%) | 0 (0.0%) |
| Foreign Born, Citizen | 0 (0.0%) | 0 (0.0%) |
| Foreign Born, not a Citizen | 60 (100.0%) | 0 (0.0%) |
Health Insurance Coverage by Household Income in Dobbins
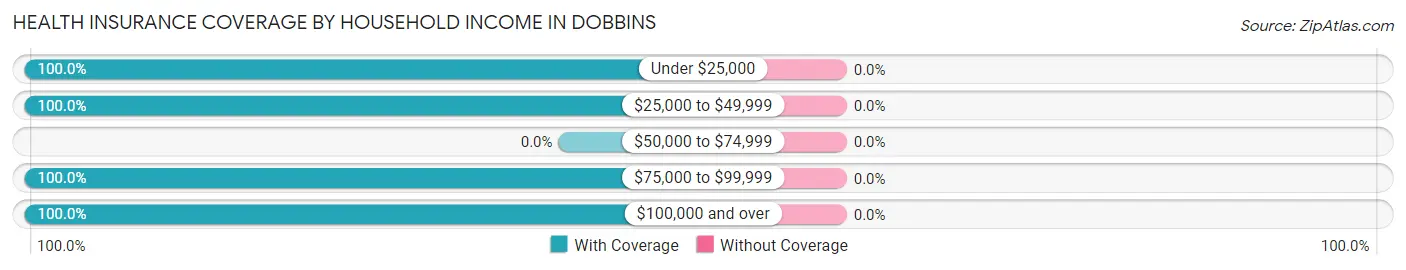
| Household Income | With Coverage | Without Coverage |
| Under $25,000 | 108 (100.0%) | 0 (0.0%) |
| $25,000 to $49,999 | 161 (100.0%) | 0 (0.0%) |
| $50,000 to $74,999 | 0 (0.0%) | 0 (0.0%) |
| $75,000 to $99,999 | 53 (100.0%) | 0 (0.0%) |
| $100,000 and over | 69 (100.0%) | 0 (0.0%) |
Public vs Private Health Insurance Coverage by Age in Dobbins
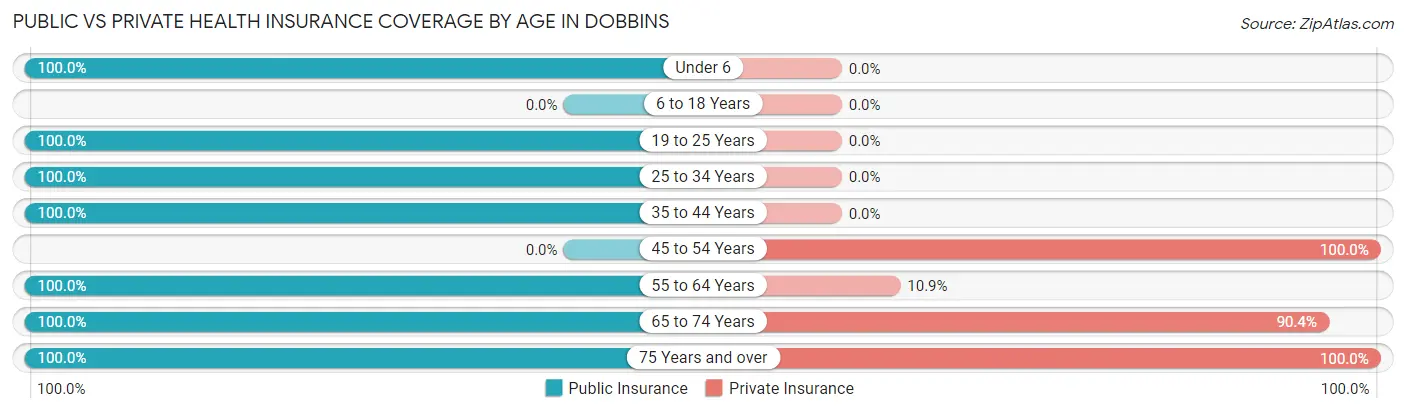
| Age Bracket | Public Insurance | Private Insurance |
| Under 6 | 28 (100.0%) | 0 (0.0%) |
| 6 to 18 Years | 0 (0.0%) | 0 (0.0%) |
| 19 to 25 Years | 60 (100.0%) | 0 (0.0%) |
| 25 to 34 Years | 6 (100.0%) | 0 (0.0%) |
| 35 to 44 Years | 35 (100.0%) | 0 (0.0%) |
| 45 to 54 Years | 0 (0.0%) | 69 (100.0%) |
| 55 to 64 Years | 46 (100.0%) | 5 (10.9%) |
| 65 to 74 Years | 104 (100.0%) | 94 (90.4%) |
| 75 Years and over | 72 (100.0%) | 72 (100.0%) |
| Total | 351 (83.6%) | 240 (57.1%) |
Disability Status by Sex by Age in Dobbins
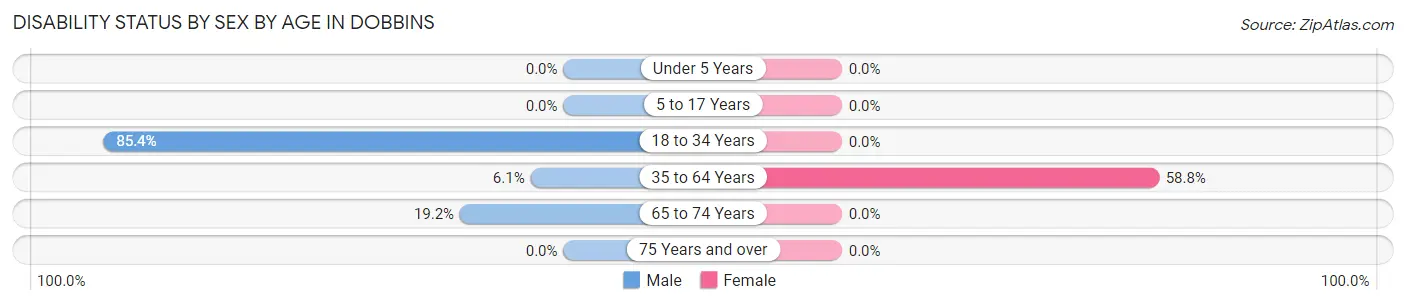
| Age Bracket | Male | Female |
| Under 5 Years | 0 (0.0%) | 0 (0.0%) |
| 5 to 17 Years | 0 (0.0%) | 0 (0.0%) |
| 18 to 34 Years | 35 (85.4%) | 0 (0.0%) |
| 35 to 64 Years | 5 (6.1%) | 40 (58.8%) |
| 65 to 74 Years | 19 (19.2%) | 0 (0.0%) |
| 75 Years and over | 0 (0.0%) | 0 (0.0%) |
Disability Class by Sex by Age in Dobbins
Disability Class: Hearing Difficulty
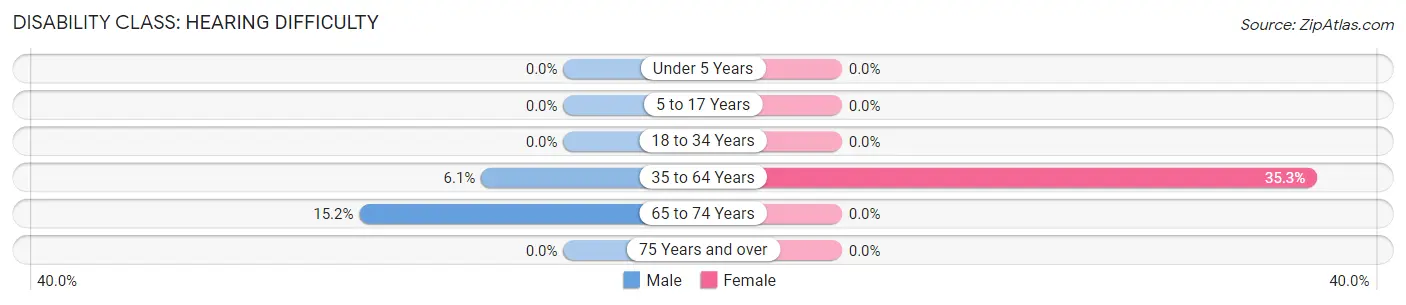
| Age Bracket | Male | Female |
| Under 5 Years | 0 (0.0%) | 0 (0.0%) |
| 5 to 17 Years | 0 (0.0%) | 0 (0.0%) |
| 18 to 34 Years | 0 (0.0%) | 0 (0.0%) |
| 35 to 64 Years | 5 (6.1%) | 24 (35.3%) |
| 65 to 74 Years | 15 (15.1%) | 0 (0.0%) |
| 75 Years and over | 0 (0.0%) | 0 (0.0%) |
Disability Class: Vision Difficulty
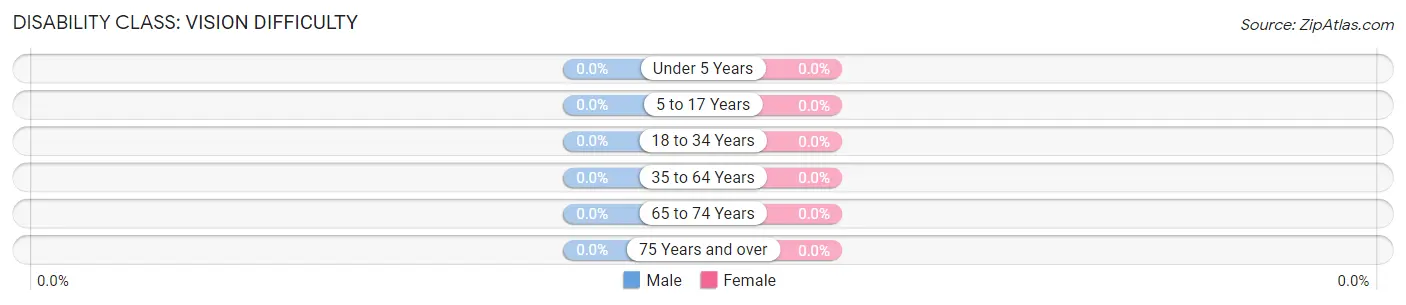
| Age Bracket | Male | Female |
| Under 5 Years | 0 (0.0%) | 0 (0.0%) |
| 5 to 17 Years | 0 (0.0%) | 0 (0.0%) |
| 18 to 34 Years | 0 (0.0%) | 0 (0.0%) |
| 35 to 64 Years | 0 (0.0%) | 0 (0.0%) |
| 65 to 74 Years | 0 (0.0%) | 0 (0.0%) |
| 75 Years and over | 0 (0.0%) | 0 (0.0%) |
Disability Class: Cognitive Difficulty
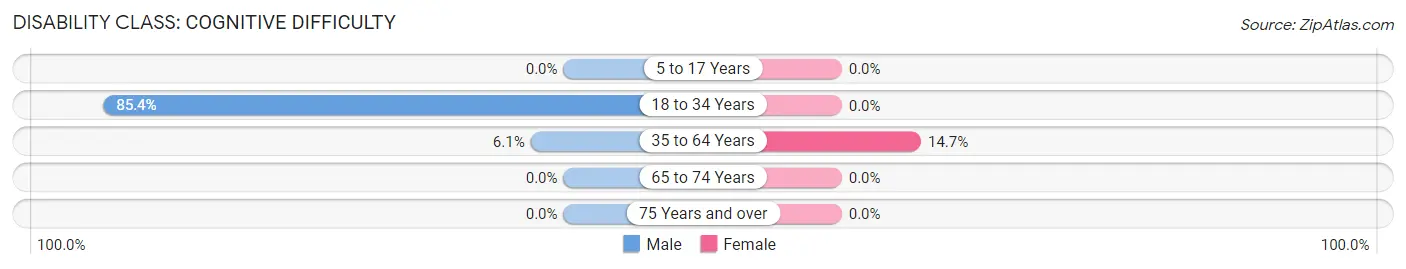
| Age Bracket | Male | Female |
| 5 to 17 Years | 0 (0.0%) | 0 (0.0%) |
| 18 to 34 Years | 35 (85.4%) | 0 (0.0%) |
| 35 to 64 Years | 5 (6.1%) | 10 (14.7%) |
| 65 to 74 Years | 0 (0.0%) | 0 (0.0%) |
| 75 Years and over | 0 (0.0%) | 0 (0.0%) |
Disability Class: Ambulatory Difficulty
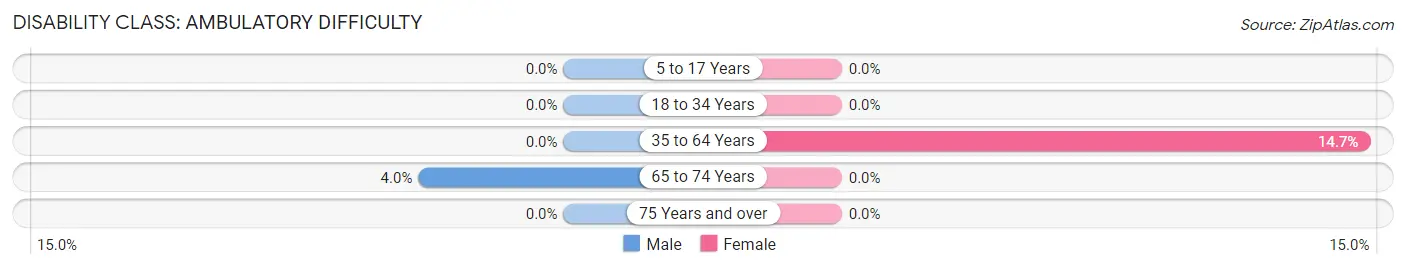
| Age Bracket | Male | Female |
| 5 to 17 Years | 0 (0.0%) | 0 (0.0%) |
| 18 to 34 Years | 0 (0.0%) | 0 (0.0%) |
| 35 to 64 Years | 0 (0.0%) | 10 (14.7%) |
| 65 to 74 Years | 4 (4.0%) | 0 (0.0%) |
| 75 Years and over | 0 (0.0%) | 0 (0.0%) |
Disability Class: Self-Care Difficulty
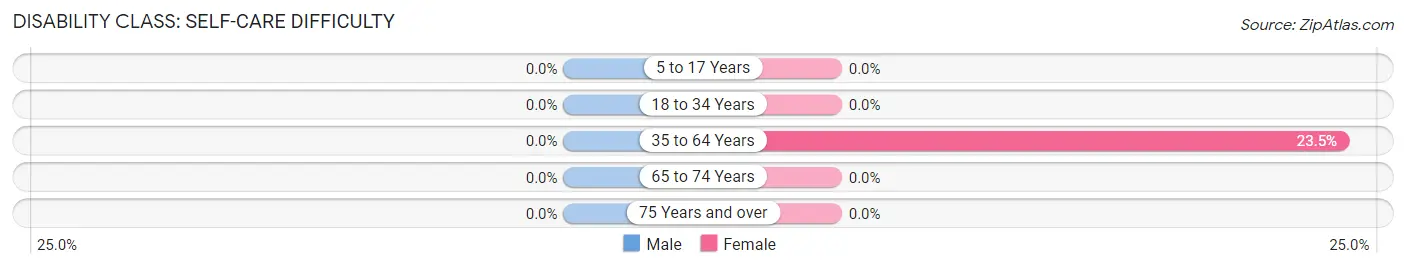
| Age Bracket | Male | Female |
| 5 to 17 Years | 0 (0.0%) | 0 (0.0%) |
| 18 to 34 Years | 0 (0.0%) | 0 (0.0%) |
| 35 to 64 Years | 0 (0.0%) | 16 (23.5%) |
| 65 to 74 Years | 0 (0.0%) | 0 (0.0%) |
| 75 Years and over | 0 (0.0%) | 0 (0.0%) |
Technology Access in Dobbins
Computing Device Access in Dobbins
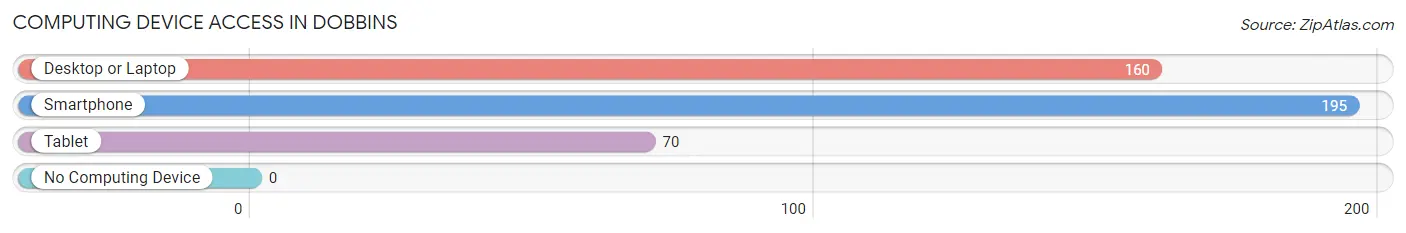
| Device Type | # Households | % Households |
| Desktop or Laptop | 160 | 82.1% |
| Smartphone | 195 | 100.0% |
| Tablet | 70 | 35.9% |
| No Computing Device | 0 | 0.0% |
| Total | 195 | 100.0% |
Internet Access in Dobbins
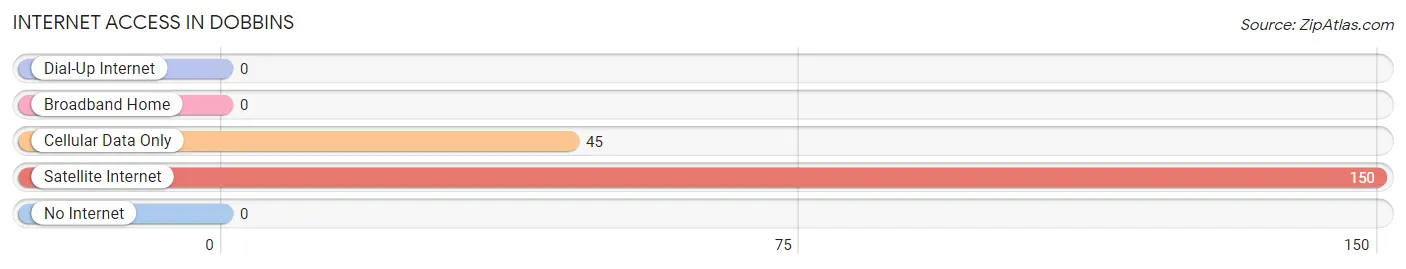
| Internet Type | # Households | % Households |
| Dial-Up Internet | 0 | 0.0% |
| Broadband Home | 0 | 0.0% |
| Cellular Data Only | 45 | 23.1% |
| Satellite Internet | 150 | 76.9% |
| No Internet | 0 | 0.0% |
| Total | 195 | 100.0% |
Dobbins Summary
Dobbins is a small unincorporated community located in Yuba County, California. It is situated in the Sierra Nevada foothills, approximately 40 miles northeast of Sacramento. The population of Dobbins was estimated to be 1,093 in 2019.
History
Dobbins was founded in 1852 by William Dobbins, a gold miner from Missouri. He named the town after himself and it quickly became a popular destination for miners and settlers. The town was officially incorporated in 1856 and soon became a hub for the surrounding area.
In the late 1800s, Dobbins was a bustling town with a population of over 1,000 people. It had a post office, a school, a hotel, a general store, and several saloons. The town was also home to a number of churches, including the Methodist Episcopal Church, the Congregational Church, and the Catholic Church.
In the early 1900s, the population of Dobbins began to decline as the gold rush ended and the town’s economy shifted to agriculture. The town’s population dropped to just over 500 by the 1950s.
Geography
Dobbins is located in the Sierra Nevada foothills, approximately 40 miles northeast of Sacramento. The town is situated at an elevation of 1,890 feet and is surrounded by rolling hills and oak-studded valleys. The town is located in the foothills of the Sierra Nevada mountain range and is close to the Yuba River.
The climate in Dobbins is mild and temperate, with hot summers and cool winters. The average high temperature in the summer is around 90 degrees Fahrenheit and the average low temperature in the winter is around 40 degrees Fahrenheit.
Economy
The economy of Dobbins is largely based on agriculture. The town is home to a number of farms and ranches, which produce a variety of crops, including almonds, walnuts, and olives. The town is also home to a number of wineries and vineyards, which produce a variety of wines.
In addition to agriculture, Dobbins is home to a number of small businesses, including restaurants, shops, and services. The town is also home to a number of tourist attractions, including the Dobbins Historical Museum and the Dobbins Gold Mine.
Demographics
The population of Dobbins was estimated to be 1,093 in 2019. The town is predominantly white, with a population that is 94.3% white, 2.2% Hispanic or Latino, 1.2% Asian, and 0.7% African American. The median household income in Dobbins is $50,945, which is slightly higher than the national median of $50,221.
Conclusion
Dobbins is a small unincorporated community located in Yuba County, California. It is situated in the Sierra Nevada foothills, approximately 40 miles northeast of Sacramento. The population of Dobbins was estimated to be 1,093 in 2019. The town is predominantly white, with a population that is 94.3% white, 2.2% Hispanic or Latino, 1.2% Asian, and 0.7% African American. The economy of Dobbins is largely based on agriculture, with a number of farms and ranches producing a variety of crops. The town is also home to a number of small businesses, including restaurants, shops, and services. Dobbins is a popular destination for tourists, with a number of attractions, including the Dobbins Historical Museum and the Dobbins Gold Mine.
Common Questions
What is Per Capita Income in Dobbins?
Per Capita income in Dobbins is $27,949.
What is the Median Family Income in Dobbins?
Median Family Income in Dobbins is $48,609.
What is the Median Household income in Dobbins?
Median Household Income in Dobbins is $48,984.
What is Inequality or Gini Index in Dobbins?
Inequality or Gini Index in Dobbins is 0.38.
What is the Total Population of Dobbins?
Total Population of Dobbins is 420.
What is the Total Male Population of Dobbins?
Total Male Population of Dobbins is 250.
What is the Total Female Population of Dobbins?
Total Female Population of Dobbins is 170.
What is the Ratio of Males per 100 Females in Dobbins?
There are 147.06 Males per 100 Females in Dobbins.
What is the Ratio of Females per 100 Males in Dobbins?
There are 68.00 Females per 100 Males in Dobbins.
What is the Median Population Age in Dobbins?
Median Population Age in Dobbins is 59.5 Years.
What is the Average Family Size in Dobbins
Average Family Size in Dobbins is 1.8 People.
What is the Average Household Size in Dobbins
Average Household Size in Dobbins is 2.0 People.
How Large is the Labor Force in Dobbins?
There are 200 People in the Labor Forcein in Dobbins.
What is the Percentage of People in the Labor Force in Dobbins?
51.0% of People are in the Labor Force in Dobbins.
What is the Unemployment Rate in Dobbins?
Unemployment Rate in Dobbins is 3.0%.