Isleton, CA Map & Demographics
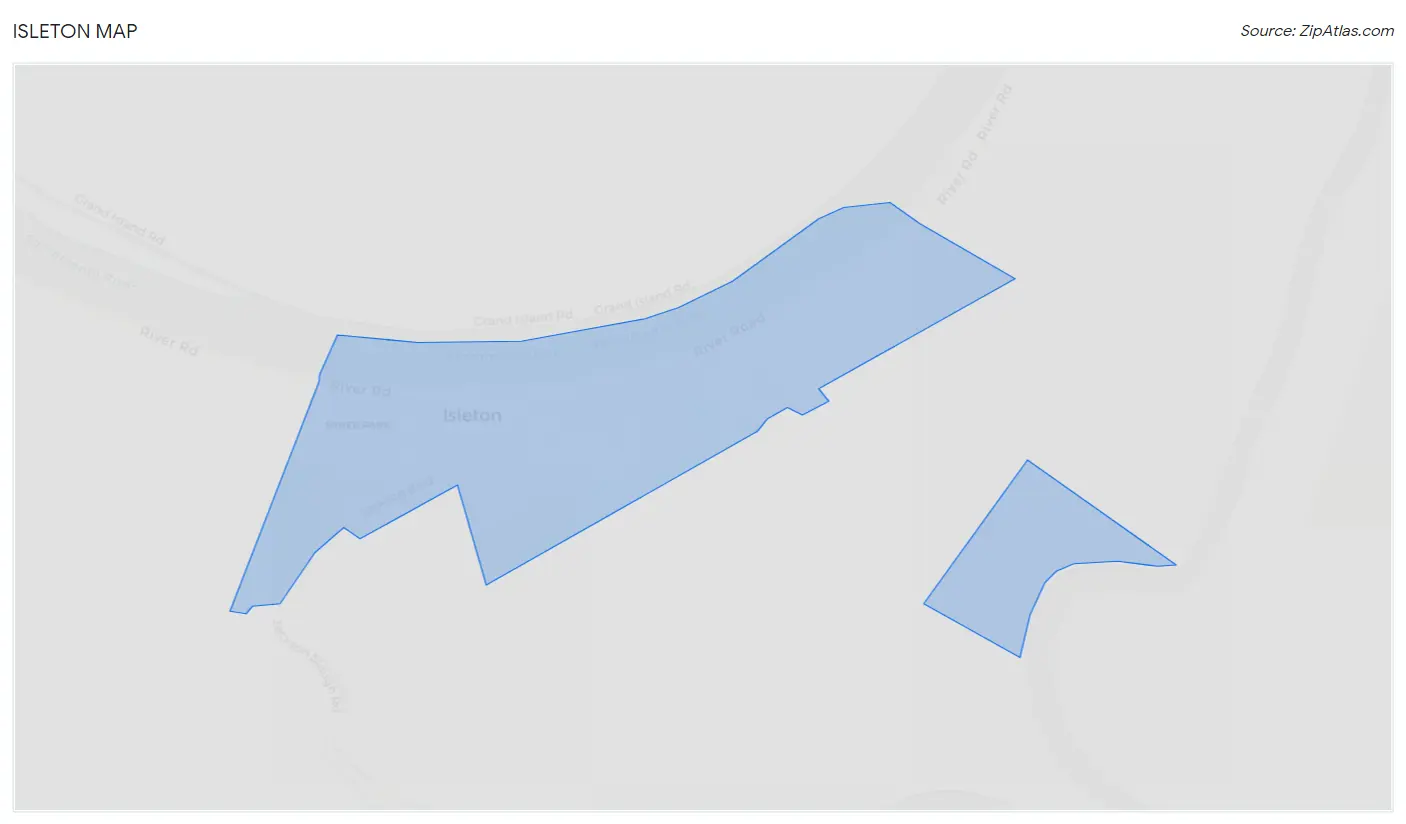
Isleton Map
Isleton Overview
$28,452
PER CAPITA INCOME
$63,810
AVG FAMILY INCOME
$52,321
AVG HOUSEHOLD INCOME
23.0%
WAGE / INCOME GAP [ % ]
77.0¢/ $1
WAGE / INCOME GAP [ $ ]
0.42
INEQUALITY / GINI INDEX
538
TOTAL POPULATION
201
MALE POPULATION
337
FEMALE POPULATION
59.64
MALES / 100 FEMALES
167.66
FEMALES / 100 MALES
30.6
MEDIAN AGE
3.3
AVG FAMILY SIZE
2.2
AVG HOUSEHOLD SIZE
287
LABOR FORCE [ PEOPLE ]
69.8%
PERCENT IN LABOR FORCE
17.5%
UNEMPLOYMENT RATE
Isleton Zip Codes
Isleton Area Codes
Income in Isleton
Income Overview in Isleton
Per Capita Income in Isleton is $28,452, while median incomes of families and households are $63,810 and $52,321 respectively.
| Characteristic | Number | Measure |
| Per Capita Income | 538 | $28,452 |
| Median Family Income | 110 | $63,810 |
| Mean Family Income | 110 | $71,505 |
| Median Household Income | 241 | $52,321 |
| Mean Household Income | 241 | $61,064 |
| Income Deficit | 110 | $0 |
| Wage / Income Gap (%) | 538 | 22.95% |
| Wage / Income Gap ($) | 538 | 77.05¢ per $1 |
| Gini / Inequality Index | 538 | 0.42 |
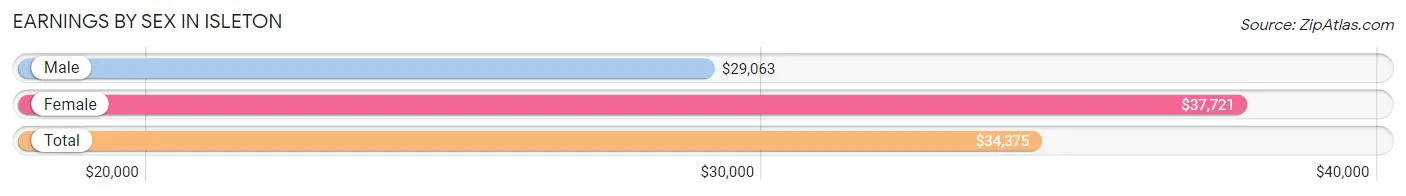
Earnings by Sex in Isleton
Average Earnings in Isleton are $34,375, $29,063 for men and $37,721 for women, a difference of 23.0%.
| Sex | Number | Average Earnings |
| Male | 127 (44.1%) | $29,063 |
| Female | 161 (55.9%) | $37,721 |
| Total | 288 (100.0%) | $34,375 |
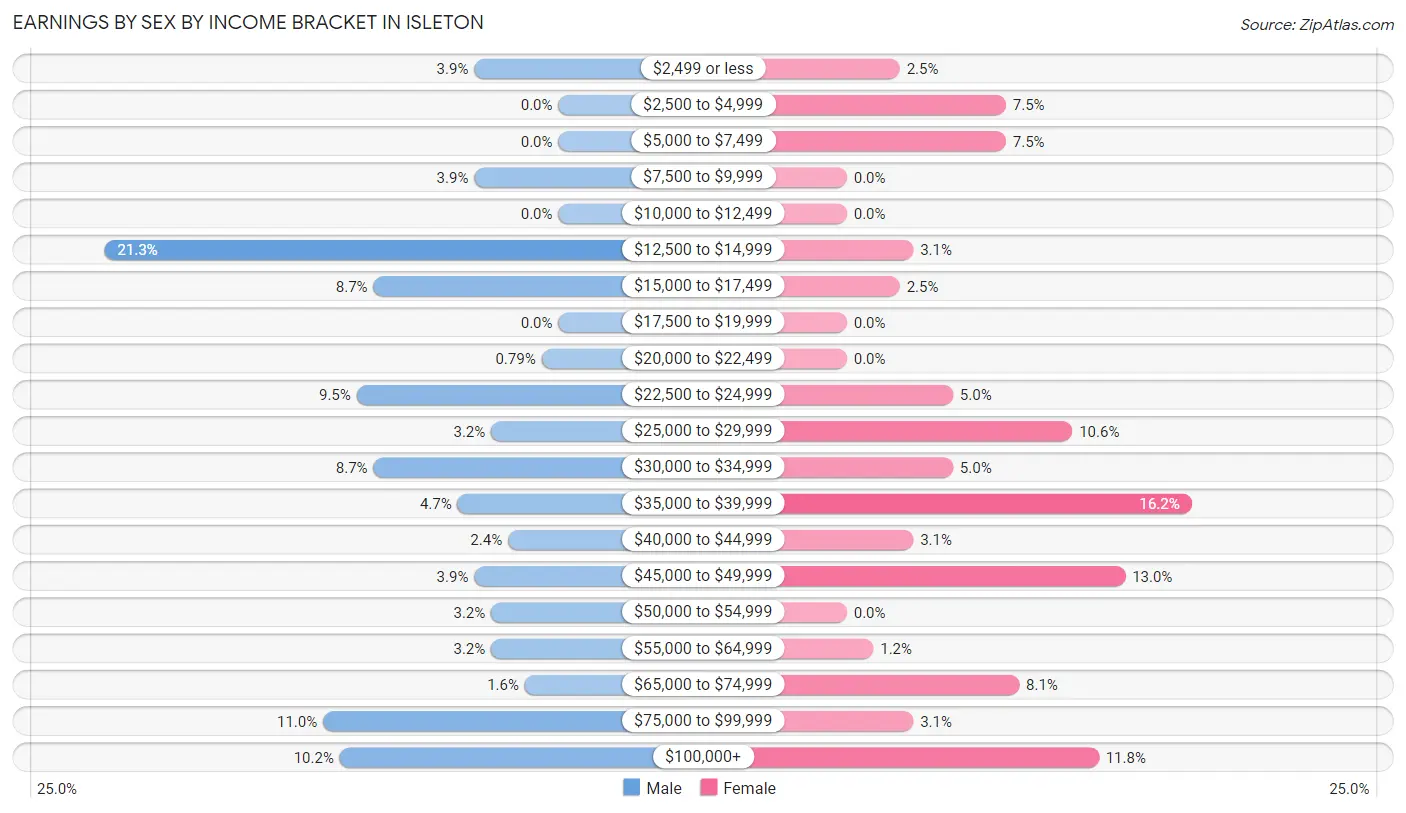
Earnings by Sex by Income Bracket in Isleton
The most common earnings brackets in Isleton are $12,500 to $14,999 for men (27 | 21.3%) and $35,000 to $39,999 for women (26 | 16.2%).
| Income | Male | Female |
| $2,499 or less | 5 (3.9%) | 4 (2.5%) |
| $2,500 to $4,999 | 0 (0.0%) | 12 (7.4%) |
| $5,000 to $7,499 | 0 (0.0%) | 12 (7.4%) |
| $7,500 to $9,999 | 5 (3.9%) | 0 (0.0%) |
| $10,000 to $12,499 | 0 (0.0%) | 0 (0.0%) |
| $12,500 to $14,999 | 27 (21.3%) | 5 (3.1%) |
| $15,000 to $17,499 | 11 (8.7%) | 4 (2.5%) |
| $17,500 to $19,999 | 0 (0.0%) | 0 (0.0%) |
| $20,000 to $22,499 | 1 (0.8%) | 0 (0.0%) |
| $22,500 to $24,999 | 12 (9.5%) | 8 (5.0%) |
| $25,000 to $29,999 | 4 (3.2%) | 17 (10.6%) |
| $30,000 to $34,999 | 11 (8.7%) | 8 (5.0%) |
| $35,000 to $39,999 | 6 (4.7%) | 26 (16.2%) |
| $40,000 to $44,999 | 3 (2.4%) | 5 (3.1%) |
| $45,000 to $49,999 | 5 (3.9%) | 21 (13.0%) |
| $50,000 to $54,999 | 4 (3.2%) | 0 (0.0%) |
| $55,000 to $64,999 | 4 (3.2%) | 2 (1.2%) |
| $65,000 to $74,999 | 2 (1.6%) | 13 (8.1%) |
| $75,000 to $99,999 | 14 (11.0%) | 5 (3.1%) |
| $100,000+ | 13 (10.2%) | 19 (11.8%) |
| Total | 127 (100.0%) | 161 (100.0%) |
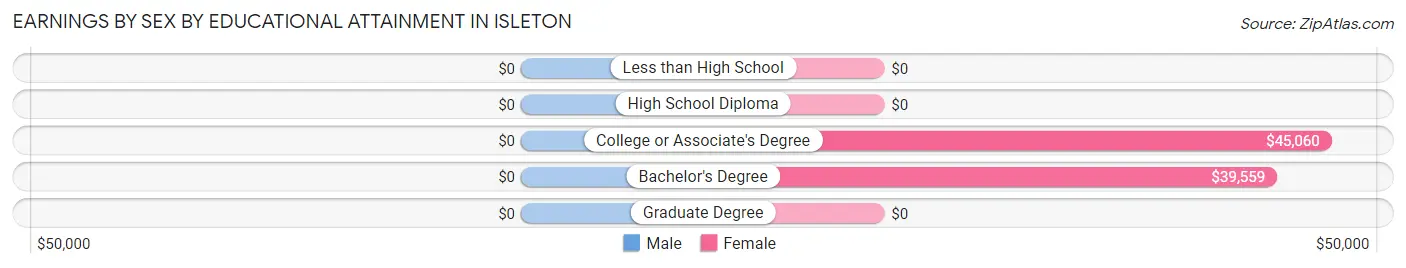
Earnings by Sex by Educational Attainment in Isleton
| Educational Attainment | Male Income | Female Income |
| Less than High School | - | - |
| High School Diploma | - | - |
| College or Associate's Degree | - | - |
| Bachelor's Degree | - | - |
| Graduate Degree | - | - |
| Total | $24,688 | $38,897 |
Family Income in Isleton
Family Income Brackets in Isleton
According to the Isleton family income data, there are 33 families falling into the $50,000 to $74,999 income range, which is the most common income bracket and makes up 30.0% of all families.
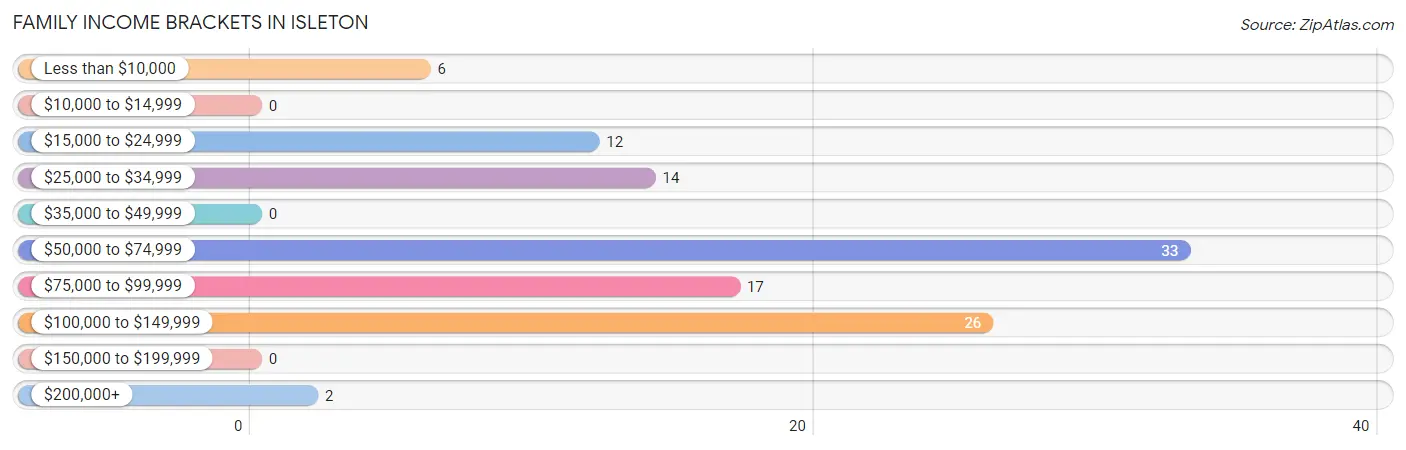
| Income Bracket | # Families | % Families |
| Less than $10,000 | 6 | 5.5% |
| $10,000 to $14,999 | 0 | 0.0% |
| $15,000 to $24,999 | 12 | 10.9% |
| $25,000 to $34,999 | 14 | 12.7% |
| $35,000 to $49,999 | 0 | 0.0% |
| $50,000 to $74,999 | 33 | 30.0% |
| $75,000 to $99,999 | 17 | 15.5% |
| $100,000 to $149,999 | 26 | 23.6% |
| $150,000 to $199,999 | 0 | 0.0% |
| $200,000+ | 2 | 1.8% |
Family Income by Famaliy Size in Isleton
4-person families (26 | 23.6%) account for the highest median family income in Isleton with $84,722 per family, while 2-person families (55 | 50.0%) have the highest median income of $31,637 per family member.
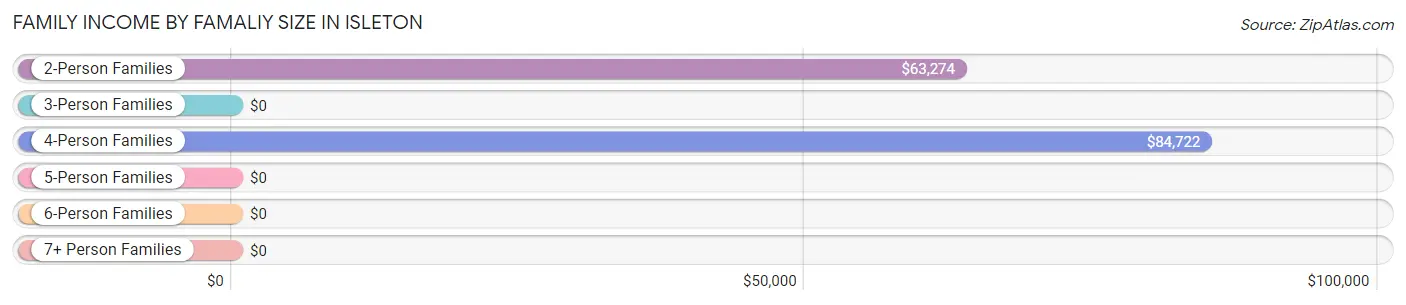
| Income Bracket | # Families | Median Income |
| 2-Person Families | 55 (50.0%) | $63,274 |
| 3-Person Families | 6 (5.4%) | $0 |
| 4-Person Families | 26 (23.6%) | $84,722 |
| 5-Person Families | 23 (20.9%) | $0 |
| 6-Person Families | 0 (0.0%) | $0 |
| 7+ Person Families | 0 (0.0%) | $0 |
| Total | 110 (100.0%) | $63,810 |
Family Income by Number of Earners in Isleton
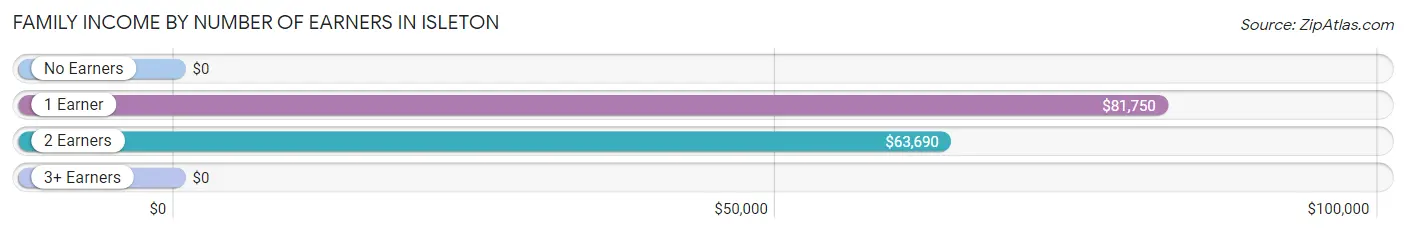
| Number of Earners | # Families | Median Income |
| No Earners | 11 (10.0%) | $0 |
| 1 Earner | 29 (26.4%) | $81,750 |
| 2 Earners | 64 (58.2%) | $63,690 |
| 3+ Earners | 6 (5.4%) | $0 |
| Total | 110 (100.0%) | $63,810 |
Household Income in Isleton
Household Income Brackets in Isleton
With 66 households falling in the category, the $100,000 to $149,999 income range is the most frequent in Isleton, accounting for 27.4% of all households.
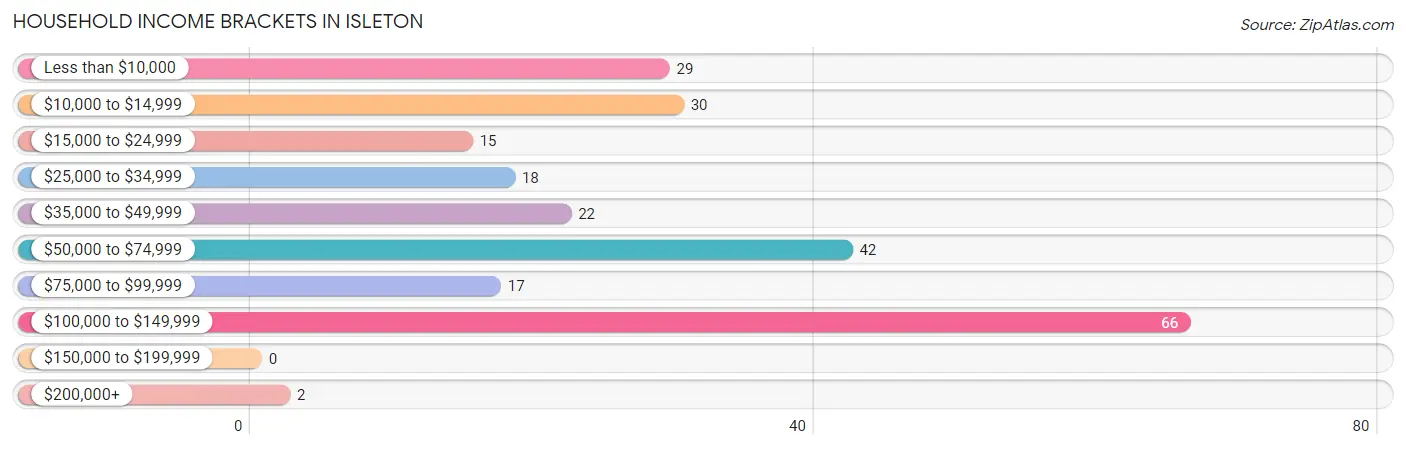
| Income Bracket | # Households | % Households |
| Less than $10,000 | 29 | 12.0% |
| $10,000 to $14,999 | 30 | 12.4% |
| $15,000 to $24,999 | 15 | 6.2% |
| $25,000 to $34,999 | 18 | 7.5% |
| $35,000 to $49,999 | 22 | 9.1% |
| $50,000 to $74,999 | 42 | 17.4% |
| $75,000 to $99,999 | 17 | 7.1% |
| $100,000 to $149,999 | 66 | 27.4% |
| $150,000 to $199,999 | 0 | 0.0% |
| $200,000+ | 2 | 0.8% |
Household Income by Householder Age in Isleton
The median household income in Isleton is $52,321, with the highest median household income of $111,250 found in the 15 to 24 years age bracket for the primary householder. A total of 43 households (17.8%) fall into this category. Meanwhile, the 65+ years age bracket for the primary householder has the lowest median household income of $0, with 76 households (31.5%) in this group.
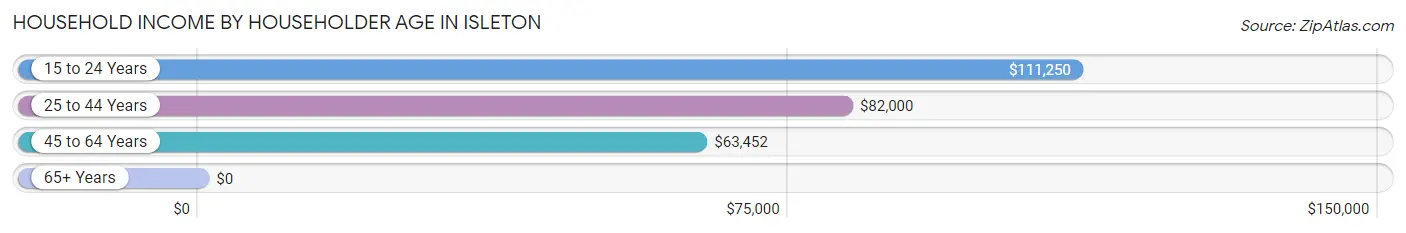
| Income Bracket | # Households | Median Income |
| 15 to 24 Years | 43 (17.8%) | $111,250 |
| 25 to 44 Years | 56 (23.2%) | $82,000 |
| 45 to 64 Years | 66 (27.4%) | $63,452 |
| 65+ Years | 76 (31.5%) | $0 |
| Total | 241 (100.0%) | $52,321 |
Poverty in Isleton
Income Below Poverty by Sex and Age in Isleton
With 30.3% poverty level for males and 33.5% for females among the residents of Isleton, under 5 year old males and 75 year old and over females are the most vulnerable to poverty, with 19 males (100.0%) and 28 females (82.4%) in their respective age groups living below the poverty level.
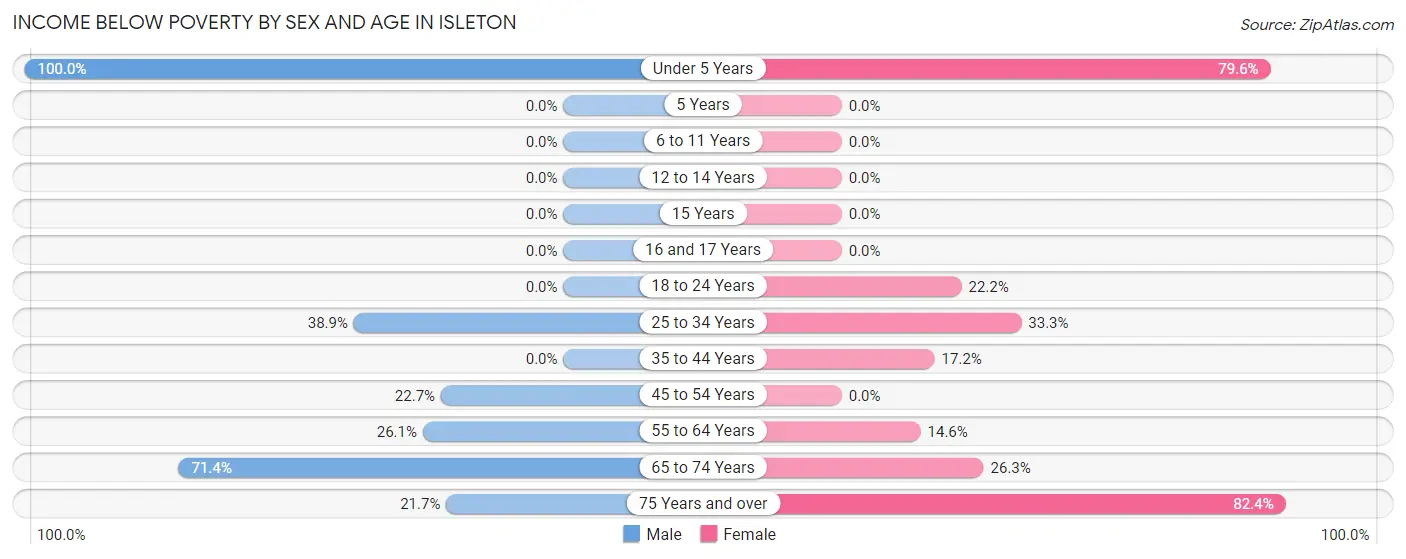
| Age Bracket | Male | Female |
| Under 5 Years | 19 (100.0%) | 35 (79.5%) |
| 5 Years | 0 (0.0%) | 0 (0.0%) |
| 6 to 11 Years | 0 (0.0%) | 0 (0.0%) |
| 12 to 14 Years | 0 (0.0%) | 0 (0.0%) |
| 15 Years | 0 (0.0%) | 0 (0.0%) |
| 16 and 17 Years | 0 (0.0%) | 0 (0.0%) |
| 18 to 24 Years | 0 (0.0%) | 12 (22.2%) |
| 25 to 34 Years | 21 (38.9%) | 22 (33.3%) |
| 35 to 44 Years | 0 (0.0%) | 5 (17.2%) |
| 45 to 54 Years | 5 (22.7%) | 0 (0.0%) |
| 55 to 64 Years | 6 (26.1%) | 6 (14.6%) |
| 65 to 74 Years | 5 (71.4%) | 5 (26.3%) |
| 75 Years and over | 5 (21.7%) | 28 (82.4%) |
| Total | 61 (30.3%) | 113 (33.5%) |
Income Above Poverty by Sex and Age in Isleton
According to the poverty statistics in Isleton, males aged 6 to 11 years and females aged 5 years are the age groups that are most secure financially, with 100.0% of males and 100.0% of females in these age groups living above the poverty line.
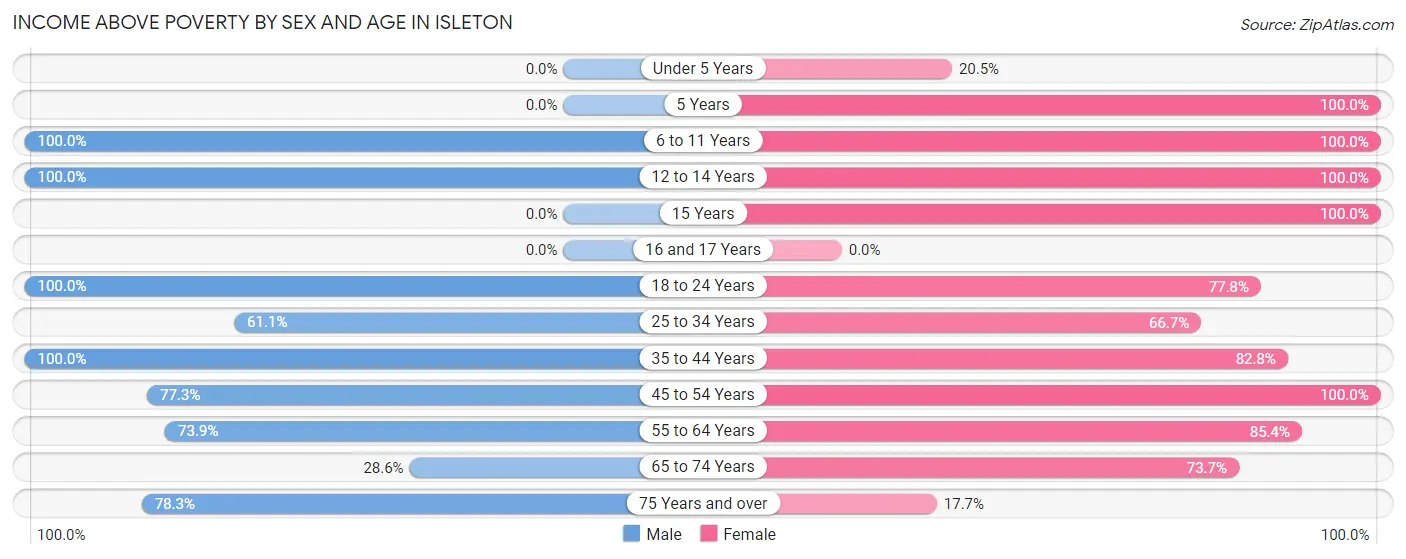
| Age Bracket | Male | Female |
| Under 5 Years | 0 (0.0%) | 9 (20.4%) |
| 5 Years | 0 (0.0%) | 3 (100.0%) |
| 6 to 11 Years | 12 (100.0%) | 29 (100.0%) |
| 12 to 14 Years | 6 (100.0%) | 10 (100.0%) |
| 15 Years | 0 (0.0%) | 4 (100.0%) |
| 16 and 17 Years | 0 (0.0%) | 0 (0.0%) |
| 18 to 24 Years | 8 (100.0%) | 42 (77.8%) |
| 25 to 34 Years | 33 (61.1%) | 44 (66.7%) |
| 35 to 44 Years | 27 (100.0%) | 24 (82.8%) |
| 45 to 54 Years | 17 (77.3%) | 4 (100.0%) |
| 55 to 64 Years | 17 (73.9%) | 35 (85.4%) |
| 65 to 74 Years | 2 (28.6%) | 14 (73.7%) |
| 75 Years and over | 18 (78.3%) | 6 (17.6%) |
| Total | 140 (69.7%) | 224 (66.5%) |
Income Below Poverty Among Married-Couple Families in Isleton
The poverty statistics for married-couple families in Isleton show that 23.9% or 17 of the total 71 families live below the poverty line. Families with 3 or 4 children have the highest poverty rate of 100.0%, comprising of 12 families. On the other hand, families with no children have the lowest poverty rate of 0.0%, which includes 0 families.
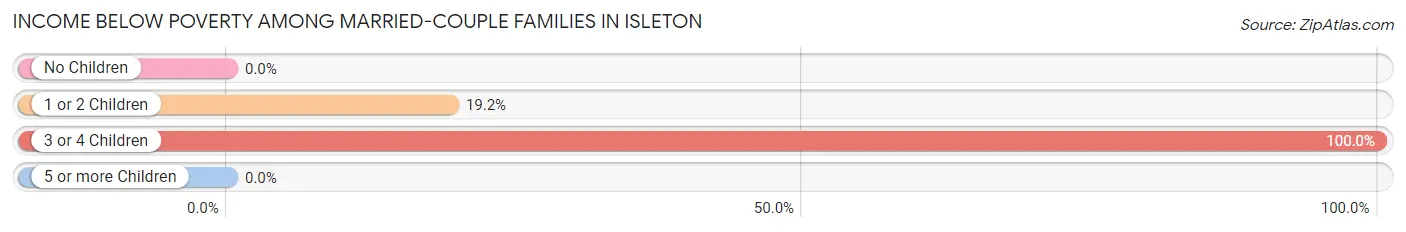
| Children | Above Poverty | Below Poverty |
| No Children | 33 (100.0%) | 0 (0.0%) |
| 1 or 2 Children | 21 (80.8%) | 5 (19.2%) |
| 3 or 4 Children | 0 (0.0%) | 12 (100.0%) |
| 5 or more Children | 0 (0.0%) | 0 (0.0%) |
| Total | 54 (76.1%) | 17 (23.9%) |
Income Below Poverty Among Single-Parent Households in Isleton
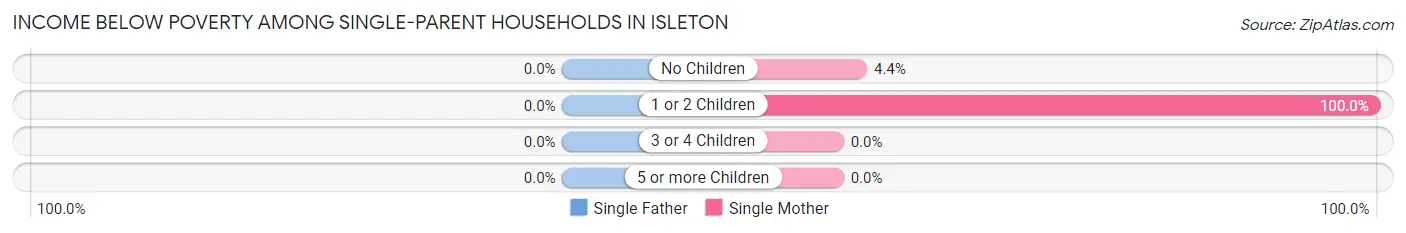
| Children | Single Father | Single Mother |
| No Children | 0 (0.0%) | 1 (4.3%) |
| 1 or 2 Children | 0 (0.0%) | 5 (100.0%) |
| 3 or 4 Children | 0 (0.0%) | 0 (0.0%) |
| 5 or more Children | 0 (0.0%) | 0 (0.0%) |
| Total | 0 (0.0%) | 6 (18.2%) |
Income Below Poverty Among Married-Couple vs Single-Parent Households in Isleton
The poverty data for Isleton shows that 17 of the married-couple family households (23.9%) and 6 of the single-parent households (15.4%) are living below the poverty level. Within the married-couple family households, those with 3 or 4 children have the highest poverty rate, with 12 households (100.0%) falling below the poverty line. Among the single-parent households, those with 1 or 2 children have the highest poverty rate, with 5 household (100.0%) living below poverty.
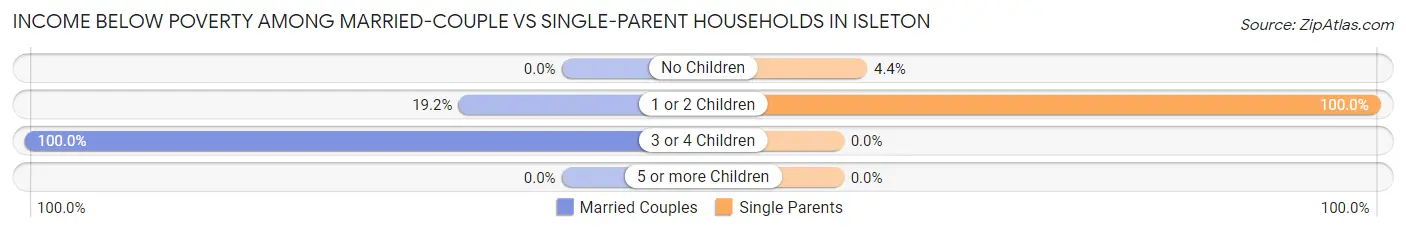
| Children | Married-Couple Families | Single-Parent Households |
| No Children | 0 (0.0%) | 1 (4.3%) |
| 1 or 2 Children | 5 (19.2%) | 5 (100.0%) |
| 3 or 4 Children | 12 (100.0%) | 0 (0.0%) |
| 5 or more Children | 0 (0.0%) | 0 (0.0%) |
| Total | 17 (23.9%) | 6 (15.4%) |
Race in Isleton
The most populous races in Isleton are White / Caucasian (319 | 59.3%), Hispanic or Latino (304 | 56.5%), and Some other Race (132 | 24.5%).
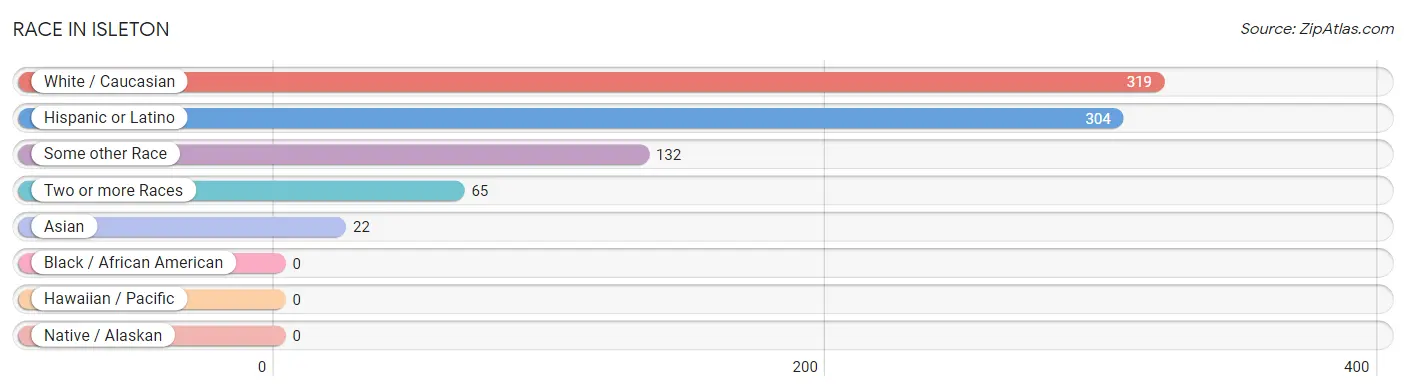
| Race | # Population | % Population |
| Asian | 22 | 4.1% |
| Black / African American | 0 | 0.0% |
| Hawaiian / Pacific | 0 | 0.0% |
| Hispanic or Latino | 304 | 56.5% |
| Native / Alaskan | 0 | 0.0% |
| White / Caucasian | 319 | 59.3% |
| Two or more Races | 65 | 12.1% |
| Some other Race | 132 | 24.5% |
| Total | 538 | 100.0% |
Ancestry in Isleton
The most populous ancestries reported in Isleton are Mexican (283 | 52.6%), German (54 | 10.0%), English (46 | 8.6%), Irish (29 | 5.4%), and Swedish (20 | 3.7%), together accounting for 80.3% of all Isleton residents.
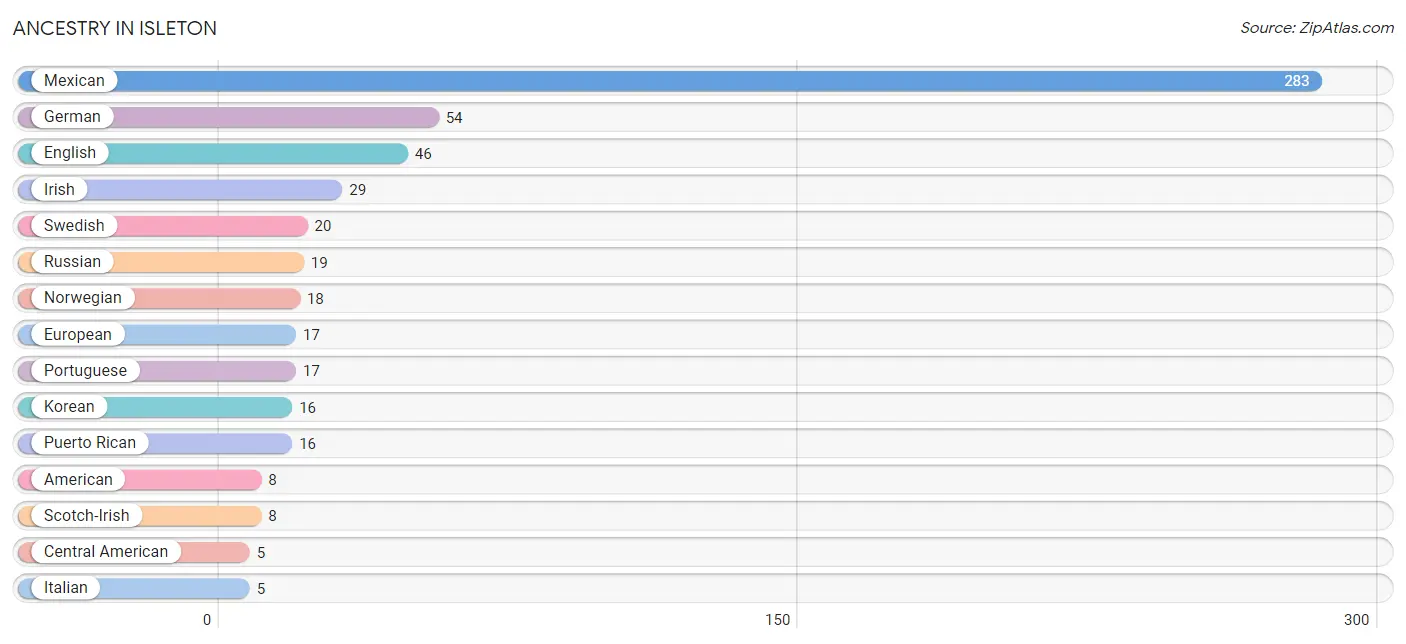
| Ancestry | # Population | % Population |
| American | 8 | 1.5% |
| Central American | 5 | 0.9% |
| Danish | 4 | 0.7% |
| English | 46 | 8.6% |
| European | 17 | 3.2% |
| French | 4 | 0.7% |
| French Canadian | 1 | 0.2% |
| German | 54 | 10.0% |
| Irish | 29 | 5.4% |
| Italian | 5 | 0.9% |
| Korean | 16 | 3.0% |
| Mexican | 283 | 52.6% |
| Mongolian | 4 | 0.7% |
| Norwegian | 18 | 3.4% |
| Polish | 5 | 0.9% |
| Portuguese | 17 | 3.2% |
| Puerto Rican | 16 | 3.0% |
| Russian | 19 | 3.5% |
| Salvadoran | 5 | 0.9% |
| Scotch-Irish | 8 | 1.5% |
| Sri Lankan | 5 | 0.9% |
| Swedish | 20 | 3.7% |
| Thai | 2 | 0.4% | View All 23 Rows |
Immigrants in Isleton
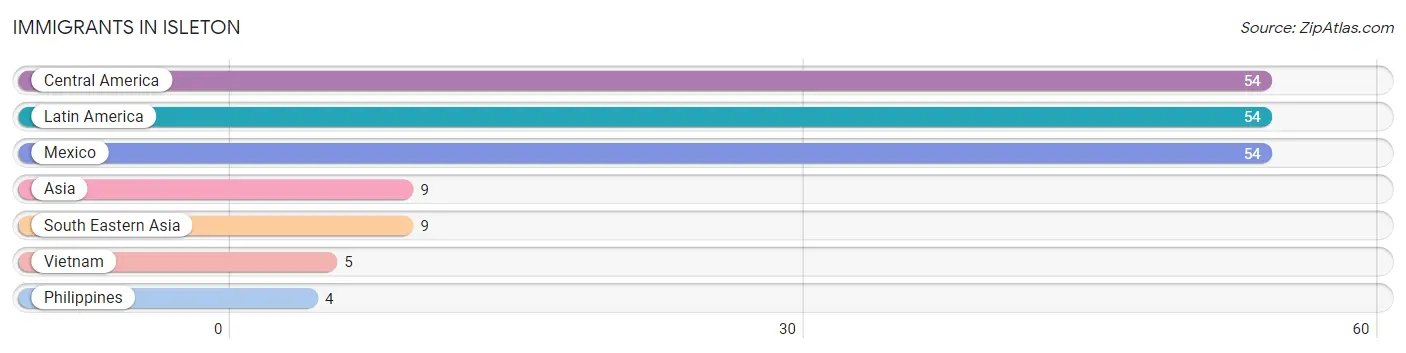
The most numerous immigrant groups reported in Isleton came from Central America (54 | 10.0%), Latin America (54 | 10.0%), Mexico (54 | 10.0%), Asia (9 | 1.7%), and South Eastern Asia (9 | 1.7%), together accounting for 33.5% of all Isleton residents.
| Immigration Origin | # Population | % Population |
| Asia | 9 | 1.7% |
| Central America | 54 | 10.0% |
| Latin America | 54 | 10.0% |
| Mexico | 54 | 10.0% |
| Philippines | 4 | 0.7% |
| South Eastern Asia | 9 | 1.7% |
| Vietnam | 5 | 0.9% | View All 7 Rows |
Sex and Age in Isleton
Sex and Age in Isleton
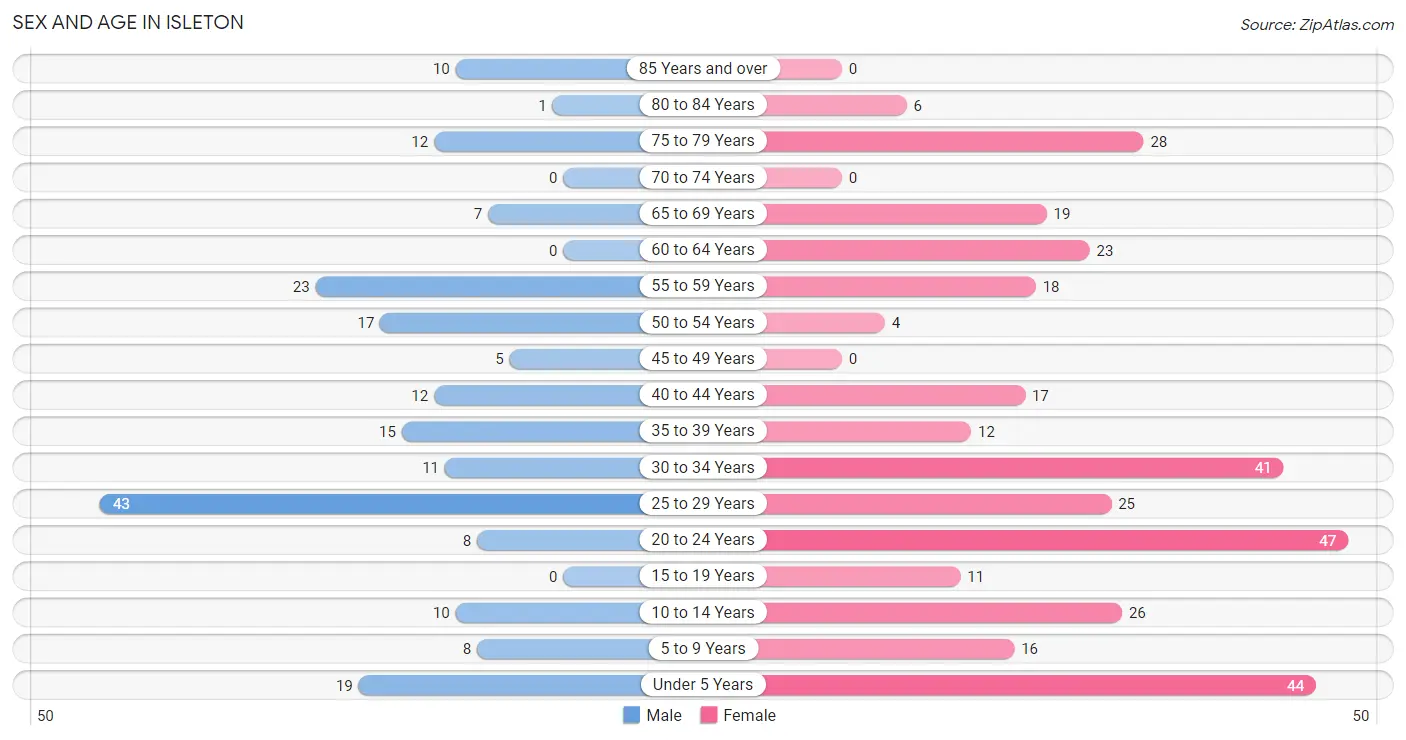
The most populous age groups in Isleton are 25 to 29 Years (43 | 21.4%) for men and 20 to 24 Years (47 | 14.0%) for women.
| Age Bracket | Male | Female |
| Under 5 Years | 19 (9.5%) | 44 (13.1%) |
| 5 to 9 Years | 8 (4.0%) | 16 (4.8%) |
| 10 to 14 Years | 10 (5.0%) | 26 (7.7%) |
| 15 to 19 Years | 0 (0.0%) | 11 (3.3%) |
| 20 to 24 Years | 8 (4.0%) | 47 (14.0%) |
| 25 to 29 Years | 43 (21.4%) | 25 (7.4%) |
| 30 to 34 Years | 11 (5.5%) | 41 (12.2%) |
| 35 to 39 Years | 15 (7.5%) | 12 (3.6%) |
| 40 to 44 Years | 12 (6.0%) | 17 (5.0%) |
| 45 to 49 Years | 5 (2.5%) | 0 (0.0%) |
| 50 to 54 Years | 17 (8.5%) | 4 (1.2%) |
| 55 to 59 Years | 23 (11.4%) | 18 (5.3%) |
| 60 to 64 Years | 0 (0.0%) | 23 (6.8%) |
| 65 to 69 Years | 7 (3.5%) | 19 (5.6%) |
| 70 to 74 Years | 0 (0.0%) | 0 (0.0%) |
| 75 to 79 Years | 12 (6.0%) | 28 (8.3%) |
| 80 to 84 Years | 1 (0.5%) | 6 (1.8%) |
| 85 Years and over | 10 (5.0%) | 0 (0.0%) |
| Total | 201 (100.0%) | 337 (100.0%) |
Families and Households in Isleton
Median Family Size in Isleton
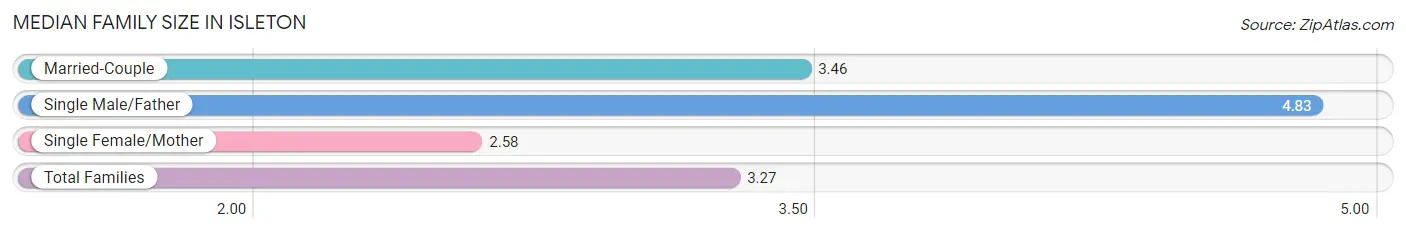
The median family size in Isleton is 3.27 persons per family, with single male/father families (6 | 5.4%) accounting for the largest median family size of 4.83 persons per family. On the other hand, single female/mother families (33 | 30.0%) represent the smallest median family size with 2.58 persons per family.
| Family Type | # Families | Family Size |
| Married-Couple | 71 (64.5%) | 3.46 |
| Single Male/Father | 6 (5.4%) | 4.83 |
| Single Female/Mother | 33 (30.0%) | 2.58 |
| Total Families | 110 (100.0%) | 3.27 |
Median Household Size in Isleton
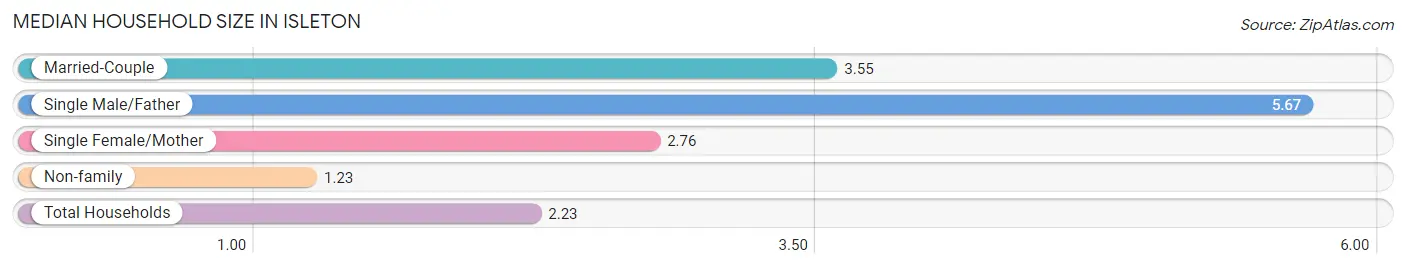
The median household size in Isleton is 2.23 persons per household, with single male/father households (6 | 2.5%) accounting for the largest median household size of 5.67 persons per household. non-family households (131 | 54.4%) represent the smallest median household size with 1.23 persons per household.
| Household Type | # Households | Household Size |
| Married-Couple | 71 (29.5%) | 3.55 |
| Single Male/Father | 6 (2.5%) | 5.67 |
| Single Female/Mother | 33 (13.7%) | 2.76 |
| Non-family | 131 (54.4%) | 1.23 |
| Total Households | 241 (100.0%) | 2.23 |
Household Size by Marriage Status in Isleton
Out of a total of 241 households in Isleton, 110 (45.6%) are family households, while 131 (54.4%) are nonfamily households. The most numerous type of family households are 2-person households, comprising 50, and the most common type of nonfamily households are 1-person households, comprising 106.
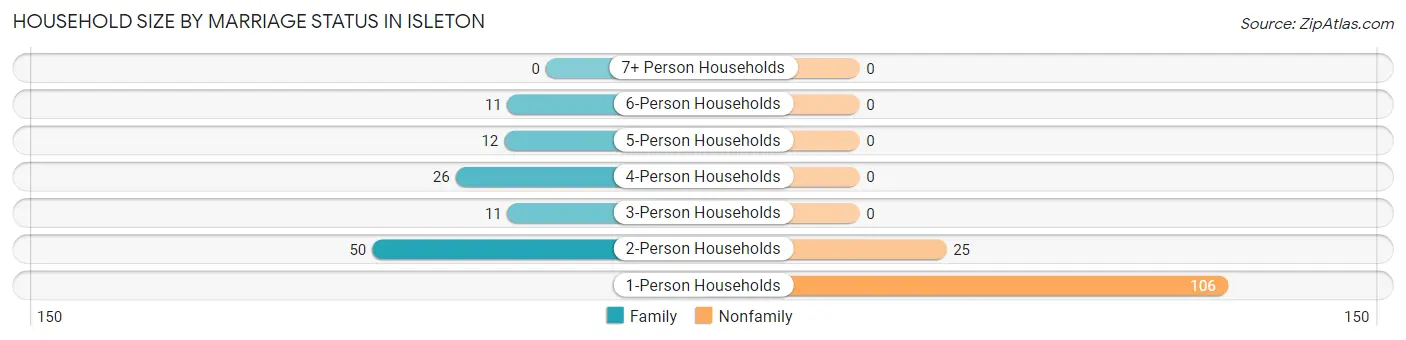
| Household Size | Family Households | Nonfamily Households |
| 1-Person Households | - | 106 (44.0%) |
| 2-Person Households | 50 (20.7%) | 25 (10.4%) |
| 3-Person Households | 11 (4.6%) | 0 (0.0%) |
| 4-Person Households | 26 (10.8%) | 0 (0.0%) |
| 5-Person Households | 12 (5.0%) | 0 (0.0%) |
| 6-Person Households | 11 (4.6%) | 0 (0.0%) |
| 7+ Person Households | 0 (0.0%) | 0 (0.0%) |
| Total | 110 (45.6%) | 131 (54.4%) |
Female Fertility in Isleton
Fertility by Age in Isleton
Average fertility rate in Isleton is 78.0 births per 1,000 women. Women in the age bracket of 20 to 34 years have the highest fertility rate with 106.0 births per 1,000 women. Women in the age bracket of 20 to 34 years acount for 100.0% of all women with births.
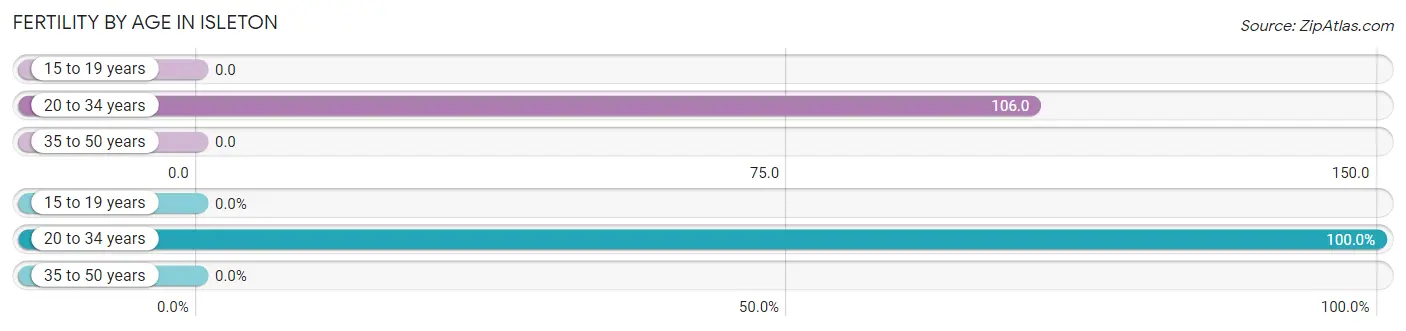
| Age Bracket | Women with Births | Births / 1,000 Women |
| 15 to 19 years | 0 (0.0%) | 0.0 |
| 20 to 34 years | 12 (100.0%) | 106.0 |
| 35 to 50 years | 0 (0.0%) | 0.0 |
| Total | 12 (100.0%) | 78.0 |
Fertility by Age by Marriage Status in Isleton
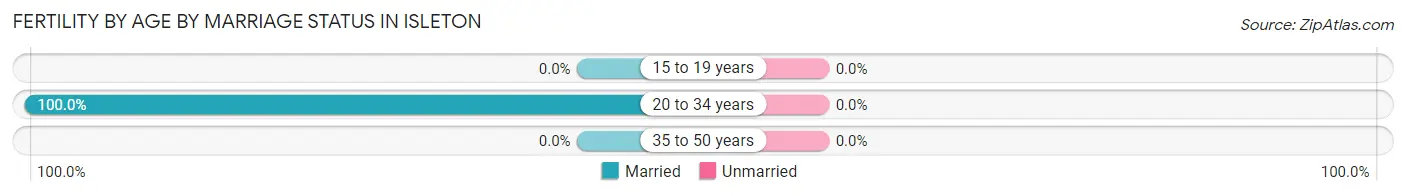
| Age Bracket | Married | Unmarried |
| 15 to 19 years | 0 (0.0%) | 0 (0.0%) |
| 20 to 34 years | 12 (100.0%) | 0 (0.0%) |
| 35 to 50 years | 0 (0.0%) | 0 (0.0%) |
| Total | 12 (100.0%) | 0 (0.0%) |
Fertility by Education in Isleton
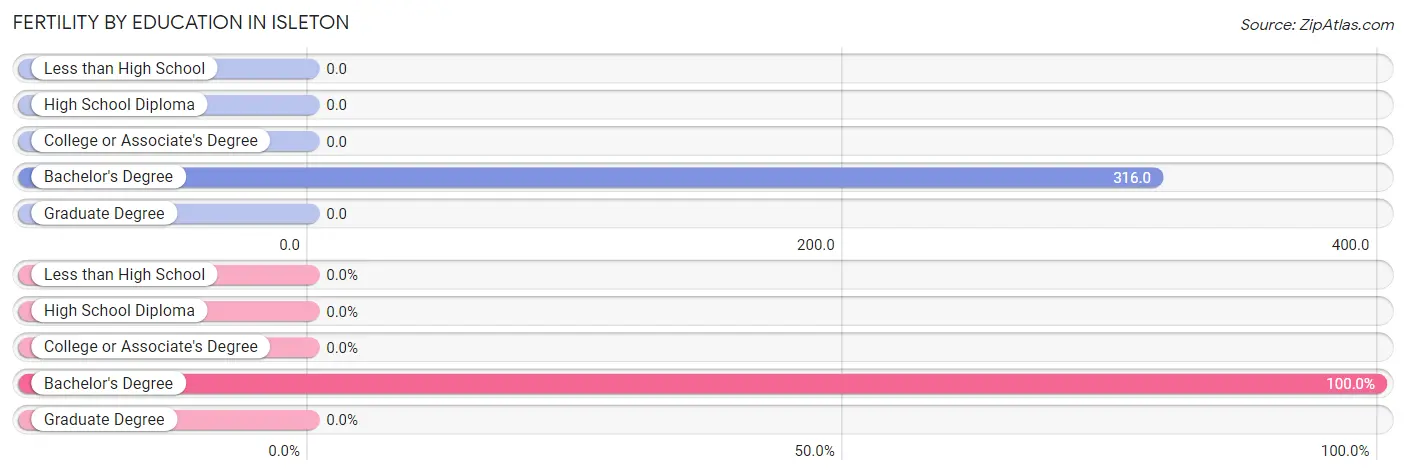
| Educational Attainment | Women with Births | Births / 1,000 Women |
| Less than High School | 0 (0.0%) | 0.0 |
| High School Diploma | 0 (0.0%) | 0.0 |
| College or Associate's Degree | 0 (0.0%) | 0.0 |
| Bachelor's Degree | 12 (100.0%) | 316.0 |
| Graduate Degree | 0 (0.0%) | 0.0 |
| Total | 12 (100.0%) | 78.0 |
Fertility by Education by Marriage Status in Isleton
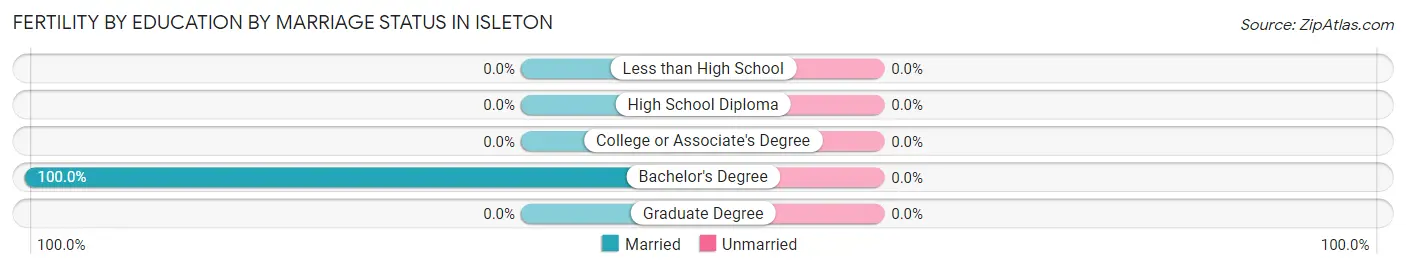
| Educational Attainment | Married | Unmarried |
| Less than High School | 0 (0.0%) | 0 (0.0%) |
| High School Diploma | 0 (0.0%) | 0 (0.0%) |
| College or Associate's Degree | 0 (0.0%) | 0 (0.0%) |
| Bachelor's Degree | 12 (100.0%) | 0 (0.0%) |
| Graduate Degree | 0 (0.0%) | 0 (0.0%) |
| Total | 12 (100.0%) | 0 (0.0%) |
Employment Characteristics in Isleton
Employment by Class of Employer in Isleton
Among the 239 employed individuals in Isleton, private company employees (187 | 78.2%), local government employees (20 | 8.4%), and federal government employees (16 | 6.7%) make up the most common classes of employment.
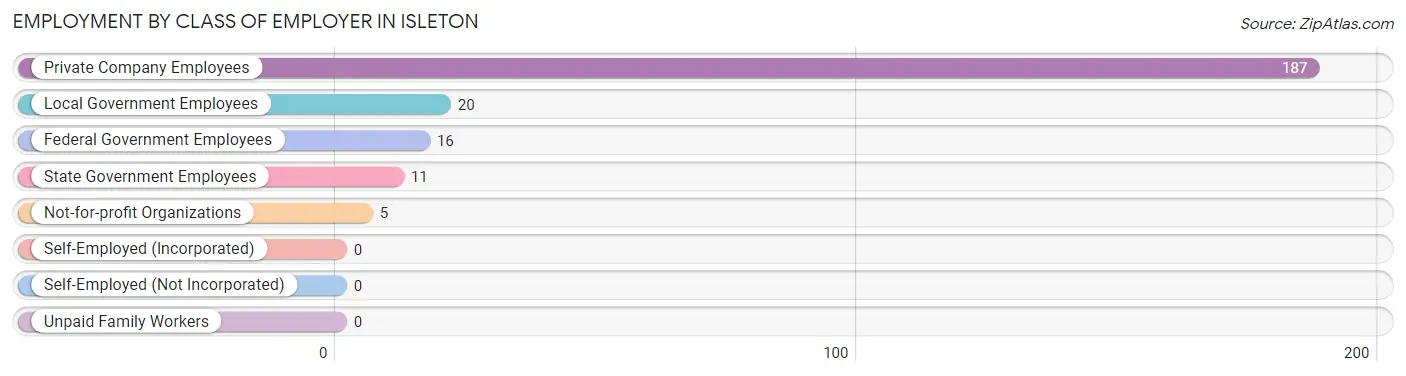
| Employer Class | # Employees | % Employees |
| Private Company Employees | 187 | 78.2% |
| Self-Employed (Incorporated) | 0 | 0.0% |
| Self-Employed (Not Incorporated) | 0 | 0.0% |
| Not-for-profit Organizations | 5 | 2.1% |
| Local Government Employees | 20 | 8.4% |
| State Government Employees | 11 | 4.6% |
| Federal Government Employees | 16 | 6.7% |
| Unpaid Family Workers | 0 | 0.0% |
| Total | 239 | 100.0% |
Employment Status by Age in Isleton
According to the labor force statistics for Isleton, out of the total population over 16 years of age (411), 69.8% or 287 individuals are in the labor force, with 17.5% or 50 of them unemployed. The age group with the highest labor force participation rate is 20 to 24 years, with 100.0% or 55 individuals in the labor force. Within the labor force, the 16 to 19 years age range has the highest percentage of unemployed individuals, with 100.0% or 6 of them being unemployed.
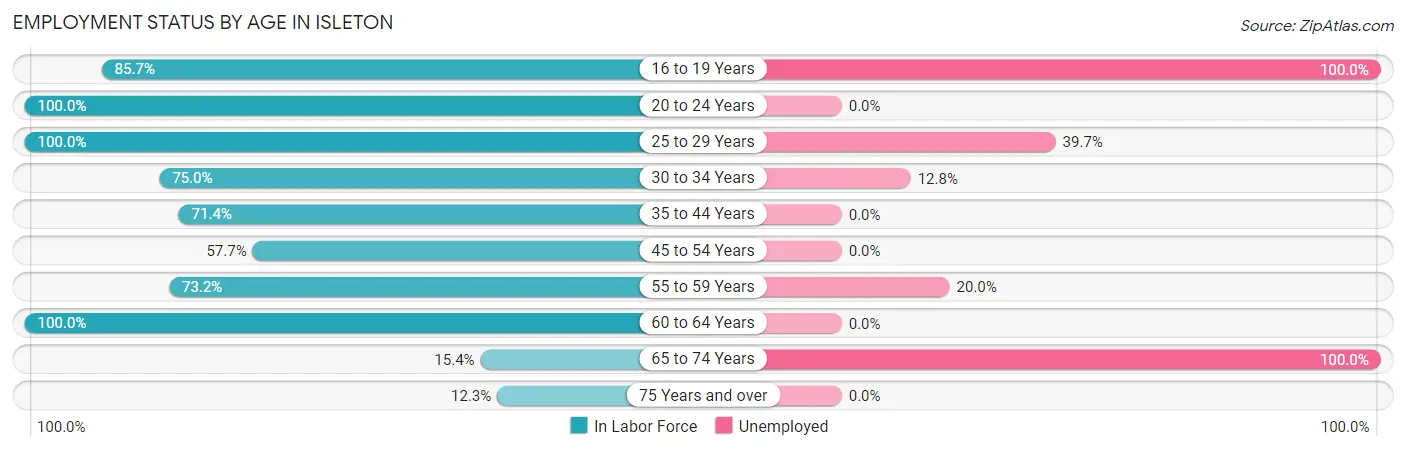
| Age Bracket | In Labor Force | Unemployed |
| 16 to 19 Years | 6 (85.7%) | 6 (100.0%) |
| 20 to 24 Years | 55 (100.0%) | 0 (0.0%) |
| 25 to 29 Years | 68 (100.0%) | 27 (39.7%) |
| 30 to 34 Years | 39 (75.0%) | 5 (12.8%) |
| 35 to 44 Years | 40 (71.4%) | 0 (0.0%) |
| 45 to 54 Years | 15 (57.7%) | 0 (0.0%) |
| 55 to 59 Years | 30 (73.2%) | 6 (20.0%) |
| 60 to 64 Years | 23 (100.0%) | 0 (0.0%) |
| 65 to 74 Years | 4 (15.4%) | 4 (100.0%) |
| 75 Years and over | 7 (12.3%) | 0 (0.0%) |
| Total | 287 (69.8%) | 50 (17.5%) |
Employment Status by Educational Attainment in Isleton
According to labor force statistics for Isleton, 80.8% of individuals (215) out of the total population between 25 and 64 years of age (266) are in the labor force, with 17.7% or 38 of them being unemployed. The group with the highest labor force participation rate are those with the educational attainment of bachelor's degree or higher, with 100.0% or 35 individuals in the labor force. Within the labor force, individuals with high school diploma education have the highest percentage of unemployment, with 57.6% or 38 of them being unemployed.
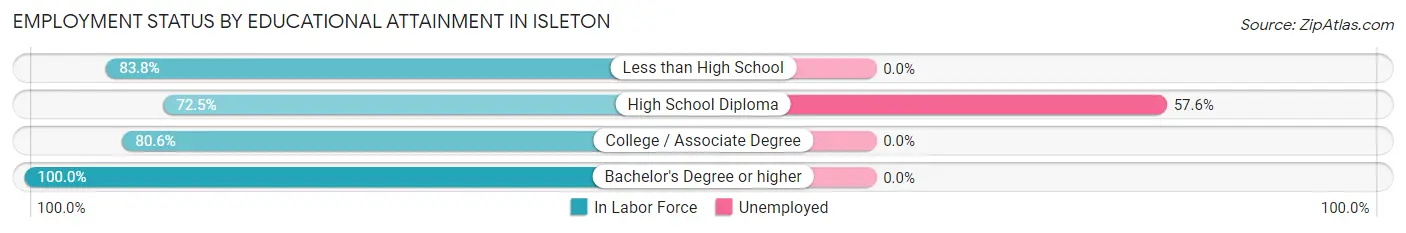
| Educational Attainment | In Labor Force | Unemployed |
| Less than High School | 31 (83.8%) | 0 (0.0%) |
| High School Diploma | 66 (72.5%) | 52 (57.6%) |
| College / Associate Degree | 83 (80.6%) | 0 (0.0%) |
| Bachelor's Degree or higher | 35 (100.0%) | 0 (0.0%) |
| Total | 215 (80.8%) | 47 (17.7%) |
Employment Occupations by Sex in Isleton
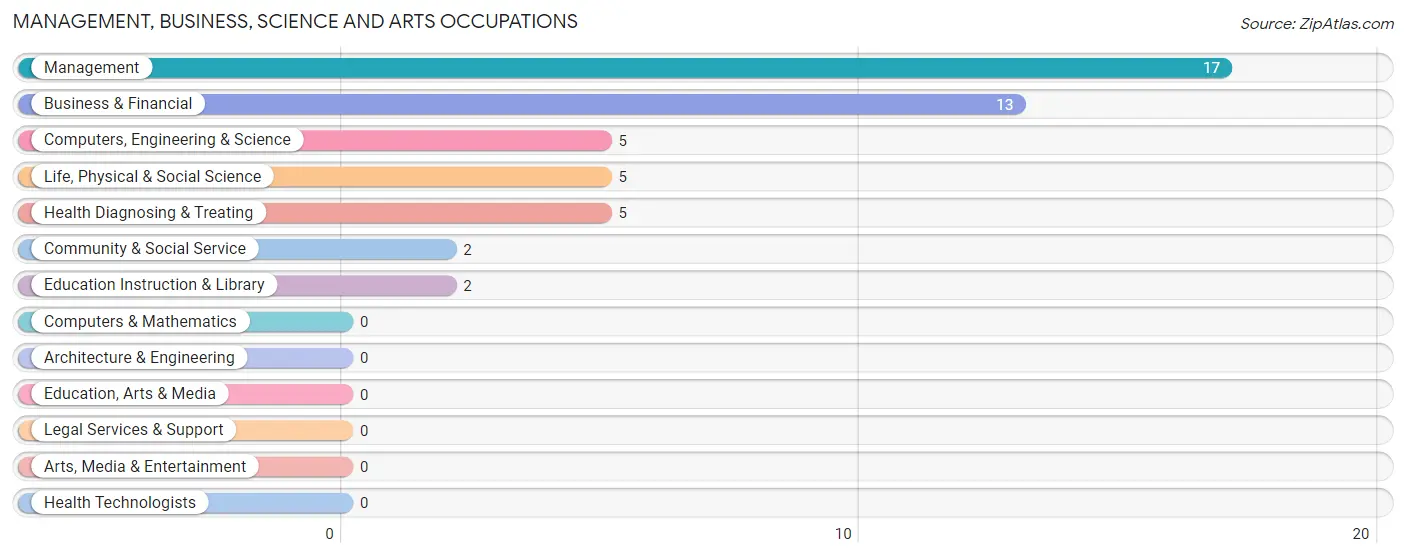
Management, Business, Science and Arts Occupations
The most common Management, Business, Science and Arts occupations in Isleton are Management (17 | 7.5%), Business & Financial (13 | 5.7%), Computers, Engineering & Science (5 | 2.2%), Life, Physical & Social Science (5 | 2.2%), and Health Diagnosing & Treating (5 | 2.2%).
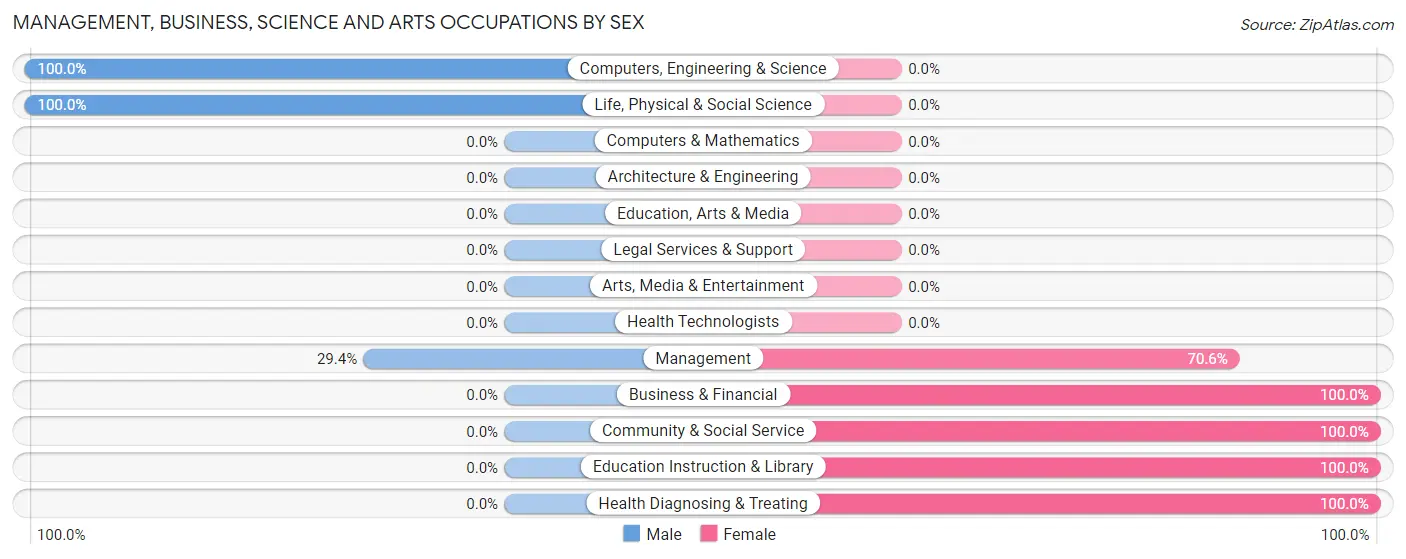
Management, Business, Science and Arts Occupations by Sex
Within the Management, Business, Science and Arts occupations in Isleton, the most male-oriented occupations are Computers, Engineering & Science (100.0%), Life, Physical & Social Science (100.0%), and Management (29.4%), while the most female-oriented occupations are Business & Financial (100.0%), Community & Social Service (100.0%), and Education Instruction & Library (100.0%).
| Occupation | Male | Female |
| Management | 5 (29.4%) | 12 (70.6%) |
| Business & Financial | 0 (0.0%) | 13 (100.0%) |
| Computers, Engineering & Science | 5 (100.0%) | 0 (0.0%) |
| Computers & Mathematics | 0 (0.0%) | 0 (0.0%) |
| Architecture & Engineering | 0 (0.0%) | 0 (0.0%) |
| Life, Physical & Social Science | 5 (100.0%) | 0 (0.0%) |
| Community & Social Service | 0 (0.0%) | 2 (100.0%) |
| Education, Arts & Media | 0 (0.0%) | 0 (0.0%) |
| Legal Services & Support | 0 (0.0%) | 0 (0.0%) |
| Education Instruction & Library | 0 (0.0%) | 2 (100.0%) |
| Arts, Media & Entertainment | 0 (0.0%) | 0 (0.0%) |
| Health Diagnosing & Treating | 0 (0.0%) | 5 (100.0%) |
| Health Technologists | 0 (0.0%) | 0 (0.0%) |
| Total (Category) | 10 (23.8%) | 32 (76.2%) |
| Total (Overall) | 94 (41.4%) | 133 (58.6%) |
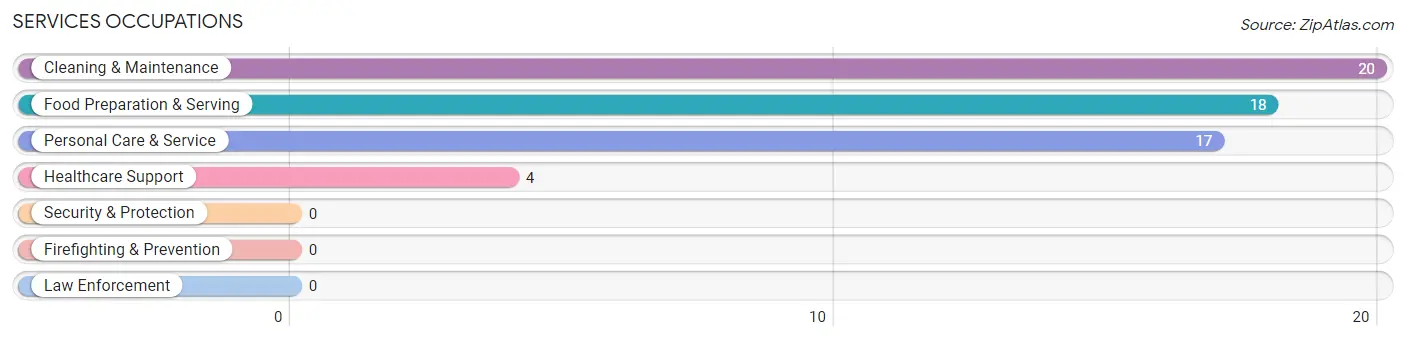
Services Occupations
The most common Services occupations in Isleton are Cleaning & Maintenance (20 | 8.8%), Food Preparation & Serving (18 | 7.9%), Personal Care & Service (17 | 7.5%), and Healthcare Support (4 | 1.8%).
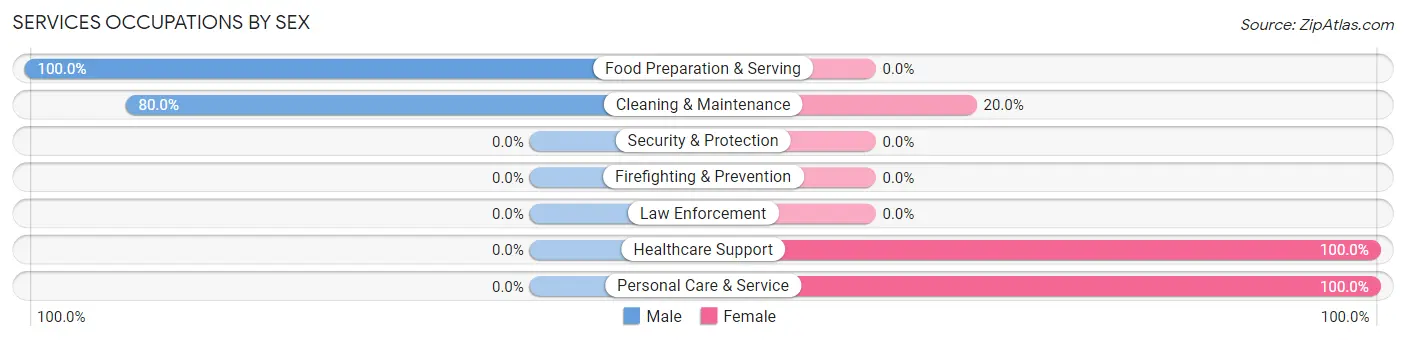
Services Occupations by Sex
Within the Services occupations in Isleton, the most male-oriented occupations are Food Preparation & Serving (100.0%), and Cleaning & Maintenance (80.0%), while the most female-oriented occupations are Healthcare Support (100.0%), Personal Care & Service (100.0%), and Cleaning & Maintenance (20.0%).
| Occupation | Male | Female |
| Healthcare Support | 0 (0.0%) | 4 (100.0%) |
| Security & Protection | 0 (0.0%) | 0 (0.0%) |
| Firefighting & Prevention | 0 (0.0%) | 0 (0.0%) |
| Law Enforcement | 0 (0.0%) | 0 (0.0%) |
| Food Preparation & Serving | 18 (100.0%) | 0 (0.0%) |
| Cleaning & Maintenance | 16 (80.0%) | 4 (20.0%) |
| Personal Care & Service | 0 (0.0%) | 17 (100.0%) |
| Total (Category) | 34 (57.6%) | 25 (42.4%) |
| Total (Overall) | 94 (41.4%) | 133 (58.6%) |
Sales and Office Occupations
The most common Sales and Office occupations in Isleton are Office & Administration (33 | 14.5%), and Sales & Related (9 | 4.0%).
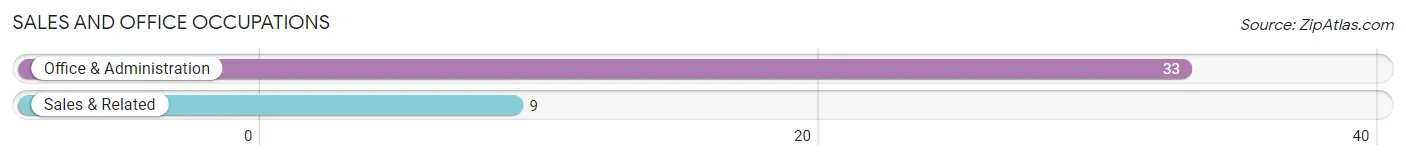
Sales and Office Occupations by Sex
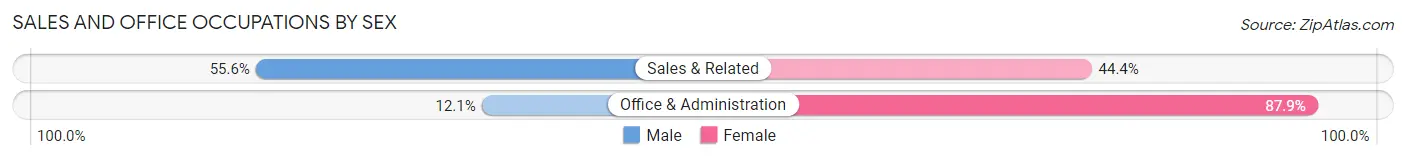
| Occupation | Male | Female |
| Sales & Related | 5 (55.6%) | 4 (44.4%) |
| Office & Administration | 4 (12.1%) | 29 (87.9%) |
| Total (Category) | 9 (21.4%) | 33 (78.6%) |
| Total (Overall) | 94 (41.4%) | 133 (58.6%) |
Natural Resources, Construction and Maintenance Occupations
The most common Natural Resources, Construction and Maintenance occupations in Isleton are Construction & Extraction (23 | 10.1%), and Farming, Fishing & Forestry (6 | 2.6%).
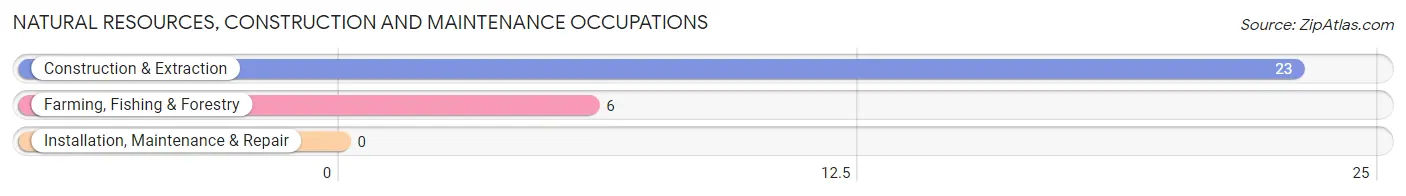
Natural Resources, Construction and Maintenance Occupations by Sex
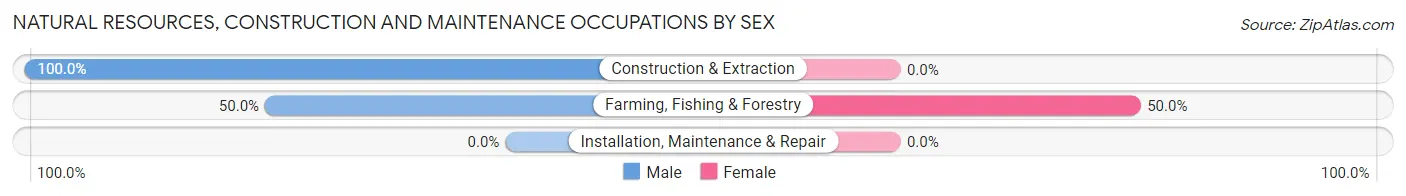
| Occupation | Male | Female |
| Farming, Fishing & Forestry | 3 (50.0%) | 3 (50.0%) |
| Construction & Extraction | 23 (100.0%) | 0 (0.0%) |
| Installation, Maintenance & Repair | 0 (0.0%) | 0 (0.0%) |
| Total (Category) | 26 (89.7%) | 3 (10.3%) |
| Total (Overall) | 94 (41.4%) | 133 (58.6%) |
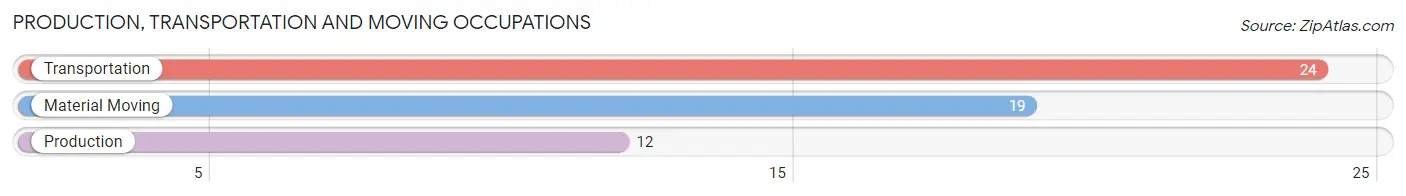
Production, Transportation and Moving Occupations
The most common Production, Transportation and Moving occupations in Isleton are Transportation (24 | 10.6%), Material Moving (19 | 8.4%), and Production (12 | 5.3%).
Production, Transportation and Moving Occupations by Sex
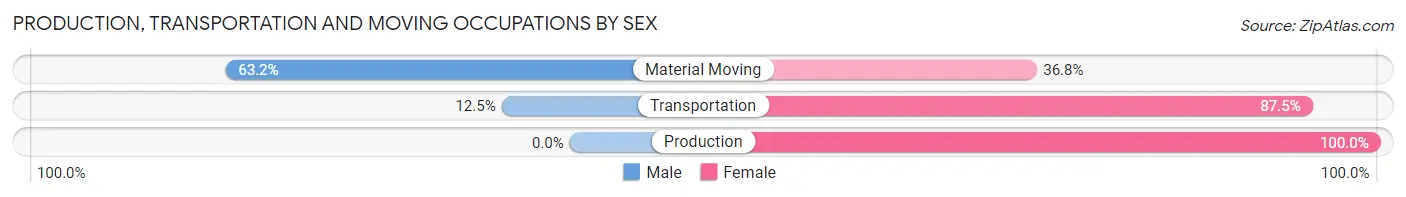
| Occupation | Male | Female |
| Production | 0 (0.0%) | 12 (100.0%) |
| Transportation | 3 (12.5%) | 21 (87.5%) |
| Material Moving | 12 (63.2%) | 7 (36.8%) |
| Total (Category) | 15 (27.3%) | 40 (72.7%) |
| Total (Overall) | 94 (41.4%) | 133 (58.6%) |
Employment Industries by Sex in Isleton
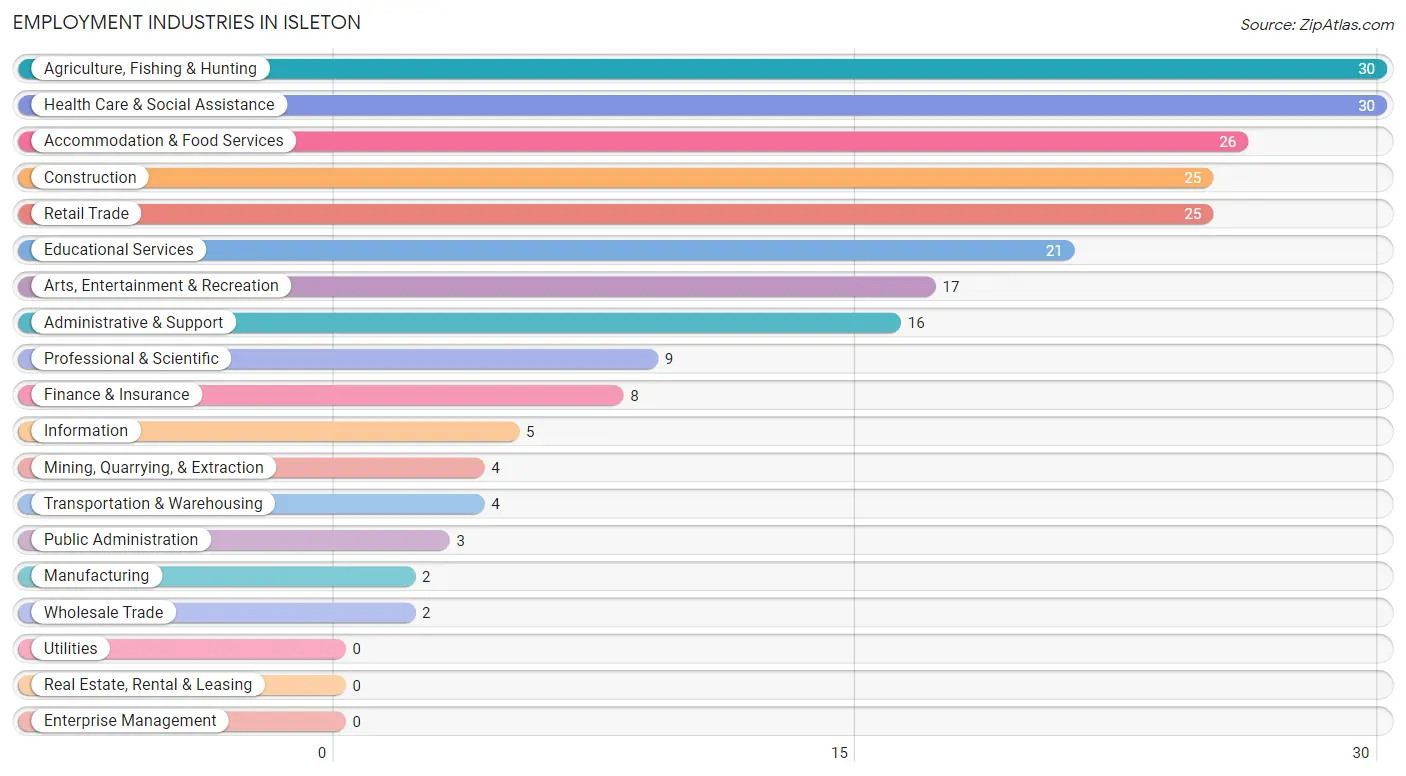
Employment Industries in Isleton
The major employment industries in Isleton include Agriculture, Fishing & Hunting (30 | 13.2%), Health Care & Social Assistance (30 | 13.2%), Accommodation & Food Services (26 | 11.5%), Construction (25 | 11.0%), and Retail Trade (25 | 11.0%).
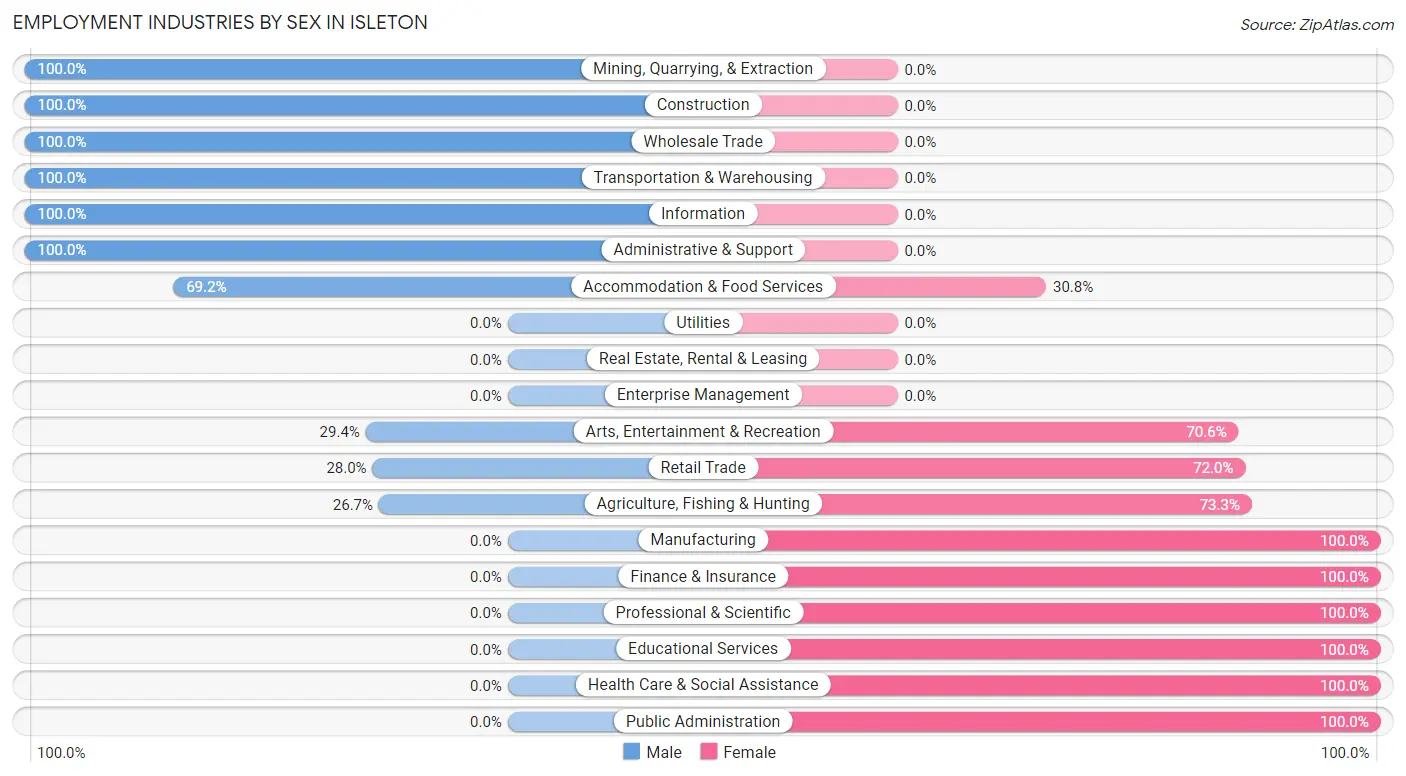
Employment Industries by Sex in Isleton
The Isleton industries that see more men than women are Mining, Quarrying, & Extraction (100.0%), Construction (100.0%), and Wholesale Trade (100.0%), whereas the industries that tend to have a higher number of women are Manufacturing (100.0%), Finance & Insurance (100.0%), and Professional & Scientific (100.0%).
| Industry | Male | Female |
| Agriculture, Fishing & Hunting | 8 (26.7%) | 22 (73.3%) |
| Mining, Quarrying, & Extraction | 4 (100.0%) | 0 (0.0%) |
| Construction | 25 (100.0%) | 0 (0.0%) |
| Manufacturing | 0 (0.0%) | 2 (100.0%) |
| Wholesale Trade | 2 (100.0%) | 0 (0.0%) |
| Retail Trade | 7 (28.0%) | 18 (72.0%) |
| Transportation & Warehousing | 4 (100.0%) | 0 (0.0%) |
| Utilities | 0 (0.0%) | 0 (0.0%) |
| Information | 5 (100.0%) | 0 (0.0%) |
| Finance & Insurance | 0 (0.0%) | 8 (100.0%) |
| Real Estate, Rental & Leasing | 0 (0.0%) | 0 (0.0%) |
| Professional & Scientific | 0 (0.0%) | 9 (100.0%) |
| Enterprise Management | 0 (0.0%) | 0 (0.0%) |
| Administrative & Support | 16 (100.0%) | 0 (0.0%) |
| Educational Services | 0 (0.0%) | 21 (100.0%) |
| Health Care & Social Assistance | 0 (0.0%) | 30 (100.0%) |
| Arts, Entertainment & Recreation | 5 (29.4%) | 12 (70.6%) |
| Accommodation & Food Services | 18 (69.2%) | 8 (30.8%) |
| Public Administration | 0 (0.0%) | 3 (100.0%) |
| Total | 94 (41.4%) | 133 (58.6%) |
Education in Isleton
School Enrollment in Isleton
The most common levels of schooling among the 120 students in Isleton are elementary school (26 | 21.7%), nursery / preschool (23 | 19.2%), and college / undergraduate (23 | 19.2%).
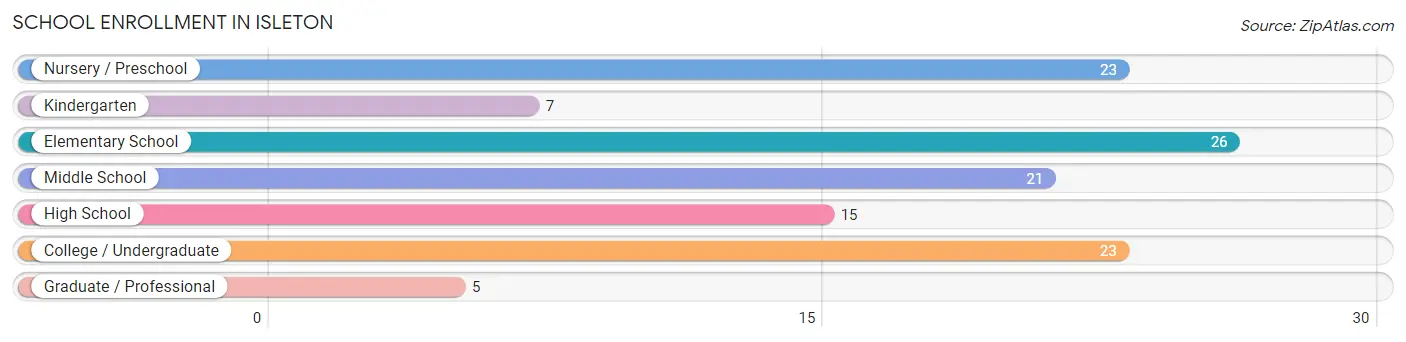
| School Level | # Students | % Students |
| Nursery / Preschool | 23 | 19.2% |
| Kindergarten | 7 | 5.8% |
| Elementary School | 26 | 21.7% |
| Middle School | 21 | 17.5% |
| High School | 15 | 12.5% |
| College / Undergraduate | 23 | 19.2% |
| Graduate / Professional | 5 | 4.2% |
| Total | 120 | 100.0% |
School Enrollment by Age by Funding Source in Isleton
Out of a total of 120 students who are enrolled in schools in Isleton, 21 (17.5%) attend a private institution, while the remaining 99 (82.5%) are enrolled in public schools. The age group of 35 years and over has the highest likelihood of being enrolled in private schools, with 5 (100.0% in the age bracket) enrolled. Conversely, the age group of 3 to 4 year olds has the lowest likelihood of being enrolled in a private school, with 23 (100.0% in the age bracket) attending a public institution.
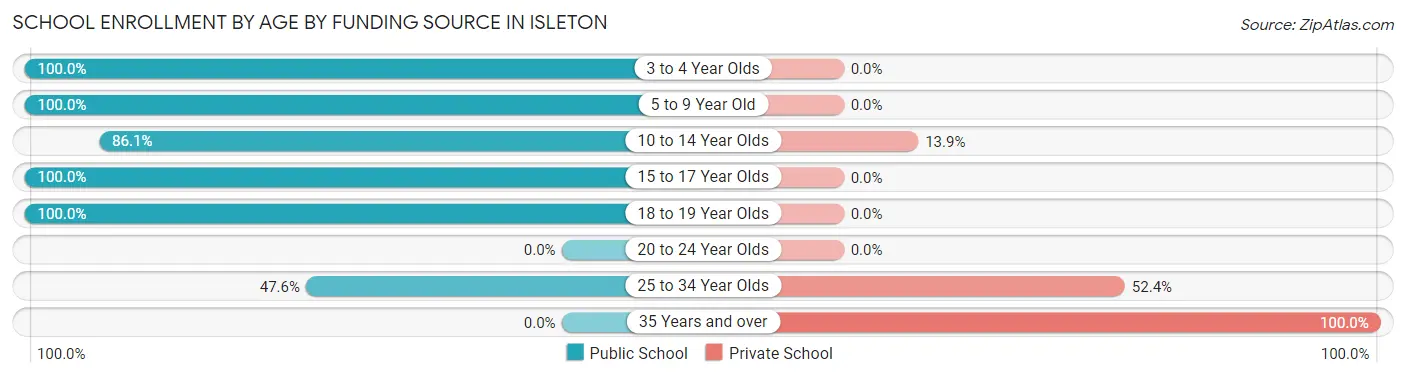
| Age Bracket | Public School | Private School |
| 3 to 4 Year Olds | 23 (100.0%) | 0 (0.0%) |
| 5 to 9 Year Old | 24 (100.0%) | 0 (0.0%) |
| 10 to 14 Year Olds | 31 (86.1%) | 5 (13.9%) |
| 15 to 17 Year Olds | 4 (100.0%) | 0 (0.0%) |
| 18 to 19 Year Olds | 7 (100.0%) | 0 (0.0%) |
| 20 to 24 Year Olds | 0 (0.0%) | 0 (0.0%) |
| 25 to 34 Year Olds | 10 (47.6%) | 11 (52.4%) |
| 35 Years and over | 0 (0.0%) | 5 (100.0%) |
| Total | 99 (82.5%) | 21 (17.5%) |
Educational Attainment by Field of Study in Isleton
Communications (17 | 36.2%), psychology (9 | 19.2%), arts & humanities (9 | 19.2%), business (7 | 14.9%), and social sciences (3 | 6.4%) are the most common fields of study among 47 individuals in Isleton who have obtained a bachelor's degree or higher.
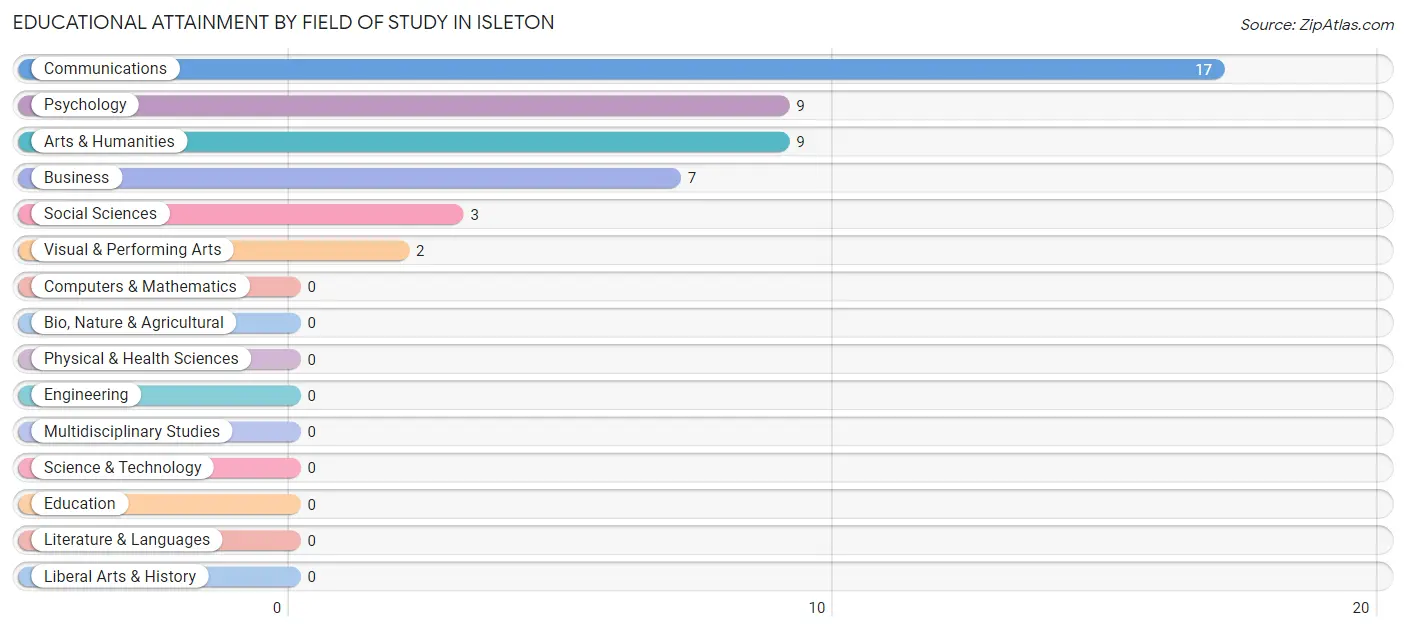
| Field of Study | # Graduates | % Graduates |
| Computers & Mathematics | 0 | 0.0% |
| Bio, Nature & Agricultural | 0 | 0.0% |
| Physical & Health Sciences | 0 | 0.0% |
| Psychology | 9 | 19.2% |
| Social Sciences | 3 | 6.4% |
| Engineering | 0 | 0.0% |
| Multidisciplinary Studies | 0 | 0.0% |
| Science & Technology | 0 | 0.0% |
| Business | 7 | 14.9% |
| Education | 0 | 0.0% |
| Literature & Languages | 0 | 0.0% |
| Liberal Arts & History | 0 | 0.0% |
| Visual & Performing Arts | 2 | 4.3% |
| Communications | 17 | 36.2% |
| Arts & Humanities | 9 | 19.2% |
| Total | 47 | 100.0% |
Transportation & Commute in Isleton
Vehicle Availability by Sex in Isleton
The most prevalent vehicle ownership categories in Isleton are males with 2 vehicles (38, accounting for 40.4%) and females with 2 vehicles (84, making up 26.2%).
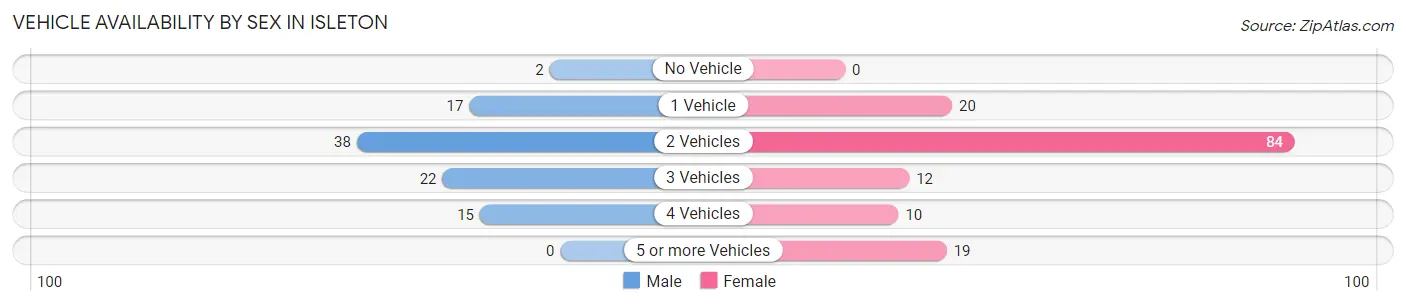
| Vehicles Available | Male | Female |
| No Vehicle | 2 (2.1%) | 0 (0.0%) |
| 1 Vehicle | 17 (18.1%) | 20 (13.8%) |
| 2 Vehicles | 38 (40.4%) | 84 (57.9%) |
| 3 Vehicles | 22 (23.4%) | 12 (8.3%) |
| 4 Vehicles | 15 (16.0%) | 10 (6.9%) |
| 5 or more Vehicles | 0 (0.0%) | 19 (13.1%) |
| Total | 94 (100.0%) | 145 (100.0%) |
Commute Time in Isleton
The most frequently occuring commute durations in Isleton are 15 to 19 minutes (72 commuters, 30.1%), 45 to 59 minutes (40 commuters, 16.7%), and 30 to 34 minutes (26 commuters, 10.9%).
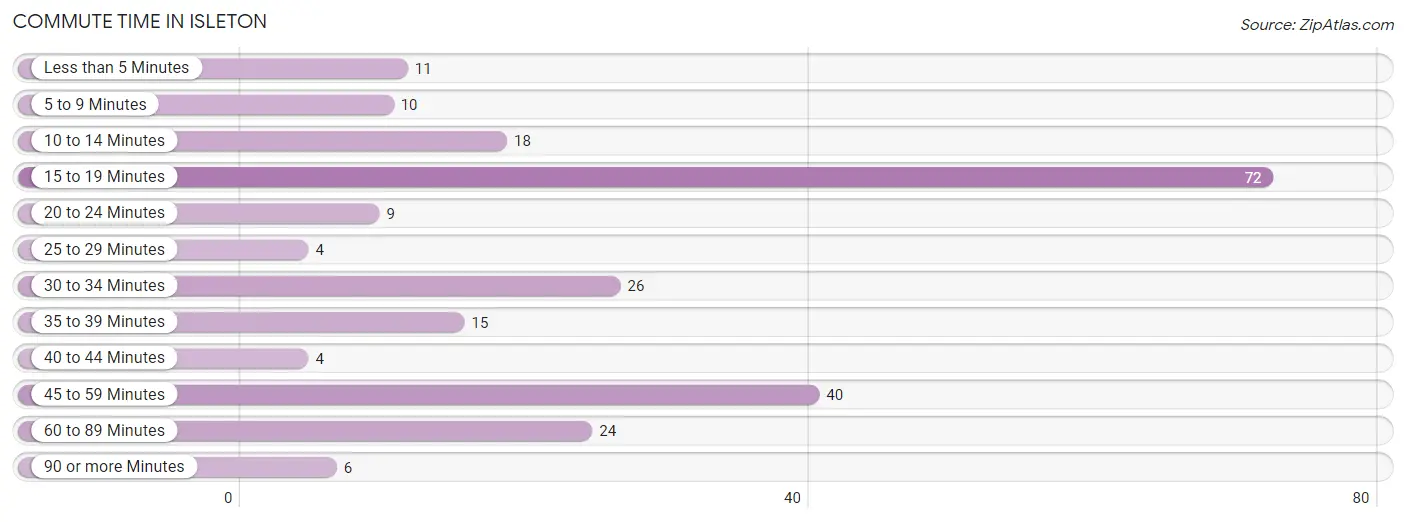
| Commute Time | # Commuters | % Commuters |
| Less than 5 Minutes | 11 | 4.6% |
| 5 to 9 Minutes | 10 | 4.2% |
| 10 to 14 Minutes | 18 | 7.5% |
| 15 to 19 Minutes | 72 | 30.1% |
| 20 to 24 Minutes | 9 | 3.8% |
| 25 to 29 Minutes | 4 | 1.7% |
| 30 to 34 Minutes | 26 | 10.9% |
| 35 to 39 Minutes | 15 | 6.3% |
| 40 to 44 Minutes | 4 | 1.7% |
| 45 to 59 Minutes | 40 | 16.7% |
| 60 to 89 Minutes | 24 | 10.0% |
| 90 or more Minutes | 6 | 2.5% |
Commute Time by Sex in Isleton
The most common commute times in Isleton are 30 to 34 minutes (22 commuters, 23.4%) for males and 15 to 19 minutes (61 commuters, 42.1%) for females.
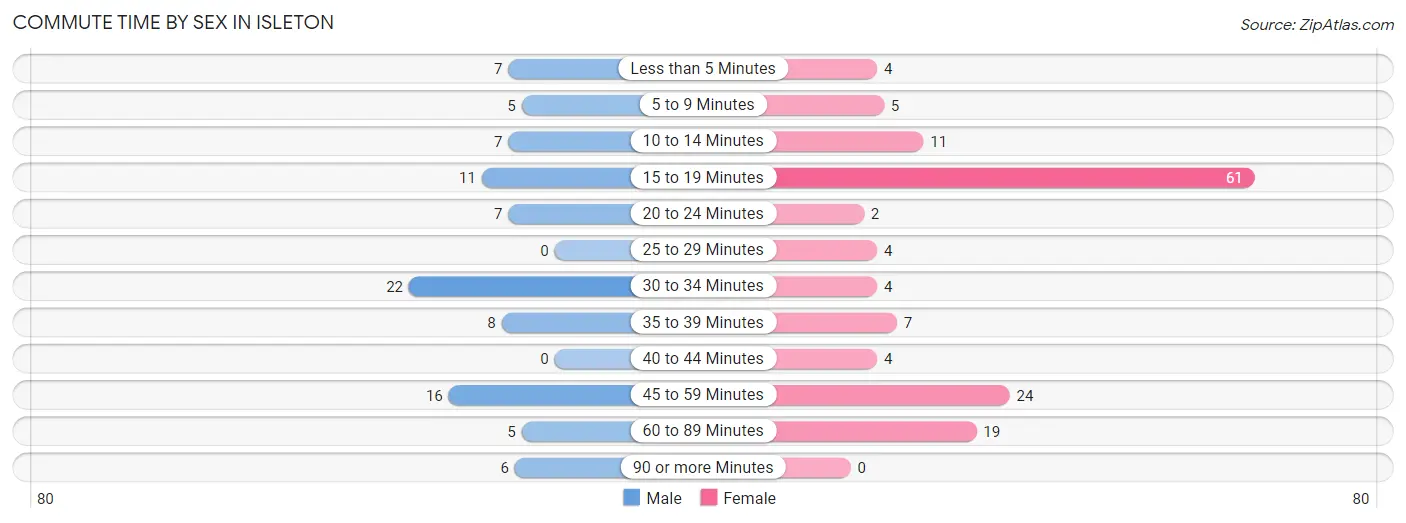
| Commute Time | Male | Female |
| Less than 5 Minutes | 7 (7.4%) | 4 (2.8%) |
| 5 to 9 Minutes | 5 (5.3%) | 5 (3.5%) |
| 10 to 14 Minutes | 7 (7.4%) | 11 (7.6%) |
| 15 to 19 Minutes | 11 (11.7%) | 61 (42.1%) |
| 20 to 24 Minutes | 7 (7.4%) | 2 (1.4%) |
| 25 to 29 Minutes | 0 (0.0%) | 4 (2.8%) |
| 30 to 34 Minutes | 22 (23.4%) | 4 (2.8%) |
| 35 to 39 Minutes | 8 (8.5%) | 7 (4.8%) |
| 40 to 44 Minutes | 0 (0.0%) | 4 (2.8%) |
| 45 to 59 Minutes | 16 (17.0%) | 24 (16.6%) |
| 60 to 89 Minutes | 5 (5.3%) | 19 (13.1%) |
| 90 or more Minutes | 6 (6.4%) | 0 (0.0%) |
Time of Departure to Work by Sex in Isleton
The most frequent times of departure to work in Isleton are 12:00 AM to 4:59 AM (19, 20.2%) for males and 6:30 AM to 6:59 AM (46, 31.7%) for females.
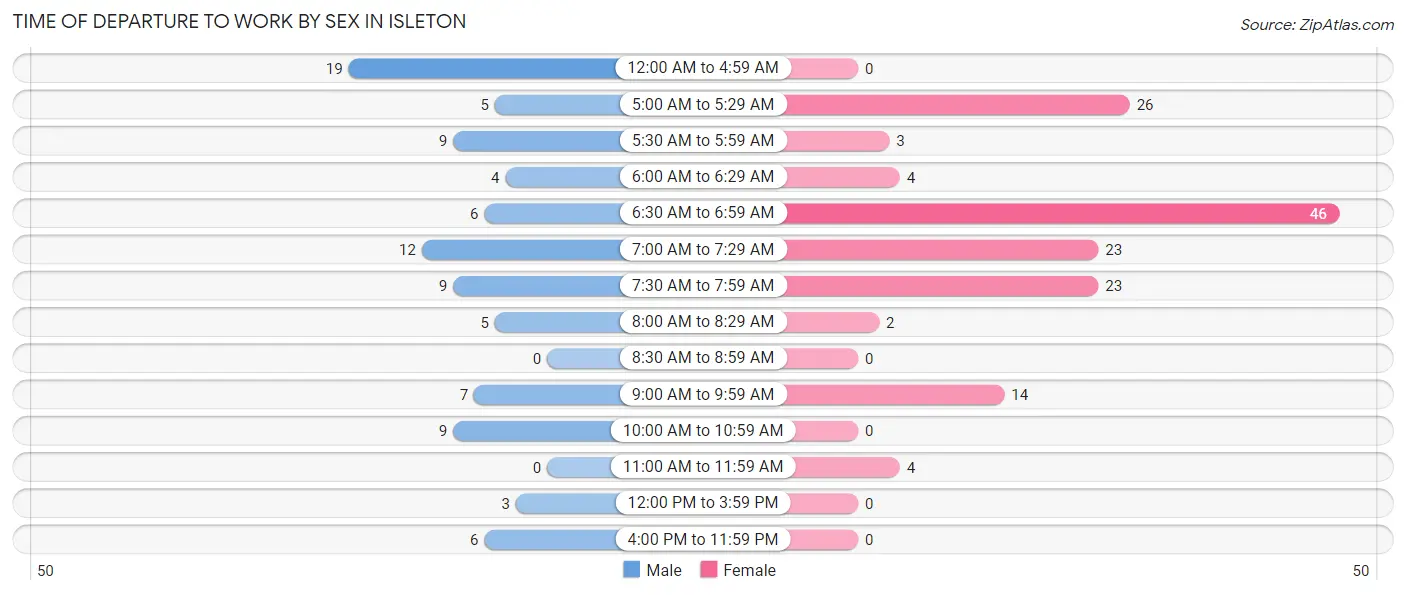
| Time of Departure | Male | Female |
| 12:00 AM to 4:59 AM | 19 (20.2%) | 0 (0.0%) |
| 5:00 AM to 5:29 AM | 5 (5.3%) | 26 (17.9%) |
| 5:30 AM to 5:59 AM | 9 (9.6%) | 3 (2.1%) |
| 6:00 AM to 6:29 AM | 4 (4.3%) | 4 (2.8%) |
| 6:30 AM to 6:59 AM | 6 (6.4%) | 46 (31.7%) |
| 7:00 AM to 7:29 AM | 12 (12.8%) | 23 (15.9%) |
| 7:30 AM to 7:59 AM | 9 (9.6%) | 23 (15.9%) |
| 8:00 AM to 8:29 AM | 5 (5.3%) | 2 (1.4%) |
| 8:30 AM to 8:59 AM | 0 (0.0%) | 0 (0.0%) |
| 9:00 AM to 9:59 AM | 7 (7.4%) | 14 (9.7%) |
| 10:00 AM to 10:59 AM | 9 (9.6%) | 0 (0.0%) |
| 11:00 AM to 11:59 AM | 0 (0.0%) | 4 (2.8%) |
| 12:00 PM to 3:59 PM | 3 (3.2%) | 0 (0.0%) |
| 4:00 PM to 11:59 PM | 6 (6.4%) | 0 (0.0%) |
| Total | 94 (100.0%) | 145 (100.0%) |
Housing Occupancy in Isleton
Occupancy by Ownership in Isleton
Of the total 241 dwellings in Isleton, owner-occupied units account for 158 (65.6%), while renter-occupied units make up 83 (34.4%).
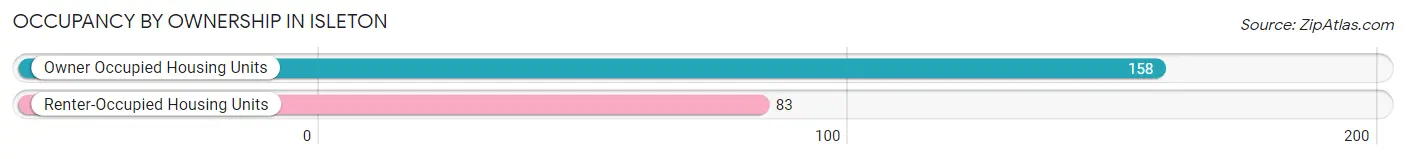
| Occupancy | # Housing Units | % Housing Units |
| Owner Occupied Housing Units | 158 | 65.6% |
| Renter-Occupied Housing Units | 83 | 34.4% |
| Total Occupied Housing Units | 241 | 100.0% |
Occupancy by Household Size in Isleton
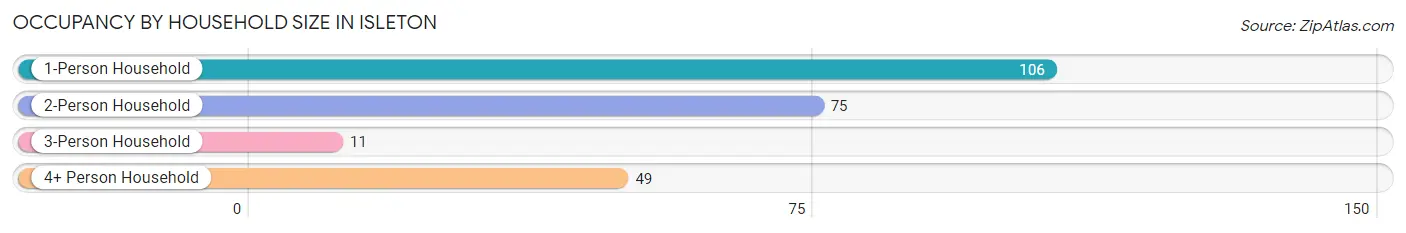
| Household Size | # Housing Units | % Housing Units |
| 1-Person Household | 106 | 44.0% |
| 2-Person Household | 75 | 31.1% |
| 3-Person Household | 11 | 4.6% |
| 4+ Person Household | 49 | 20.3% |
| Total Housing Units | 241 | 100.0% |
Occupancy by Ownership by Household Size in Isleton
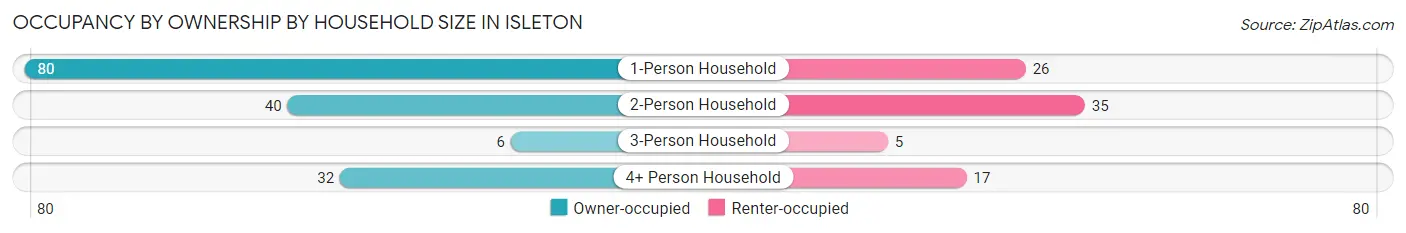
| Household Size | Owner-occupied | Renter-occupied |
| 1-Person Household | 80 (75.5%) | 26 (24.5%) |
| 2-Person Household | 40 (53.3%) | 35 (46.7%) |
| 3-Person Household | 6 (54.5%) | 5 (45.5%) |
| 4+ Person Household | 32 (65.3%) | 17 (34.7%) |
| Total Housing Units | 158 (65.6%) | 83 (34.4%) |
Occupancy by Educational Attainment in Isleton
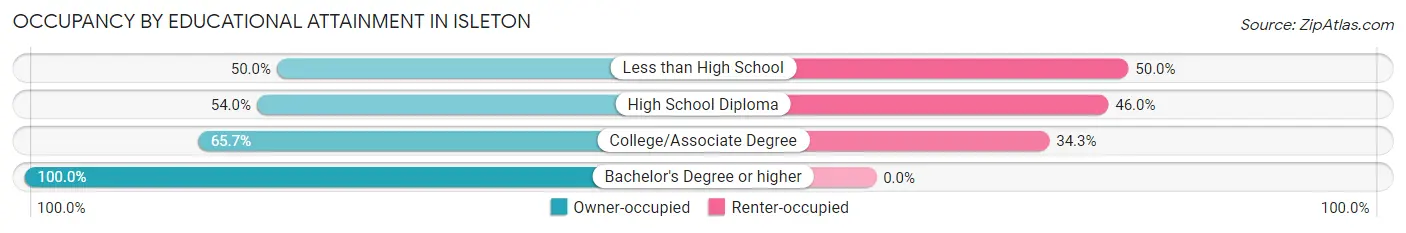
| Household Size | Owner-occupied | Renter-occupied |
| Less than High School | 8 (50.0%) | 8 (50.0%) |
| High School Diploma | 34 (54.0%) | 29 (46.0%) |
| College/Associate Degree | 88 (65.7%) | 46 (34.3%) |
| Bachelor's Degree or higher | 28 (100.0%) | 0 (0.0%) |
Occupancy by Age of Householder in Isleton
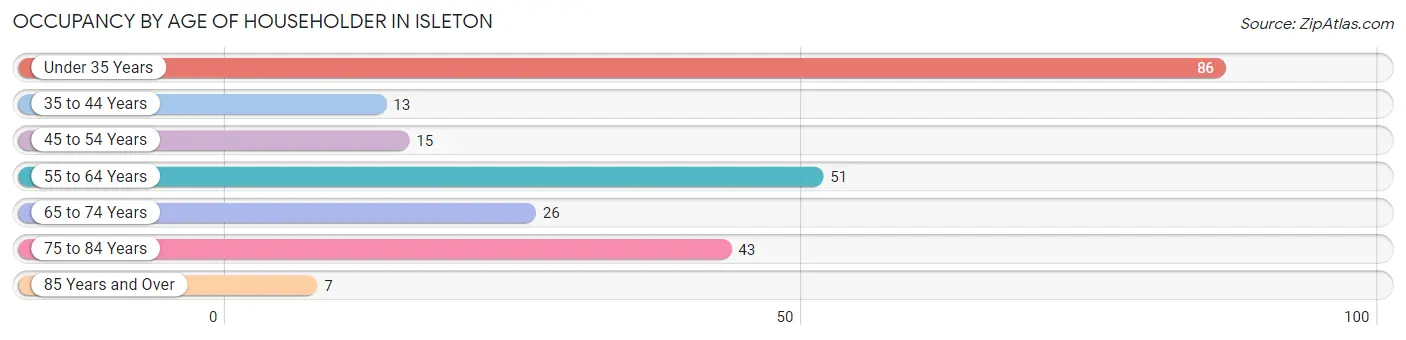
| Age Bracket | # Households | % Households |
| Under 35 Years | 86 | 35.7% |
| 35 to 44 Years | 13 | 5.4% |
| 45 to 54 Years | 15 | 6.2% |
| 55 to 64 Years | 51 | 21.2% |
| 65 to 74 Years | 26 | 10.8% |
| 75 to 84 Years | 43 | 17.8% |
| 85 Years and Over | 7 | 2.9% |
| Total | 241 | 100.0% |
Housing Finances in Isleton
Median Income by Occupancy in Isleton
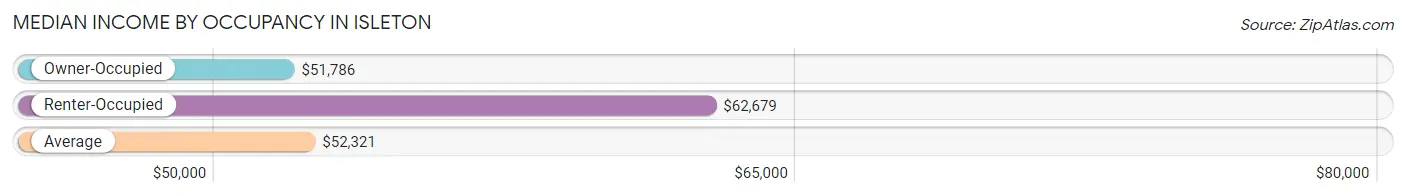
| Occupancy Type | # Households | Median Income |
| Owner-Occupied | 158 (65.6%) | $51,786 |
| Renter-Occupied | 83 (34.4%) | $62,679 |
| Average | 241 (100.0%) | $52,321 |
Occupancy by Householder Income Bracket in Isleton
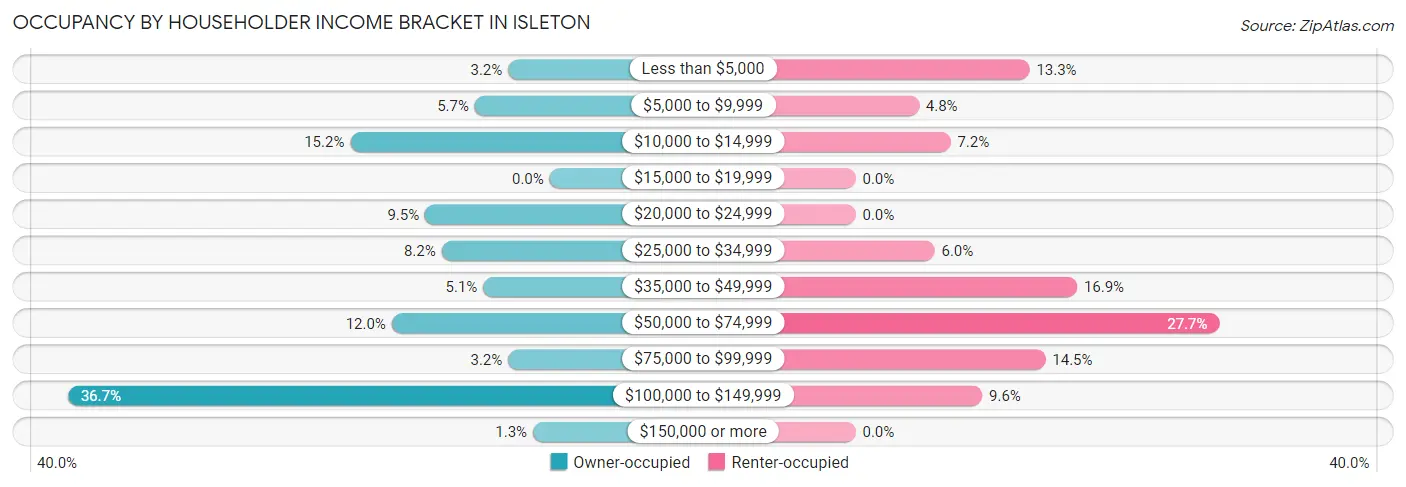
| Income Bracket | Owner-occupied | Renter-occupied |
| Less than $5,000 | 5 (3.2%) | 11 (13.3%) |
| $5,000 to $9,999 | 9 (5.7%) | 4 (4.8%) |
| $10,000 to $14,999 | 24 (15.2%) | 6 (7.2%) |
| $15,000 to $19,999 | 0 (0.0%) | 0 (0.0%) |
| $20,000 to $24,999 | 15 (9.5%) | 0 (0.0%) |
| $25,000 to $34,999 | 13 (8.2%) | 5 (6.0%) |
| $35,000 to $49,999 | 8 (5.1%) | 14 (16.9%) |
| $50,000 to $74,999 | 19 (12.0%) | 23 (27.7%) |
| $75,000 to $99,999 | 5 (3.2%) | 12 (14.5%) |
| $100,000 to $149,999 | 58 (36.7%) | 8 (9.6%) |
| $150,000 or more | 2 (1.3%) | 0 (0.0%) |
| Total | 158 (100.0%) | 83 (100.0%) |
Monthly Housing Cost Tiers in Isleton
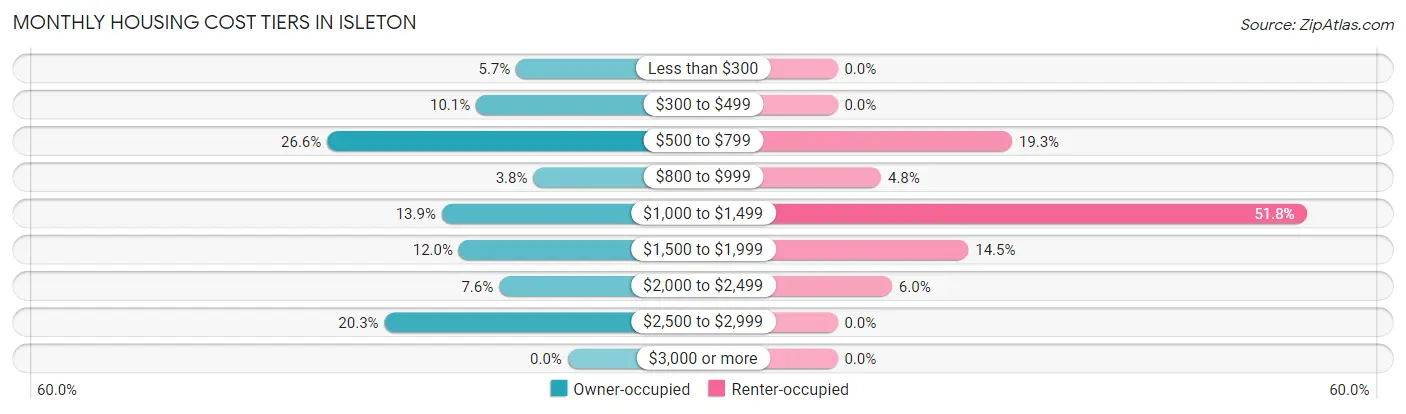
| Monthly Cost | Owner-occupied | Renter-occupied |
| Less than $300 | 9 (5.7%) | 0 (0.0%) |
| $300 to $499 | 16 (10.1%) | 0 (0.0%) |
| $500 to $799 | 42 (26.6%) | 16 (19.3%) |
| $800 to $999 | 6 (3.8%) | 4 (4.8%) |
| $1,000 to $1,499 | 22 (13.9%) | 43 (51.8%) |
| $1,500 to $1,999 | 19 (12.0%) | 12 (14.5%) |
| $2,000 to $2,499 | 12 (7.6%) | 5 (6.0%) |
| $2,500 to $2,999 | 32 (20.3%) | 0 (0.0%) |
| $3,000 or more | 0 (0.0%) | 0 (0.0%) |
| Total | 158 (100.0%) | 83 (100.0%) |
Physical Housing Characteristics in Isleton
Housing Structures in Isleton
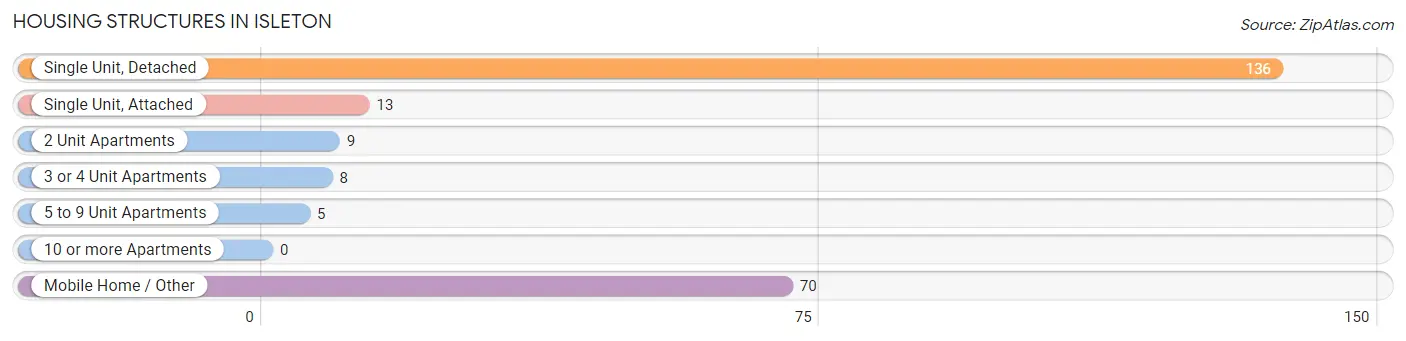
| Structure Type | # Housing Units | % Housing Units |
| Single Unit, Detached | 136 | 56.4% |
| Single Unit, Attached | 13 | 5.4% |
| 2 Unit Apartments | 9 | 3.7% |
| 3 or 4 Unit Apartments | 8 | 3.3% |
| 5 to 9 Unit Apartments | 5 | 2.1% |
| 10 or more Apartments | 0 | 0.0% |
| Mobile Home / Other | 70 | 29.0% |
| Total | 241 | 100.0% |
Housing Structures by Occupancy in Isleton
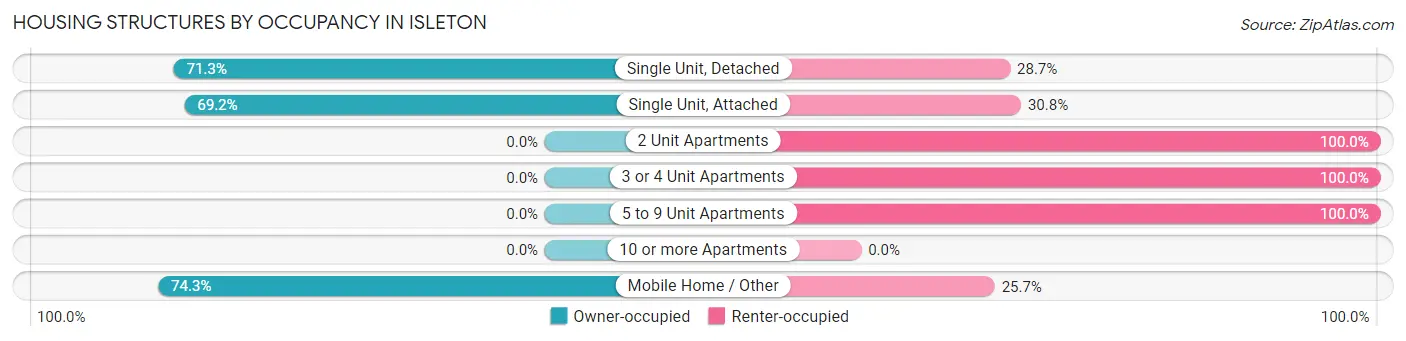
| Structure Type | Owner-occupied | Renter-occupied |
| Single Unit, Detached | 97 (71.3%) | 39 (28.7%) |
| Single Unit, Attached | 9 (69.2%) | 4 (30.8%) |
| 2 Unit Apartments | 0 (0.0%) | 9 (100.0%) |
| 3 or 4 Unit Apartments | 0 (0.0%) | 8 (100.0%) |
| 5 to 9 Unit Apartments | 0 (0.0%) | 5 (100.0%) |
| 10 or more Apartments | 0 (0.0%) | 0 (0.0%) |
| Mobile Home / Other | 52 (74.3%) | 18 (25.7%) |
| Total | 158 (65.6%) | 83 (34.4%) |
Housing Structures by Number of Rooms in Isleton
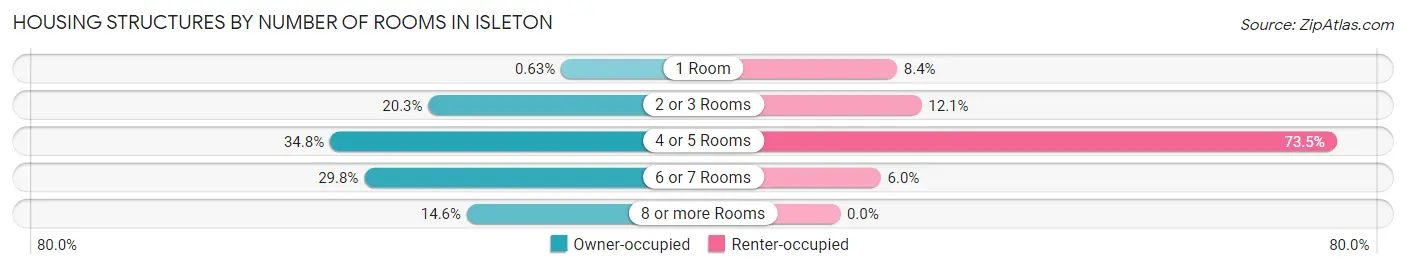
| Number of Rooms | Owner-occupied | Renter-occupied |
| 1 Room | 1 (0.6%) | 7 (8.4%) |
| 2 or 3 Rooms | 32 (20.3%) | 10 (12.0%) |
| 4 or 5 Rooms | 55 (34.8%) | 61 (73.5%) |
| 6 or 7 Rooms | 47 (29.7%) | 5 (6.0%) |
| 8 or more Rooms | 23 (14.6%) | 0 (0.0%) |
| Total | 158 (100.0%) | 83 (100.0%) |
Housing Structure by Heating Type in Isleton
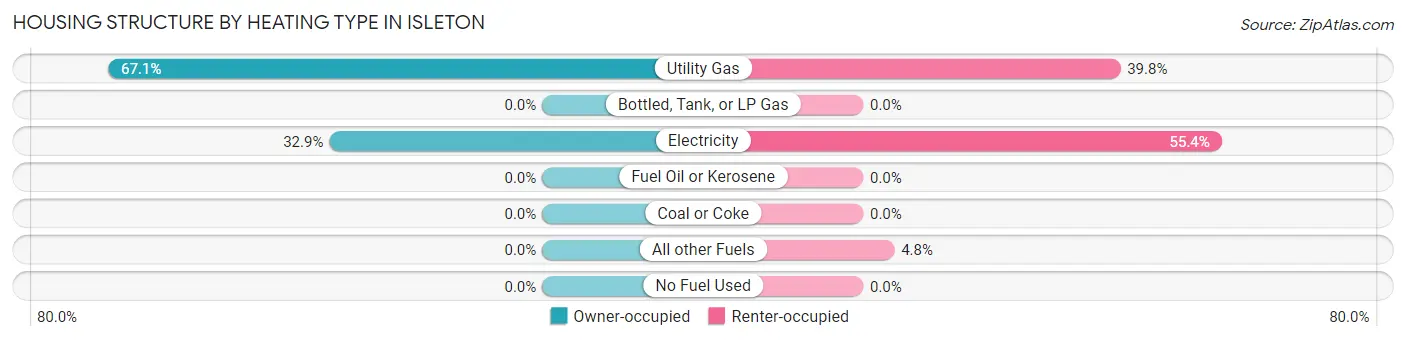
| Heating Type | Owner-occupied | Renter-occupied |
| Utility Gas | 106 (67.1%) | 33 (39.8%) |
| Bottled, Tank, or LP Gas | 0 (0.0%) | 0 (0.0%) |
| Electricity | 52 (32.9%) | 46 (55.4%) |
| Fuel Oil or Kerosene | 0 (0.0%) | 0 (0.0%) |
| Coal or Coke | 0 (0.0%) | 0 (0.0%) |
| All other Fuels | 0 (0.0%) | 4 (4.8%) |
| No Fuel Used | 0 (0.0%) | 0 (0.0%) |
| Total | 158 (100.0%) | 83 (100.0%) |
Household Vehicle Usage in Isleton
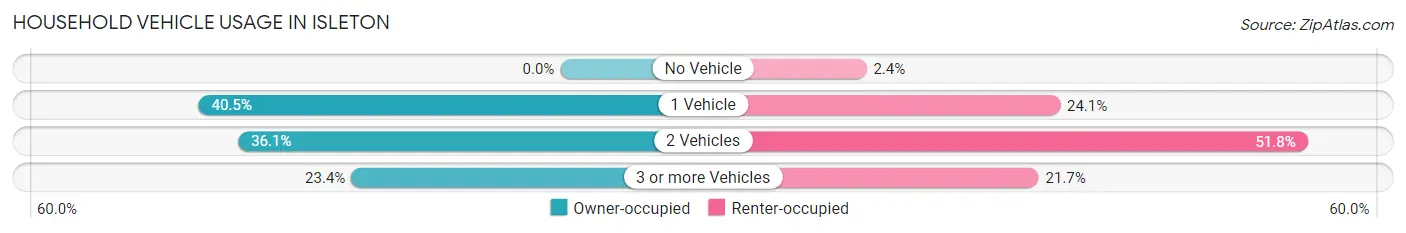
| Vehicles per Household | Owner-occupied | Renter-occupied |
| No Vehicle | 0 (0.0%) | 2 (2.4%) |
| 1 Vehicle | 64 (40.5%) | 20 (24.1%) |
| 2 Vehicles | 57 (36.1%) | 43 (51.8%) |
| 3 or more Vehicles | 37 (23.4%) | 18 (21.7%) |
| Total | 158 (100.0%) | 83 (100.0%) |
Real Estate & Mortgages in Isleton
Real Estate and Mortgage Overview in Isleton
| Characteristic | Without Mortgage | With Mortgage |
| Housing Units | 81 | 77 |
| Median Property Value | - | - |
| Median Household Income | $22,232 | $0 |
| Monthly Housing Costs | $709 | $0 |
| Real Estate Taxes | $199 | $0 |
Property Value by Mortgage Status in Isleton
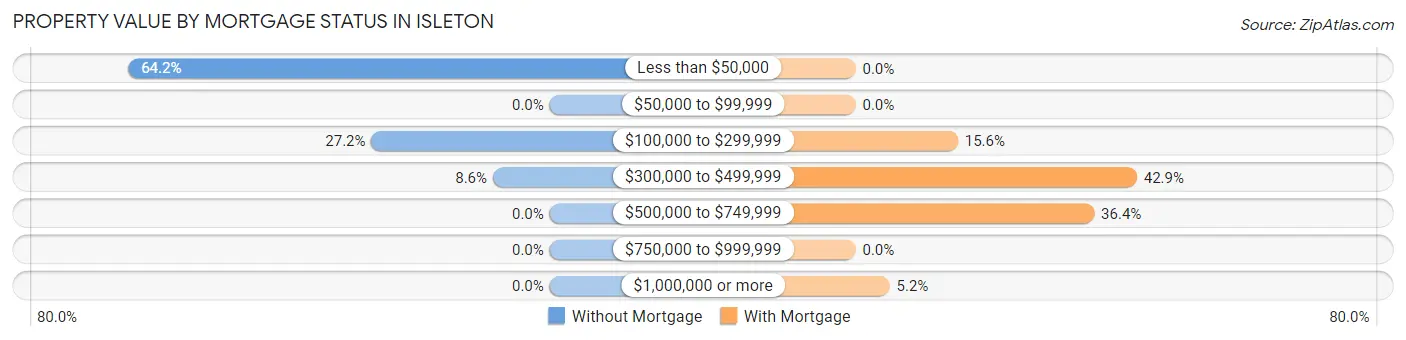
| Property Value | Without Mortgage | With Mortgage |
| Less than $50,000 | 52 (64.2%) | 0 (0.0%) |
| $50,000 to $99,999 | 0 (0.0%) | 0 (0.0%) |
| $100,000 to $299,999 | 22 (27.2%) | 12 (15.6%) |
| $300,000 to $499,999 | 7 (8.6%) | 33 (42.9%) |
| $500,000 to $749,999 | 0 (0.0%) | 28 (36.4%) |
| $750,000 to $999,999 | 0 (0.0%) | 0 (0.0%) |
| $1,000,000 or more | 0 (0.0%) | 4 (5.2%) |
| Total | 81 (100.0%) | 77 (100.0%) |
Household Income by Mortgage Status in Isleton
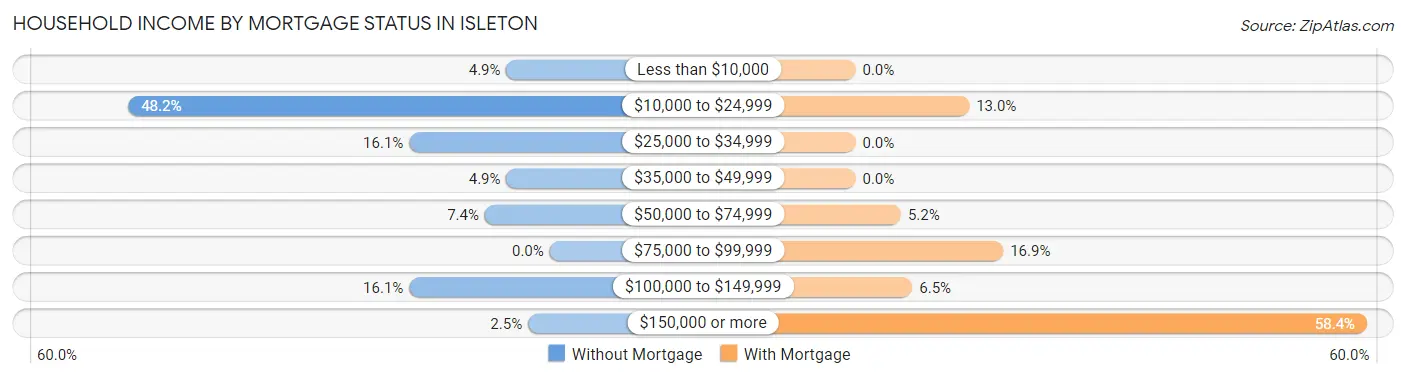
| Household Income | Without Mortgage | With Mortgage |
| Less than $10,000 | 4 (4.9%) | 0 (0.0%) |
| $10,000 to $24,999 | 39 (48.1%) | 10 (13.0%) |
| $25,000 to $34,999 | 13 (16.1%) | 0 (0.0%) |
| $35,000 to $49,999 | 4 (4.9%) | 0 (0.0%) |
| $50,000 to $74,999 | 6 (7.4%) | 4 (5.2%) |
| $75,000 to $99,999 | 0 (0.0%) | 13 (16.9%) |
| $100,000 to $149,999 | 13 (16.1%) | 5 (6.5%) |
| $150,000 or more | 2 (2.5%) | 45 (58.4%) |
| Total | 81 (100.0%) | 77 (100.0%) |
Property Value to Household Income Ratio in Isleton
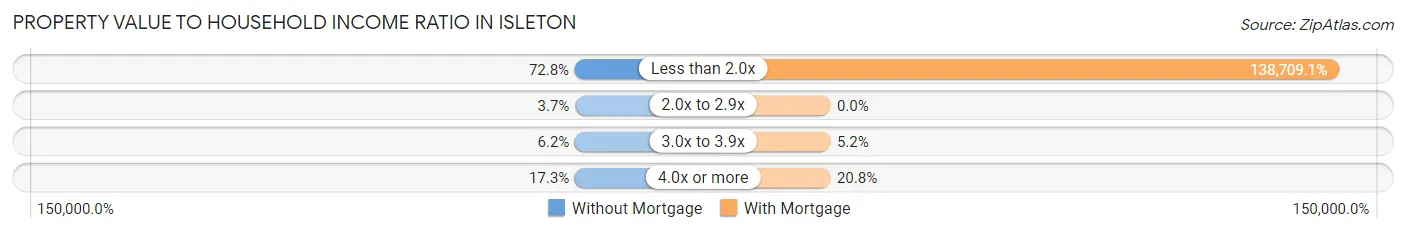
| Value-to-Income Ratio | Without Mortgage | With Mortgage |
| Less than 2.0x | 59 (72.8%) | 106,806 (138,709.1%) |
| 2.0x to 2.9x | 3 (3.7%) | 0 (0.0%) |
| 3.0x to 3.9x | 5 (6.2%) | 4 (5.2%) |
| 4.0x or more | 14 (17.3%) | 16 (20.8%) |
| Total | 81 (100.0%) | 77 (100.0%) |
Real Estate Taxes by Mortgage Status in Isleton
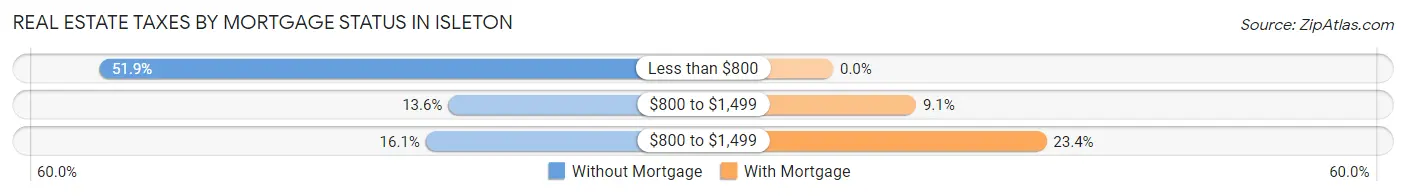
| Property Taxes | Without Mortgage | With Mortgage |
| Less than $800 | 42 (51.8%) | 0 (0.0%) |
| $800 to $1,499 | 11 (13.6%) | 7 (9.1%) |
| $800 to $1,499 | 13 (16.1%) | 18 (23.4%) |
| Total | 81 (100.0%) | 77 (100.0%) |
Health & Disability in Isleton
Health Insurance Coverage by Age in Isleton
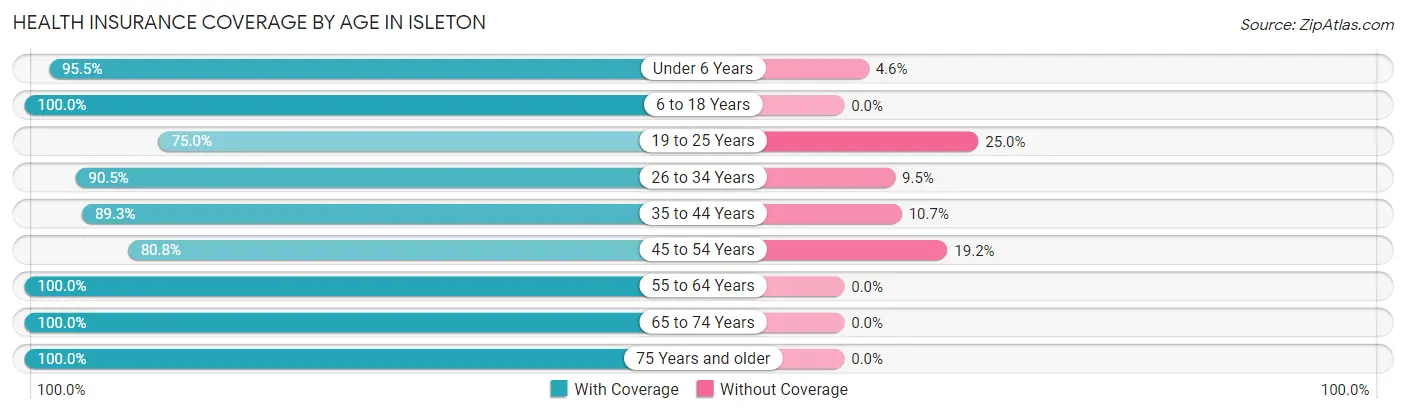
| Age Bracket | With Coverage | Without Coverage |
| Under 6 Years | 63 (95.5%) | 3 (4.5%) |
| 6 to 18 Years | 67 (100.0%) | 0 (0.0%) |
| 19 to 25 Years | 36 (75.0%) | 12 (25.0%) |
| 26 to 34 Years | 105 (90.5%) | 11 (9.5%) |
| 35 to 44 Years | 50 (89.3%) | 6 (10.7%) |
| 45 to 54 Years | 21 (80.8%) | 5 (19.2%) |
| 55 to 64 Years | 64 (100.0%) | 0 (0.0%) |
| 65 to 74 Years | 26 (100.0%) | 0 (0.0%) |
| 75 Years and older | 57 (100.0%) | 0 (0.0%) |
| Total | 489 (93.0%) | 37 (7.0%) |
Health Insurance Coverage by Citizenship Status in Isleton
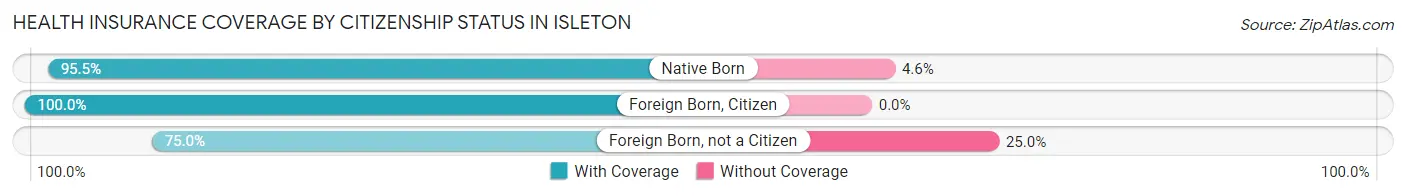
| Citizenship Status | With Coverage | Without Coverage |
| Native Born | 63 (95.5%) | 3 (4.5%) |
| Foreign Born, Citizen | 67 (100.0%) | 0 (0.0%) |
| Foreign Born, not a Citizen | 36 (75.0%) | 12 (25.0%) |
Health Insurance Coverage by Household Income in Isleton
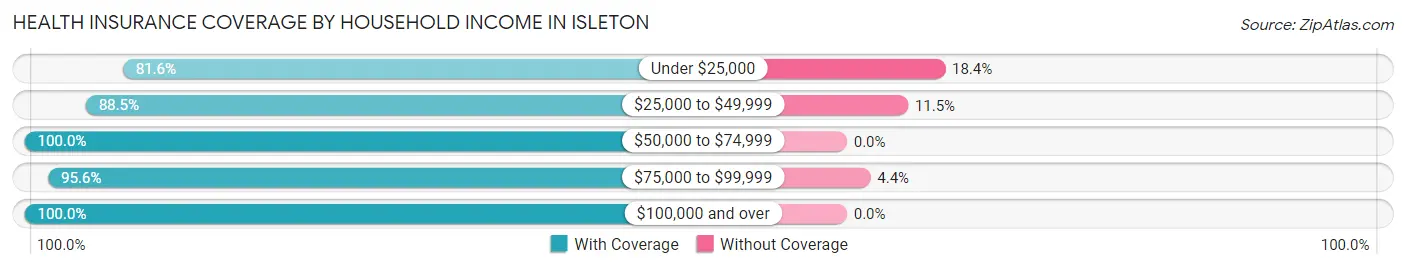
| Household Income | With Coverage | Without Coverage |
| Under $25,000 | 102 (81.6%) | 23 (18.4%) |
| $25,000 to $49,999 | 85 (88.5%) | 11 (11.5%) |
| $50,000 to $74,999 | 103 (100.0%) | 0 (0.0%) |
| $75,000 to $99,999 | 65 (95.6%) | 3 (4.4%) |
| $100,000 and over | 134 (100.0%) | 0 (0.0%) |
Public vs Private Health Insurance Coverage by Age in Isleton
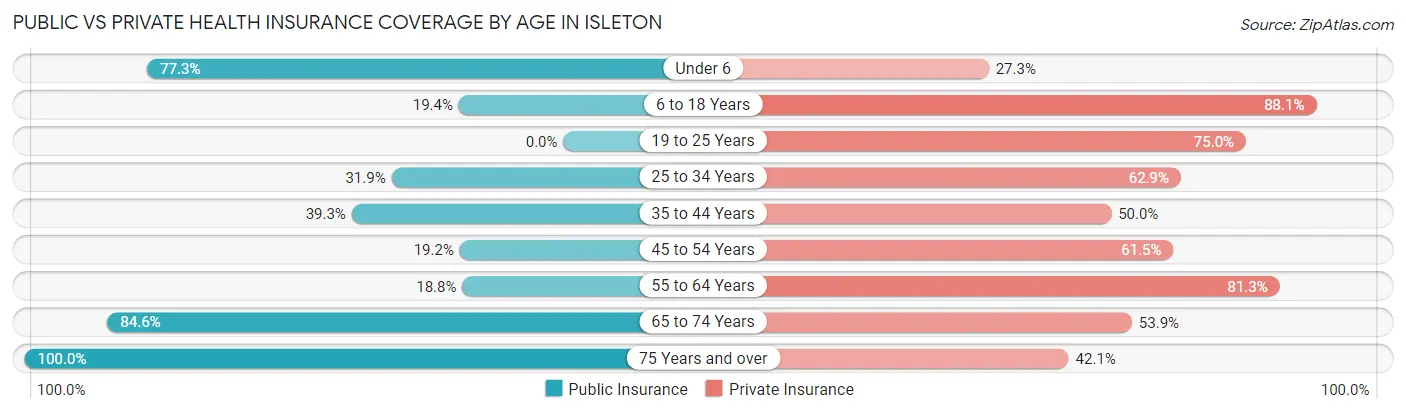
| Age Bracket | Public Insurance | Private Insurance |
| Under 6 | 51 (77.3%) | 18 (27.3%) |
| 6 to 18 Years | 13 (19.4%) | 59 (88.1%) |
| 19 to 25 Years | 0 (0.0%) | 36 (75.0%) |
| 25 to 34 Years | 37 (31.9%) | 73 (62.9%) |
| 35 to 44 Years | 22 (39.3%) | 28 (50.0%) |
| 45 to 54 Years | 5 (19.2%) | 16 (61.5%) |
| 55 to 64 Years | 12 (18.8%) | 52 (81.2%) |
| 65 to 74 Years | 22 (84.6%) | 14 (53.8%) |
| 75 Years and over | 57 (100.0%) | 24 (42.1%) |
| Total | 219 (41.6%) | 320 (60.8%) |
Disability Status by Sex by Age in Isleton
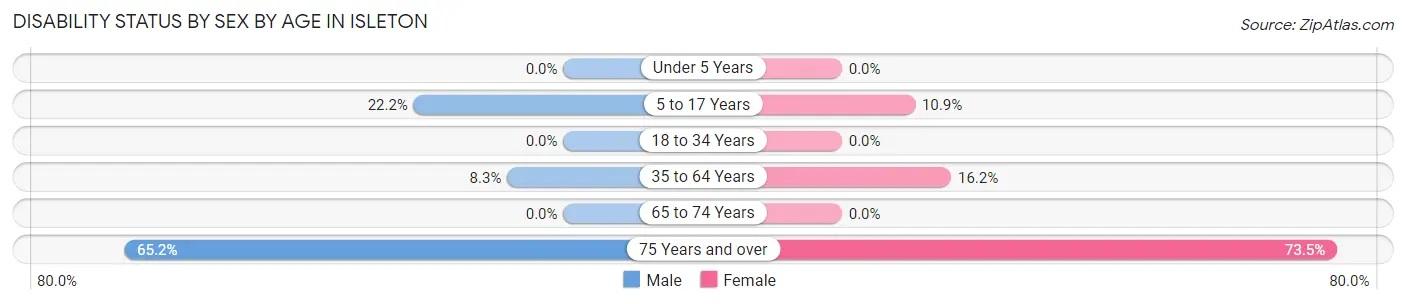
| Age Bracket | Male | Female |
| Under 5 Years | 0 (0.0%) | 0 (0.0%) |
| 5 to 17 Years | 4 (22.2%) | 5 (10.9%) |
| 18 to 34 Years | 0 (0.0%) | 0 (0.0%) |
| 35 to 64 Years | 6 (8.3%) | 12 (16.2%) |
| 65 to 74 Years | 0 (0.0%) | 0 (0.0%) |
| 75 Years and over | 15 (65.2%) | 25 (73.5%) |
Disability Class by Sex by Age in Isleton
Disability Class: Hearing Difficulty
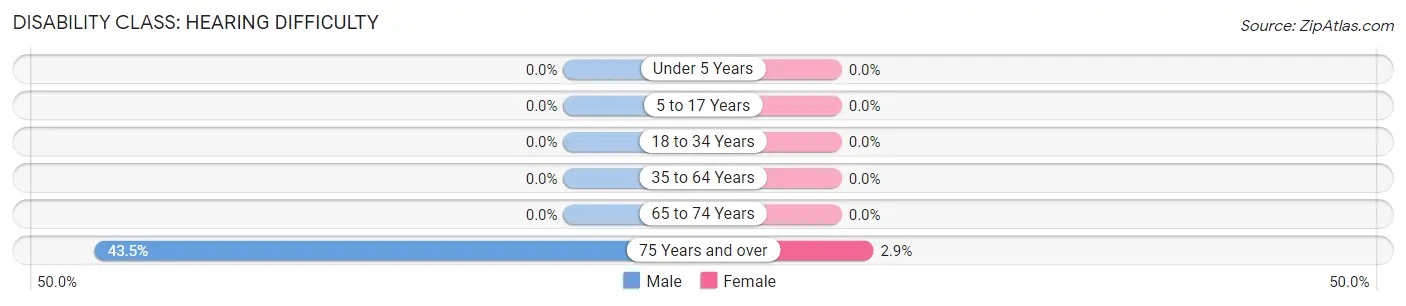
| Age Bracket | Male | Female |
| Under 5 Years | 0 (0.0%) | 0 (0.0%) |
| 5 to 17 Years | 0 (0.0%) | 0 (0.0%) |
| 18 to 34 Years | 0 (0.0%) | 0 (0.0%) |
| 35 to 64 Years | 0 (0.0%) | 0 (0.0%) |
| 65 to 74 Years | 0 (0.0%) | 0 (0.0%) |
| 75 Years and over | 10 (43.5%) | 1 (2.9%) |
Disability Class: Vision Difficulty
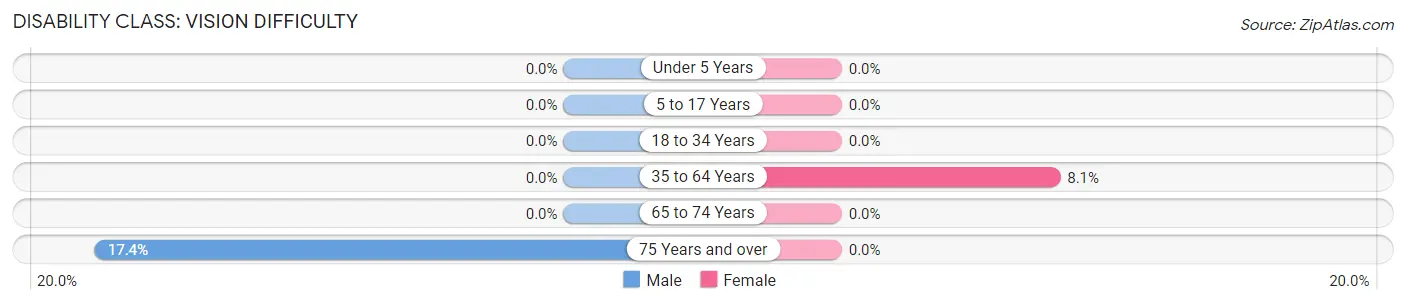
| Age Bracket | Male | Female |
| Under 5 Years | 0 (0.0%) | 0 (0.0%) |
| 5 to 17 Years | 0 (0.0%) | 0 (0.0%) |
| 18 to 34 Years | 0 (0.0%) | 0 (0.0%) |
| 35 to 64 Years | 0 (0.0%) | 6 (8.1%) |
| 65 to 74 Years | 0 (0.0%) | 0 (0.0%) |
| 75 Years and over | 4 (17.4%) | 0 (0.0%) |
Disability Class: Cognitive Difficulty
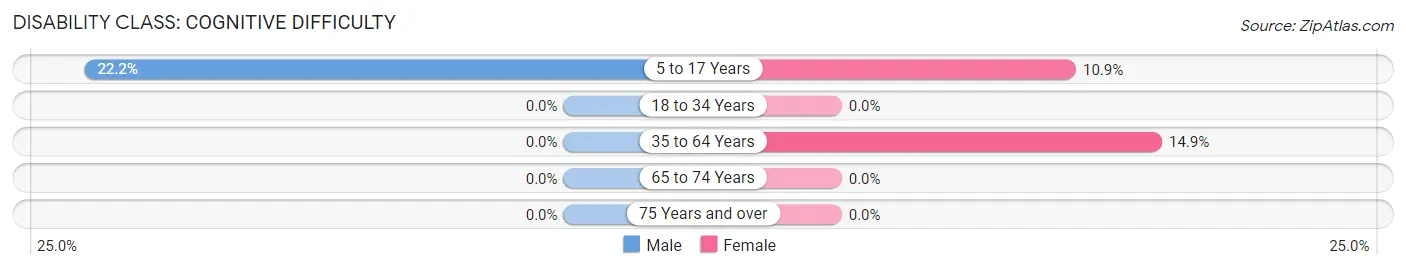
| Age Bracket | Male | Female |
| 5 to 17 Years | 4 (22.2%) | 5 (10.9%) |
| 18 to 34 Years | 0 (0.0%) | 0 (0.0%) |
| 35 to 64 Years | 0 (0.0%) | 11 (14.9%) |
| 65 to 74 Years | 0 (0.0%) | 0 (0.0%) |
| 75 Years and over | 0 (0.0%) | 0 (0.0%) |
Disability Class: Ambulatory Difficulty

| Age Bracket | Male | Female |
| 5 to 17 Years | 0 (0.0%) | 0 (0.0%) |
| 18 to 34 Years | 0 (0.0%) | 0 (0.0%) |
| 35 to 64 Years | 6 (8.3%) | 7 (9.5%) |
| 65 to 74 Years | 0 (0.0%) | 0 (0.0%) |
| 75 Years and over | 10 (43.5%) | 0 (0.0%) |
Disability Class: Self-Care Difficulty
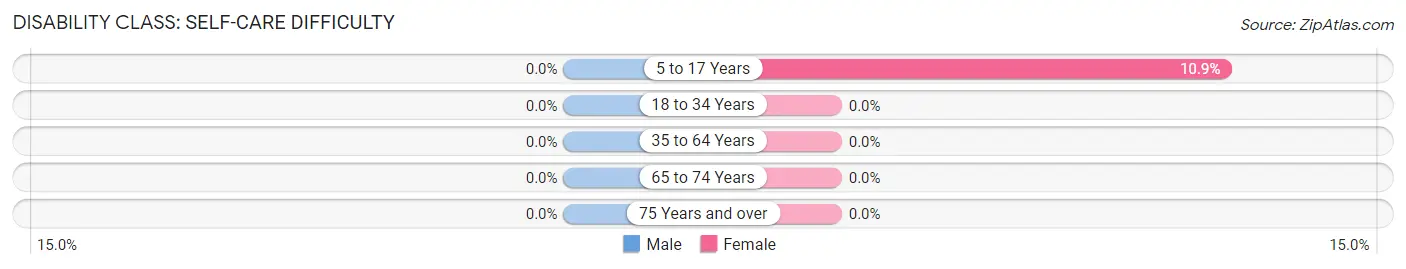
| Age Bracket | Male | Female |
| 5 to 17 Years | 0 (0.0%) | 5 (10.9%) |
| 18 to 34 Years | 0 (0.0%) | 0 (0.0%) |
| 35 to 64 Years | 0 (0.0%) | 0 (0.0%) |
| 65 to 74 Years | 0 (0.0%) | 0 (0.0%) |
| 75 Years and over | 0 (0.0%) | 0 (0.0%) |
Technology Access in Isleton
Computing Device Access in Isleton
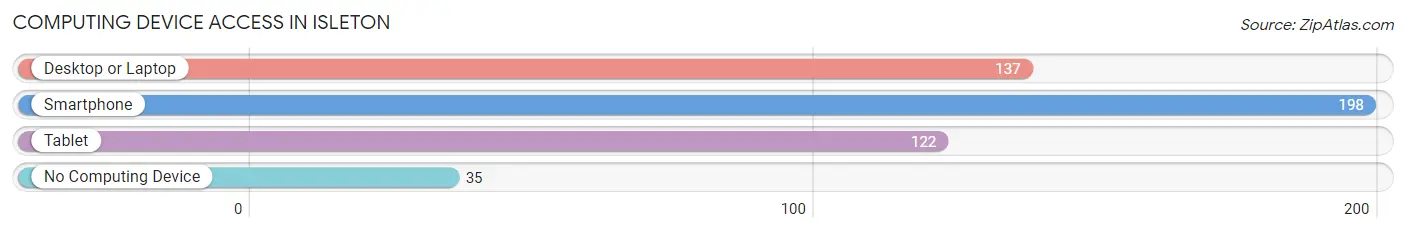
| Device Type | # Households | % Households |
| Desktop or Laptop | 137 | 56.9% |
| Smartphone | 198 | 82.2% |
| Tablet | 122 | 50.6% |
| No Computing Device | 35 | 14.5% |
| Total | 241 | 100.0% |
Internet Access in Isleton
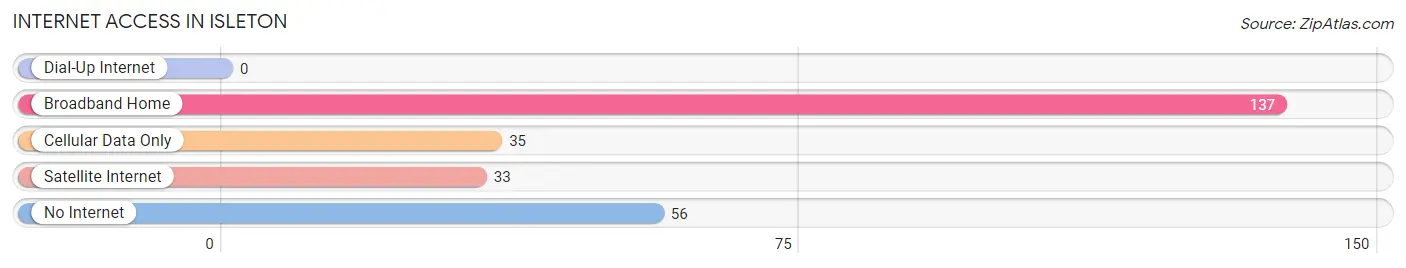
| Internet Type | # Households | % Households |
| Dial-Up Internet | 0 | 0.0% |
| Broadband Home | 137 | 56.9% |
| Cellular Data Only | 35 | 14.5% |
| Satellite Internet | 33 | 13.7% |
| No Internet | 56 | 23.2% |
| Total | 241 | 100.0% |
Isleton Summary
Isleton is a small city located in the Sacramento-San Joaquin Delta region of California. It is situated in the northern part of Sacramento County, approximately 30 miles south of Sacramento and 40 miles northeast of San Francisco. The city is bordered by the Sacramento River to the east, the Mokelumne River to the west, and the San Joaquin River to the south. As of the 2010 census, the population of Isleton was 806.
History
The area that is now Isleton was originally inhabited by the Miwok and Maidu Native American tribes. The first European settlers arrived in the area in the mid-1800s, and the town of Isleton was founded in 1874 by Josiah Pool. Pool named the town after his friend, Isleton Pool, who had died in a mining accident in the area.
The town quickly grew, and by the early 1900s, it had become a major port and trading center for the Delta region. The town was also known for its gambling and saloons, and it was a popular destination for tourists.
In the 1920s, the town began to decline as the Delta region was drained and the river traffic decreased. The town was further impacted by the Great Depression and World War II. In the 1950s, the town was revitalized with the construction of the Isleton Bridge, which connected the town to the rest of the Delta region.
Geography
Isleton is located in the Sacramento-San Joaquin Delta region of California. It is situated in the northern part of Sacramento County, approximately 30 miles south of Sacramento and 40 miles northeast of San Francisco. The city is bordered by the Sacramento River to the east, the Mokelumne River to the west, and the San Joaquin River to the south.
The city has a total area of 1.2 square miles, all of which is land. The terrain is mostly flat, with some rolling hills. The climate is mild, with hot summers and cool winters.
Economy
The economy of Isleton is largely based on agriculture and tourism. The city is home to several farms, which produce a variety of crops, including corn, tomatoes, and melons. The city is also home to several wineries, which produce a variety of wines.
The city is also a popular tourist destination, with several attractions, including the Isleton Museum, the Isleton Chinese Museum, and the Isleton Historic District. The city also hosts several festivals throughout the year, including the Isleton Crawdad Festival and the Isleton Jazz Festival.
Demographics
As of the 2010 census, the population of Isleton was 806. The racial makeup of the city was 68.2% White, 0.7% African American, 0.9% Native American, 0.7% Asian, 0.1% Pacific Islander, 25.2% from other races, and 4.2% from two or more races. Hispanic or Latino of any race were 37.2% of the population.
The median household income in Isleton was $41,250, and the median family income was $45,625. The per capita income was $19,945. About 17.2% of the population was below the poverty line.
Common Questions
What is Per Capita Income in Isleton?
Per Capita income in Isleton is $28,452.
What is the Median Family Income in Isleton?
Median Family Income in Isleton is $63,810.
What is the Median Household income in Isleton?
Median Household Income in Isleton is $52,321.
What is Income or Wage Gap in Isleton?
Income or Wage Gap in Isleton is 23.0%.
Women in Isleton earn 77.0 cents for every dollar earned by a man.
What is Inequality or Gini Index in Isleton?
Inequality or Gini Index in Isleton is 0.42.
What is the Total Population of Isleton?
Total Population of Isleton is 538.
What is the Total Male Population of Isleton?
Total Male Population of Isleton is 201.
What is the Total Female Population of Isleton?
Total Female Population of Isleton is 337.
What is the Ratio of Males per 100 Females in Isleton?
There are 59.64 Males per 100 Females in Isleton.
What is the Ratio of Females per 100 Males in Isleton?
There are 167.66 Females per 100 Males in Isleton.
What is the Median Population Age in Isleton?
Median Population Age in Isleton is 30.6 Years.
What is the Average Family Size in Isleton
Average Family Size in Isleton is 3.3 People.
What is the Average Household Size in Isleton
Average Household Size in Isleton is 2.2 People.
How Large is the Labor Force in Isleton?
There are 287 People in the Labor Forcein in Isleton.
What is the Percentage of People in the Labor Force in Isleton?
69.8% of People are in the Labor Force in Isleton.
What is the Unemployment Rate in Isleton?
Unemployment Rate in Isleton is 17.5%.