Lebec, CA Map & Demographics
Lebec Map
Lebec Overview
$31,407
PER CAPITA INCOME
$26,694
AVG FAMILY INCOME
0.52
INEQUALITY / GINI INDEX
913
TOTAL POPULATION
477
MALE POPULATION
436
FEMALE POPULATION
109.40
MALES / 100 FEMALES
91.40
FEMALES / 100 MALES
46.7
MEDIAN AGE
2.0
AVG FAMILY SIZE
1.9
AVG HOUSEHOLD SIZE
420
LABOR FORCE [ PEOPLE ]
52.3%
PERCENT IN LABOR FORCE
13.6%
UNEMPLOYMENT RATE
Lebec Zip Codes
Lebec Area Codes
Income in Lebec
Income Overview in Lebec
| Characteristic | Number | Measure |
| Per Capita Income | 913 | $31,407 |
| Median Family Income | 355 | $26,694 |
| Mean Family Income | 355 | $54,730 |
| Median Household Income | 481 | $0 |
| Mean Household Income | 481 | $57,196 |
| Income Deficit | 355 | $0 |
| Wage / Income Gap (%) | 913 | 0.00% |
| Wage / Income Gap ($) | 913 | 100.00¢ per $1 |
| Gini / Inequality Index | 913 | 0.52 |
Earnings by Sex in Lebec
| Sex | Number | Average Earnings |
| Male | 317 (60.2%) | $0 |
| Female | 210 (39.9%) | $0 |
| Total | 527 (100.0%) | $0 |
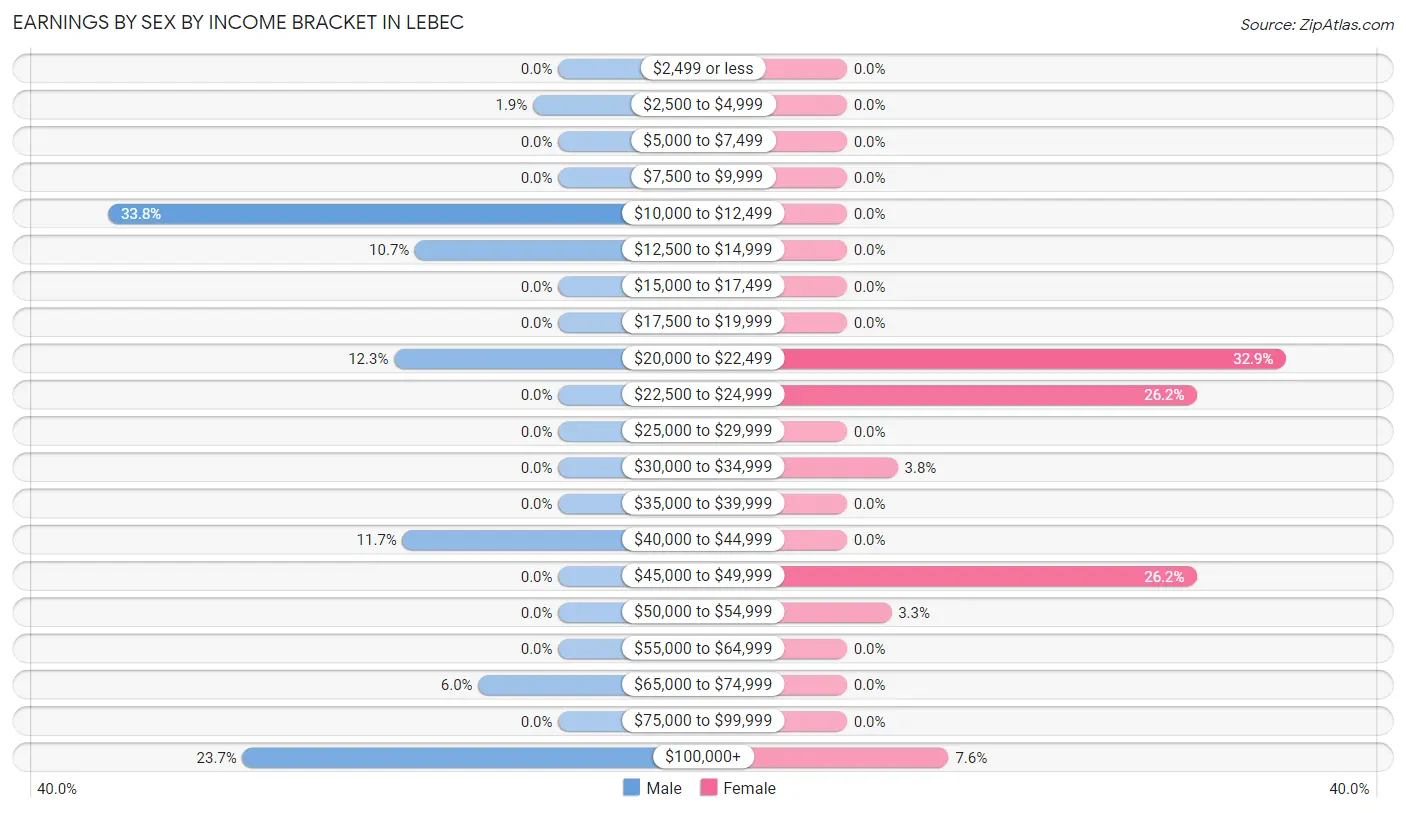
Earnings by Sex by Income Bracket in Lebec
The most common earnings brackets in Lebec are $10,000 to $12,499 for men (107 | 33.8%) and $20,000 to $22,499 for women (69 | 32.9%).
| Income | Male | Female |
| $2,499 or less | 0 (0.0%) | 0 (0.0%) |
| $2,500 to $4,999 | 6 (1.9%) | 0 (0.0%) |
| $5,000 to $7,499 | 0 (0.0%) | 0 (0.0%) |
| $7,500 to $9,999 | 0 (0.0%) | 0 (0.0%) |
| $10,000 to $12,499 | 107 (33.8%) | 0 (0.0%) |
| $12,500 to $14,999 | 34 (10.7%) | 0 (0.0%) |
| $15,000 to $17,499 | 0 (0.0%) | 0 (0.0%) |
| $17,500 to $19,999 | 0 (0.0%) | 0 (0.0%) |
| $20,000 to $22,499 | 39 (12.3%) | 69 (32.9%) |
| $22,500 to $24,999 | 0 (0.0%) | 55 (26.2%) |
| $25,000 to $29,999 | 0 (0.0%) | 0 (0.0%) |
| $30,000 to $34,999 | 0 (0.0%) | 8 (3.8%) |
| $35,000 to $39,999 | 0 (0.0%) | 0 (0.0%) |
| $40,000 to $44,999 | 37 (11.7%) | 0 (0.0%) |
| $45,000 to $49,999 | 0 (0.0%) | 55 (26.2%) |
| $50,000 to $54,999 | 0 (0.0%) | 7 (3.3%) |
| $55,000 to $64,999 | 0 (0.0%) | 0 (0.0%) |
| $65,000 to $74,999 | 19 (6.0%) | 0 (0.0%) |
| $75,000 to $99,999 | 0 (0.0%) | 0 (0.0%) |
| $100,000+ | 75 (23.7%) | 16 (7.6%) |
| Total | 317 (100.0%) | 210 (100.0%) |
Earnings by Sex by Educational Attainment in Lebec
| Educational Attainment | Male Income | Female Income |
| Less than High School | - | - |
| High School Diploma | - | - |
| College or Associate's Degree | - | - |
| Bachelor's Degree | - | - |
| Graduate Degree | - | - |
| Total | - | - |
Family Income in Lebec
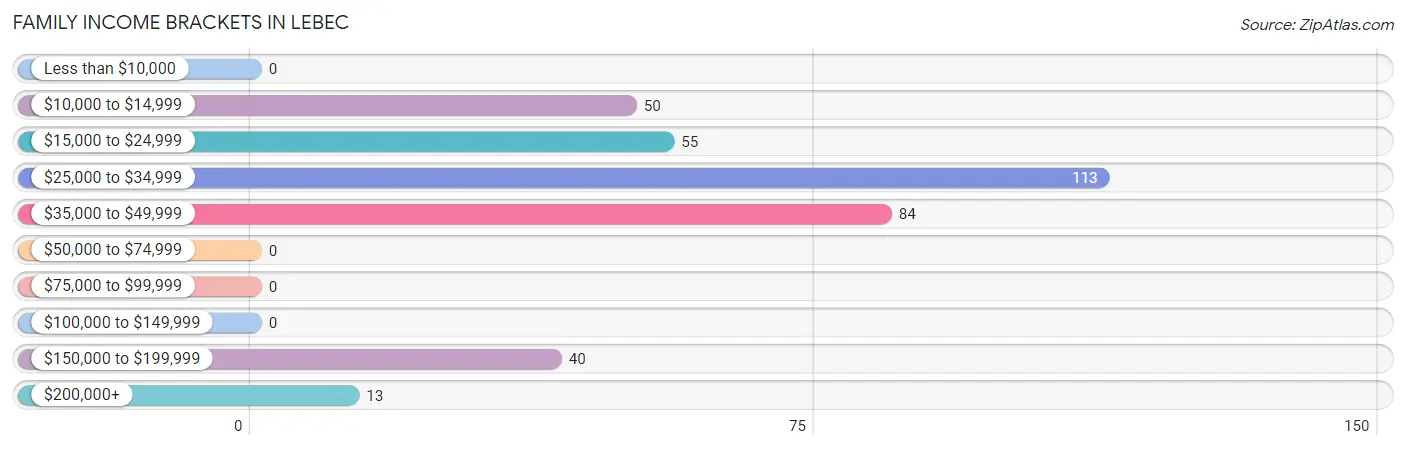
Family Income Brackets in Lebec
According to the Lebec family income data, there are 113 families falling into the $25,000 to $34,999 income range, which is the most common income bracket and makes up 31.8% of all families.
| Income Bracket | # Families | % Families |
| Less than $10,000 | 0 | 0.0% |
| $10,000 to $14,999 | 50 | 14.1% |
| $15,000 to $24,999 | 55 | 15.5% |
| $25,000 to $34,999 | 113 | 31.8% |
| $35,000 to $49,999 | 84 | 23.7% |
| $50,000 to $74,999 | 0 | 0.0% |
| $75,000 to $99,999 | 0 | 0.0% |
| $100,000 to $149,999 | 0 | 0.0% |
| $150,000 to $199,999 | 40 | 11.3% |
| $200,000+ | 13 | 3.7% |
Family Income by Famaliy Size in Lebec
| Income Bracket | # Families | Median Income |
| 2-Person Families | 300 (84.5%) | $0 |
| 3-Person Families | 55 (15.5%) | $0 |
| 4-Person Families | 0 (0.0%) | $0 |
| 5-Person Families | 0 (0.0%) | $0 |
| 6-Person Families | 0 (0.0%) | $0 |
| 7+ Person Families | 0 (0.0%) | $0 |
| Total | 355 (100.0%) | $26,694 |
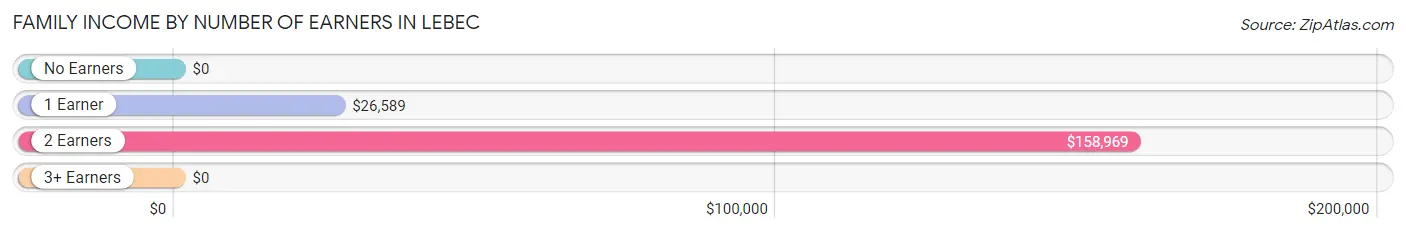
Family Income by Number of Earners in Lebec
| Number of Earners | # Families | Median Income |
| No Earners | 50 (14.1%) | $0 |
| 1 Earner | 246 (69.3%) | $26,589 |
| 2 Earners | 59 (16.6%) | $158,969 |
| 3+ Earners | 0 (0.0%) | $0 |
| Total | 355 (100.0%) | $26,694 |
Household Income in Lebec
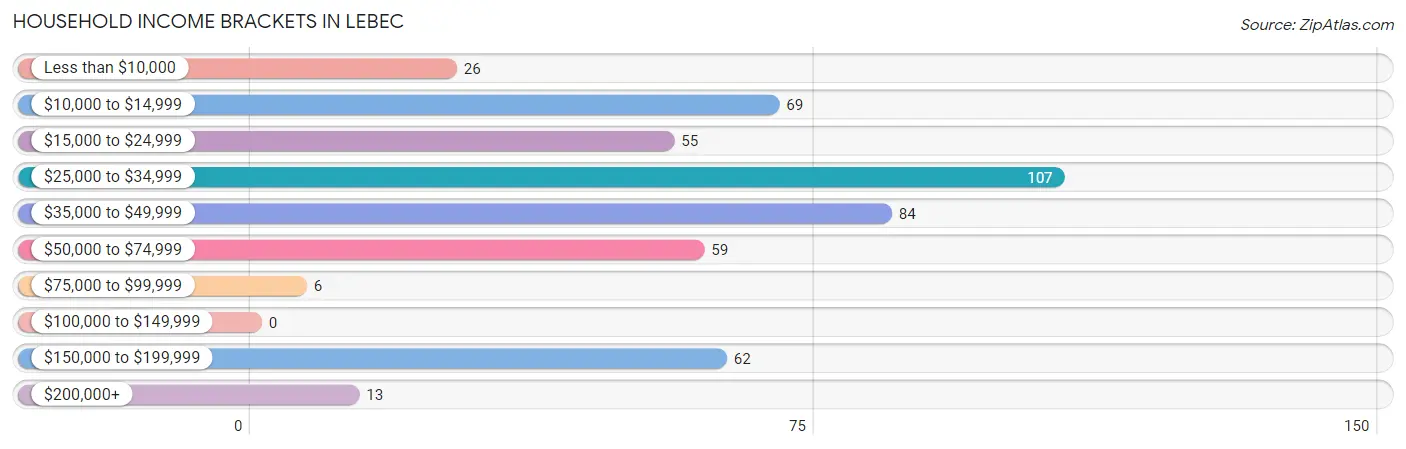
Household Income Brackets in Lebec
With 107 households falling in the category, the $25,000 to $34,999 income range is the most frequent in Lebec, accounting for 22.3% of all households.
| Income Bracket | # Households | % Households |
| Less than $10,000 | 26 | 5.4% |
| $10,000 to $14,999 | 69 | 14.3% |
| $15,000 to $24,999 | 55 | 11.4% |
| $25,000 to $34,999 | 107 | 22.2% |
| $35,000 to $49,999 | 84 | 17.5% |
| $50,000 to $74,999 | 59 | 12.3% |
| $75,000 to $99,999 | 6 | 1.2% |
| $100,000 to $149,999 | 0 | 0.0% |
| $150,000 to $199,999 | 62 | 12.9% |
| $200,000+ | 13 | 2.7% |
Household Income by Householder Age in Lebec
The median household income in Lebec is $0, with the highest median household income of $48,777 found in the 25 to 44 years age bracket for the primary householder. A total of 158 households (32.9%) fall into this category.
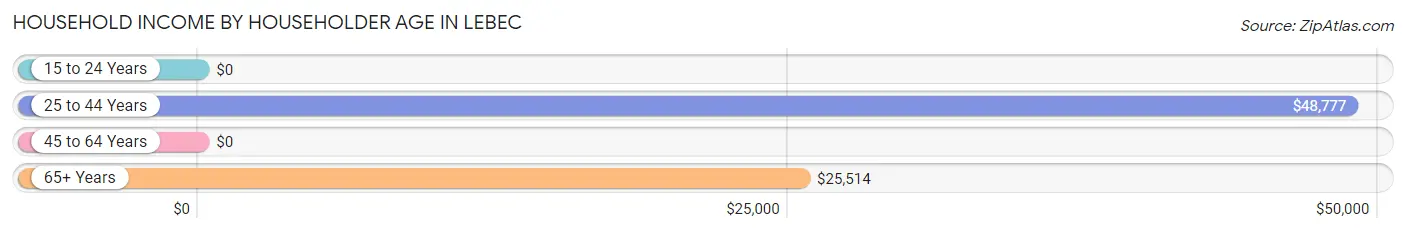
| Income Bracket | # Households | Median Income |
| 15 to 24 Years | 0 (0.0%) | $0 |
| 25 to 44 Years | 158 (32.9%) | $48,777 |
| 45 to 64 Years | 141 (29.3%) | $0 |
| 65+ Years | 182 (37.8%) | $25,514 |
| Total | 481 (100.0%) | $0 |
Poverty in Lebec
Income Below Poverty by Sex and Age in Lebec
With 29.6% poverty level for males and 45.9% for females among the residents of Lebec, 6 to 11 year old males and under 5 year old females are the most vulnerable to poverty, with 56 males (100.0%) and 54 females (100.0%) in their respective age groups living below the poverty level.
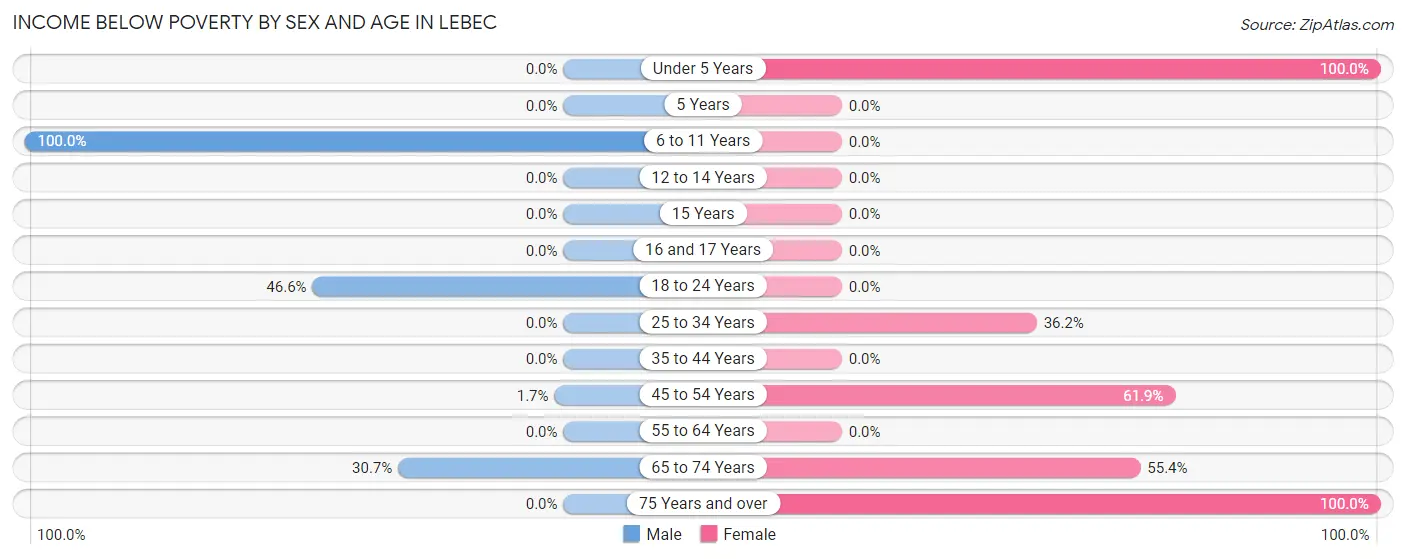
| Age Bracket | Male | Female |
| Under 5 Years | 0 (0.0%) | 54 (100.0%) |
| 5 Years | 0 (0.0%) | 0 (0.0%) |
| 6 to 11 Years | 56 (100.0%) | 0 (0.0%) |
| 12 to 14 Years | 0 (0.0%) | 0 (0.0%) |
| 15 Years | 0 (0.0%) | 0 (0.0%) |
| 16 and 17 Years | 0 (0.0%) | 0 (0.0%) |
| 18 to 24 Years | 34 (46.6%) | 0 (0.0%) |
| 25 to 34 Years | 0 (0.0%) | 55 (36.2%) |
| 35 to 44 Years | 0 (0.0%) | 0 (0.0%) |
| 45 to 54 Years | 1 (1.7%) | 26 (61.9%) |
| 55 to 64 Years | 0 (0.0%) | 0 (0.0%) |
| 65 to 74 Years | 50 (30.7%) | 46 (55.4%) |
| 75 Years and over | 0 (0.0%) | 19 (100.0%) |
| Total | 141 (29.6%) | 200 (45.9%) |
Income Above Poverty by Sex and Age in Lebec
According to the poverty statistics in Lebec, males aged 25 to 34 years and females aged 35 to 44 years are the age groups that are most secure financially, with 100.0% of males and 100.0% of females in these age groups living above the poverty line.
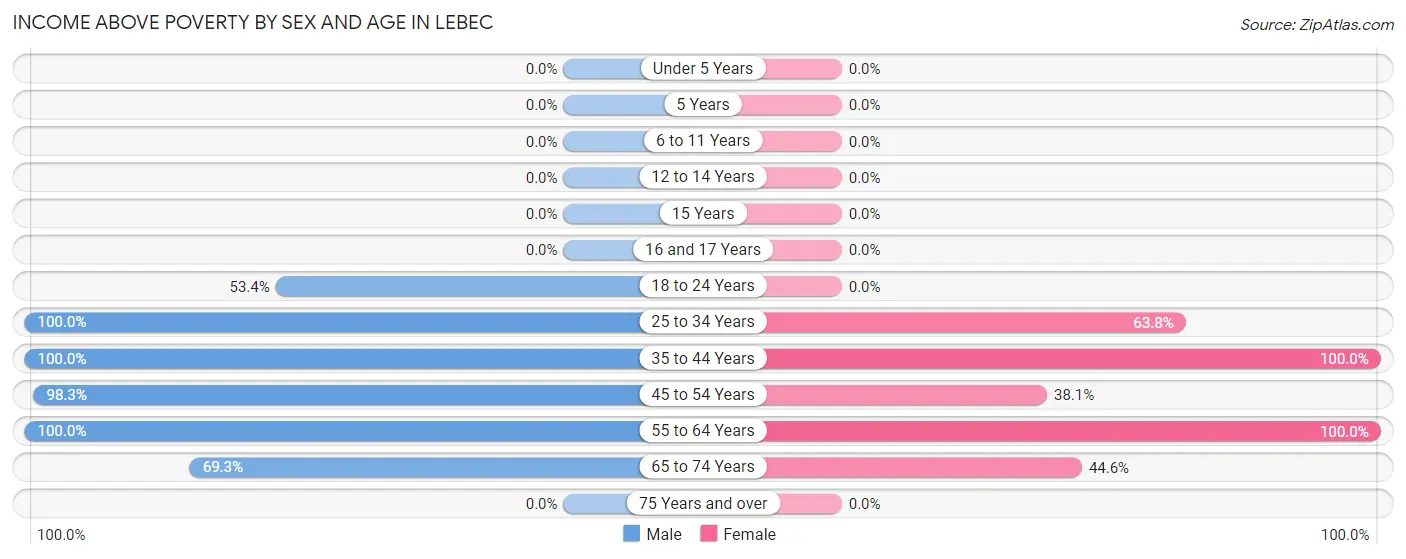
| Age Bracket | Male | Female |
| Under 5 Years | 0 (0.0%) | 0 (0.0%) |
| 5 Years | 0 (0.0%) | 0 (0.0%) |
| 6 to 11 Years | 0 (0.0%) | 0 (0.0%) |
| 12 to 14 Years | 0 (0.0%) | 0 (0.0%) |
| 15 Years | 0 (0.0%) | 0 (0.0%) |
| 16 and 17 Years | 0 (0.0%) | 0 (0.0%) |
| 18 to 24 Years | 39 (53.4%) | 0 (0.0%) |
| 25 to 34 Years | 47 (100.0%) | 97 (63.8%) |
| 35 to 44 Years | 22 (100.0%) | 35 (100.0%) |
| 45 to 54 Years | 59 (98.3%) | 16 (38.1%) |
| 55 to 64 Years | 56 (100.0%) | 51 (100.0%) |
| 65 to 74 Years | 113 (69.3%) | 37 (44.6%) |
| 75 Years and over | 0 (0.0%) | 0 (0.0%) |
| Total | 336 (70.4%) | 236 (54.1%) |
Income Below Poverty Among Married-Couple Families in Lebec
The poverty statistics for married-couple families in Lebec show that 17.0% or 50 of the total 294 families live below the poverty line. Families with no children have the highest poverty rate of 17.0%, comprising of 50 families. On the other hand, families with no children have the lowest poverty rate of 17.0%, which includes 50 families.
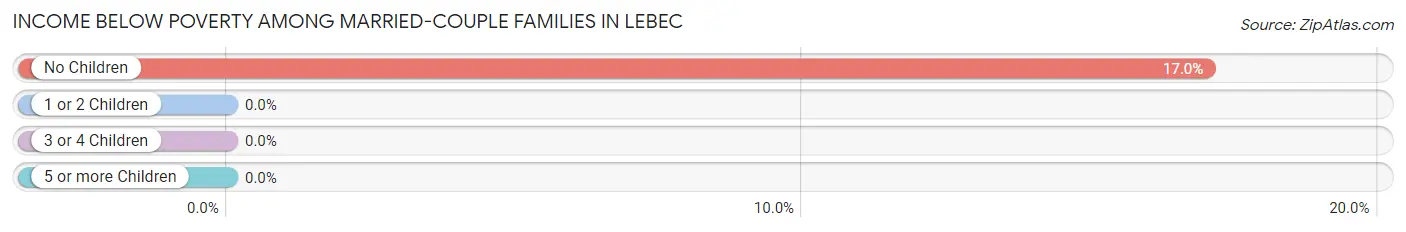
| Children | Above Poverty | Below Poverty |
| No Children | 244 (83.0%) | 50 (17.0%) |
| 1 or 2 Children | 0 (0.0%) | 0 (0.0%) |
| 3 or 4 Children | 0 (0.0%) | 0 (0.0%) |
| 5 or more Children | 0 (0.0%) | 0 (0.0%) |
| Total | 244 (83.0%) | 50 (17.0%) |
Income Below Poverty Among Single-Parent Households in Lebec
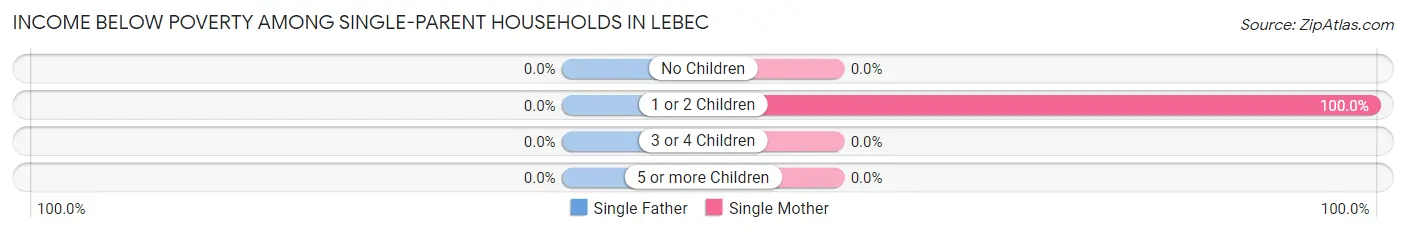
| Children | Single Father | Single Mother |
| No Children | 0 (0.0%) | 0 (0.0%) |
| 1 or 2 Children | 0 (0.0%) | 55 (100.0%) |
| 3 or 4 Children | 0 (0.0%) | 0 (0.0%) |
| 5 or more Children | 0 (0.0%) | 0 (0.0%) |
| Total | 0 (0.0%) | 55 (100.0%) |
Income Below Poverty Among Married-Couple vs Single-Parent Households in Lebec
The poverty data for Lebec shows that 50 of the married-couple family households (17.0%) and 55 of the single-parent households (90.2%) are living below the poverty level. Within the married-couple family households, those with no children have the highest poverty rate, with 50 households (17.0%) falling below the poverty line. Among the single-parent households, those with 1 or 2 children have the highest poverty rate, with 55 household (100.0%) living below poverty.
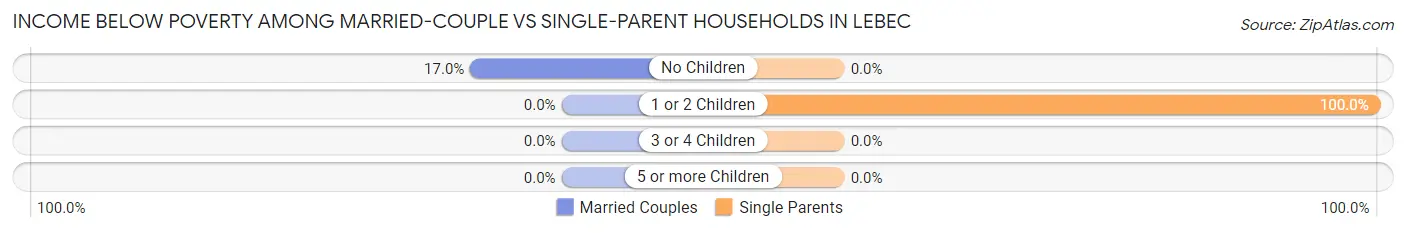
| Children | Married-Couple Families | Single-Parent Households |
| No Children | 50 (17.0%) | 0 (0.0%) |
| 1 or 2 Children | 0 (0.0%) | 55 (100.0%) |
| 3 or 4 Children | 0 (0.0%) | 0 (0.0%) |
| 5 or more Children | 0 (0.0%) | 0 (0.0%) |
| Total | 50 (17.0%) | 55 (90.2%) |
Race in Lebec
The most populous races in Lebec are White / Caucasian (607 | 66.5%), Hispanic or Latino (249 | 27.3%), and Asian (196 | 21.5%).
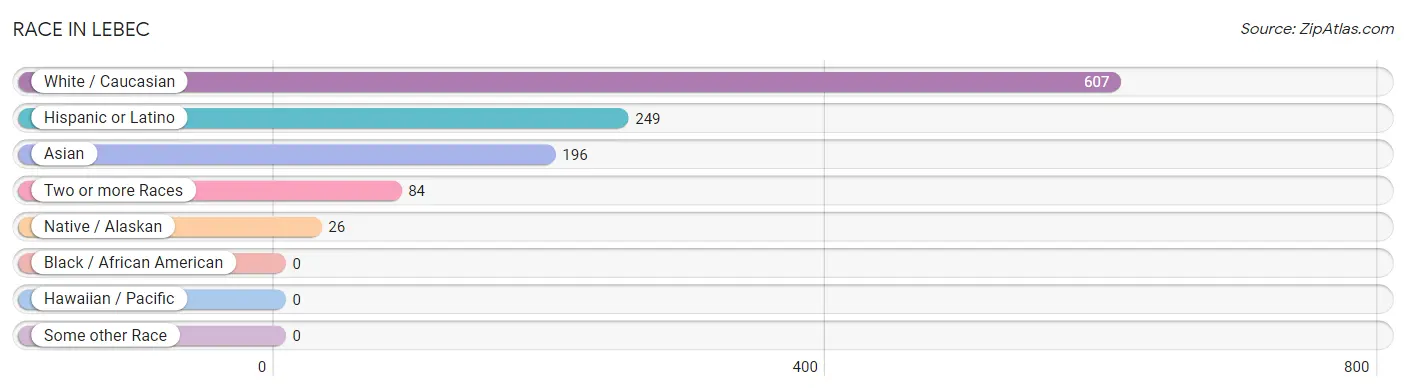
| Race | # Population | % Population |
| Asian | 196 | 21.5% |
| Black / African American | 0 | 0.0% |
| Hawaiian / Pacific | 0 | 0.0% |
| Hispanic or Latino | 249 | 27.3% |
| Native / Alaskan | 26 | 2.9% |
| White / Caucasian | 607 | 66.5% |
| Two or more Races | 84 | 9.2% |
| Some other Race | 0 | 0.0% |
| Total | 913 | 100.0% |
Ancestry in Lebec
The most populous ancestries reported in Lebec are Mexican (241 | 26.4%), English (144 | 15.8%), Indian (Asian) (96 | 10.5%), Burmese (81 | 8.9%), and Russian (55 | 6.0%), together accounting for 67.6% of all Lebec residents.
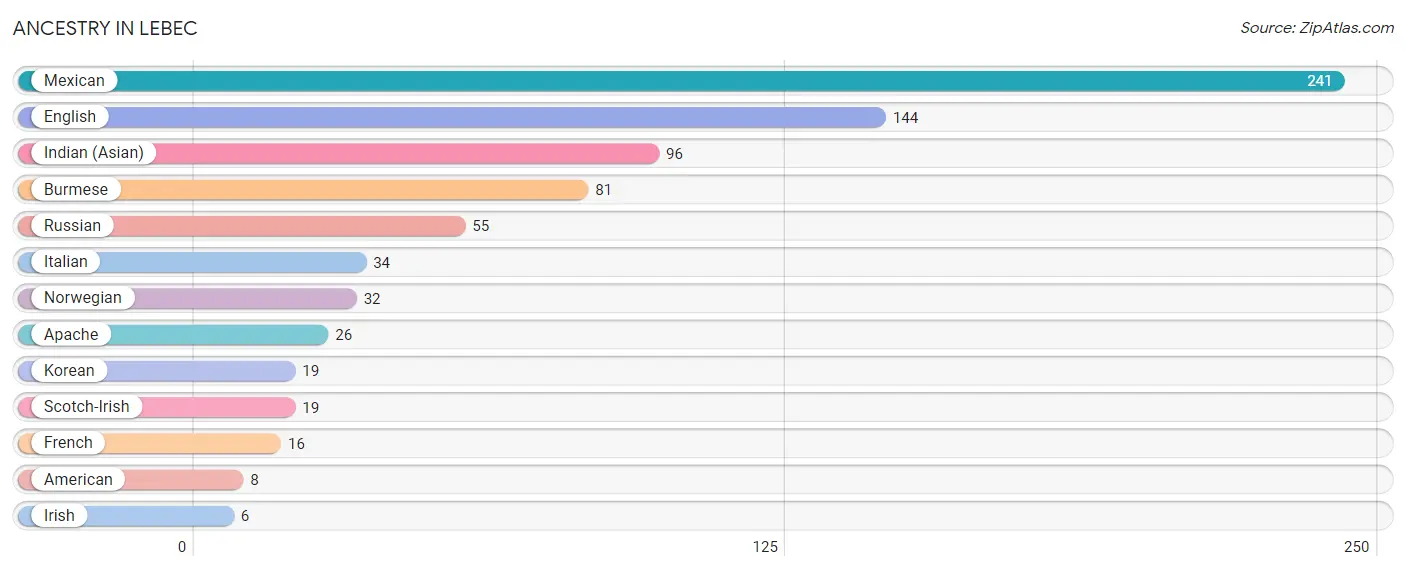
| Ancestry | # Population | % Population |
| American | 8 | 0.9% |
| Apache | 26 | 2.9% |
| Burmese | 81 | 8.9% |
| English | 144 | 15.8% |
| French | 16 | 1.8% |
| Indian (Asian) | 96 | 10.5% |
| Irish | 6 | 0.7% |
| Italian | 34 | 3.7% |
| Korean | 19 | 2.1% |
| Mexican | 241 | 26.4% |
| Norwegian | 32 | 3.5% |
| Russian | 55 | 6.0% |
| Scotch-Irish | 19 | 2.1% | View All 13 Rows |
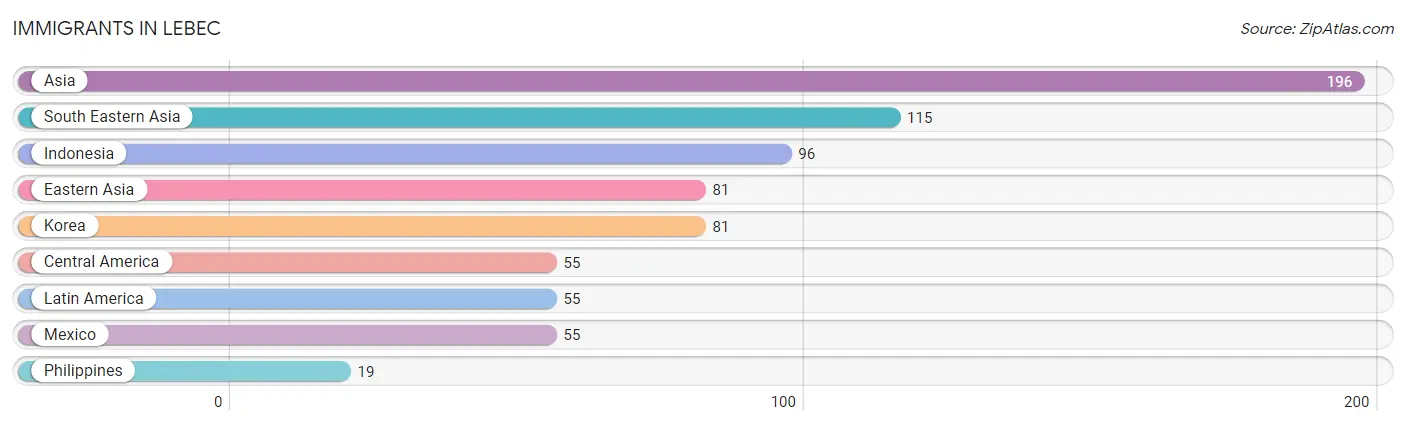
Immigrants in Lebec
The most numerous immigrant groups reported in Lebec came from Asia (196 | 21.5%), South Eastern Asia (115 | 12.6%), Indonesia (96 | 10.5%), Eastern Asia (81 | 8.9%), and Korea (81 | 8.9%), together accounting for 62.3% of all Lebec residents.
| Immigration Origin | # Population | % Population |
| Asia | 196 | 21.5% |
| Central America | 55 | 6.0% |
| Eastern Asia | 81 | 8.9% |
| Indonesia | 96 | 10.5% |
| Korea | 81 | 8.9% |
| Latin America | 55 | 6.0% |
| Mexico | 55 | 6.0% |
| Philippines | 19 | 2.1% |
| South Eastern Asia | 115 | 12.6% | View All 9 Rows |
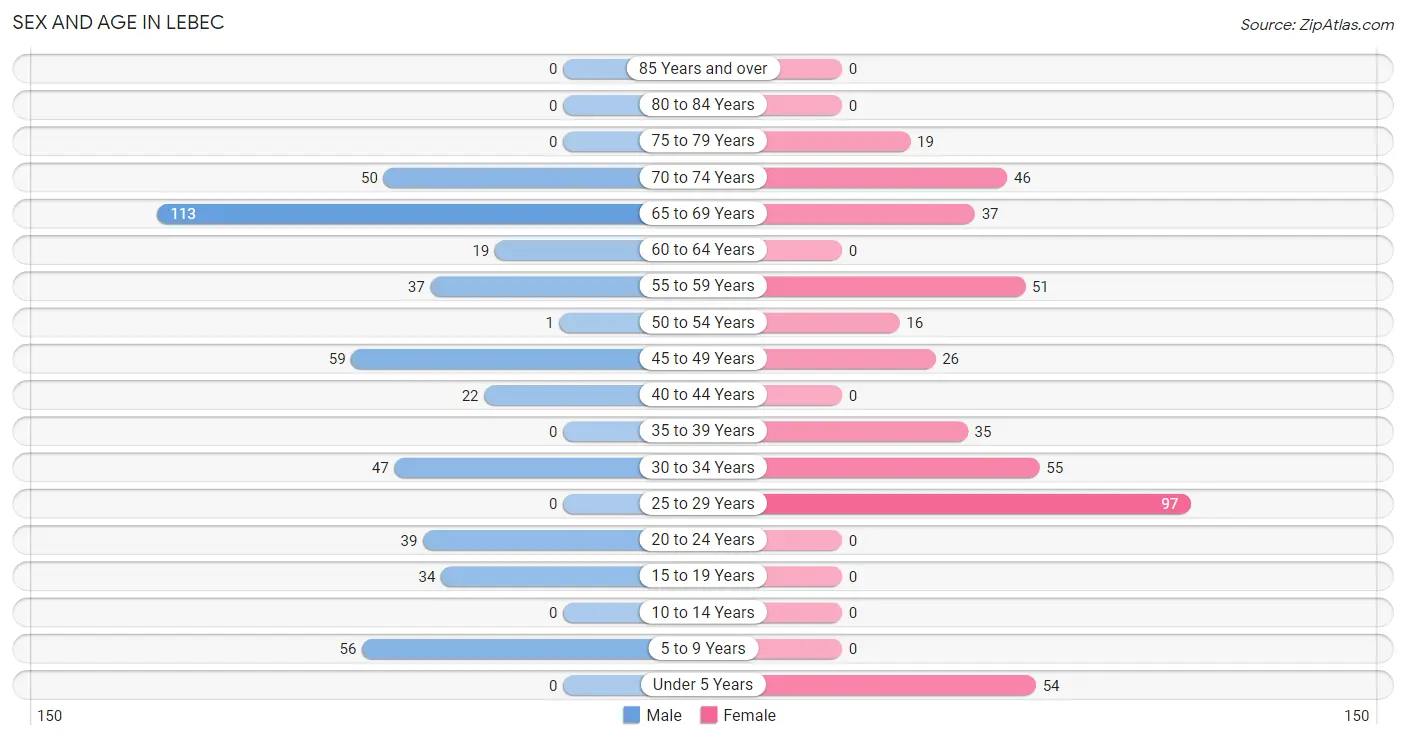
Sex and Age in Lebec
Sex and Age in Lebec
The most populous age groups in Lebec are 65 to 69 Years (113 | 23.7%) for men and 25 to 29 Years (97 | 22.3%) for women.
| Age Bracket | Male | Female |
| Under 5 Years | 0 (0.0%) | 54 (12.4%) |
| 5 to 9 Years | 56 (11.7%) | 0 (0.0%) |
| 10 to 14 Years | 0 (0.0%) | 0 (0.0%) |
| 15 to 19 Years | 34 (7.1%) | 0 (0.0%) |
| 20 to 24 Years | 39 (8.2%) | 0 (0.0%) |
| 25 to 29 Years | 0 (0.0%) | 97 (22.3%) |
| 30 to 34 Years | 47 (9.9%) | 55 (12.6%) |
| 35 to 39 Years | 0 (0.0%) | 35 (8.0%) |
| 40 to 44 Years | 22 (4.6%) | 0 (0.0%) |
| 45 to 49 Years | 59 (12.4%) | 26 (6.0%) |
| 50 to 54 Years | 1 (0.2%) | 16 (3.7%) |
| 55 to 59 Years | 37 (7.8%) | 51 (11.7%) |
| 60 to 64 Years | 19 (4.0%) | 0 (0.0%) |
| 65 to 69 Years | 113 (23.7%) | 37 (8.5%) |
| 70 to 74 Years | 50 (10.5%) | 46 (10.5%) |
| 75 to 79 Years | 0 (0.0%) | 19 (4.4%) |
| 80 to 84 Years | 0 (0.0%) | 0 (0.0%) |
| 85 Years and over | 0 (0.0%) | 0 (0.0%) |
| Total | 477 (100.0%) | 436 (100.0%) |
Families and Households in Lebec
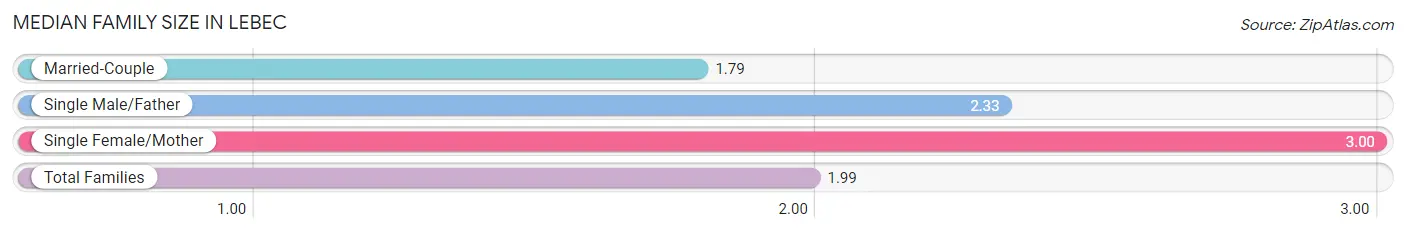
Median Family Size in Lebec
The median family size in Lebec is 1.99 persons per family, with single female/mother families (55 | 15.5%) accounting for the largest median family size of 3 persons per family. On the other hand, married-couple families (294 | 82.8%) represent the smallest median family size with 1.79 persons per family.
| Family Type | # Families | Family Size |
| Married-Couple | 294 (82.8%) | 1.79 |
| Single Male/Father | 6 (1.7%) | 2.33 |
| Single Female/Mother | 55 (15.5%) | 3.00 |
| Total Families | 355 (100.0%) | 1.99 |
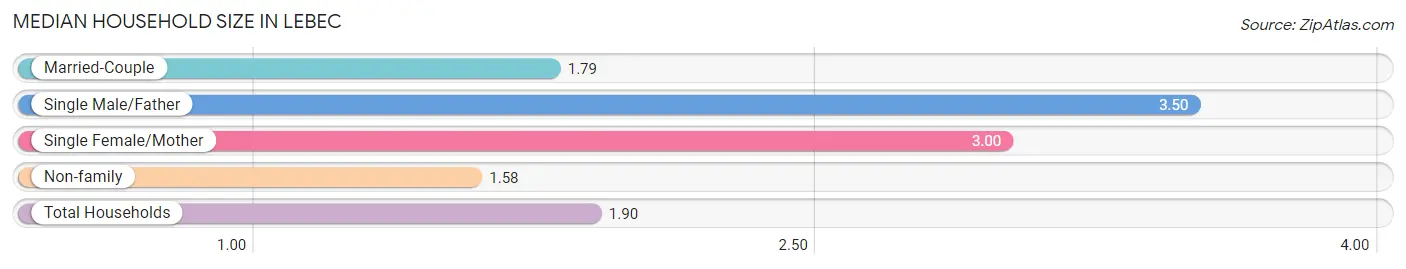
Median Household Size in Lebec
The median household size in Lebec is 1.90 persons per household, with single male/father households (6 | 1.3%) accounting for the largest median household size of 3.5 persons per household. non-family households (126 | 26.2%) represent the smallest median household size with 1.58 persons per household.
| Household Type | # Households | Household Size |
| Married-Couple | 294 (61.1%) | 1.79 |
| Single Male/Father | 6 (1.3%) | 3.50 |
| Single Female/Mother | 55 (11.4%) | 3.00 |
| Non-family | 126 (26.2%) | 1.58 |
| Total Households | 481 (100.0%) | 1.90 |
Household Size by Marriage Status in Lebec
Out of a total of 481 households in Lebec, 355 (73.8%) are family households, while 126 (26.2%) are nonfamily households. The most numerous type of family households are 2-person households, comprising 294, and the most common type of nonfamily households are 1-person households, comprising 92.
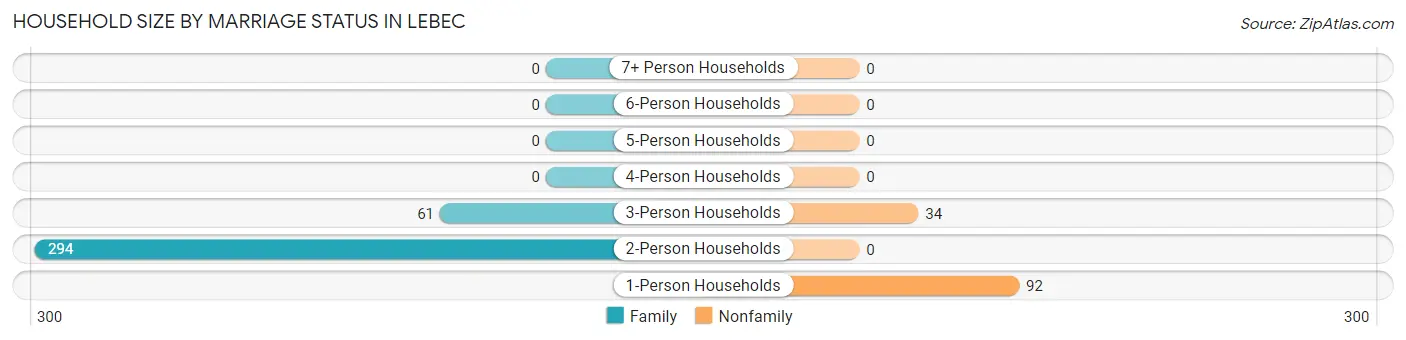
| Household Size | Family Households | Nonfamily Households |
| 1-Person Households | - | 92 (19.1%) |
| 2-Person Households | 294 (61.1%) | 0 (0.0%) |
| 3-Person Households | 61 (12.7%) | 34 (7.1%) |
| 4-Person Households | 0 (0.0%) | 0 (0.0%) |
| 5-Person Households | 0 (0.0%) | 0 (0.0%) |
| 6-Person Households | 0 (0.0%) | 0 (0.0%) |
| 7+ Person Households | 0 (0.0%) | 0 (0.0%) |
| Total | 355 (73.8%) | 126 (26.2%) |
Female Fertility in Lebec
Fertility by Age in Lebec
Average fertility rate in Lebec is 258.0 births per 1,000 women. Women in the age bracket of 20 to 34 years have the highest fertility rate with 362.0 births per 1,000 women. Women in the age bracket of 20 to 34 years acount for 100.0% of all women with births.
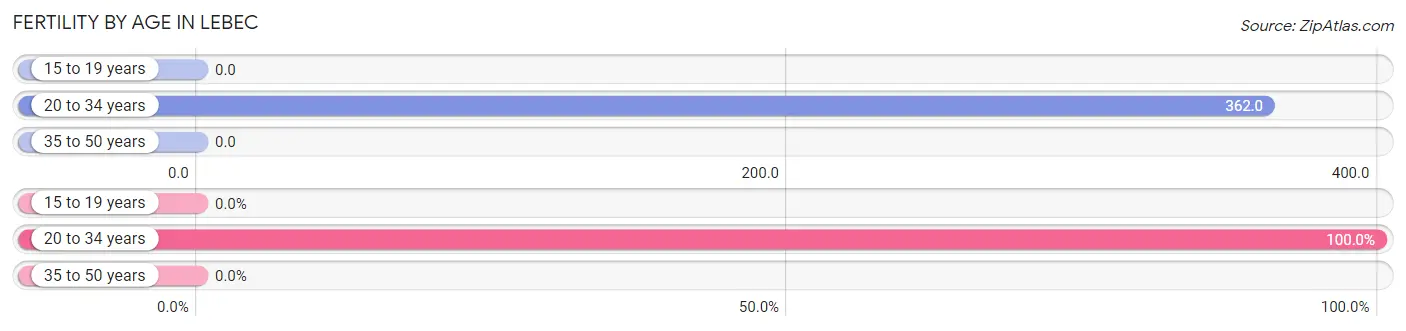
| Age Bracket | Women with Births | Births / 1,000 Women |
| 15 to 19 years | 0 (0.0%) | 0.0 |
| 20 to 34 years | 55 (100.0%) | 362.0 |
| 35 to 50 years | 0 (0.0%) | 0.0 |
| Total | 55 (100.0%) | 258.0 |
Fertility by Age by Marriage Status in Lebec
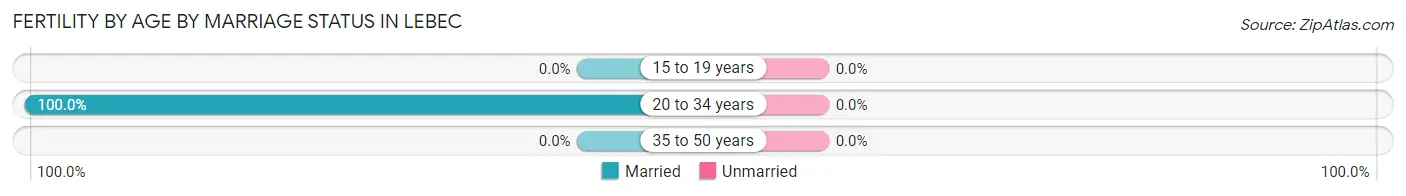
| Age Bracket | Married | Unmarried |
| 15 to 19 years | 0 (0.0%) | 0 (0.0%) |
| 20 to 34 years | 55 (100.0%) | 0 (0.0%) |
| 35 to 50 years | 0 (0.0%) | 0 (0.0%) |
| Total | 55 (100.0%) | 0 (0.0%) |
Fertility by Education in Lebec
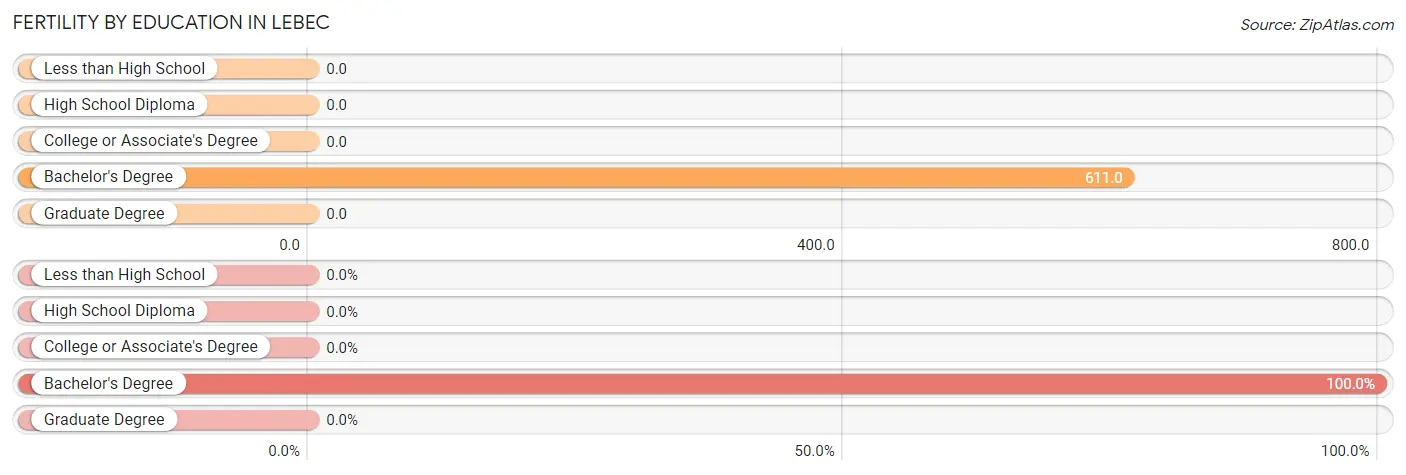
| Educational Attainment | Women with Births | Births / 1,000 Women |
| Less than High School | 0 (0.0%) | 0.0 |
| High School Diploma | 0 (0.0%) | 0.0 |
| College or Associate's Degree | 0 (0.0%) | 0.0 |
| Bachelor's Degree | 55 (100.0%) | 611.0 |
| Graduate Degree | 0 (0.0%) | 0.0 |
| Total | 55 (100.0%) | 258.0 |
Fertility by Education by Marriage Status in Lebec
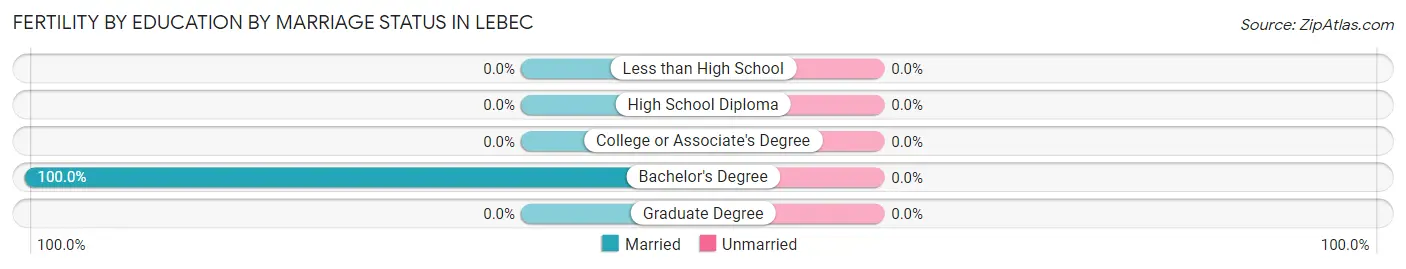
| Educational Attainment | Married | Unmarried |
| Less than High School | 0 (0.0%) | 0 (0.0%) |
| High School Diploma | 0 (0.0%) | 0 (0.0%) |
| College or Associate's Degree | 0 (0.0%) | 0 (0.0%) |
| Bachelor's Degree | 55 (100.0%) | 0 (0.0%) |
| Graduate Degree | 0 (0.0%) | 0 (0.0%) |
| Total | 55 (100.0%) | 0 (0.0%) |
Employment Characteristics in Lebec
Employment by Class of Employer in Lebec
Among the 308 employed individuals in Lebec, private company employees (166 | 53.9%), not-for-profit organizations (55 | 17.9%), and state government employees (39 | 12.7%) make up the most common classes of employment.
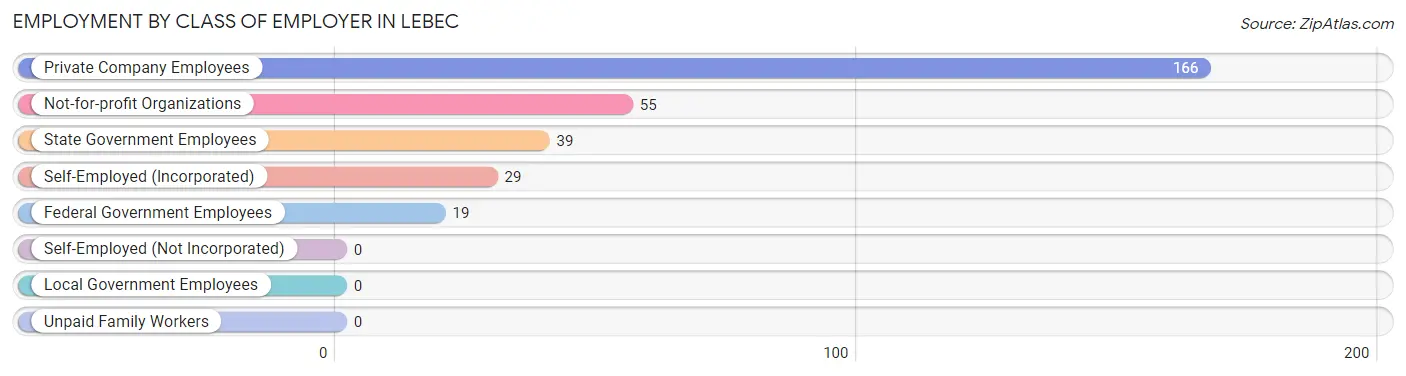
| Employer Class | # Employees | % Employees |
| Private Company Employees | 166 | 53.9% |
| Self-Employed (Incorporated) | 29 | 9.4% |
| Self-Employed (Not Incorporated) | 0 | 0.0% |
| Not-for-profit Organizations | 55 | 17.9% |
| Local Government Employees | 0 | 0.0% |
| State Government Employees | 39 | 12.7% |
| Federal Government Employees | 19 | 6.2% |
| Unpaid Family Workers | 0 | 0.0% |
| Total | 308 | 100.0% |
Employment Status by Age in Lebec
According to the labor force statistics for Lebec, out of the total population over 16 years of age (803), 52.3% or 420 individuals are in the labor force, with 13.6% or 57 of them unemployed. The age group with the highest labor force participation rate is 16 to 19 years, with 100.0% or 34 individuals in the labor force. Within the labor force, the 35 to 44 years age range has the highest percentage of unemployed individuals, with 100.0% or 57 of them being unemployed.
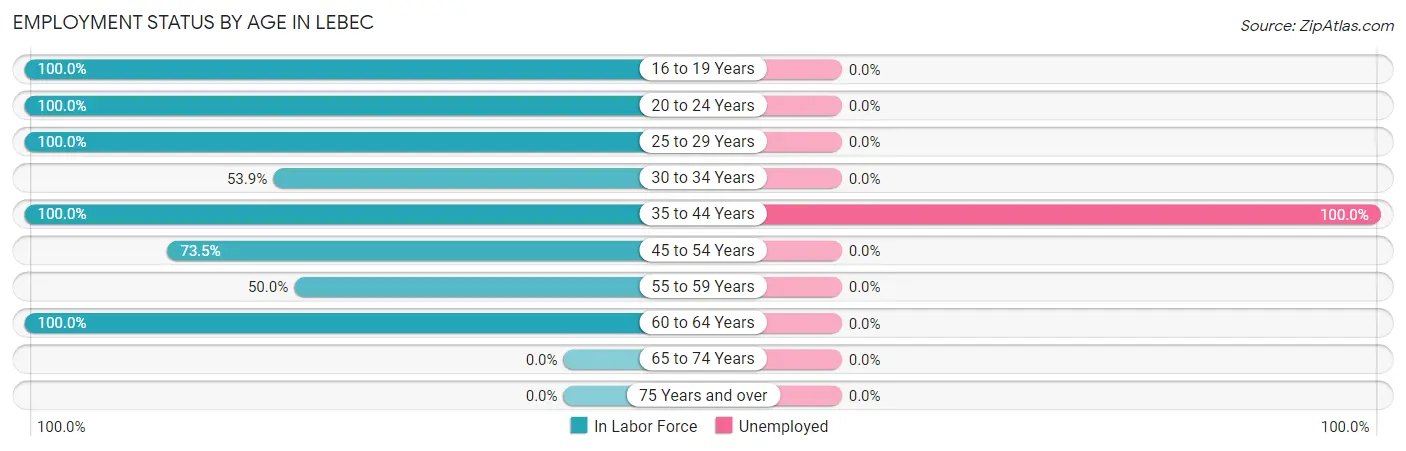
| Age Bracket | In Labor Force | Unemployed |
| 16 to 19 Years | 34 (100.0%) | 0 (0.0%) |
| 20 to 24 Years | 39 (100.0%) | 0 (0.0%) |
| 25 to 29 Years | 97 (100.0%) | 0 (0.0%) |
| 30 to 34 Years | 55 (53.9%) | 0 (0.0%) |
| 35 to 44 Years | 57 (100.0%) | 57 (100.0%) |
| 45 to 54 Years | 75 (73.5%) | 0 (0.0%) |
| 55 to 59 Years | 44 (50.0%) | 0 (0.0%) |
| 60 to 64 Years | 19 (100.0%) | 0 (0.0%) |
| 65 to 74 Years | 0 (0.0%) | 0 (0.0%) |
| 75 Years and over | 0 (0.0%) | 0 (0.0%) |
| Total | 420 (52.3%) | 57 (13.6%) |
Employment Status by Educational Attainment in Lebec
According to labor force statistics for Lebec, 74.6% of individuals (347) out of the total population between 25 and 64 years of age (465) are in the labor force, with 16.4% or 57 of them being unemployed. The group with the highest labor force participation rate are those with the educational attainment of high school diploma, with 98.6% or 70 individuals in the labor force. Within the labor force, individuals with high school diploma education have the highest percentage of unemployment, with 31.4% or 22 of them being unemployed.
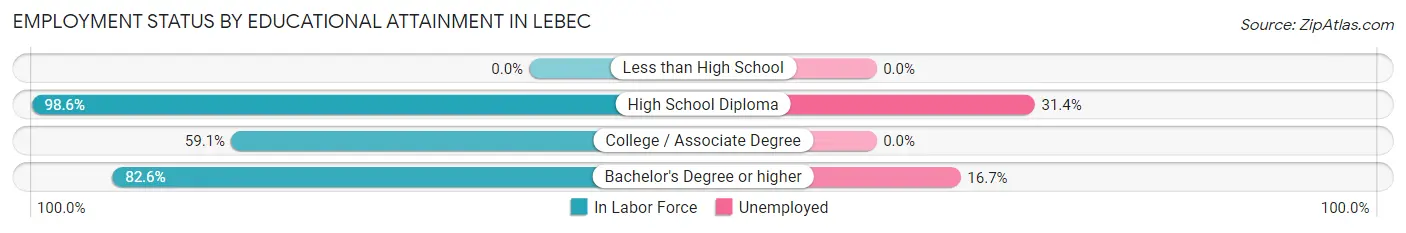
| Educational Attainment | In Labor Force | Unemployed |
| Less than High School | 0 (0.0%) | 0 (0.0%) |
| High School Diploma | 70 (98.6%) | 22 (31.4%) |
| College / Associate Degree | 68 (59.1%) | 0 (0.0%) |
| Bachelor's Degree or higher | 209 (82.6%) | 42 (16.7%) |
| Total | 347 (74.6%) | 76 (16.4%) |
Employment Occupations by Sex in Lebec
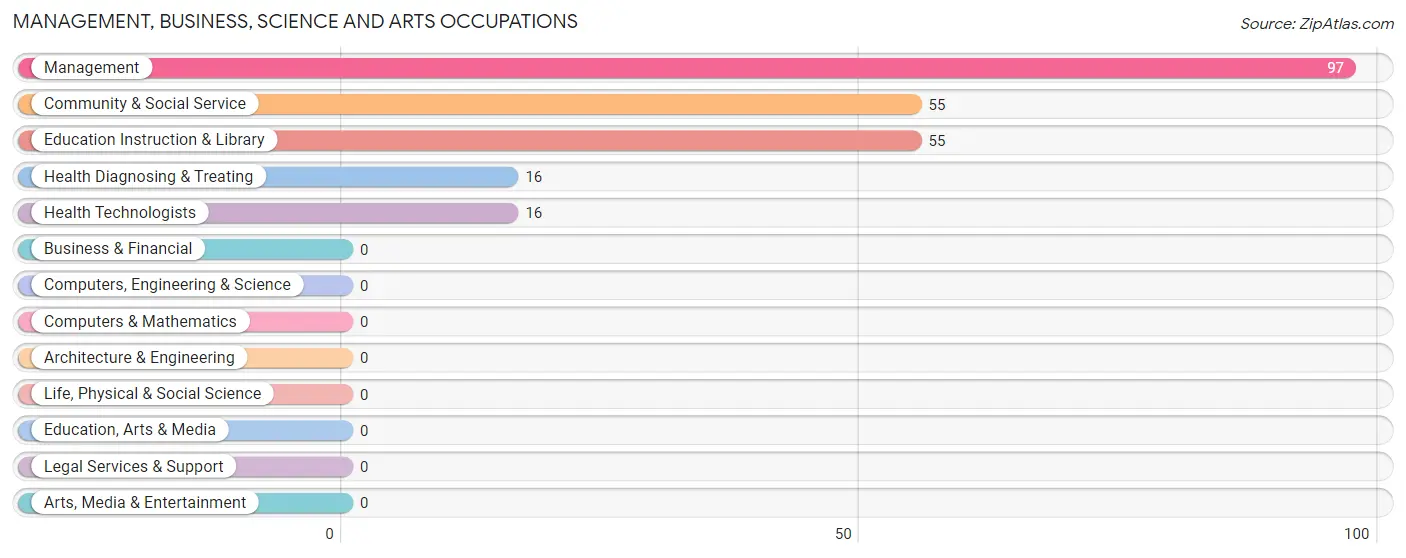
Management, Business, Science and Arts Occupations
The most common Management, Business, Science and Arts occupations in Lebec are Management (97 | 26.7%), Community & Social Service (55 | 15.1%), Education Instruction & Library (55 | 15.1%), Health Diagnosing & Treating (16 | 4.4%), and Health Technologists (16 | 4.4%).
Management, Business, Science and Arts Occupations by Sex
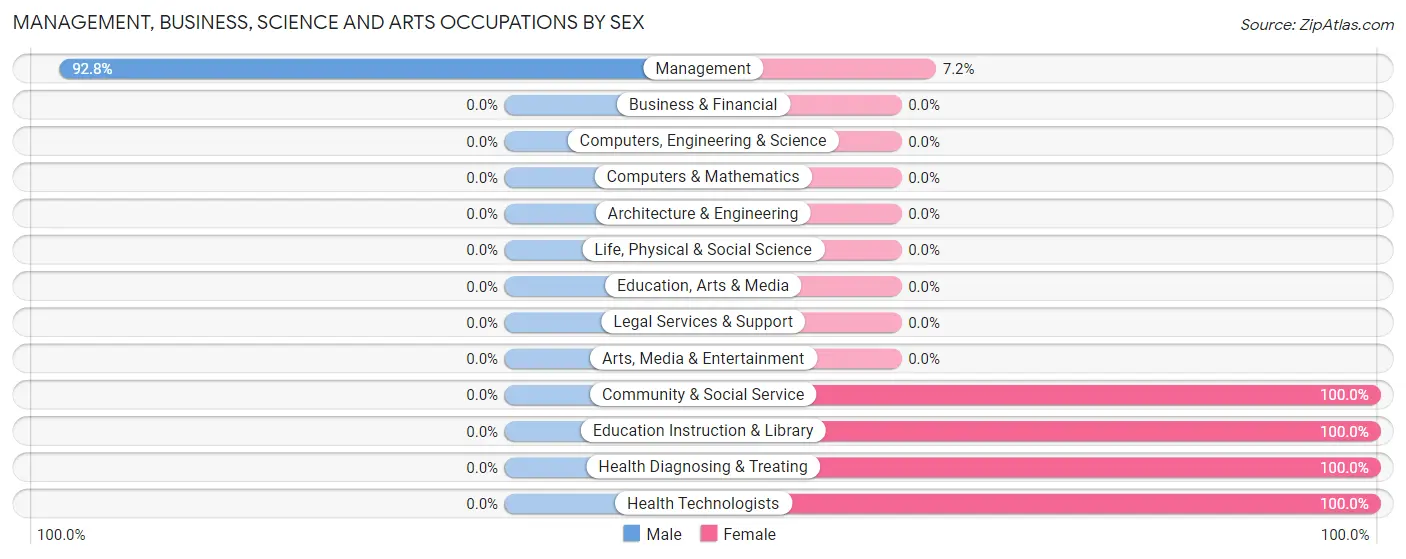
| Occupation | Male | Female |
| Management | 90 (92.8%) | 7 (7.2%) |
| Business & Financial | 0 (0.0%) | 0 (0.0%) |
| Computers, Engineering & Science | 0 (0.0%) | 0 (0.0%) |
| Computers & Mathematics | 0 (0.0%) | 0 (0.0%) |
| Architecture & Engineering | 0 (0.0%) | 0 (0.0%) |
| Life, Physical & Social Science | 0 (0.0%) | 0 (0.0%) |
| Community & Social Service | 0 (0.0%) | 55 (100.0%) |
| Education, Arts & Media | 0 (0.0%) | 0 (0.0%) |
| Legal Services & Support | 0 (0.0%) | 0 (0.0%) |
| Education Instruction & Library | 0 (0.0%) | 55 (100.0%) |
| Arts, Media & Entertainment | 0 (0.0%) | 0 (0.0%) |
| Health Diagnosing & Treating | 0 (0.0%) | 16 (100.0%) |
| Health Technologists | 0 (0.0%) | 16 (100.0%) |
| Total (Category) | 90 (53.6%) | 78 (46.4%) |
| Total (Overall) | 188 (51.8%) | 175 (48.2%) |
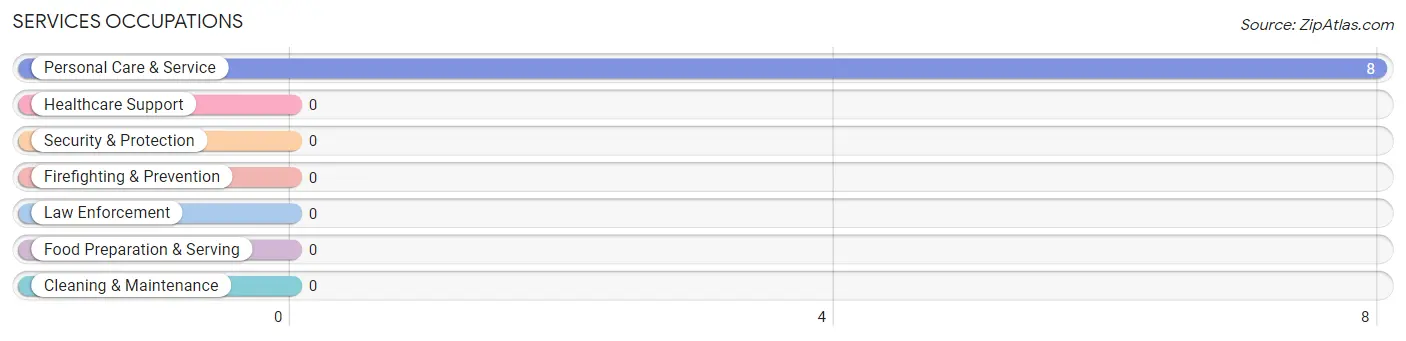
Services Occupations
The most common Services occupations in Lebec are , and Personal Care & Service (8 | 2.2%).
Services Occupations by Sex
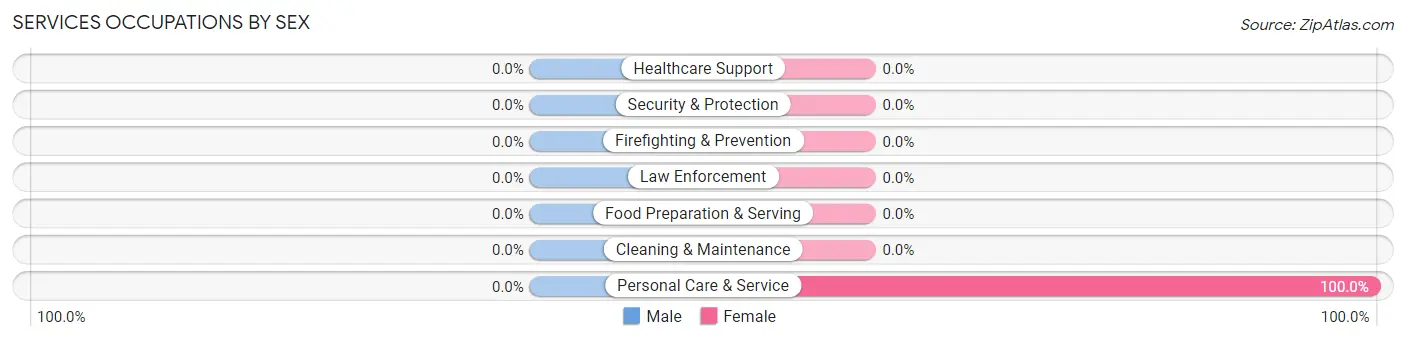
| Occupation | Male | Female |
| Healthcare Support | 0 (0.0%) | 0 (0.0%) |
| Security & Protection | 0 (0.0%) | 0 (0.0%) |
| Firefighting & Prevention | 0 (0.0%) | 0 (0.0%) |
| Law Enforcement | 0 (0.0%) | 0 (0.0%) |
| Food Preparation & Serving | 0 (0.0%) | 0 (0.0%) |
| Cleaning & Maintenance | 0 (0.0%) | 0 (0.0%) |
| Personal Care & Service | 0 (0.0%) | 8 (100.0%) |
| Total (Category) | 0 (0.0%) | 8 (100.0%) |
| Total (Overall) | 188 (51.8%) | 175 (48.2%) |
Sales and Office Occupations
The most common Sales and Office occupations in Lebec are , and Sales & Related (55 | 15.1%).
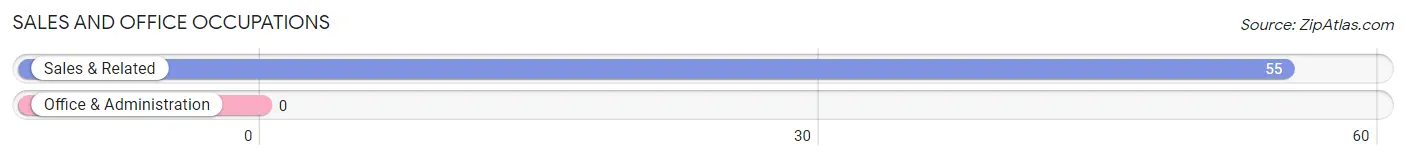
Sales and Office Occupations by Sex
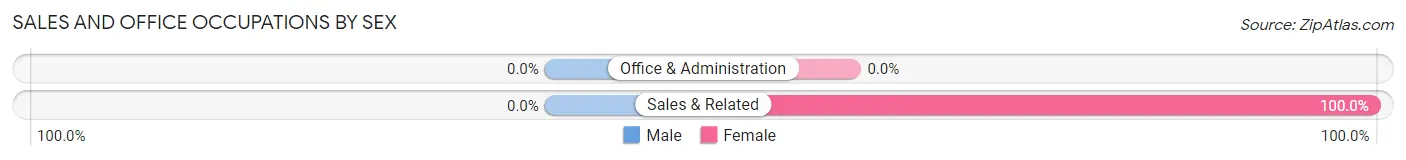
| Occupation | Male | Female |
| Sales & Related | 0 (0.0%) | 55 (100.0%) |
| Office & Administration | 0 (0.0%) | 0 (0.0%) |
| Total (Category) | 0 (0.0%) | 55 (100.0%) |
| Total (Overall) | 188 (51.8%) | 175 (48.2%) |
Natural Resources, Construction and Maintenance Occupations
The most common Natural Resources, Construction and Maintenance occupations in Lebec are Construction & Extraction (34 | 9.4%), and Installation, Maintenance & Repair (19 | 5.2%).
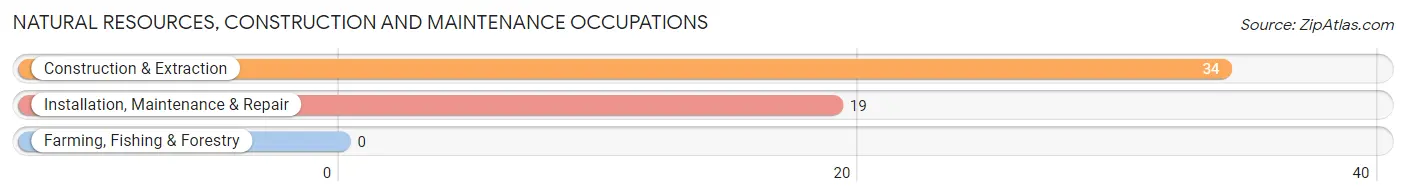
Natural Resources, Construction and Maintenance Occupations by Sex
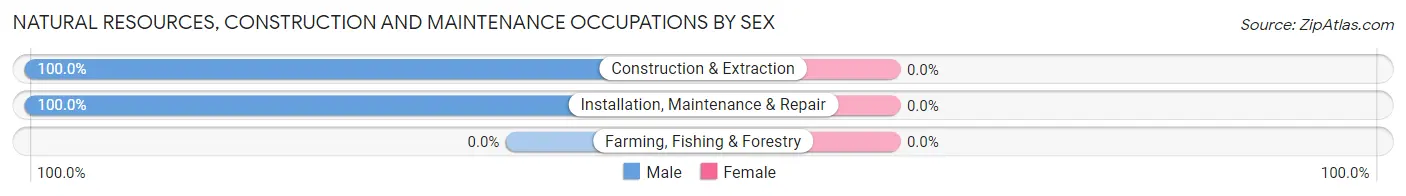
| Occupation | Male | Female |
| Farming, Fishing & Forestry | 0 (0.0%) | 0 (0.0%) |
| Construction & Extraction | 34 (100.0%) | 0 (0.0%) |
| Installation, Maintenance & Repair | 19 (100.0%) | 0 (0.0%) |
| Total (Category) | 53 (100.0%) | 0 (0.0%) |
| Total (Overall) | 188 (51.8%) | 175 (48.2%) |
Production, Transportation and Moving Occupations
The most common Production, Transportation and Moving occupations in Lebec are Transportation (40 | 11.0%), and Material Moving (39 | 10.7%).
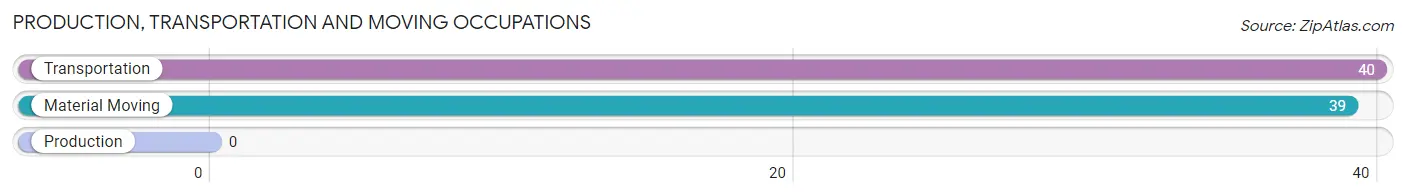
Production, Transportation and Moving Occupations by Sex
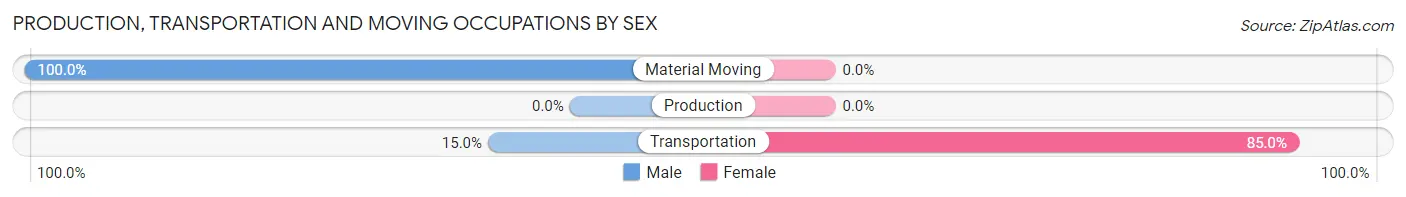
| Occupation | Male | Female |
| Production | 0 (0.0%) | 0 (0.0%) |
| Transportation | 6 (15.0%) | 34 (85.0%) |
| Material Moving | 39 (100.0%) | 0 (0.0%) |
| Total (Category) | 45 (57.0%) | 34 (43.0%) |
| Total (Overall) | 188 (51.8%) | 175 (48.2%) |
Employment Industries by Sex in Lebec
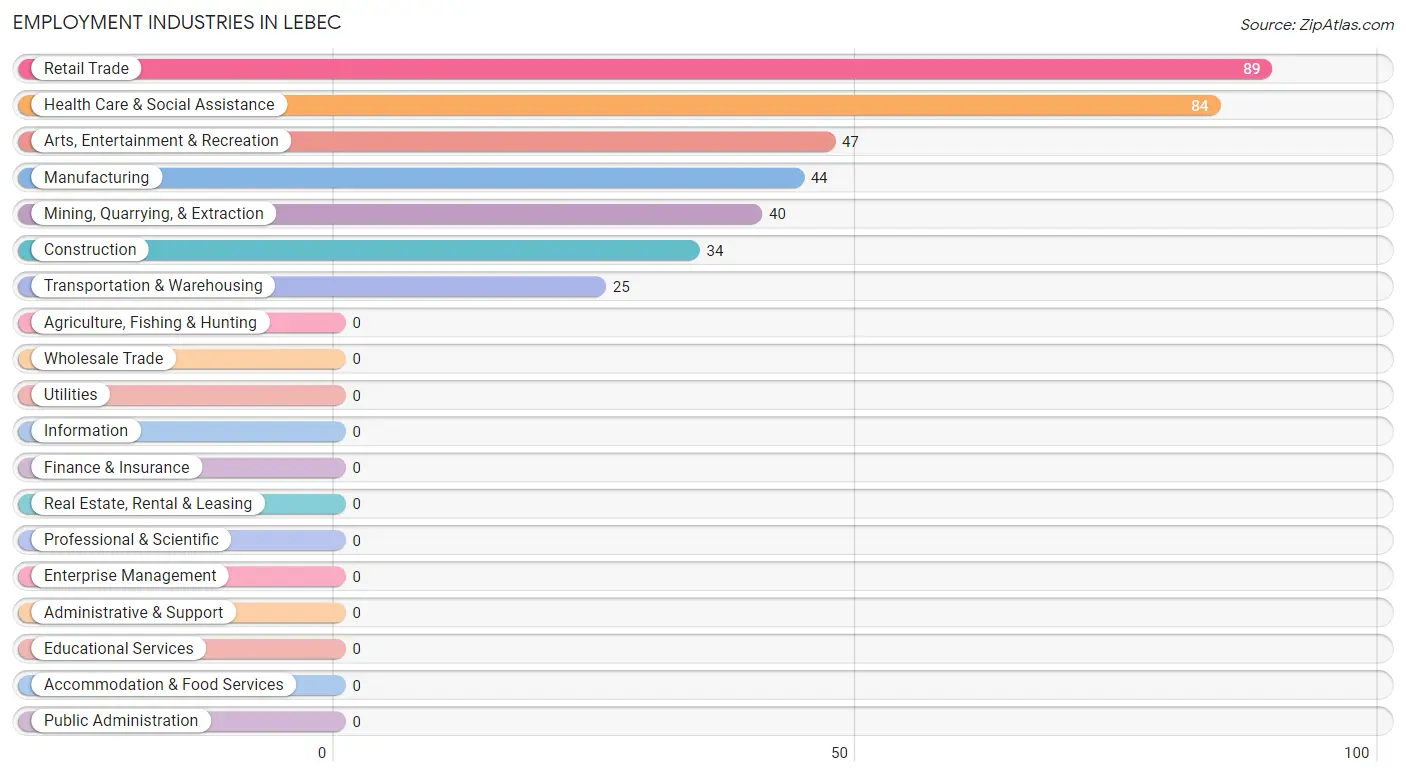
Employment Industries in Lebec
The major employment industries in Lebec include Retail Trade (89 | 24.5%), Health Care & Social Assistance (84 | 23.1%), Arts, Entertainment & Recreation (47 | 13.0%), Manufacturing (44 | 12.1%), and Mining, Quarrying, & Extraction (40 | 11.0%).
Employment Industries by Sex in Lebec
The Lebec industries that see more men than women are Mining, Quarrying, & Extraction (100.0%), Construction (100.0%), and Transportation & Warehousing (100.0%), whereas the industries that tend to have a higher number of women are Retail Trade (100.0%), Health Care & Social Assistance (84.5%), and Arts, Entertainment & Recreation (17.0%).
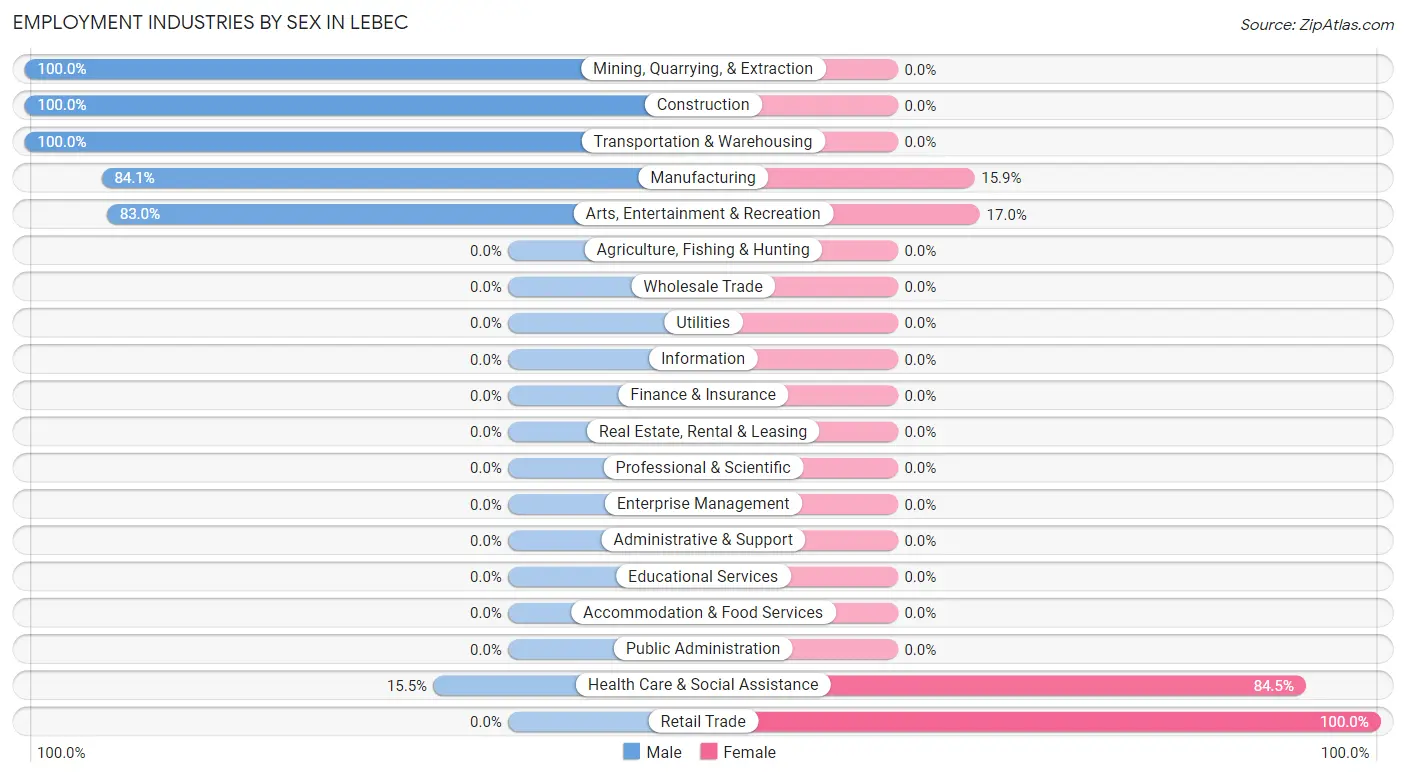
| Industry | Male | Female |
| Agriculture, Fishing & Hunting | 0 (0.0%) | 0 (0.0%) |
| Mining, Quarrying, & Extraction | 40 (100.0%) | 0 (0.0%) |
| Construction | 34 (100.0%) | 0 (0.0%) |
| Manufacturing | 37 (84.1%) | 7 (15.9%) |
| Wholesale Trade | 0 (0.0%) | 0 (0.0%) |
| Retail Trade | 0 (0.0%) | 89 (100.0%) |
| Transportation & Warehousing | 25 (100.0%) | 0 (0.0%) |
| Utilities | 0 (0.0%) | 0 (0.0%) |
| Information | 0 (0.0%) | 0 (0.0%) |
| Finance & Insurance | 0 (0.0%) | 0 (0.0%) |
| Real Estate, Rental & Leasing | 0 (0.0%) | 0 (0.0%) |
| Professional & Scientific | 0 (0.0%) | 0 (0.0%) |
| Enterprise Management | 0 (0.0%) | 0 (0.0%) |
| Administrative & Support | 0 (0.0%) | 0 (0.0%) |
| Educational Services | 0 (0.0%) | 0 (0.0%) |
| Health Care & Social Assistance | 13 (15.5%) | 71 (84.5%) |
| Arts, Entertainment & Recreation | 39 (83.0%) | 8 (17.0%) |
| Accommodation & Food Services | 0 (0.0%) | 0 (0.0%) |
| Public Administration | 0 (0.0%) | 0 (0.0%) |
| Total | 188 (51.8%) | 175 (48.2%) |
Education in Lebec
School Enrollment in Lebec
The most common levels of schooling among the 96 students in Lebec are elementary school (56 | 58.3%), and graduate / professional (40 | 41.7%).
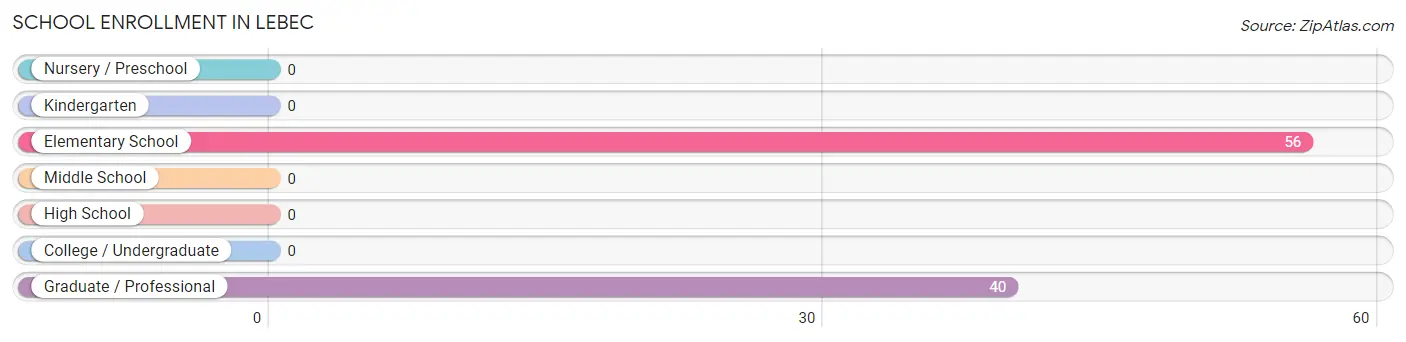
| School Level | # Students | % Students |
| Nursery / Preschool | 0 | 0.0% |
| Kindergarten | 0 | 0.0% |
| Elementary School | 56 | 58.3% |
| Middle School | 0 | 0.0% |
| High School | 0 | 0.0% |
| College / Undergraduate | 0 | 0.0% |
| Graduate / Professional | 40 | 41.7% |
| Total | 96 | 100.0% |
School Enrollment by Age by Funding Source in Lebec
Out of a total of 96 students who are enrolled in schools in Lebec, 40 (41.7%) attend a private institution, while the remaining 56 (58.3%) are enrolled in public schools. The age group of 35 years and over has the highest likelihood of being enrolled in private schools, with 40 (100.0% in the age bracket) enrolled. Conversely, the age group of 5 to 9 year old has the lowest likelihood of being enrolled in a private school, with 56 (100.0% in the age bracket) attending a public institution.
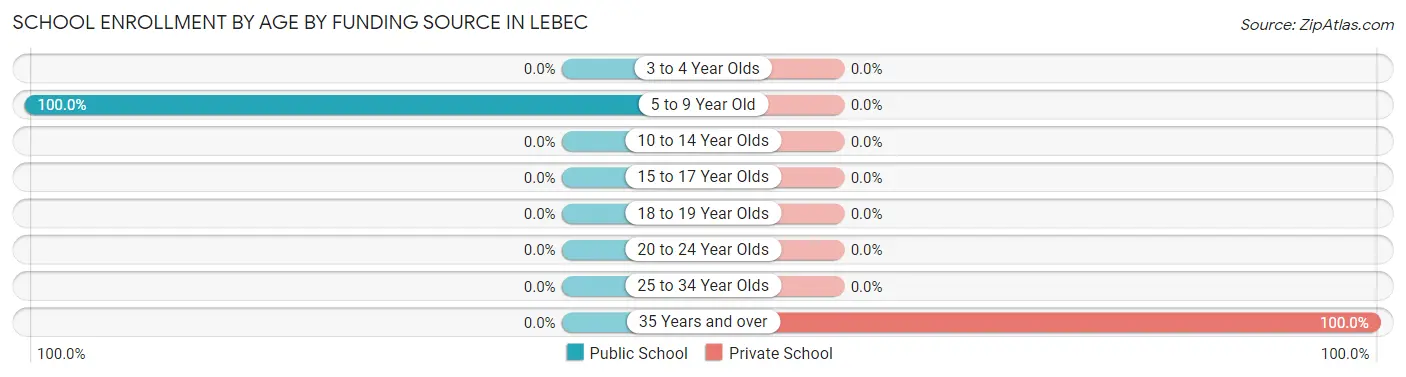
| Age Bracket | Public School | Private School |
| 3 to 4 Year Olds | 0 (0.0%) | 0 (0.0%) |
| 5 to 9 Year Old | 56 (100.0%) | 0 (0.0%) |
| 10 to 14 Year Olds | 0 (0.0%) | 0 (0.0%) |
| 15 to 17 Year Olds | 0 (0.0%) | 0 (0.0%) |
| 18 to 19 Year Olds | 0 (0.0%) | 0 (0.0%) |
| 20 to 24 Year Olds | 0 (0.0%) | 0 (0.0%) |
| 25 to 34 Year Olds | 0 (0.0%) | 0 (0.0%) |
| 35 Years and over | 0 (0.0%) | 40 (100.0%) |
| Total | 56 (58.3%) | 40 (41.7%) |
Educational Attainment by Field of Study in Lebec
Business (168 | 54.4%), arts & humanities (62 | 20.1%), computers & mathematics (44 | 14.2%), engineering (19 | 6.1%), and physical & health sciences (16 | 5.2%) are the most common fields of study among 309 individuals in Lebec who have obtained a bachelor's degree or higher.
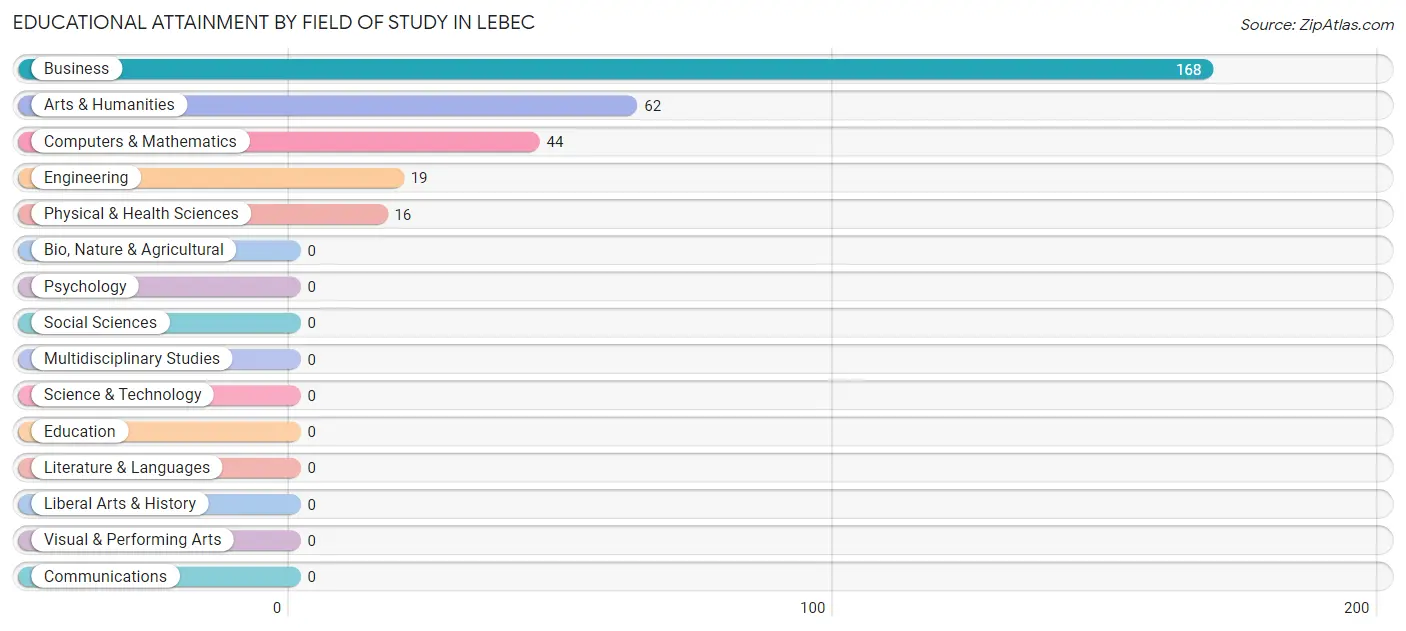
| Field of Study | # Graduates | % Graduates |
| Computers & Mathematics | 44 | 14.2% |
| Bio, Nature & Agricultural | 0 | 0.0% |
| Physical & Health Sciences | 16 | 5.2% |
| Psychology | 0 | 0.0% |
| Social Sciences | 0 | 0.0% |
| Engineering | 19 | 6.1% |
| Multidisciplinary Studies | 0 | 0.0% |
| Science & Technology | 0 | 0.0% |
| Business | 168 | 54.4% |
| Education | 0 | 0.0% |
| Literature & Languages | 0 | 0.0% |
| Liberal Arts & History | 0 | 0.0% |
| Visual & Performing Arts | 0 | 0.0% |
| Communications | 0 | 0.0% |
| Arts & Humanities | 62 | 20.1% |
| Total | 309 | 100.0% |
Transportation & Commute in Lebec
Vehicle Availability by Sex in Lebec
The most prevalent vehicle ownership categories in Lebec are males with 4 vehicles (86, accounting for 45.7%) and females with 4 vehicles (50, making up 71.7%).
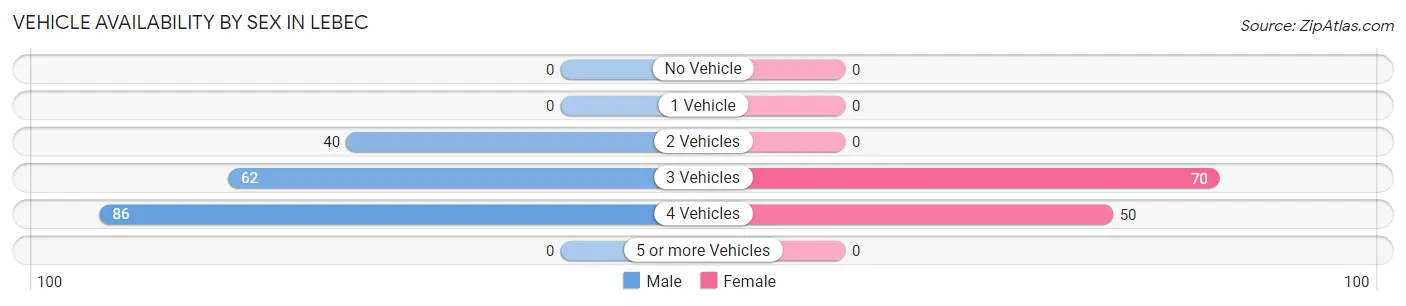
| Vehicles Available | Male | Female |
| No Vehicle | 0 (0.0%) | 0 (0.0%) |
| 1 Vehicle | 0 (0.0%) | 0 (0.0%) |
| 2 Vehicles | 40 (21.3%) | 0 (0.0%) |
| 3 Vehicles | 62 (33.0%) | 70 (58.3%) |
| 4 Vehicles | 86 (45.7%) | 50 (41.7%) |
| 5 or more Vehicles | 0 (0.0%) | 0 (0.0%) |
| Total | 188 (100.0%) | 120 (100.0%) |
Commute Time in Lebec
The most frequently occuring commute durations in Lebec are 15 to 19 minutes (71 commuters, 27.8%), 60 to 89 minutes (55 commuters, 21.6%), and 25 to 29 minutes (39 commuters, 15.3%).
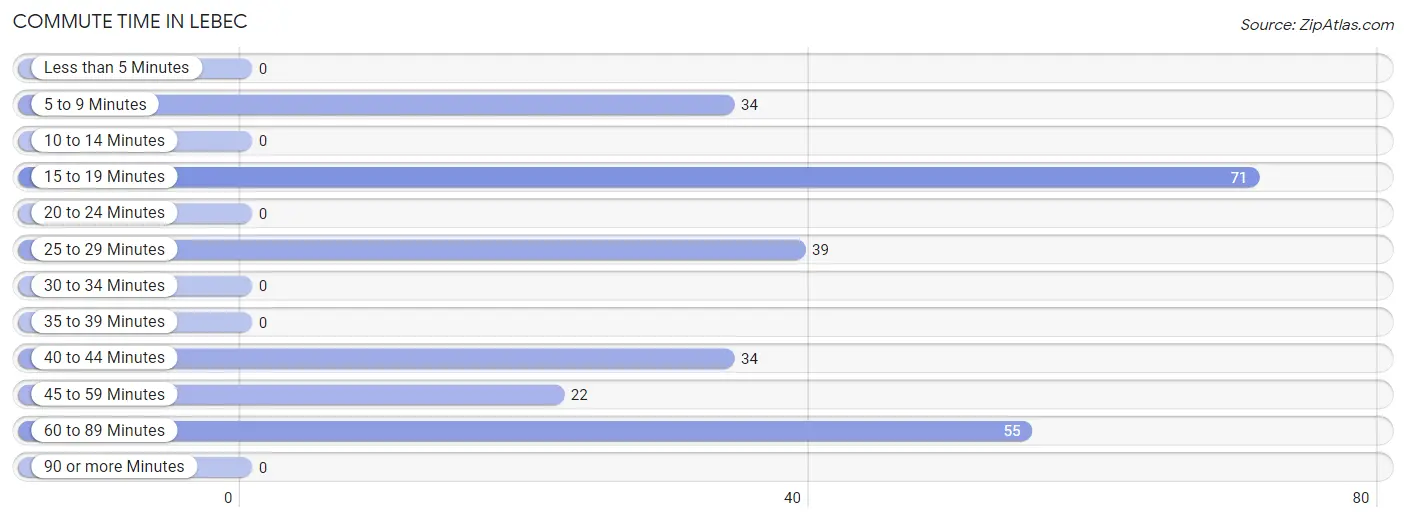
| Commute Time | # Commuters | % Commuters |
| Less than 5 Minutes | 0 | 0.0% |
| 5 to 9 Minutes | 34 | 13.3% |
| 10 to 14 Minutes | 0 | 0.0% |
| 15 to 19 Minutes | 71 | 27.8% |
| 20 to 24 Minutes | 0 | 0.0% |
| 25 to 29 Minutes | 39 | 15.3% |
| 30 to 34 Minutes | 0 | 0.0% |
| 35 to 39 Minutes | 0 | 0.0% |
| 40 to 44 Minutes | 34 | 13.3% |
| 45 to 59 Minutes | 22 | 8.6% |
| 60 to 89 Minutes | 55 | 21.6% |
| 90 or more Minutes | 0 | 0.0% |
Commute Time by Sex in Lebec
The most common commute times in Lebec are 25 to 29 minutes (39 commuters, 28.9%) for males and 60 to 89 minutes (55 commuters, 45.8%) for females.
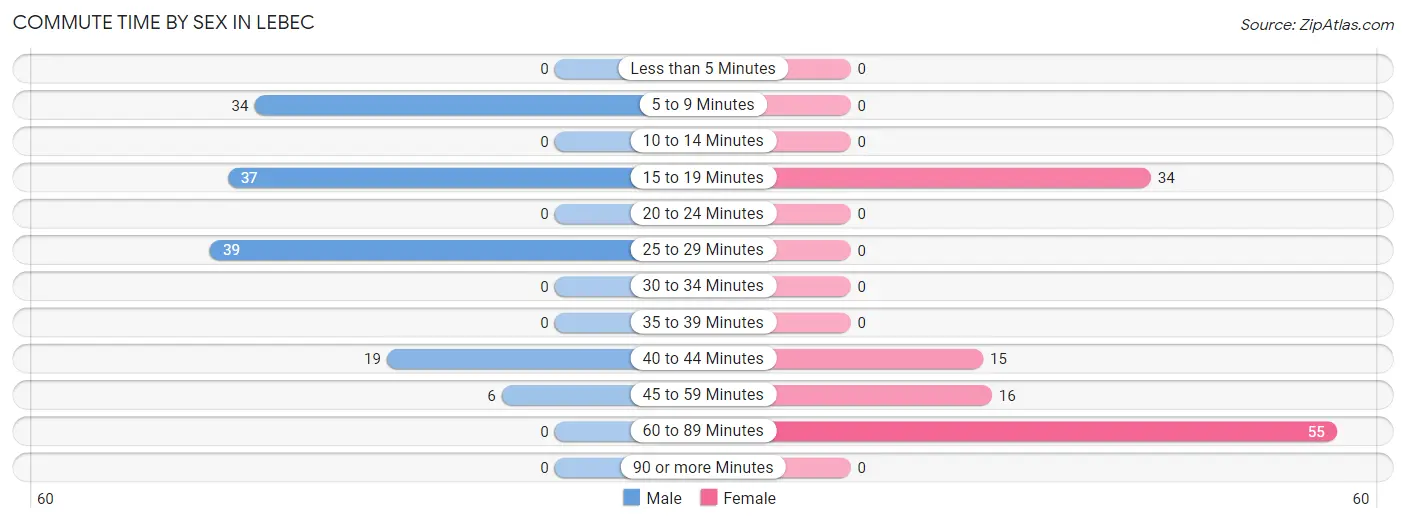
| Commute Time | Male | Female |
| Less than 5 Minutes | 0 (0.0%) | 0 (0.0%) |
| 5 to 9 Minutes | 34 (25.2%) | 0 (0.0%) |
| 10 to 14 Minutes | 0 (0.0%) | 0 (0.0%) |
| 15 to 19 Minutes | 37 (27.4%) | 34 (28.3%) |
| 20 to 24 Minutes | 0 (0.0%) | 0 (0.0%) |
| 25 to 29 Minutes | 39 (28.9%) | 0 (0.0%) |
| 30 to 34 Minutes | 0 (0.0%) | 0 (0.0%) |
| 35 to 39 Minutes | 0 (0.0%) | 0 (0.0%) |
| 40 to 44 Minutes | 19 (14.1%) | 15 (12.5%) |
| 45 to 59 Minutes | 6 (4.4%) | 16 (13.3%) |
| 60 to 89 Minutes | 0 (0.0%) | 55 (45.8%) |
| 90 or more Minutes | 0 (0.0%) | 0 (0.0%) |
Time of Departure to Work by Sex in Lebec
The most frequent times of departure to work in Lebec are 10:00 AM to 10:59 AM (39, 28.9%) for males and 8:30 AM to 8:59 AM (55, 45.8%) for females.
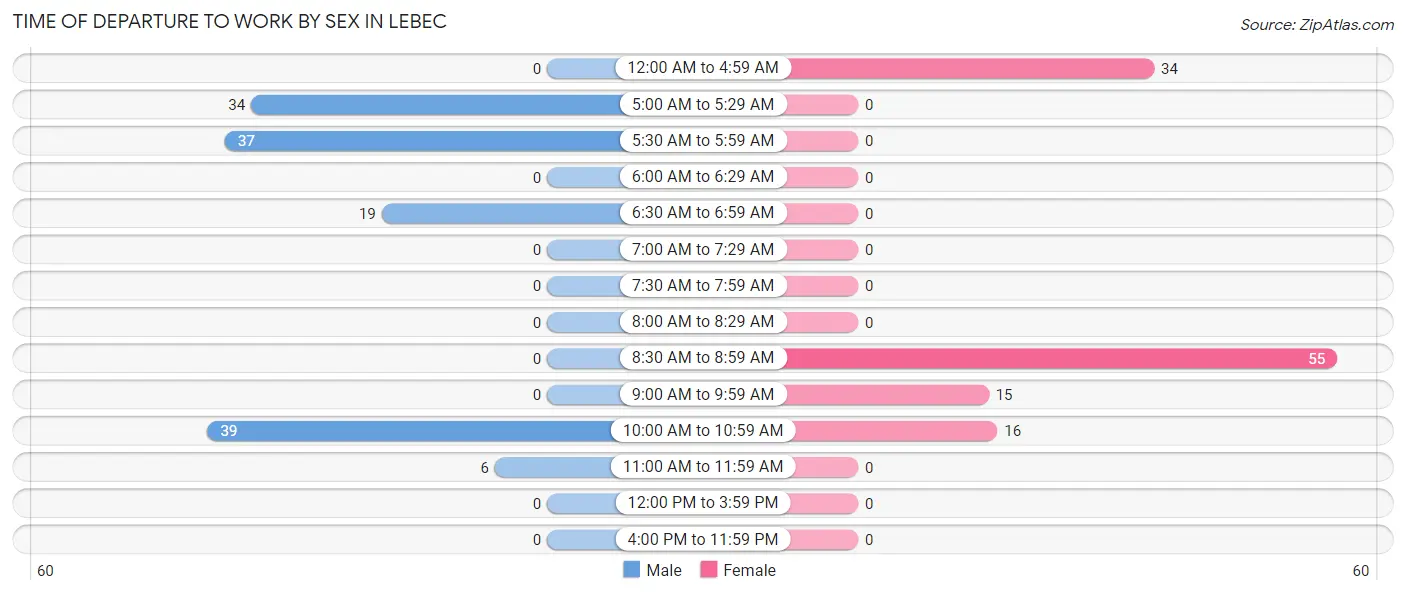
| Time of Departure | Male | Female |
| 12:00 AM to 4:59 AM | 0 (0.0%) | 34 (28.3%) |
| 5:00 AM to 5:29 AM | 34 (25.2%) | 0 (0.0%) |
| 5:30 AM to 5:59 AM | 37 (27.4%) | 0 (0.0%) |
| 6:00 AM to 6:29 AM | 0 (0.0%) | 0 (0.0%) |
| 6:30 AM to 6:59 AM | 19 (14.1%) | 0 (0.0%) |
| 7:00 AM to 7:29 AM | 0 (0.0%) | 0 (0.0%) |
| 7:30 AM to 7:59 AM | 0 (0.0%) | 0 (0.0%) |
| 8:00 AM to 8:29 AM | 0 (0.0%) | 0 (0.0%) |
| 8:30 AM to 8:59 AM | 0 (0.0%) | 55 (45.8%) |
| 9:00 AM to 9:59 AM | 0 (0.0%) | 15 (12.5%) |
| 10:00 AM to 10:59 AM | 39 (28.9%) | 16 (13.3%) |
| 11:00 AM to 11:59 AM | 6 (4.4%) | 0 (0.0%) |
| 12:00 PM to 3:59 PM | 0 (0.0%) | 0 (0.0%) |
| 4:00 PM to 11:59 PM | 0 (0.0%) | 0 (0.0%) |
| Total | 135 (100.0%) | 120 (100.0%) |
Housing Occupancy in Lebec
Occupancy by Ownership in Lebec
Of the total 481 dwellings in Lebec, owner-occupied units account for 268 (55.7%), while renter-occupied units make up 213 (44.3%).
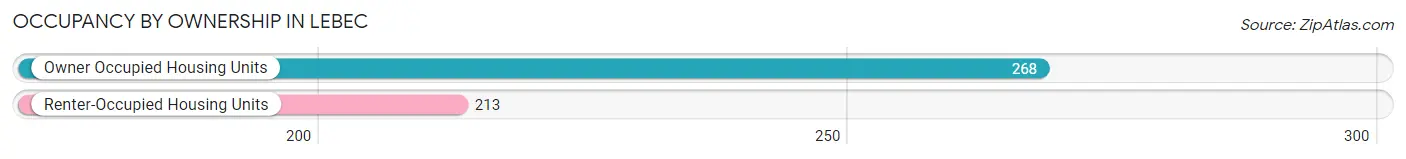
| Occupancy | # Housing Units | % Housing Units |
| Owner Occupied Housing Units | 268 | 55.7% |
| Renter-Occupied Housing Units | 213 | 44.3% |
| Total Occupied Housing Units | 481 | 100.0% |
Occupancy by Household Size in Lebec
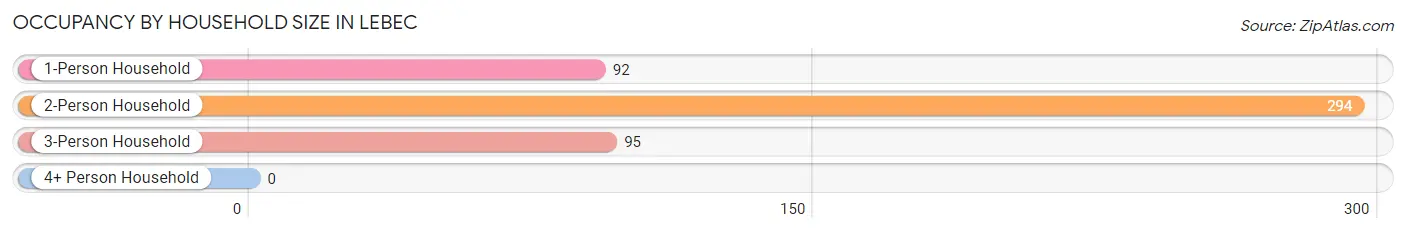
| Household Size | # Housing Units | % Housing Units |
| 1-Person Household | 92 | 19.1% |
| 2-Person Household | 294 | 61.1% |
| 3-Person Household | 95 | 19.8% |
| 4+ Person Household | 0 | 0.0% |
| Total Housing Units | 481 | 100.0% |
Occupancy by Ownership by Household Size in Lebec
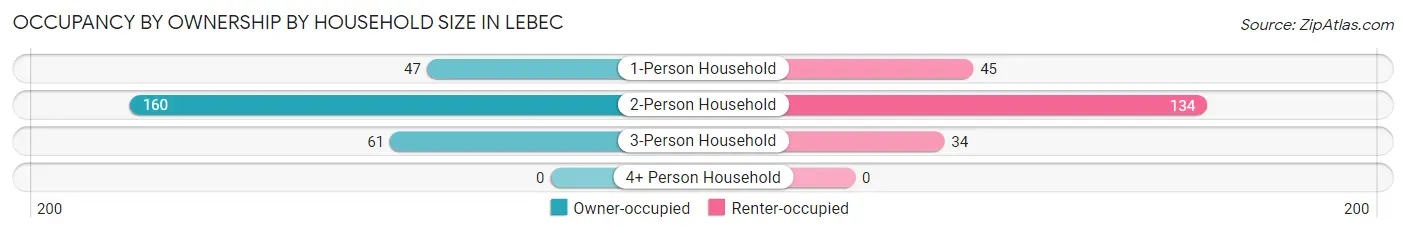
| Household Size | Owner-occupied | Renter-occupied |
| 1-Person Household | 47 (51.1%) | 45 (48.9%) |
| 2-Person Household | 160 (54.4%) | 134 (45.6%) |
| 3-Person Household | 61 (64.2%) | 34 (35.8%) |
| 4+ Person Household | 0 (0.0%) | 0 (0.0%) |
| Total Housing Units | 268 (55.7%) | 213 (44.3%) |
Occupancy by Educational Attainment in Lebec
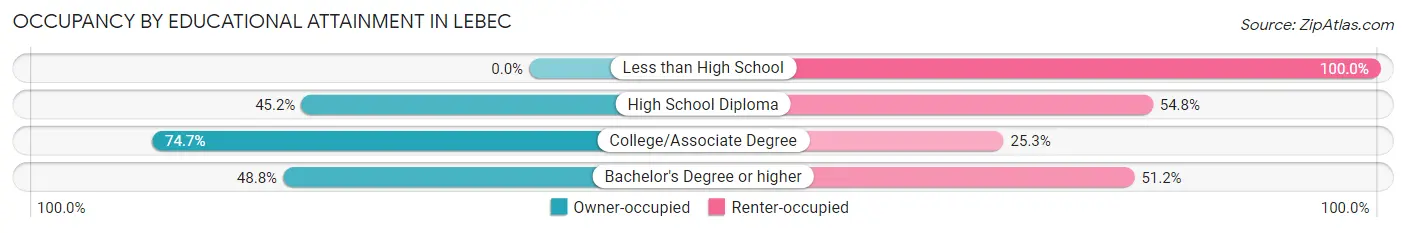
| Household Size | Owner-occupied | Renter-occupied |
| Less than High School | 0 (0.0%) | 26 (100.0%) |
| High School Diploma | 28 (45.2%) | 34 (54.8%) |
| College/Associate Degree | 139 (74.7%) | 47 (25.3%) |
| Bachelor's Degree or higher | 101 (48.8%) | 106 (51.2%) |
Occupancy by Age of Householder in Lebec
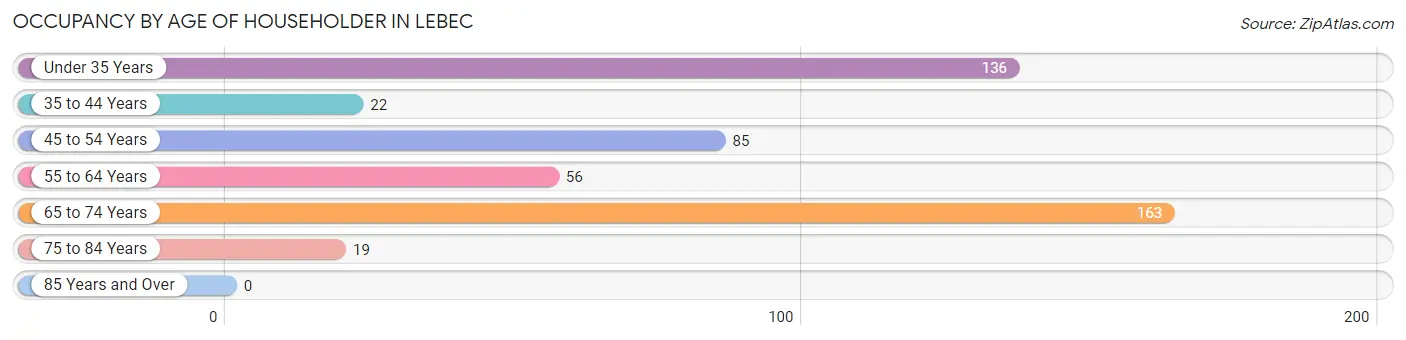
| Age Bracket | # Households | % Households |
| Under 35 Years | 136 | 28.3% |
| 35 to 44 Years | 22 | 4.6% |
| 45 to 54 Years | 85 | 17.7% |
| 55 to 64 Years | 56 | 11.6% |
| 65 to 74 Years | 163 | 33.9% |
| 75 to 84 Years | 19 | 4.0% |
| 85 Years and Over | 0 | 0.0% |
| Total | 481 | 100.0% |
Housing Finances in Lebec
Median Income by Occupancy in Lebec
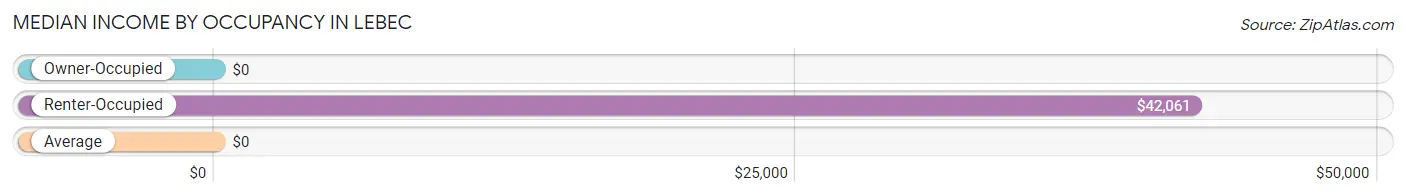
| Occupancy Type | # Households | Median Income |
| Owner-Occupied | 268 (55.7%) | $0 |
| Renter-Occupied | 213 (44.3%) | $42,061 |
| Average | 481 (100.0%) | $0 |
Occupancy by Householder Income Bracket in Lebec
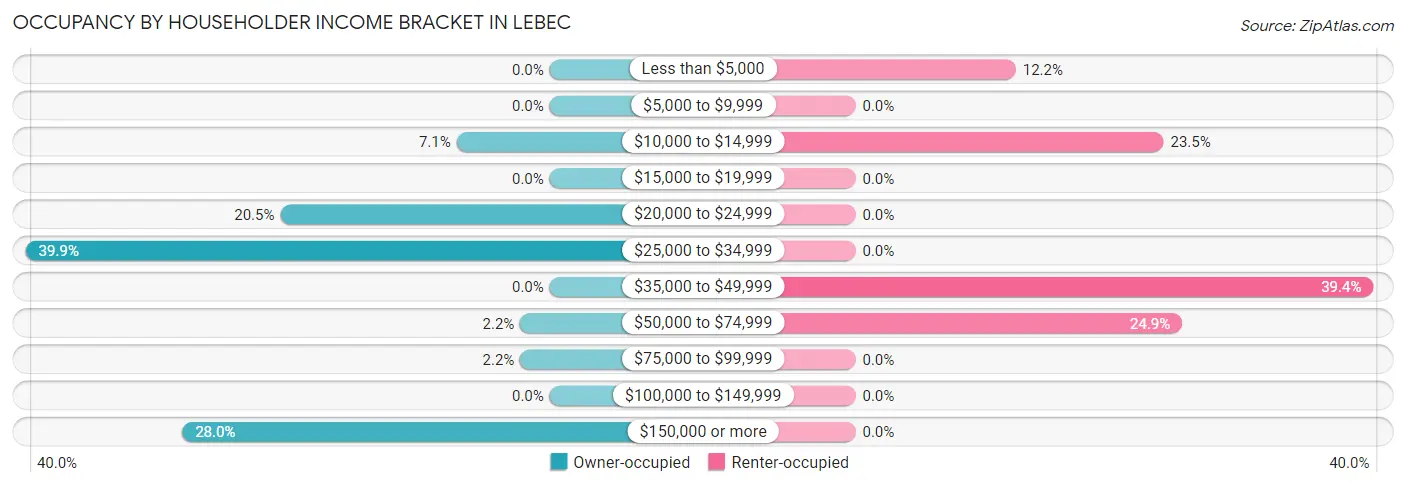
| Income Bracket | Owner-occupied | Renter-occupied |
| Less than $5,000 | 0 (0.0%) | 26 (12.2%) |
| $5,000 to $9,999 | 0 (0.0%) | 0 (0.0%) |
| $10,000 to $14,999 | 19 (7.1%) | 50 (23.5%) |
| $15,000 to $19,999 | 0 (0.0%) | 0 (0.0%) |
| $20,000 to $24,999 | 55 (20.5%) | 0 (0.0%) |
| $25,000 to $34,999 | 107 (39.9%) | 0 (0.0%) |
| $35,000 to $49,999 | 0 (0.0%) | 84 (39.4%) |
| $50,000 to $74,999 | 6 (2.2%) | 53 (24.9%) |
| $75,000 to $99,999 | 6 (2.2%) | 0 (0.0%) |
| $100,000 to $149,999 | 0 (0.0%) | 0 (0.0%) |
| $150,000 or more | 75 (28.0%) | 0 (0.0%) |
| Total | 268 (100.0%) | 213 (100.0%) |
Monthly Housing Cost Tiers in Lebec
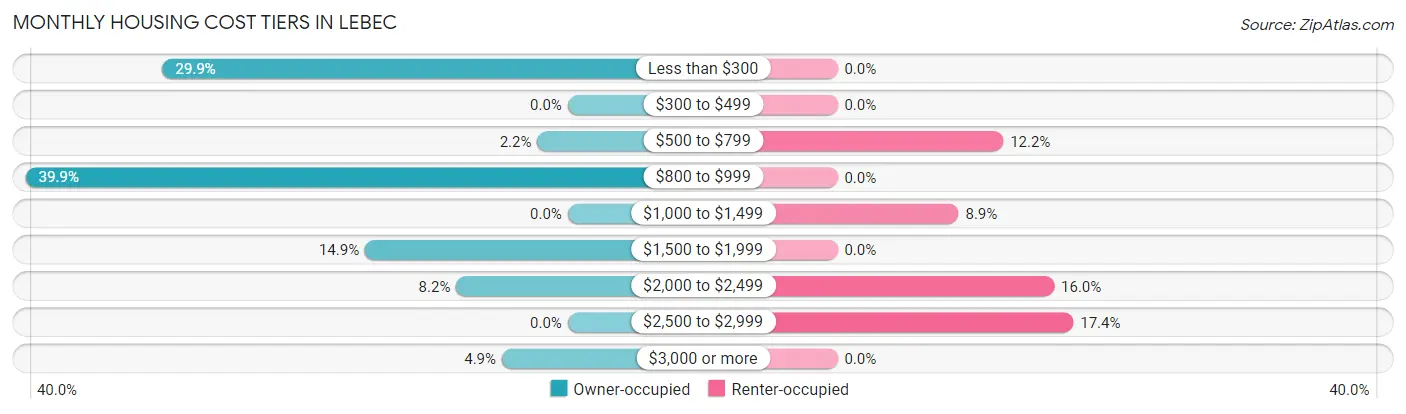
| Monthly Cost | Owner-occupied | Renter-occupied |
| Less than $300 | 80 (29.8%) | 0 (0.0%) |
| $300 to $499 | 0 (0.0%) | 0 (0.0%) |
| $500 to $799 | 6 (2.2%) | 26 (12.2%) |
| $800 to $999 | 107 (39.9%) | 0 (0.0%) |
| $1,000 to $1,499 | 0 (0.0%) | 19 (8.9%) |
| $1,500 to $1,999 | 40 (14.9%) | 0 (0.0%) |
| $2,000 to $2,499 | 22 (8.2%) | 34 (16.0%) |
| $2,500 to $2,999 | 0 (0.0%) | 37 (17.4%) |
| $3,000 or more | 13 (4.9%) | 0 (0.0%) |
| Total | 268 (100.0%) | 213 (100.0%) |
Physical Housing Characteristics in Lebec
Housing Structures in Lebec
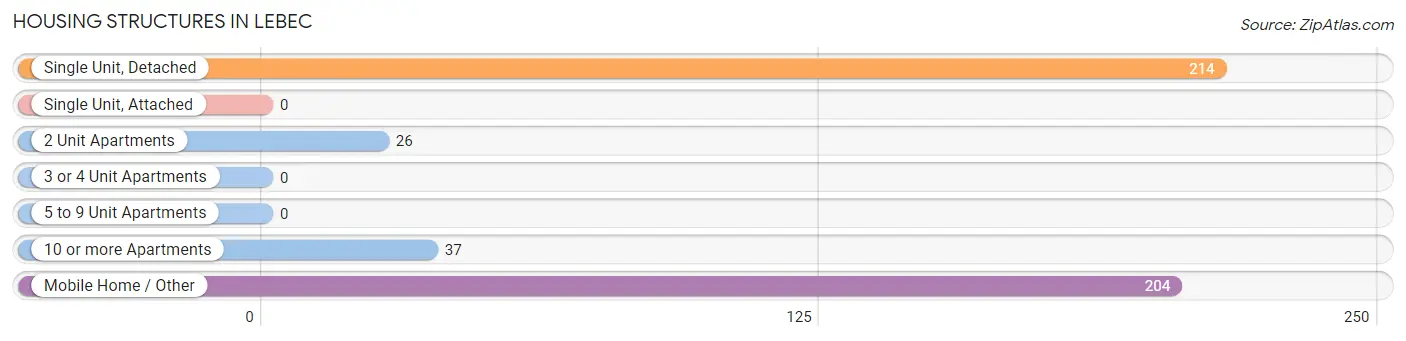
| Structure Type | # Housing Units | % Housing Units |
| Single Unit, Detached | 214 | 44.5% |
| Single Unit, Attached | 0 | 0.0% |
| 2 Unit Apartments | 26 | 5.4% |
| 3 or 4 Unit Apartments | 0 | 0.0% |
| 5 to 9 Unit Apartments | 0 | 0.0% |
| 10 or more Apartments | 37 | 7.7% |
| Mobile Home / Other | 204 | 42.4% |
| Total | 481 | 100.0% |
Housing Structures by Occupancy in Lebec
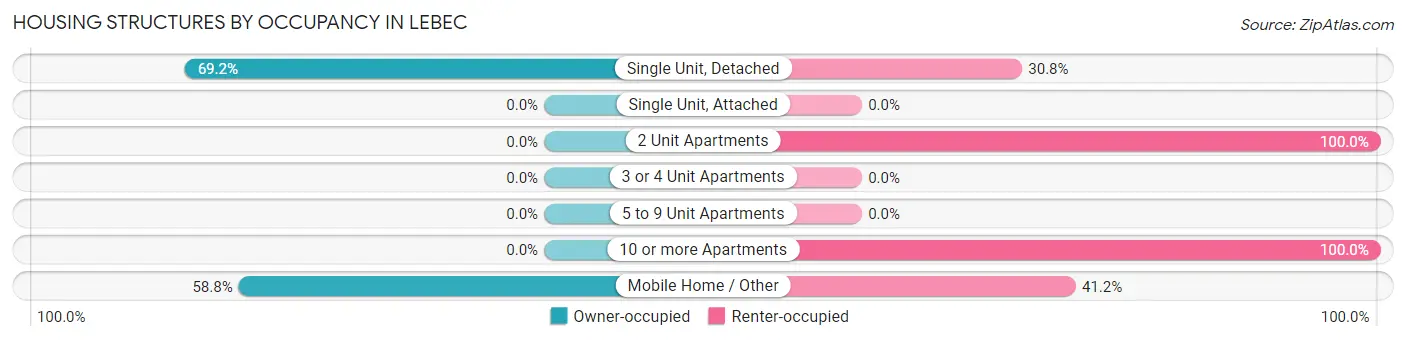
| Structure Type | Owner-occupied | Renter-occupied |
| Single Unit, Detached | 148 (69.2%) | 66 (30.8%) |
| Single Unit, Attached | 0 (0.0%) | 0 (0.0%) |
| 2 Unit Apartments | 0 (0.0%) | 26 (100.0%) |
| 3 or 4 Unit Apartments | 0 (0.0%) | 0 (0.0%) |
| 5 to 9 Unit Apartments | 0 (0.0%) | 0 (0.0%) |
| 10 or more Apartments | 0 (0.0%) | 37 (100.0%) |
| Mobile Home / Other | 120 (58.8%) | 84 (41.2%) |
| Total | 268 (55.7%) | 213 (44.3%) |
Housing Structures by Number of Rooms in Lebec
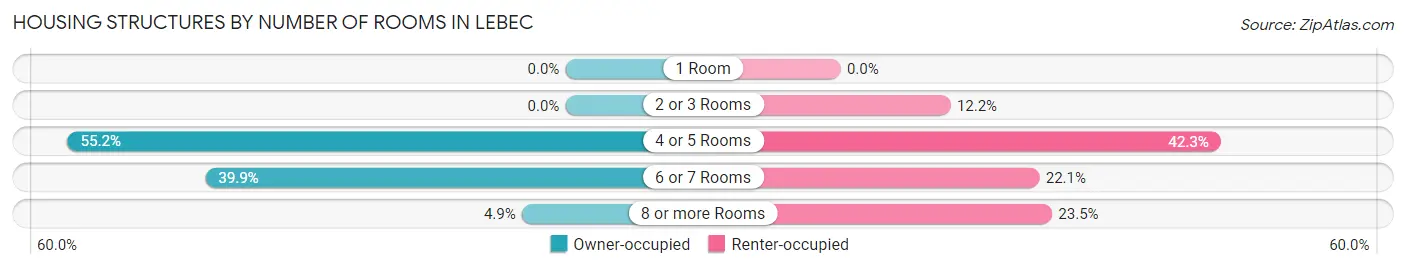
| Number of Rooms | Owner-occupied | Renter-occupied |
| 1 Room | 0 (0.0%) | 0 (0.0%) |
| 2 or 3 Rooms | 0 (0.0%) | 26 (12.2%) |
| 4 or 5 Rooms | 148 (55.2%) | 90 (42.2%) |
| 6 or 7 Rooms | 107 (39.9%) | 47 (22.1%) |
| 8 or more Rooms | 13 (4.9%) | 50 (23.5%) |
| Total | 268 (100.0%) | 213 (100.0%) |
Housing Structure by Heating Type in Lebec
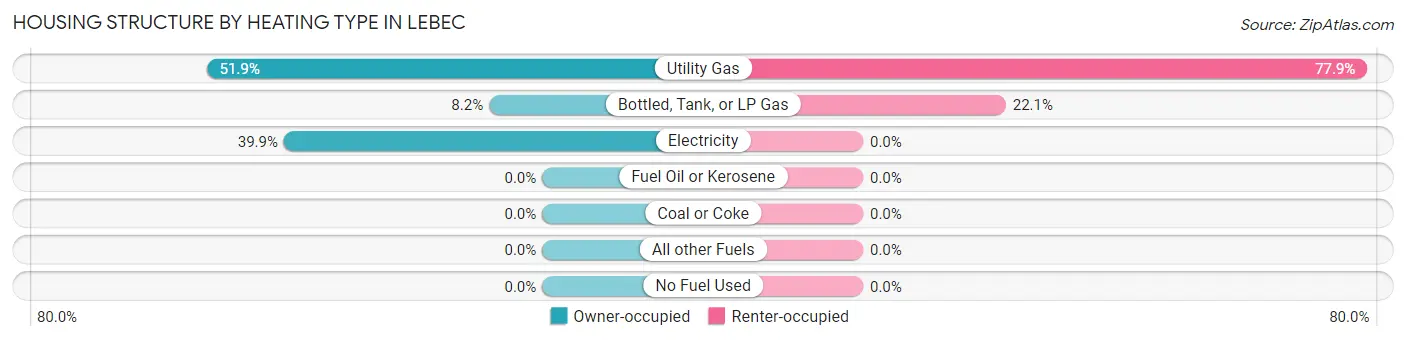
| Heating Type | Owner-occupied | Renter-occupied |
| Utility Gas | 139 (51.9%) | 166 (77.9%) |
| Bottled, Tank, or LP Gas | 22 (8.2%) | 47 (22.1%) |
| Electricity | 107 (39.9%) | 0 (0.0%) |
| Fuel Oil or Kerosene | 0 (0.0%) | 0 (0.0%) |
| Coal or Coke | 0 (0.0%) | 0 (0.0%) |
| All other Fuels | 0 (0.0%) | 0 (0.0%) |
| No Fuel Used | 0 (0.0%) | 0 (0.0%) |
| Total | 268 (100.0%) | 213 (100.0%) |
Household Vehicle Usage in Lebec
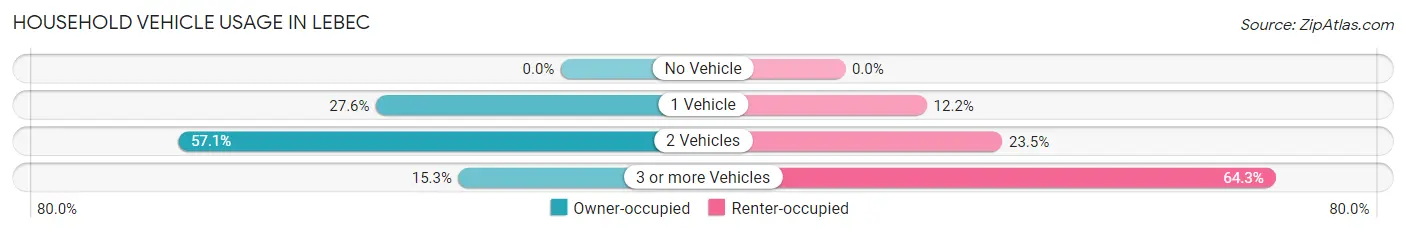
| Vehicles per Household | Owner-occupied | Renter-occupied |
| No Vehicle | 0 (0.0%) | 0 (0.0%) |
| 1 Vehicle | 74 (27.6%) | 26 (12.2%) |
| 2 Vehicles | 153 (57.1%) | 50 (23.5%) |
| 3 or more Vehicles | 41 (15.3%) | 137 (64.3%) |
| Total | 268 (100.0%) | 213 (100.0%) |
Real Estate & Mortgages in Lebec
Real Estate and Mortgage Overview in Lebec
| Characteristic | Without Mortgage | With Mortgage |
| Housing Units | 193 | 75 |
| Median Property Value | - | - |
| Median Household Income | $25,526 | $75 |
| Monthly Housing Costs | - | - |
| Real Estate Taxes | - | - |
Property Value by Mortgage Status in Lebec
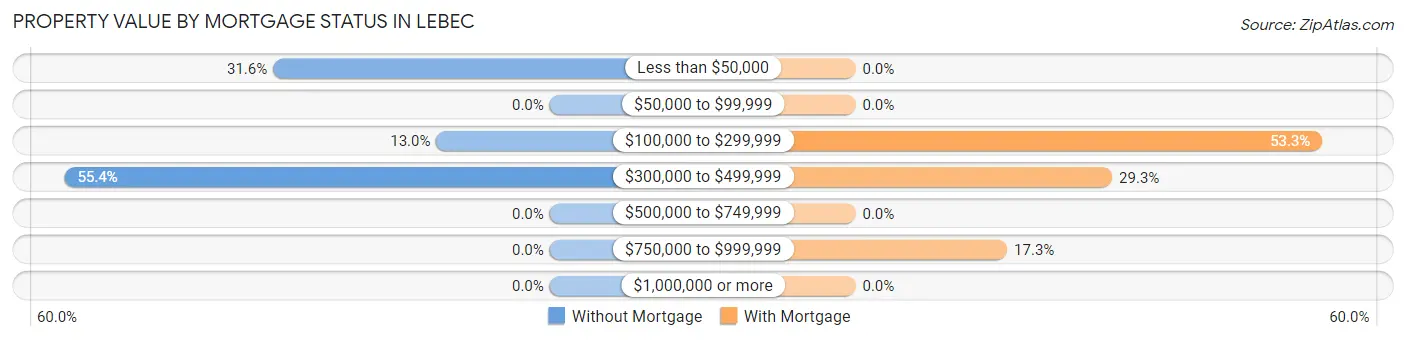
| Property Value | Without Mortgage | With Mortgage |
| Less than $50,000 | 61 (31.6%) | 0 (0.0%) |
| $50,000 to $99,999 | 0 (0.0%) | 0 (0.0%) |
| $100,000 to $299,999 | 25 (13.0%) | 40 (53.3%) |
| $300,000 to $499,999 | 107 (55.4%) | 22 (29.3%) |
| $500,000 to $749,999 | 0 (0.0%) | 0 (0.0%) |
| $750,000 to $999,999 | 0 (0.0%) | 13 (17.3%) |
| $1,000,000 or more | 0 (0.0%) | 0 (0.0%) |
| Total | 193 (100.0%) | 75 (100.0%) |
Household Income by Mortgage Status in Lebec
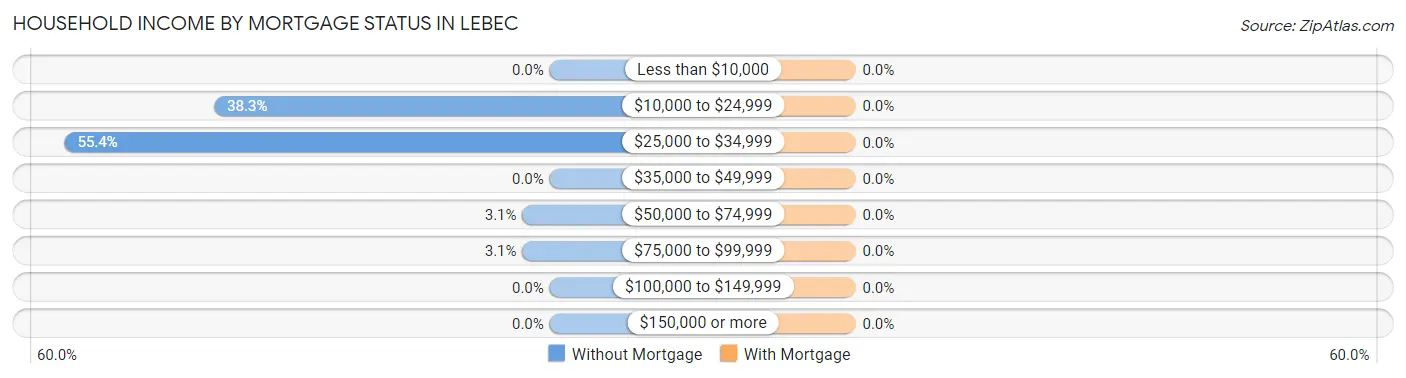
| Household Income | Without Mortgage | With Mortgage |
| Less than $10,000 | 0 (0.0%) | 0 (0.0%) |
| $10,000 to $24,999 | 74 (38.3%) | 0 (0.0%) |
| $25,000 to $34,999 | 107 (55.4%) | 0 (0.0%) |
| $35,000 to $49,999 | 0 (0.0%) | 0 (0.0%) |
| $50,000 to $74,999 | 6 (3.1%) | 0 (0.0%) |
| $75,000 to $99,999 | 6 (3.1%) | 0 (0.0%) |
| $100,000 to $149,999 | 0 (0.0%) | 0 (0.0%) |
| $150,000 or more | 0 (0.0%) | 0 (0.0%) |
| Total | 193 (100.0%) | 75 (100.0%) |
Property Value to Household Income Ratio in Lebec
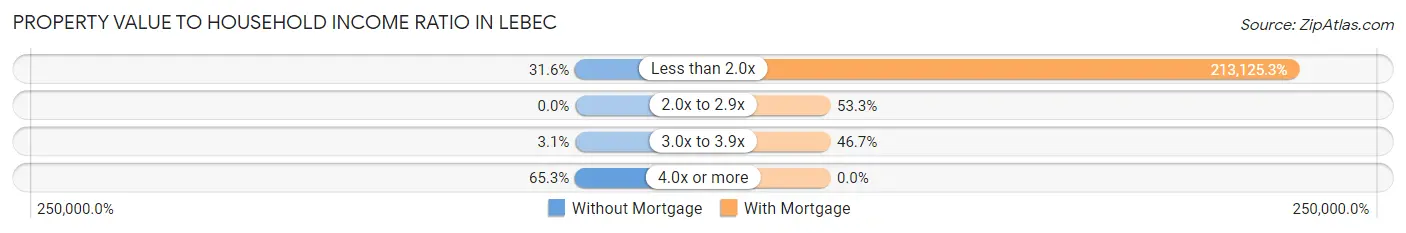
| Value-to-Income Ratio | Without Mortgage | With Mortgage |
| Less than 2.0x | 61 (31.6%) | 159,844 (213,125.3%) |
| 2.0x to 2.9x | 0 (0.0%) | 40 (53.3%) |
| 3.0x to 3.9x | 6 (3.1%) | 35 (46.7%) |
| 4.0x or more | 126 (65.3%) | 0 (0.0%) |
| Total | 193 (100.0%) | 75 (100.0%) |
Real Estate Taxes by Mortgage Status in Lebec
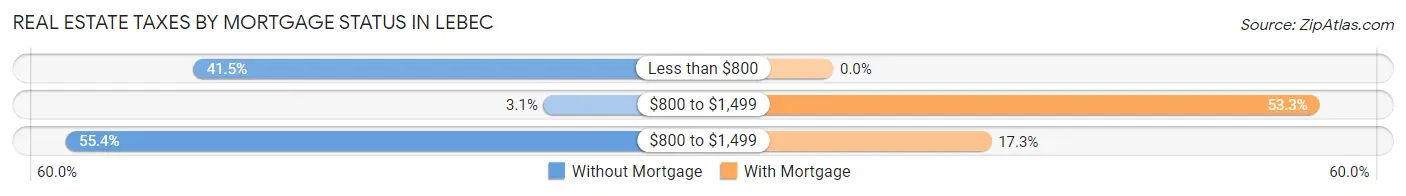
| Property Taxes | Without Mortgage | With Mortgage |
| Less than $800 | 80 (41.4%) | 0 (0.0%) |
| $800 to $1,499 | 6 (3.1%) | 40 (53.3%) |
| $800 to $1,499 | 107 (55.4%) | 13 (17.3%) |
| Total | 193 (100.0%) | 75 (100.0%) |
Health & Disability in Lebec
Health Insurance Coverage by Age in Lebec
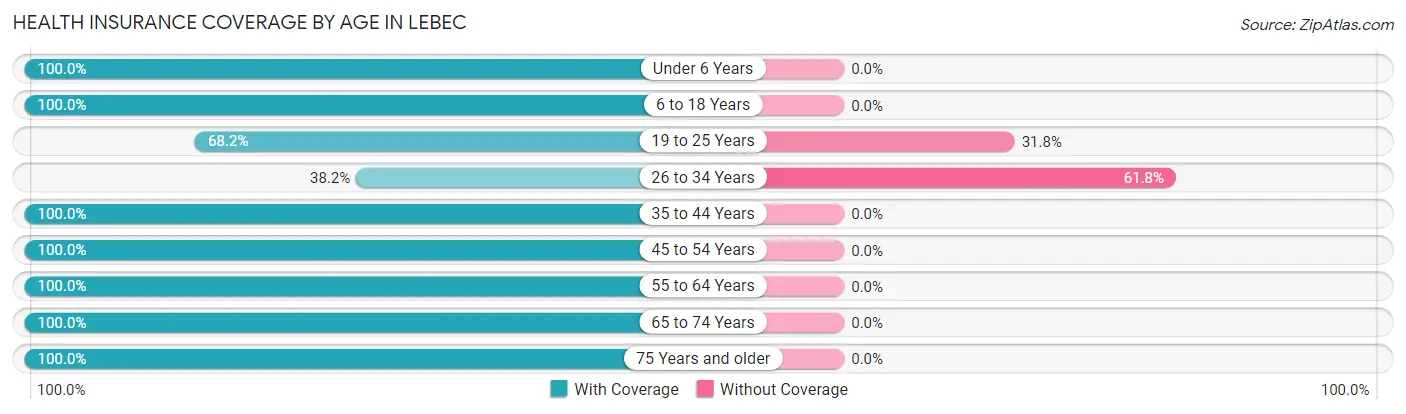
| Age Bracket | With Coverage | Without Coverage |
| Under 6 Years | 54 (100.0%) | 0 (0.0%) |
| 6 to 18 Years | 56 (100.0%) | 0 (0.0%) |
| 19 to 25 Years | 73 (68.2%) | 34 (31.8%) |
| 26 to 34 Years | 63 (38.2%) | 102 (61.8%) |
| 35 to 44 Years | 57 (100.0%) | 0 (0.0%) |
| 45 to 54 Years | 102 (100.0%) | 0 (0.0%) |
| 55 to 64 Years | 107 (100.0%) | 0 (0.0%) |
| 65 to 74 Years | 246 (100.0%) | 0 (0.0%) |
| 75 Years and older | 19 (100.0%) | 0 (0.0%) |
| Total | 777 (85.1%) | 136 (14.9%) |
Health Insurance Coverage by Citizenship Status in Lebec
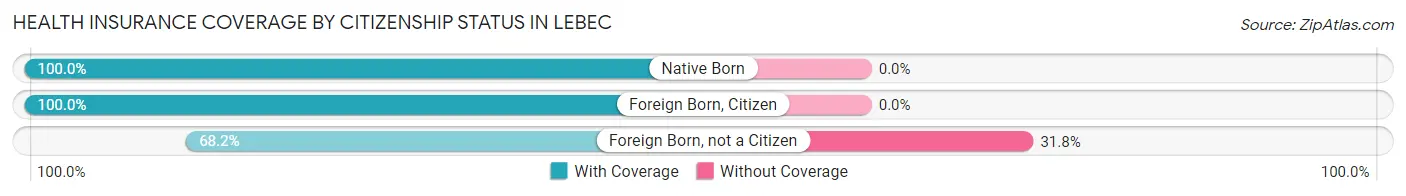
| Citizenship Status | With Coverage | Without Coverage |
| Native Born | 54 (100.0%) | 0 (0.0%) |
| Foreign Born, Citizen | 56 (100.0%) | 0 (0.0%) |
| Foreign Born, not a Citizen | 73 (68.2%) | 34 (31.8%) |
Health Insurance Coverage by Household Income in Lebec
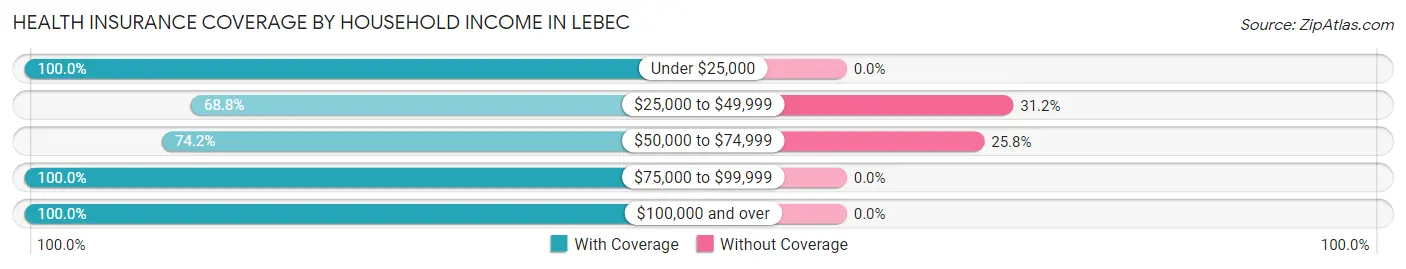
| Household Income | With Coverage | Without Coverage |
| Under $25,000 | 306 (100.0%) | 0 (0.0%) |
| $25,000 to $49,999 | 225 (68.8%) | 102 (31.2%) |
| $50,000 to $74,999 | 98 (74.2%) | 34 (25.8%) |
| $75,000 to $99,999 | 21 (100.0%) | 0 (0.0%) |
| $100,000 and over | 126 (100.0%) | 0 (0.0%) |
Public vs Private Health Insurance Coverage by Age in Lebec
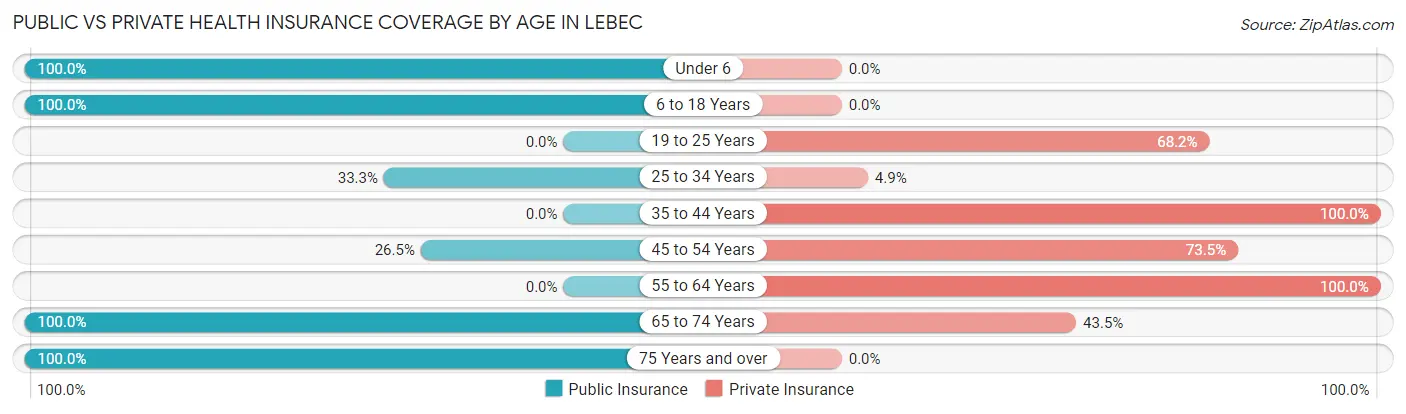
| Age Bracket | Public Insurance | Private Insurance |
| Under 6 | 54 (100.0%) | 0 (0.0%) |
| 6 to 18 Years | 56 (100.0%) | 0 (0.0%) |
| 19 to 25 Years | 0 (0.0%) | 73 (68.2%) |
| 25 to 34 Years | 55 (33.3%) | 8 (4.9%) |
| 35 to 44 Years | 0 (0.0%) | 57 (100.0%) |
| 45 to 54 Years | 27 (26.5%) | 75 (73.5%) |
| 55 to 64 Years | 0 (0.0%) | 107 (100.0%) |
| 65 to 74 Years | 246 (100.0%) | 107 (43.5%) |
| 75 Years and over | 19 (100.0%) | 0 (0.0%) |
| Total | 457 (50.0%) | 427 (46.8%) |
Disability Status by Sex by Age in Lebec
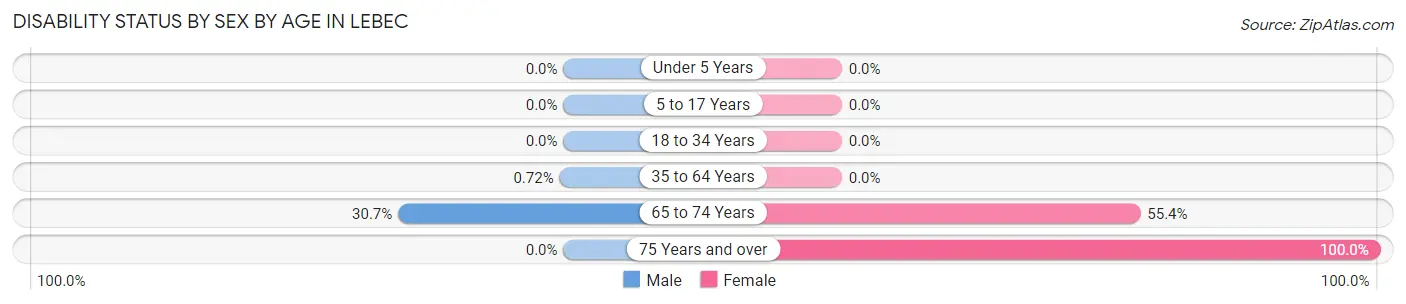
| Age Bracket | Male | Female |
| Under 5 Years | 0 (0.0%) | 0 (0.0%) |
| 5 to 17 Years | 0 (0.0%) | 0 (0.0%) |
| 18 to 34 Years | 0 (0.0%) | 0 (0.0%) |
| 35 to 64 Years | 1 (0.7%) | 0 (0.0%) |
| 65 to 74 Years | 50 (30.7%) | 46 (55.4%) |
| 75 Years and over | 0 (0.0%) | 19 (100.0%) |
Disability Class by Sex by Age in Lebec
Disability Class: Hearing Difficulty
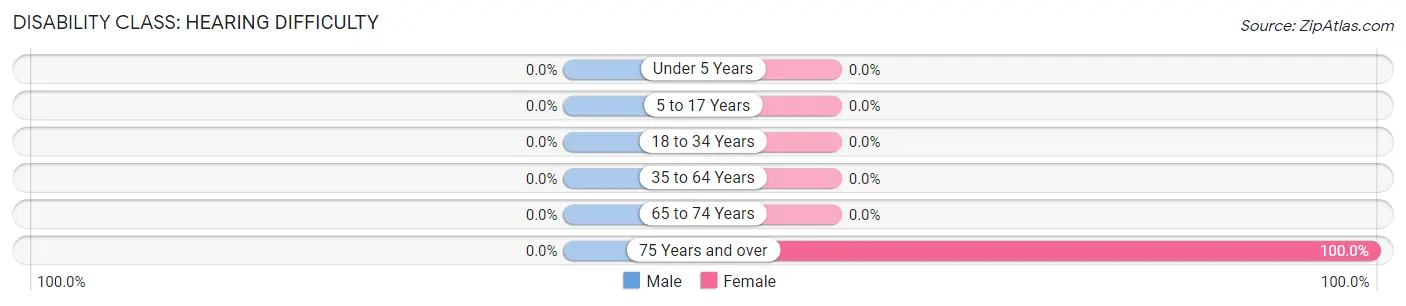
| Age Bracket | Male | Female |
| Under 5 Years | 0 (0.0%) | 0 (0.0%) |
| 5 to 17 Years | 0 (0.0%) | 0 (0.0%) |
| 18 to 34 Years | 0 (0.0%) | 0 (0.0%) |
| 35 to 64 Years | 0 (0.0%) | 0 (0.0%) |
| 65 to 74 Years | 0 (0.0%) | 0 (0.0%) |
| 75 Years and over | 0 (0.0%) | 19 (100.0%) |
Disability Class: Vision Difficulty
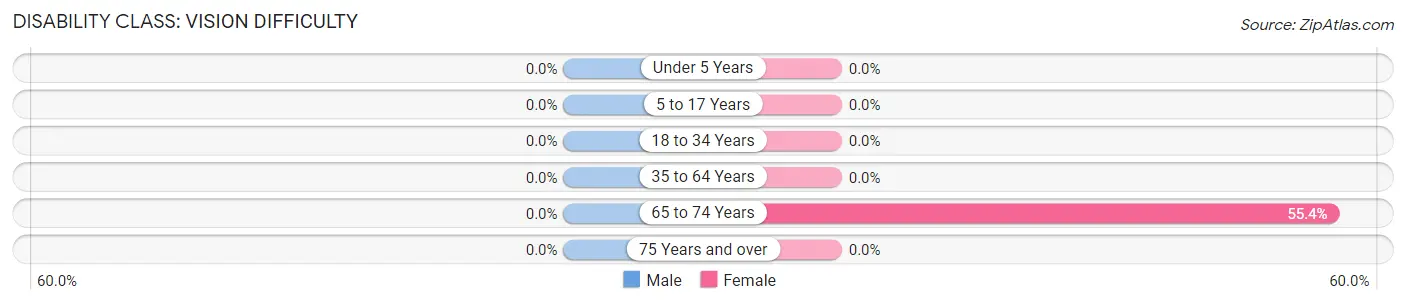
| Age Bracket | Male | Female |
| Under 5 Years | 0 (0.0%) | 0 (0.0%) |
| 5 to 17 Years | 0 (0.0%) | 0 (0.0%) |
| 18 to 34 Years | 0 (0.0%) | 0 (0.0%) |
| 35 to 64 Years | 0 (0.0%) | 0 (0.0%) |
| 65 to 74 Years | 0 (0.0%) | 46 (55.4%) |
| 75 Years and over | 0 (0.0%) | 0 (0.0%) |
Disability Class: Cognitive Difficulty
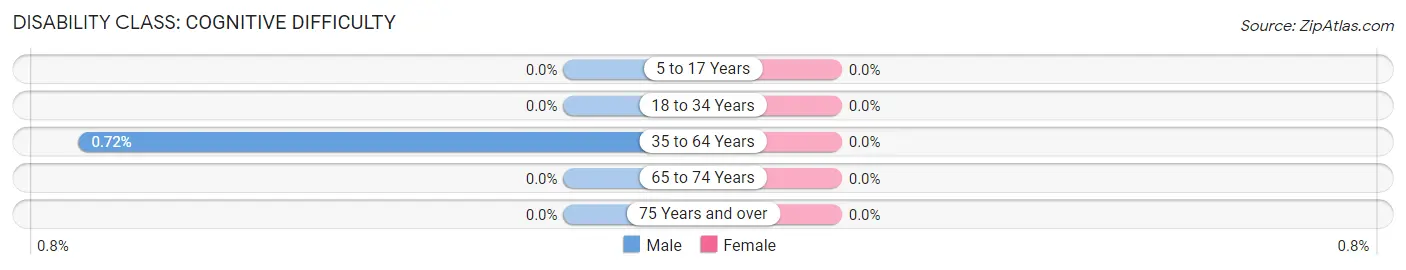
| Age Bracket | Male | Female |
| 5 to 17 Years | 0 (0.0%) | 0 (0.0%) |
| 18 to 34 Years | 0 (0.0%) | 0 (0.0%) |
| 35 to 64 Years | 1 (0.7%) | 0 (0.0%) |
| 65 to 74 Years | 0 (0.0%) | 0 (0.0%) |
| 75 Years and over | 0 (0.0%) | 0 (0.0%) |
Disability Class: Ambulatory Difficulty
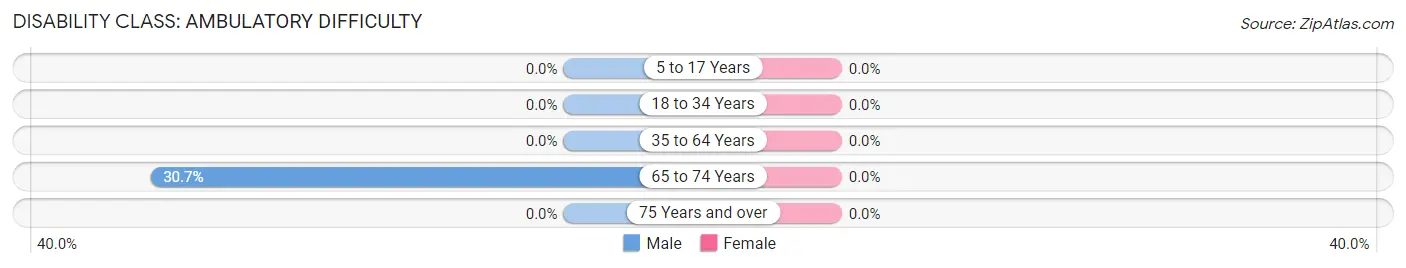
| Age Bracket | Male | Female |
| 5 to 17 Years | 0 (0.0%) | 0 (0.0%) |
| 18 to 34 Years | 0 (0.0%) | 0 (0.0%) |
| 35 to 64 Years | 0 (0.0%) | 0 (0.0%) |
| 65 to 74 Years | 50 (30.7%) | 0 (0.0%) |
| 75 Years and over | 0 (0.0%) | 0 (0.0%) |
Disability Class: Self-Care Difficulty
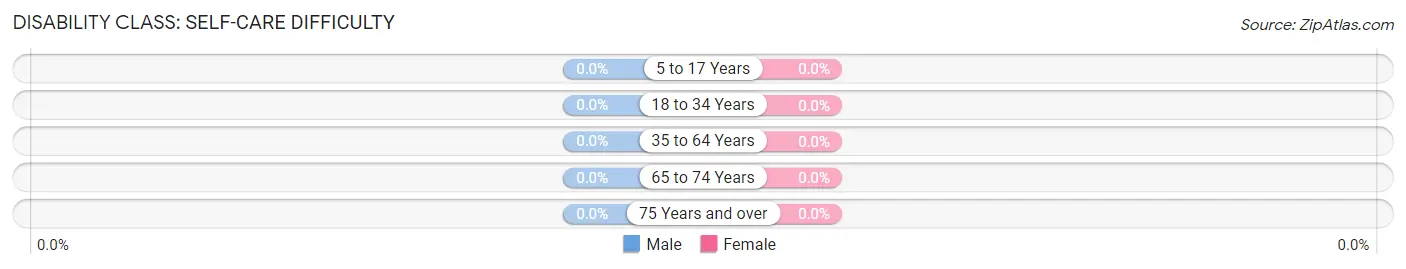
| Age Bracket | Male | Female |
| 5 to 17 Years | 0 (0.0%) | 0 (0.0%) |
| 18 to 34 Years | 0 (0.0%) | 0 (0.0%) |
| 35 to 64 Years | 0 (0.0%) | 0 (0.0%) |
| 65 to 74 Years | 0 (0.0%) | 0 (0.0%) |
| 75 Years and over | 0 (0.0%) | 0 (0.0%) |
Technology Access in Lebec
Computing Device Access in Lebec
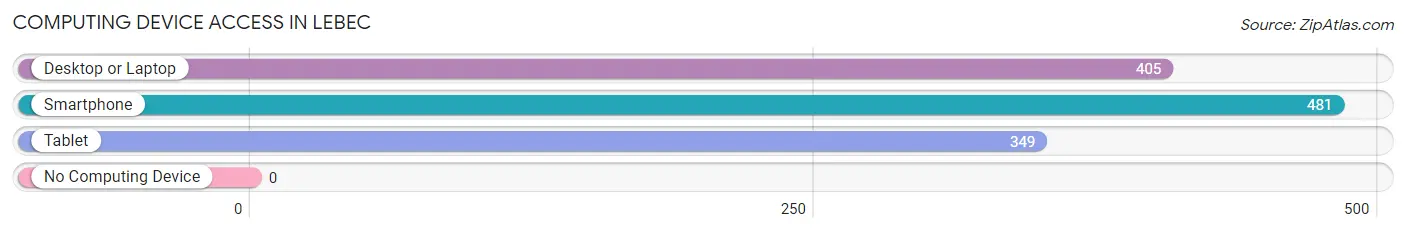
| Device Type | # Households | % Households |
| Desktop or Laptop | 405 | 84.2% |
| Smartphone | 481 | 100.0% |
| Tablet | 349 | 72.6% |
| No Computing Device | 0 | 0.0% |
| Total | 481 | 100.0% |
Internet Access in Lebec
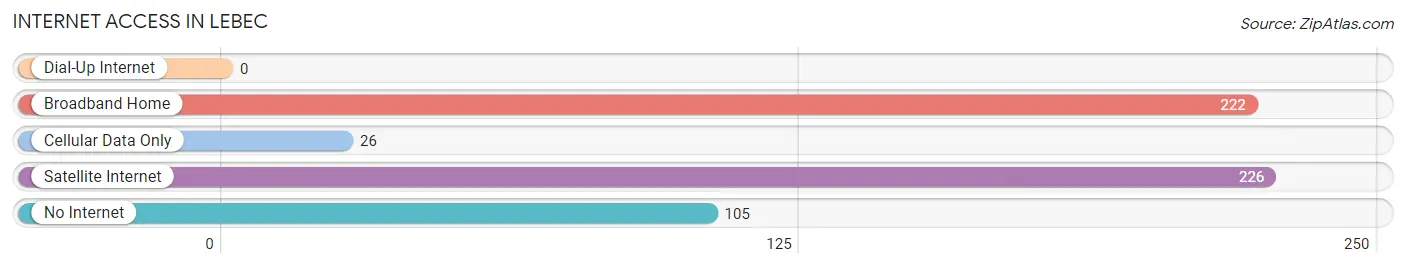
| Internet Type | # Households | % Households |
| Dial-Up Internet | 0 | 0.0% |
| Broadband Home | 222 | 46.2% |
| Cellular Data Only | 26 | 5.4% |
| Satellite Internet | 226 | 47.0% |
| No Internet | 105 | 21.8% |
| Total | 481 | 100.0% |
Lebec Summary
Lebec is a small unincorporated community located in Kern County, California, United States. It is situated in the Tehachapi Mountains, at an elevation of 4,000 feet (1,219 m). The population was 1,468 at the 2010 census.
History
Lebec was founded in 1843 by a group of settlers led by John Lebec, a French-Canadian trapper. The settlement was originally called Fort Tejon, but was later renamed Lebec in honor of its founder. The town was a stop on the Butterfield Overland Mail route, and was the site of a stagecoach station.
In 1854, the Lebec Hotel was built, and the town became a popular stop for travelers. The hotel was destroyed by fire in 1876, but was rebuilt and is still in operation today.
In 1876, the Southern Pacific Railroad built a line through the area, connecting Lebec to Los Angeles. This made the town a popular stop for travelers and tourists.
Geography
Lebec is located in the Tehachapi Mountains, at an elevation of 4,000 feet (1,219 m). The town is situated on the eastern side of the mountain range, near the San Emigdio Mountains. The town is located approximately 40 miles (64 km) north of Los Angeles, and is accessible via Interstate 5.
The climate in Lebec is semi-arid, with hot summers and cool winters. The average annual temperature is 64°F (18°C), and the average annual precipitation is 11.5 inches (29 cm).
Economy
Lebec is primarily a rural community, and the economy is based on agriculture and tourism. The town is home to several wineries, and is a popular destination for wine tasting.
The town is also home to a number of small businesses, including restaurants, shops, and lodging. The town is also home to a number of small manufacturing companies, including a furniture factory and a metal fabrication plant.
Demographics
As of the 2010 census, there were 1,468 people, 545 households, and 393 families residing in Lebec. The population density was 545.3 people per square mile (210.9/km2). The racial makeup of the town was 79.2% White, 0.7% African American, 0.7% Native American, 0.7% Asian, 0.1% Pacific Islander, 15.2% from other races, and 3.5% from two or more races. Hispanic or Latino of any race were 28.2% of the population.
The median income for a household in Lebec was $41,250, and the median income for a family was $45,000. Males had a median income of $35,000 versus $25,000 for females. The per capita income for the town was $17,845. About 11.2% of families and 14.2% of the population were below the poverty line, including 18.2% of those under age 18 and 8.3% of those age 65 or over.
Common Questions
What is Per Capita Income in Lebec?
Per Capita income in Lebec is $31,407.
What is the Median Family Income in Lebec?
Median Family Income in Lebec is $26,694.
What is Inequality or Gini Index in Lebec?
Inequality or Gini Index in Lebec is 0.52.
What is the Total Population of Lebec?
Total Population of Lebec is 913.
What is the Total Male Population of Lebec?
Total Male Population of Lebec is 477.
What is the Total Female Population of Lebec?
Total Female Population of Lebec is 436.
What is the Ratio of Males per 100 Females in Lebec?
There are 109.40 Males per 100 Females in Lebec.
What is the Ratio of Females per 100 Males in Lebec?
There are 91.40 Females per 100 Males in Lebec.
What is the Median Population Age in Lebec?
Median Population Age in Lebec is 46.7 Years.
What is the Average Family Size in Lebec
Average Family Size in Lebec is 2.0 People.
What is the Average Household Size in Lebec
Average Household Size in Lebec is 1.9 People.
How Large is the Labor Force in Lebec?
There are 420 People in the Labor Forcein in Lebec.
What is the Percentage of People in the Labor Force in Lebec?
52.3% of People are in the Labor Force in Lebec.
What is the Unemployment Rate in Lebec?
Unemployment Rate in Lebec is 13.6%.