Cities with the Highest Poverty Level Among Children Under the Age of 5 in Illinois
RELATED REPORTS & OPTIONS
Highest Poverty | Child 0-5
Illinois
Compare Cities
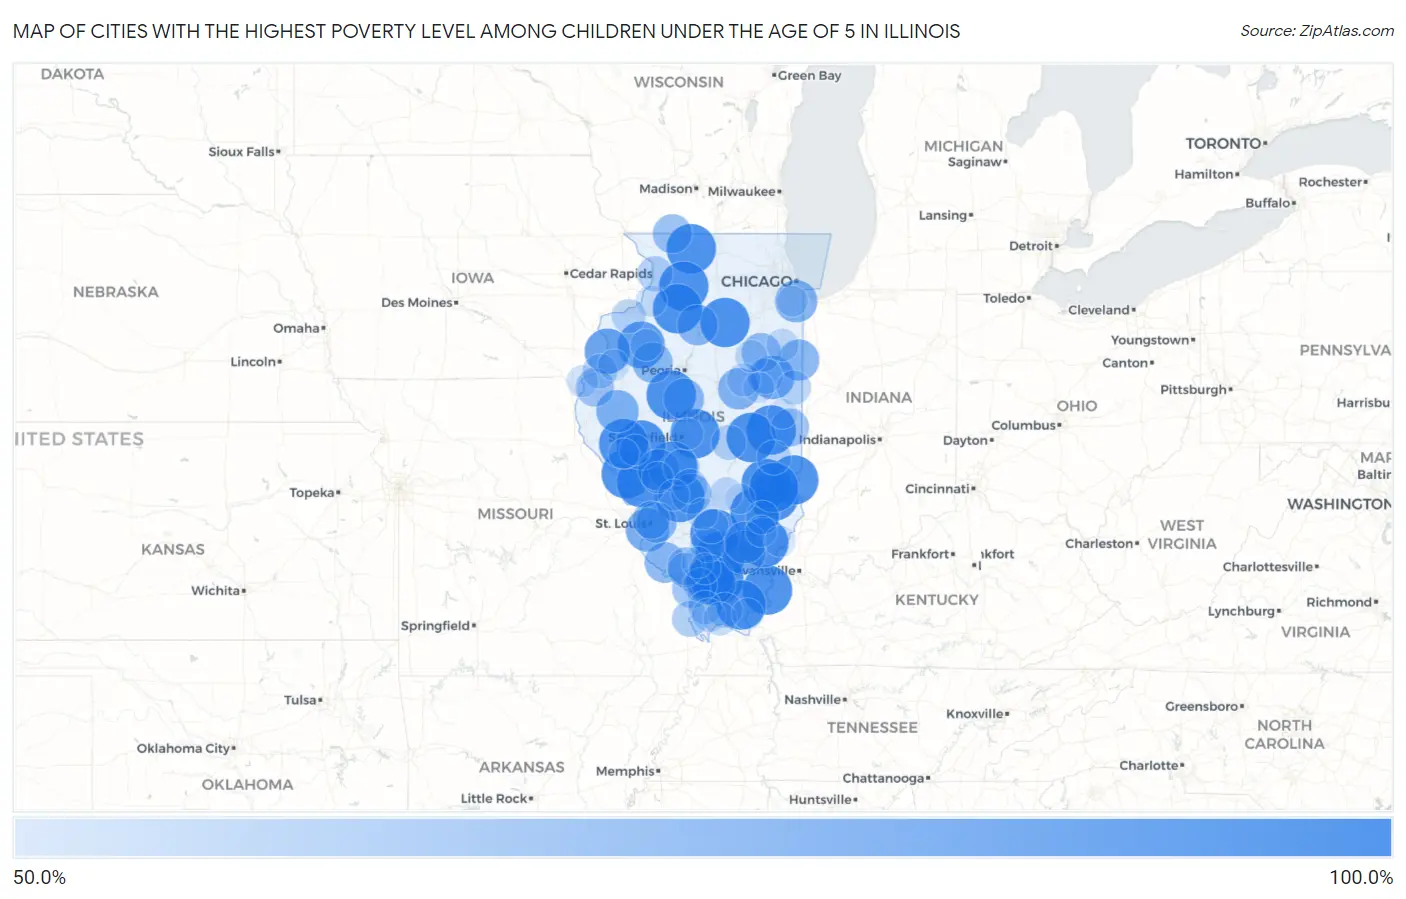
Map of Cities with the Highest Poverty Level Among Children Under the Age of 5 in Illinois
0.0%
100.0%
Cities with the Highest Poverty Level Among Children Under the Age of 5 in Illinois
| City | Child Poverty | vs State | vs National | |
| 1. | Naplate | 100.0% | 16.9%(+83.1)#1 | 18.1%(+81.9)#329 |
| 2. | Campbell's Island | 100.0% | 16.9%(+83.1)#2 | 18.1%(+81.9)#360 |
| 3. | Buffalo | 100.0% | 16.9%(+83.1)#3 | 18.1%(+81.9)#369 |
| 4. | New Douglas | 100.0% | 16.9%(+83.1)#4 | 18.1%(+81.9)#422 |
| 5. | Bush | 100.0% | 16.9%(+83.1)#5 | 18.1%(+81.9)#428 |
| 6. | Kampsville | 100.0% | 16.9%(+83.1)#6 | 18.1%(+81.9)#490 |
| 7. | Willow Hill | 100.0% | 16.9%(+83.1)#7 | 18.1%(+81.9)#493 |
| 8. | Nason | 100.0% | 16.9%(+83.1)#8 | 18.1%(+81.9)#505 |
| 9. | Kane | 100.0% | 16.9%(+83.1)#9 | 18.1%(+81.9)#534 |
| 10. | Freeman Spur | 100.0% | 16.9%(+83.1)#10 | 18.1%(+81.9)#555 |
| 11. | Serena | 100.0% | 16.9%(+83.1)#11 | 18.1%(+81.9)#567 |
| 12. | Forest City | 100.0% | 16.9%(+83.1)#12 | 18.1%(+81.9)#571 |
| 13. | West Union | 100.0% | 16.9%(+83.1)#13 | 18.1%(+81.9)#582 |
| 14. | Ophiem | 100.0% | 16.9%(+83.1)#14 | 18.1%(+81.9)#593 |
| 15. | Alden | 100.0% | 16.9%(+83.1)#15 | 18.1%(+81.9)#623 |
| 16. | Nilwood | 100.0% | 16.9%(+83.1)#16 | 18.1%(+81.9)#656 |
| 17. | Old Shawneetown | 100.0% | 16.9%(+83.1)#17 | 18.1%(+81.9)#679 |
| 18. | Ridott | 100.0% | 16.9%(+83.1)#19 | 18.1%(+81.9)#689 |
| 19. | Nelson | 100.0% | 16.9%(+83.1)#20 | 18.1%(+81.9)#690 |
| 20. | Lynnville | 100.0% | 16.9%(+83.1)#21 | 18.1%(+81.9)#699 |
| 21. | Walnut Hill | 100.0% | 16.9%(+83.1)#22 | 18.1%(+81.9)#717 |
| 22. | Harding | 100.0% | 16.9%(+83.1)#23 | 18.1%(+81.9)#733 |
| 23. | Sailor Springs | 100.0% | 16.9%(+83.1)#24 | 18.1%(+81.9)#758 |
| 24. | Hidalgo | 100.0% | 16.9%(+83.1)#25 | 18.1%(+81.9)#765 |
| 25. | Golden Gate | 100.0% | 16.9%(+83.1)#26 | 18.1%(+81.9)#782 |
| 26. | Yale | 100.0% | 16.9%(+83.1)#27 | 18.1%(+81.9)#805 |
| 27. | Longview | 100.0% | 16.9%(+83.1)#28 | 18.1%(+81.9)#808 |
| 28. | Garrett | 100.0% | 16.9%(+83.1)#29 | 18.1%(+81.9)#811 |
| 29. | Eddyville | 100.0% | 16.9%(+83.1)#30 | 18.1%(+81.9)#835 |
| 30. | New Bedford | 100.0% | 16.9%(+83.1)#31 | 18.1%(+81.9)#871 |
| 31. | Valley City | 100.0% | 16.9%(+83.1)#32 | 18.1%(+81.9)#887 |
| 32. | Henderson | 94.7% | 16.9%(+77.8)#33 | 18.1%(+76.7)#942 |
| 33. | Oquawka | 91.7% | 16.9%(+74.7)#34 | 18.1%(+73.6)#993 |
| 34. | Royalton | 90.4% | 16.9%(+73.5)#35 | 18.1%(+72.3)#1,019 |
| 35. | Colp | 88.1% | 16.9%(+71.2)#36 | 18.1%(+70.0)#1,060 |
| 36. | Belle Prairie City | 87.5% | 16.9%(+70.6)#37 | 18.1%(+69.4)#1,085 |
| 37. | Buckley | 87.0% | 16.9%(+70.0)#38 | 18.1%(+68.9)#1,103 |
| 38. | East Carondelet | 86.7% | 16.9%(+69.7)#39 | 18.1%(+68.6)#1,112 |
| 39. | Camden | 84.6% | 16.9%(+67.7)#40 | 18.1%(+66.6)#1,169 |
| 40. | Phoenix | 84.3% | 16.9%(+67.4)#41 | 18.1%(+66.3)#1,181 |
| 41. | Sims | 83.3% | 16.9%(+66.4)#42 | 18.1%(+65.3)#1,228 |
| 42. | Hettick | 83.3% | 16.9%(+66.4)#43 | 18.1%(+65.3)#1,231 |
| 43. | Arrowsmith | 82.4% | 16.9%(+65.4)#44 | 18.1%(+64.3)#1,254 |
| 44. | Iroquois | 81.8% | 16.9%(+64.9)#45 | 18.1%(+63.8)#1,271 |
| 45. | Evansville | 80.9% | 16.9%(+63.9)#46 | 18.1%(+62.8)#1,298 |
| 46. | Bureau Junction | 80.8% | 16.9%(+63.8)#47 | 18.1%(+62.7)#1,301 |
| 47. | San Jose | 80.6% | 16.9%(+63.7)#48 | 18.1%(+62.6)#1,307 |
| 48. | Washington Park | 80.6% | 16.9%(+63.7)#49 | 18.1%(+62.5)#1,308 |
| 49. | Maquon | 80.0% | 16.9%(+63.1)#50 | 18.1%(+61.9)#1,350 |
| 50. | Donnellson | 80.0% | 16.9%(+63.1)#51 | 18.1%(+61.9)#1,354 |
| 51. | Cahokia Heights | 79.2% | 16.9%(+62.2)#52 | 18.1%(+61.1)#1,373 |
| 52. | Kempton | 77.8% | 16.9%(+60.9)#53 | 18.1%(+59.7)#1,413 |
| 53. | Winslow | 77.4% | 16.9%(+60.5)#54 | 18.1%(+59.4)#1,427 |
| 54. | Gorham | 75.5% | 16.9%(+58.5)#55 | 18.1%(+57.4)#1,500 |
| 55. | Cutler | 75.0% | 16.9%(+58.1)#56 | 18.1%(+56.9)#1,531 |
| 56. | Indianola | 75.0% | 16.9%(+58.1)#57 | 18.1%(+56.9)#1,542 |
| 57. | Ferris | 75.0% | 16.9%(+58.1)#58 | 18.1%(+56.9)#1,548 |
| 58. | Venice | 74.0% | 16.9%(+57.1)#59 | 18.1%(+56.0)#1,582 |
| 59. | Waggoner | 71.4% | 16.9%(+54.5)#60 | 18.1%(+53.4)#1,714 |
| 60. | East Cape Girardeau | 70.6% | 16.9%(+53.7)#61 | 18.1%(+52.5)#1,751 |
| 61. | Roberts | 69.7% | 16.9%(+52.8)#62 | 18.1%(+51.6)#1,799 |
| 62. | Thomson | 69.2% | 16.9%(+52.3)#63 | 18.1%(+51.2)#1,828 |
| 63. | Vienna | 68.2% | 16.9%(+51.3)#64 | 18.1%(+50.2)#1,885 |
| 64. | Dalton City | 68.0% | 16.9%(+51.1)#65 | 18.1%(+49.9)#1,897 |
| 65. | Ashley | 67.9% | 16.9%(+50.9)#66 | 18.1%(+49.8)#1,905 |
| 66. | Willisville | 67.7% | 16.9%(+50.8)#67 | 18.1%(+49.7)#1,910 |
| 67. | Lomax | 67.7% | 16.9%(+50.8)#68 | 18.1%(+49.7)#1,911 |
| 68. | Ashmore | 67.6% | 16.9%(+50.7)#69 | 18.1%(+49.6)#1,917 |
| 69. | Taylor Springs | 67.6% | 16.9%(+50.6)#70 | 18.1%(+49.5)#1,926 |
| 70. | Junction City | 67.3% | 16.9%(+50.4)#71 | 18.1%(+49.3)#1,941 |
| 71. | Hoopeston | 66.8% | 16.9%(+49.9)#72 | 18.1%(+48.8)#1,959 |
| 72. | Oak Grove | 66.7% | 16.9%(+49.7)#73 | 18.1%(+48.6)#1,997 |
| 73. | Murphysboro | 66.5% | 16.9%(+49.6)#74 | 18.1%(+48.5)#2,037 |
| 74. | Anna | 66.0% | 16.9%(+49.0)#75 | 18.1%(+47.9)#2,054 |
| 75. | Noble | 65.6% | 16.9%(+48.7)#76 | 18.1%(+47.6)#2,071 |
| 76. | Dongola | 65.4% | 16.9%(+48.5)#77 | 18.1%(+47.3)#2,091 |
| 77. | Karnak | 64.7% | 16.9%(+47.8)#78 | 18.1%(+46.6)#2,136 |
| 78. | Anchor | 64.7% | 16.9%(+47.8)#79 | 18.1%(+46.6)#2,142 |
| 79. | St Elmo | 64.0% | 16.9%(+47.1)#80 | 18.1%(+45.9)#2,183 |
| 80. | Sammons Point | 63.2% | 16.9%(+46.2)#81 | 18.1%(+45.1)#2,247 |
| 81. | Saunemin | 62.5% | 16.9%(+45.6)#82 | 18.1%(+44.4)#2,300 |
| 82. | Wataga | 62.3% | 16.9%(+45.4)#83 | 18.1%(+44.2)#2,323 |
| 83. | Riverton | 62.1% | 16.9%(+45.1)#84 | 18.1%(+44.0)#2,332 |
| 84. | Nauvoo | 61.8% | 16.9%(+44.8)#85 | 18.1%(+43.7)#2,357 |
| 85. | Chesterfield | 61.5% | 16.9%(+44.6)#86 | 18.1%(+43.5)#2,388 |
| 86. | Keyesport | 61.1% | 16.9%(+44.2)#87 | 18.1%(+43.0)#2,419 |
| 87. | Pinckneyville | 61.0% | 16.9%(+44.1)#88 | 18.1%(+43.0)#2,424 |
| 88. | Hillsdale | 60.9% | 16.9%(+43.9)#89 | 18.1%(+42.8)#2,442 |
| 89. | Staunton | 60.8% | 16.9%(+43.9)#90 | 18.1%(+42.8)#2,445 |
| 90. | Mount Erie | 60.7% | 16.9%(+43.8)#91 | 18.1%(+42.7)#2,455 |
| 91. | Golconda | 60.6% | 16.9%(+43.7)#92 | 18.1%(+42.5)#2,463 |
| 92. | Du Quoin | 60.6% | 16.9%(+43.7)#93 | 18.1%(+42.5)#2,465 |
| 93. | Winchester | 60.0% | 16.9%(+43.1)#94 | 18.1%(+41.9)#2,494 |
| 94. | Elliott | 60.0% | 16.9%(+43.1)#95 | 18.1%(+41.9)#2,527 |
| 95. | Bellmont | 60.0% | 16.9%(+43.1)#96 | 18.1%(+41.9)#2,531 |
| 96. | Media | 60.0% | 16.9%(+43.1)#97 | 18.1%(+41.9)#2,545 |
| 97. | Markham | 59.8% | 16.9%(+42.9)#98 | 18.1%(+41.8)#2,556 |
| 98. | Milton | 59.1% | 16.9%(+42.2)#99 | 18.1%(+41.0)#2,601 |
| 99. | Mason | 58.5% | 16.9%(+41.6)#100 | 18.1%(+40.5)#2,649 |
| 100. | Fithian | 58.3% | 16.9%(+41.4)#101 | 18.1%(+40.3)#2,667 |
Common Questions
What are the Top 10 Cities with the Highest Poverty Level Among Children Under the Age of 5 in Illinois?
Top 10 Cities with the Highest Poverty Level Among Children Under the Age of 5 in Illinois are:
#1
100.0%
#2
100.0%
#3
100.0%
#4
100.0%
#5
100.0%
#6
100.0%
#7
100.0%
#8
100.0%
#9
100.0%
#10
100.0%
What city has the Highest Poverty Level Among Children Under the Age of 5 in Illinois?
Naplate has the Highest Poverty Level Among Children Under the Age of 5 in Illinois with 100.0%.
What is the Poverty Level Among Children Under the Age of 5 in the State of Illinois?
Poverty Level Among Children Under the Age of 5 in Illinois is 16.9%.
What is the Poverty Level Among Children Under the Age of 5 in the United States?
Poverty Level Among Children Under the Age of 5 in the United States is 18.1%.