Cities with the Highest Poverty Level Among Children Under the Age of 5 in Minnesota
RELATED REPORTS & OPTIONS
Highest Poverty | Child 0-5
Minnesota
Compare Cities
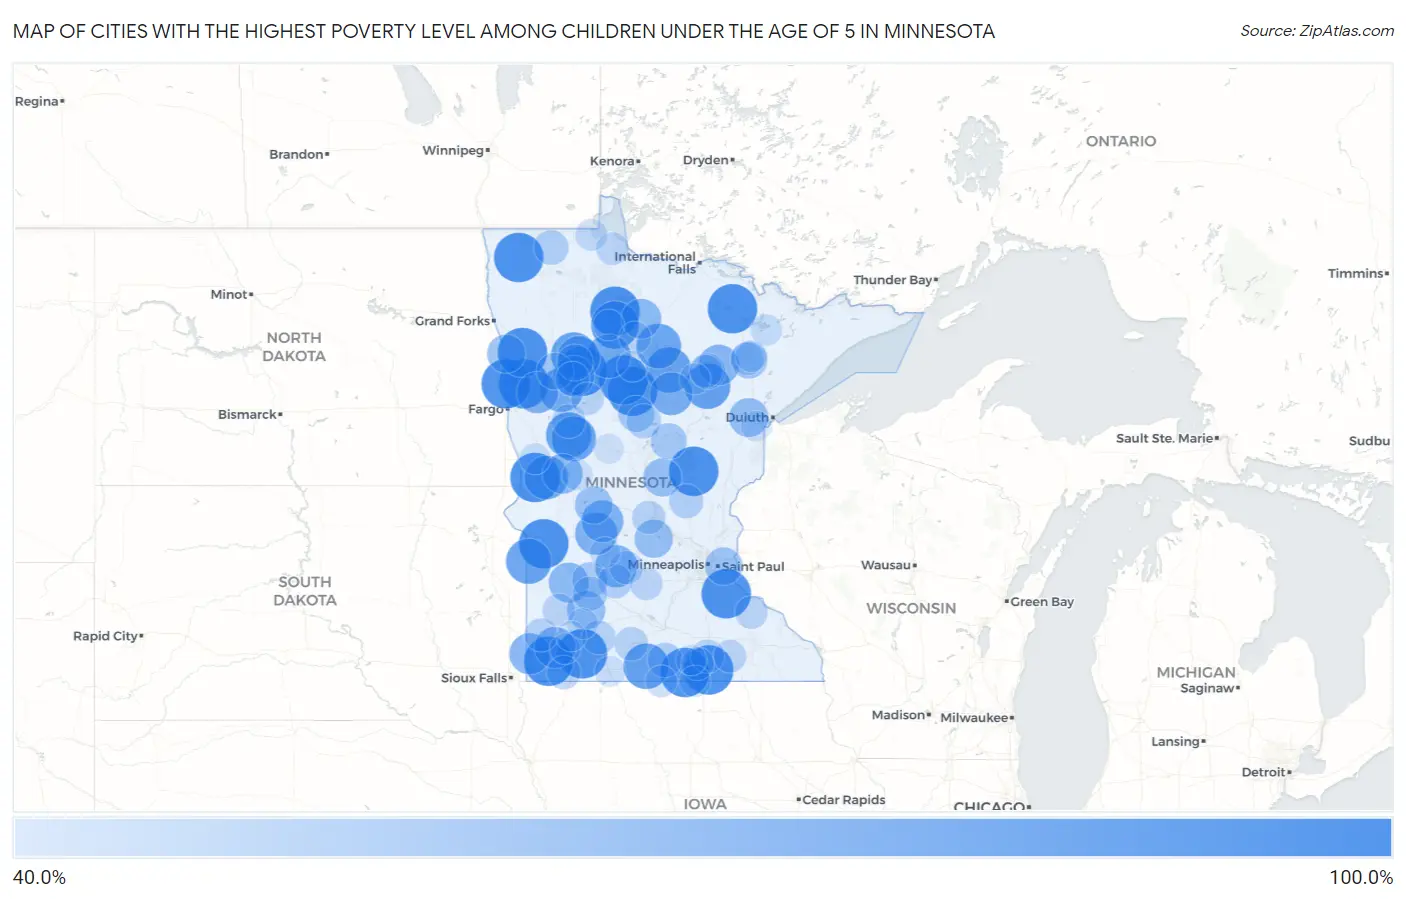
Map of Cities with the Highest Poverty Level Among Children Under the Age of 5 in Minnesota
0.0%
100.0%
Cities with the Highest Poverty Level Among Children Under the Age of 5 in Minnesota
| City | Child Poverty | vs State | vs National | |
| 1. | Walker | 100.0% | 11.3%(+88.7)#1 | 18.1%(+81.9)#183 |
| 2. | Ponemah | 100.0% | 11.3%(+88.7)#2 | 18.1%(+81.9)#198 |
| 3. | Orr | 100.0% | 11.3%(+88.7)#3 | 18.1%(+81.9)#374 |
| 4. | Wahkon | 100.0% | 11.3%(+88.7)#4 | 18.1%(+81.9)#480 |
| 5. | Hayward | 100.0% | 11.3%(+88.7)#5 | 18.1%(+81.9)#550 |
| 6. | Borup | 100.0% | 11.3%(+88.7)#6 | 18.1%(+81.9)#652 |
| 7. | Perley | 100.0% | 11.3%(+88.7)#7 | 18.1%(+81.9)#716 |
| 8. | Dundee | 100.0% | 11.3%(+88.7)#8 | 18.1%(+81.9)#802 |
| 9. | Beltrami | 100.0% | 11.3%(+88.7)#9 | 18.1%(+81.9)#812 |
| 10. | Walters | 100.0% | 11.3%(+88.7)#10 | 18.1%(+81.9)#824 |
| 11. | New Trier | 100.0% | 11.3%(+88.7)#11 | 18.1%(+81.9)#826 |
| 12. | Kenneth | 100.0% | 11.3%(+88.7)#12 | 18.1%(+81.9)#836 |
| 13. | Essig | 100.0% | 11.3%(+88.7)#13 | 18.1%(+81.9)#850 |
| 14. | Laporte | 100.0% | 11.3%(+88.7)#14 | 18.1%(+81.9)#854 |
| 15. | Nashua | 100.0% | 11.3%(+88.7)#15 | 18.1%(+81.9)#861 |
| 16. | South End | 100.0% | 11.3%(+88.7)#16 | 18.1%(+81.9)#885 |
| 17. | Halma | 100.0% | 11.3%(+88.7)#17 | 18.1%(+81.9)#888 |
| 18. | Correll | 100.0% | 11.3%(+88.7)#18 | 18.1%(+81.9)#909 |
| 19. | Redby | 94.3% | 11.3%(+83.0)#19 | 18.1%(+76.2)#948 |
| 20. | Granada | 88.2% | 11.3%(+76.9)#20 | 18.1%(+70.2)#1,057 |
| 21. | Warba | 88.2% | 11.3%(+76.9)#21 | 18.1%(+70.2)#1,058 |
| 22. | Ball Club | 87.9% | 11.3%(+76.5)#22 | 18.1%(+69.8)#1,067 |
| 23. | Dent | 87.5% | 11.3%(+76.2)#23 | 18.1%(+69.4)#1,081 |
| 24. | Marietta | 87.5% | 11.3%(+76.2)#24 | 18.1%(+69.4)#1,083 |
| 25. | Lengby | 87.5% | 11.3%(+76.2)#25 | 18.1%(+69.4)#1,086 |
| 26. | Squaw Lake | 85.7% | 11.3%(+74.4)#26 | 18.1%(+67.7)#1,147 |
| 27. | Richville | 85.7% | 11.3%(+74.4)#27 | 18.1%(+67.7)#1,149 |
| 28. | Wilton | 83.3% | 11.3%(+72.0)#28 | 18.1%(+65.3)#1,223 |
| 29. | White Earth | 82.9% | 11.3%(+71.6)#29 | 18.1%(+64.8)#1,240 |
| 30. | Wendell | 82.4% | 11.3%(+71.0)#30 | 18.1%(+64.3)#1,255 |
| 31. | Remer | 80.0% | 11.3%(+68.7)#31 | 18.1%(+61.9)#1,334 |
| 32. | Ebro | 80.0% | 11.3%(+68.7)#32 | 18.1%(+61.9)#1,357 |
| 33. | Lake Lillian | 77.8% | 11.3%(+66.4)#33 | 18.1%(+59.7)#1,416 |
| 34. | Sunburg | 77.8% | 11.3%(+66.4)#34 | 18.1%(+59.7)#1,418 |
| 35. | Brooten | 76.9% | 11.3%(+65.6)#35 | 18.1%(+58.9)#1,451 |
| 36. | Ulen | 76.2% | 11.3%(+64.9)#36 | 18.1%(+58.1)#1,479 |
| 37. | Jasper | 75.0% | 11.3%(+63.7)#37 | 18.1%(+56.9)#1,521 |
| 38. | Naytahwaush | 75.0% | 11.3%(+63.7)#38 | 18.1%(+56.9)#1,523 |
| 39. | Chandler | 75.0% | 11.3%(+63.7)#39 | 18.1%(+56.9)#1,527 |
| 40. | Keewatin | 73.6% | 11.3%(+62.2)#40 | 18.1%(+55.5)#1,611 |
| 41. | Ashby | 71.4% | 11.3%(+60.1)#41 | 18.1%(+53.4)#1,701 |
| 42. | Kelliher | 71.4% | 11.3%(+60.1)#42 | 18.1%(+53.4)#1,703 |
| 43. | Hazel Run | 71.4% | 11.3%(+60.1)#43 | 18.1%(+53.4)#1,716 |
| 44. | Mahnomen | 68.8% | 11.3%(+57.4)#44 | 18.1%(+50.7)#1,861 |
| 45. | Lucan | 66.7% | 11.3%(+55.3)#45 | 18.1%(+48.6)#2,014 |
| 46. | South Haven | 66.7% | 11.3%(+55.3)#46 | 18.1%(+48.6)#2,015 |
| 47. | Lastrup | 66.7% | 11.3%(+55.3)#47 | 18.1%(+48.6)#2,027 |
| 48. | Nielsville | 66.7% | 11.3%(+55.3)#48 | 18.1%(+48.6)#2,028 |
| 49. | Villard | 64.7% | 11.3%(+53.4)#49 | 18.1%(+46.6)#2,141 |
| 50. | Landfall | 64.0% | 11.3%(+52.7)#50 | 18.1%(+45.9)#2,185 |
| 51. | Eveleth | 62.6% | 11.3%(+51.3)#51 | 18.1%(+44.6)#2,283 |
| 52. | Riverland | 62.2% | 11.3%(+50.8)#52 | 18.1%(+44.1)#2,330 |
| 53. | Crosby | 60.0% | 11.3%(+48.7)#53 | 18.1%(+41.9)#2,491 |
| 54. | Backus | 60.0% | 11.3%(+48.7)#54 | 18.1%(+41.9)#2,522 |
| 55. | Pine Bend | 60.0% | 11.3%(+48.7)#55 | 18.1%(+41.9)#2,552 |
| 56. | Calumet | 59.3% | 11.3%(+47.9)#56 | 18.1%(+41.2)#2,588 |
| 57. | Sacred Heart | 58.5% | 11.3%(+47.2)#57 | 18.1%(+40.5)#2,647 |
| 58. | Pine River | 55.6% | 11.3%(+44.2)#58 | 18.1%(+37.5)#2,905 |
| 59. | Badger | 55.6% | 11.3%(+44.2)#59 | 18.1%(+37.5)#2,914 |
| 60. | Delavan | 55.6% | 11.3%(+44.2)#60 | 18.1%(+37.5)#2,926 |
| 61. | Bird Island | 54.5% | 11.3%(+43.2)#61 | 18.1%(+36.5)#3,001 |
| 62. | Belview | 54.5% | 11.3%(+43.2)#62 | 18.1%(+36.5)#3,005 |
| 63. | Milaca | 54.4% | 11.3%(+43.1)#63 | 18.1%(+36.3)#3,014 |
| 64. | Twin Lakes | 53.8% | 11.3%(+42.5)#64 | 18.1%(+35.8)#3,053 |
| 65. | Jeffers | 53.3% | 11.3%(+42.0)#65 | 18.1%(+35.3)#3,110 |
| 66. | Frazee | 53.0% | 11.3%(+41.7)#66 | 18.1%(+35.0)#3,136 |
| 67. | St James | 52.8% | 11.3%(+41.5)#67 | 18.1%(+34.7)#3,164 |
| 68. | Rushmore | 52.4% | 11.3%(+41.0)#68 | 18.1%(+34.3)#3,196 |
| 69. | Geneva | 52.2% | 11.3%(+40.8)#69 | 18.1%(+34.1)#3,221 |
| 70. | St Joseph | 52.0% | 11.3%(+40.6)#70 | 18.1%(+33.9)#3,235 |
| 71. | Holland | 51.7% | 11.3%(+40.4)#71 | 18.1%(+33.7)#3,259 |
| 72. | Cosmos | 51.6% | 11.3%(+40.3)#72 | 18.1%(+33.6)#3,275 |
| 73. | Marble | 50.0% | 11.3%(+38.7)#73 | 18.1%(+31.9)#3,438 |
| 74. | Brownton | 50.0% | 11.3%(+38.7)#74 | 18.1%(+31.9)#3,450 |
| 75. | Lynd | 50.0% | 11.3%(+38.7)#75 | 18.1%(+31.9)#3,454 |
| 76. | Pine Point | 50.0% | 11.3%(+38.7)#76 | 18.1%(+31.9)#3,499 |
| 77. | Williams | 50.0% | 11.3%(+38.7)#77 | 18.1%(+31.9)#3,509 |
| 78. | Bellechester | 50.0% | 11.3%(+38.7)#78 | 18.1%(+31.9)#3,525 |
| 79. | Waltham | 50.0% | 11.3%(+38.7)#79 | 18.1%(+31.9)#3,530 |
| 80. | Leonidas | 50.0% | 11.3%(+38.7)#80 | 18.1%(+31.9)#3,572 |
| 81. | Manchester | 50.0% | 11.3%(+38.7)#81 | 18.1%(+31.9)#3,575 |
| 82. | Blackduck | 48.1% | 11.3%(+36.8)#82 | 18.1%(+30.1)#3,738 |
| 83. | Warroad | 48.1% | 11.3%(+36.7)#83 | 18.1%(+30.0)#3,742 |
| 84. | Elmore | 47.2% | 11.3%(+35.9)#84 | 18.1%(+29.2)#3,844 |
| 85. | Virginia | 46.8% | 11.3%(+35.4)#85 | 18.1%(+28.7)#3,904 |
| 86. | Soudan | 46.7% | 11.3%(+35.3)#86 | 18.1%(+28.6)#3,925 |
| 87. | Emmons | 46.2% | 11.3%(+34.8)#87 | 18.1%(+28.1)#4,000 |
| 88. | Foxhome | 45.5% | 11.3%(+34.1)#88 | 18.1%(+27.4)#4,099 |
| 89. | La Prairie | 45.0% | 11.3%(+33.7)#89 | 18.1%(+26.9)#4,139 |
| 90. | Cass Lake | 44.8% | 11.3%(+33.5)#90 | 18.1%(+26.8)#4,165 |
| 91. | Walnut Grove | 44.7% | 11.3%(+33.4)#91 | 18.1%(+26.7)#4,179 |
| 92. | Red Lake | 44.4% | 11.3%(+33.1)#92 | 18.1%(+26.4)#4,210 |
| 93. | Millerville | 44.4% | 11.3%(+33.1)#93 | 18.1%(+26.4)#4,243 |
| 94. | Willmar | 44.2% | 11.3%(+32.8)#94 | 18.1%(+26.1)#4,272 |
| 95. | Jackson | 43.9% | 11.3%(+32.5)#95 | 18.1%(+25.8)#4,304 |
| 96. | Carlton | 43.8% | 11.3%(+32.4)#96 | 18.1%(+25.7)#4,318 |
| 97. | Freeborn | 43.8% | 11.3%(+32.4)#97 | 18.1%(+25.7)#4,332 |
| 98. | Iona | 43.8% | 11.3%(+32.4)#98 | 18.1%(+25.7)#4,334 |
| 99. | Verndale | 42.9% | 11.3%(+31.5)#99 | 18.1%(+24.8)#4,458 |
| 100. | Currie | 42.9% | 11.3%(+31.5)#100 | 18.1%(+24.8)#4,477 |
Common Questions
What are the Top 10 Cities with the Highest Poverty Level Among Children Under the Age of 5 in Minnesota?
Top 10 Cities with the Highest Poverty Level Among Children Under the Age of 5 in Minnesota are:
What city has the Highest Poverty Level Among Children Under the Age of 5 in Minnesota?
Walker has the Highest Poverty Level Among Children Under the Age of 5 in Minnesota with 100.0%.
What is the Poverty Level Among Children Under the Age of 5 in the State of Minnesota?
Poverty Level Among Children Under the Age of 5 in Minnesota is 11.3%.
What is the Poverty Level Among Children Under the Age of 5 in the United States?
Poverty Level Among Children Under the Age of 5 in the United States is 18.1%.