Cities with the Highest Poverty Level Among Children Under the Age of 5 in Georgia
RELATED REPORTS & OPTIONS
Highest Poverty | Child 0-5
Georgia
Compare Cities
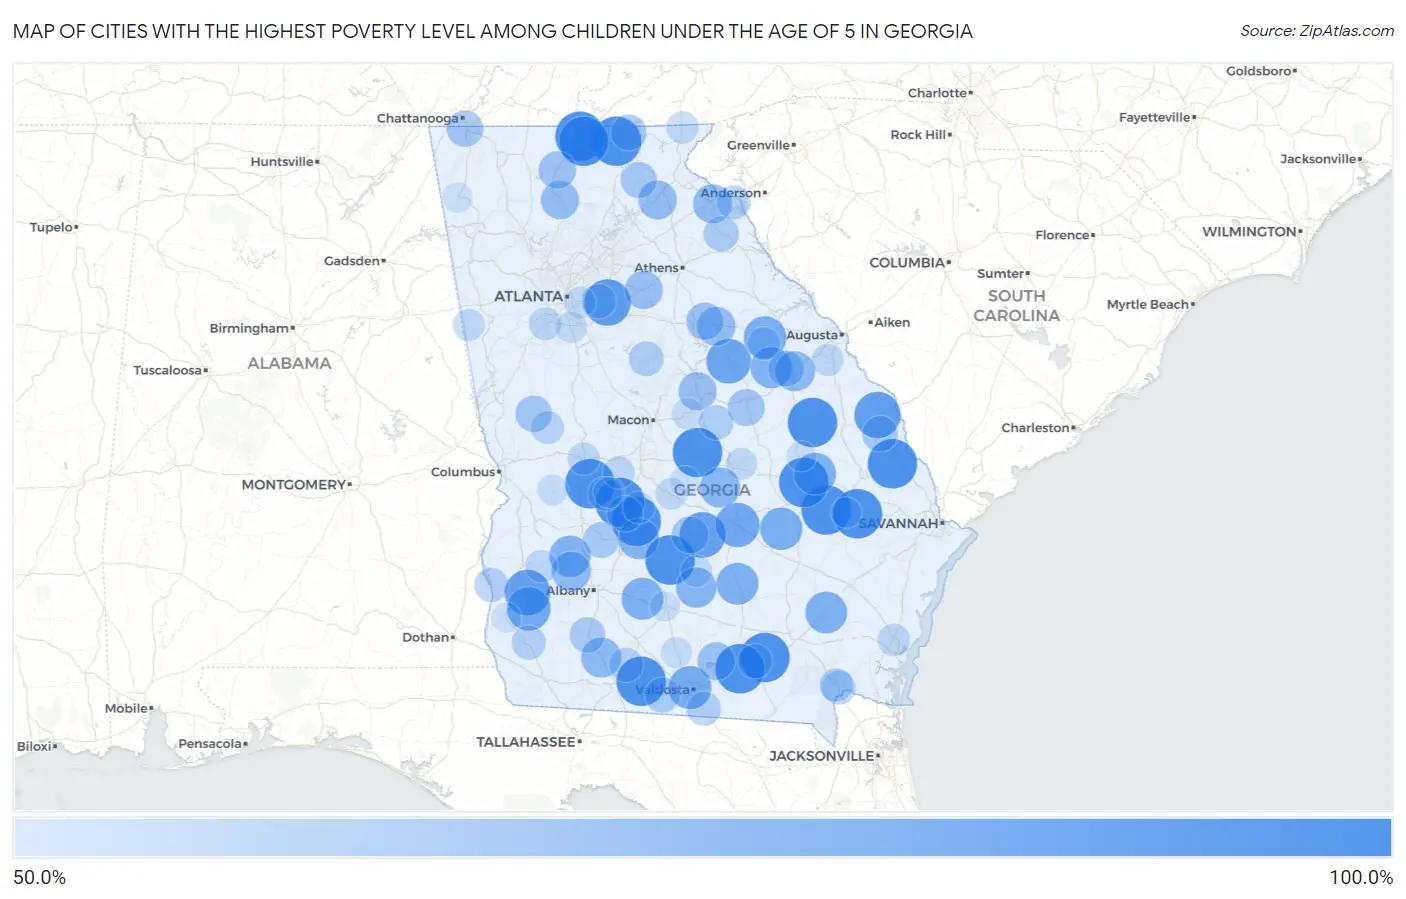
Map of Cities with the Highest Poverty Level Among Children Under the Age of 5 in Georgia
0.0%
100.0%
Cities with the Highest Poverty Level Among Children Under the Age of 5 in Georgia
| City | Child Poverty | vs State | vs National | |
| 1. | Vienna | 100.0% | 20.3%(+79.7)#1 | 18.1%(+81.9)#25 |
| 2. | Blairsville | 100.0% | 20.3%(+79.7)#2 | 18.1%(+81.9)#227 |
| 3. | Ideal | 100.0% | 20.3%(+79.7)#3 | 18.1%(+81.9)#268 |
| 4. | Collins | 100.0% | 20.3%(+79.7)#4 | 18.1%(+81.9)#274 |
| 5. | Oak Park | 100.0% | 20.3%(+79.7)#5 | 18.1%(+81.9)#300 |
| 6. | Argyle | 100.0% | 20.3%(+79.7)#6 | 18.1%(+81.9)#314 |
| 7. | Midville | 100.0% | 20.3%(+79.7)#7 | 18.1%(+81.9)#356 |
| 8. | Daisy | 100.0% | 20.3%(+79.7)#8 | 18.1%(+81.9)#390 |
| 9. | Mineral Bluff | 100.0% | 20.3%(+79.7)#9 | 18.1%(+81.9)#391 |
| 10. | Barwick | 100.0% | 20.3%(+79.7)#10 | 18.1%(+81.9)#434 |
| 11. | Rebecca | 100.0% | 20.3%(+79.7)#11 | 18.1%(+81.9)#435 |
| 12. | Morganton | 100.0% | 20.3%(+79.7)#12 | 18.1%(+81.9)#464 |
| 13. | Oliver | 100.0% | 20.3%(+79.7)#13 | 18.1%(+81.9)#468 |
| 14. | Danville | 100.0% | 20.3%(+79.7)#14 | 18.1%(+81.9)#600 |
| 15. | Du Pont | 100.0% | 20.3%(+79.7)#15 | 18.1%(+81.9)#677 |
| 16. | Dooling | 100.0% | 20.3%(+79.7)#16 | 18.1%(+81.9)#882 |
| 17. | Lakeview Estates | 92.7% | 20.3%(+72.4)#17 | 18.1%(+74.7)#971 |
| 18. | Hiltonia | 92.0% | 20.3%(+71.7)#18 | 18.1%(+73.9)#986 |
| 19. | Rhine | 90.9% | 20.3%(+70.6)#19 | 18.1%(+72.8)#1,004 |
| 20. | Edison | 90.6% | 20.3%(+70.2)#20 | 18.1%(+72.5)#1,013 |
| 21. | Sparta | 88.1% | 20.3%(+67.8)#21 | 18.1%(+70.1)#1,059 |
| 22. | Mcrae Helena | 87.0% | 20.3%(+66.7)#22 | 18.1%(+69.0)#1,099 |
| 23. | Warthen | 86.4% | 20.3%(+66.0)#23 | 18.1%(+68.3)#1,120 |
| 24. | Arlington | 85.7% | 20.3%(+65.4)#24 | 18.1%(+67.7)#1,133 |
| 25. | Remerton | 84.1% | 20.3%(+63.8)#25 | 18.1%(+66.1)#1,186 |
| 26. | Camak | 82.9% | 20.3%(+62.5)#26 | 18.1%(+64.8)#1,242 |
| 27. | Uvalda | 82.6% | 20.3%(+62.3)#27 | 18.1%(+64.5)#1,247 |
| 28. | Stillmore | 81.6% | 20.3%(+61.2)#28 | 18.1%(+63.5)#1,279 |
| 29. | Sumner | 81.5% | 20.3%(+61.1)#29 | 18.1%(+63.4)#1,283 |
| 30. | Broxton | 81.2% | 20.3%(+60.9)#30 | 18.1%(+63.2)#1,287 |
| 31. | Offerman | 81.1% | 20.3%(+60.7)#31 | 18.1%(+63.0)#1,296 |
| 32. | Gibson | 80.0% | 20.3%(+59.7)#32 | 18.1%(+61.9)#1,318 |
| 33. | Bronwood | 80.0% | 20.3%(+59.7)#33 | 18.1%(+61.9)#1,337 |
| 34. | Cordele | 78.4% | 20.3%(+58.1)#34 | 18.1%(+60.3)#1,392 |
| 35. | Ocilla | 77.9% | 20.3%(+57.5)#35 | 18.1%(+59.8)#1,406 |
| 36. | Cadwell | 77.4% | 20.3%(+57.0)#36 | 18.1%(+59.3)#1,429 |
| 37. | Meigs | 76.9% | 20.3%(+56.6)#37 | 18.1%(+58.9)#1,450 |
| 38. | Wrens | 76.9% | 20.3%(+56.5)#38 | 18.1%(+58.8)#1,458 |
| 39. | Sasser | 75.0% | 20.3%(+54.7)#39 | 18.1%(+56.9)#1,529 |
| 40. | Lavonia | 74.4% | 20.3%(+54.0)#40 | 18.1%(+56.3)#1,569 |
| 41. | Raoul | 73.7% | 20.3%(+53.3)#41 | 18.1%(+55.6)#1,600 |
| 42. | Siloam | 73.6% | 20.3%(+53.3)#42 | 18.1%(+55.5)#1,610 |
| 43. | Milstead | 72.5% | 20.3%(+52.2)#43 | 18.1%(+54.5)#1,654 |
| 44. | Jasper | 72.5% | 20.3%(+52.2)#44 | 18.1%(+54.4)#1,655 |
| 45. | Hardwick | 72.3% | 20.3%(+52.0)#45 | 18.1%(+54.2)#1,662 |
| 46. | Monroe | 72.2% | 20.3%(+51.9)#46 | 18.1%(+54.1)#1,669 |
| 47. | Lakeland | 71.2% | 20.3%(+50.8)#47 | 18.1%(+53.1)#1,728 |
| 48. | East Ellijay | 70.6% | 20.3%(+50.3)#48 | 18.1%(+52.5)#1,749 |
| 49. | Greensboro | 70.5% | 20.3%(+50.1)#49 | 18.1%(+52.4)#1,757 |
| 50. | Abbeville | 69.2% | 20.3%(+48.9)#50 | 18.1%(+51.2)#1,823 |
| 51. | Tennille | 69.2% | 20.3%(+48.9)#51 | 18.1%(+51.2)#1,826 |
| 52. | Warm Springs | 68.2% | 20.3%(+47.8)#52 | 18.1%(+50.1)#1,889 |
| 53. | Rossville | 68.2% | 20.3%(+47.8)#53 | 18.1%(+50.1)#1,890 |
| 54. | Cleveland | 67.2% | 20.3%(+46.9)#54 | 18.1%(+49.1)#1,948 |
| 55. | Young Harris | 66.7% | 20.3%(+46.3)#55 | 18.1%(+48.6)#1,971 |
| 56. | Leslie | 66.7% | 20.3%(+46.3)#56 | 18.1%(+48.6)#1,986 |
| 57. | Stapleton | 66.7% | 20.3%(+46.3)#57 | 18.1%(+48.6)#1,995 |
| 58. | Lilly | 66.7% | 20.3%(+46.3)#58 | 18.1%(+48.6)#2,023 |
| 59. | Sylvania | 66.5% | 20.3%(+46.1)#59 | 18.1%(+48.4)#2,039 |
| 60. | Camilla | 65.9% | 20.3%(+45.5)#60 | 18.1%(+47.8)#2,059 |
| 61. | Quitman | 65.1% | 20.3%(+44.7)#61 | 18.1%(+47.0)#2,108 |
| 62. | Bowman | 64.9% | 20.3%(+44.6)#62 | 18.1%(+46.8)#2,124 |
| 63. | Monticello | 64.1% | 20.3%(+43.8)#63 | 18.1%(+46.0)#2,177 |
| 64. | Toomsboro | 63.6% | 20.3%(+43.3)#64 | 18.1%(+45.6)#2,206 |
| 65. | Lithonia | 62.9% | 20.3%(+42.5)#65 | 18.1%(+44.8)#2,266 |
| 66. | Homerville | 62.8% | 20.3%(+42.4)#66 | 18.1%(+44.7)#2,271 |
| 67. | Fort Gaines | 62.7% | 20.3%(+42.4)#67 | 18.1%(+44.7)#2,275 |
| 68. | Colquitt | 62.7% | 20.3%(+42.3)#68 | 18.1%(+44.6)#2,280 |
| 69. | Coolidge | 62.5% | 20.3%(+42.2)#69 | 18.1%(+44.4)#2,294 |
| 70. | Lake Park | 62.4% | 20.3%(+42.1)#70 | 18.1%(+44.4)#2,318 |
| 71. | Folkston | 62.3% | 20.3%(+42.0)#71 | 18.1%(+44.3)#2,319 |
| 72. | Reed Creek | 62.3% | 20.3%(+41.9)#72 | 18.1%(+44.2)#2,324 |
| 73. | Oglethorpe | 61.8% | 20.3%(+41.4)#73 | 18.1%(+43.7)#2,356 |
| 74. | Homeland | 61.1% | 20.3%(+40.8)#74 | 18.1%(+43.0)#2,413 |
| 75. | Woodland | 60.0% | 20.3%(+39.7)#75 | 18.1%(+41.9)#2,529 |
| 76. | Warrenton | 59.6% | 20.3%(+39.2)#76 | 18.1%(+41.5)#2,568 |
| 77. | Fairburn | 58.8% | 20.3%(+38.5)#77 | 18.1%(+40.8)#2,611 |
| 78. | Shellman | 58.5% | 20.3%(+38.2)#78 | 18.1%(+40.5)#2,645 |
| 79. | Dock Junction | 58.4% | 20.3%(+38.0)#79 | 18.1%(+40.3)#2,659 |
| 80. | Butler | 58.3% | 20.3%(+38.0)#80 | 18.1%(+40.3)#2,662 |
| 81. | Dillard | 58.3% | 20.3%(+38.0)#81 | 18.1%(+40.3)#2,672 |
| 82. | Marshallville | 58.2% | 20.3%(+37.9)#82 | 18.1%(+40.2)#2,678 |
| 83. | Hephzibah | 57.9% | 20.3%(+37.6)#83 | 18.1%(+39.8)#2,691 |
| 84. | Bowdon | 57.7% | 20.3%(+37.3)#84 | 18.1%(+39.6)#2,715 |
| 85. | Pinehurst | 57.1% | 20.3%(+36.8)#85 | 18.1%(+39.1)#2,761 |
| 86. | East Dublin | 57.1% | 20.3%(+36.7)#86 | 18.1%(+39.0)#2,777 |
| 87. | Hawkinsville | 57.0% | 20.3%(+36.7)#87 | 18.1%(+38.9)#2,782 |
| 88. | Fitzgerald | 56.7% | 20.3%(+36.4)#88 | 18.1%(+38.7)#2,796 |
| 89. | Panthersville | 56.3% | 20.3%(+35.9)#89 | 18.1%(+38.2)#2,835 |
| 90. | Gordon | 55.9% | 20.3%(+35.6)#90 | 18.1%(+37.8)#2,875 |
| 91. | Jonesboro | 55.6% | 20.3%(+35.3)#91 | 18.1%(+37.5)#2,902 |
| 92. | Adel | 55.3% | 20.3%(+35.0)#92 | 18.1%(+37.3)#2,946 |
| 93. | Buena Vista | 55.2% | 20.3%(+34.8)#93 | 18.1%(+37.1)#2,956 |
| 94. | Montezuma | 54.7% | 20.3%(+34.4)#94 | 18.1%(+36.7)#2,986 |
| 95. | Hagan | 54.4% | 20.3%(+34.0)#95 | 18.1%(+36.3)#3,015 |
| 96. | Tifton | 53.8% | 20.3%(+33.5)#96 | 18.1%(+35.8)#3,056 |
| 97. | Summerville | 53.5% | 20.3%(+33.2)#97 | 18.1%(+35.5)#3,082 |
| 98. | Swainsboro | 53.5% | 20.3%(+33.1)#98 | 18.1%(+35.4)#3,086 |
| 99. | Cochran | 53.5% | 20.3%(+33.1)#99 | 18.1%(+35.4)#3,087 |
| 100. | Blakely | 53.3% | 20.3%(+32.9)#100 | 18.1%(+35.2)#3,117 |
Common Questions
What are the Top 10 Cities with the Highest Poverty Level Among Children Under the Age of 5 in Georgia?
Top 10 Cities with the Highest Poverty Level Among Children Under the Age of 5 in Georgia are:
#1
100.0%
#2
100.0%
#3
100.0%
#4
100.0%
#5
100.0%
#6
100.0%
#7
100.0%
#8
100.0%
#9
100.0%
#10
100.0%
What city has the Highest Poverty Level Among Children Under the Age of 5 in Georgia?
Vienna has the Highest Poverty Level Among Children Under the Age of 5 in Georgia with 100.0%.
What is the Poverty Level Among Children Under the Age of 5 in the State of Georgia?
Poverty Level Among Children Under the Age of 5 in Georgia is 20.3%.
What is the Poverty Level Among Children Under the Age of 5 in the United States?
Poverty Level Among Children Under the Age of 5 in the United States is 18.1%.