Klamath, CA Map & Demographics
Klamath Map
Klamath Overview
$25,498
PER CAPITA INCOME
$68,850
AVG FAMILY INCOME
$49,353
AVG HOUSEHOLD INCOME
15.1%
WAGE / INCOME GAP [ % ]
84.9¢/ $1
WAGE / INCOME GAP [ $ ]
0.49
INEQUALITY / GINI INDEX
924
TOTAL POPULATION
443
MALE POPULATION
481
FEMALE POPULATION
92.10
MALES / 100 FEMALES
108.58
FEMALES / 100 MALES
53.2
MEDIAN AGE
3.1
AVG FAMILY SIZE
2.6
AVG HOUSEHOLD SIZE
295
LABOR FORCE [ PEOPLE ]
41.2%
PERCENT IN LABOR FORCE
18.0%
UNEMPLOYMENT RATE
Klamath Zip Codes
Klamath Area Codes
Income in Klamath
Income Overview in Klamath
Per Capita Income in Klamath is $25,498, while median incomes of families and households are $68,850 and $49,353 respectively.
| Characteristic | Number | Measure |
| Per Capita Income | 924 | $25,498 |
| Median Family Income | 239 | $68,850 |
| Mean Family Income | 239 | $89,626 |
| Median Household Income | 351 | $49,353 |
| Mean Household Income | 351 | $73,753 |
| Income Deficit | 239 | $0 |
| Wage / Income Gap (%) | 924 | 15.12% |
| Wage / Income Gap ($) | 924 | 84.88¢ per $1 |
| Gini / Inequality Index | 924 | 0.49 |
Earnings by Sex in Klamath
Average Earnings in Klamath are $14,776, $16,806 for men and $14,265 for women, a difference of 15.1%.
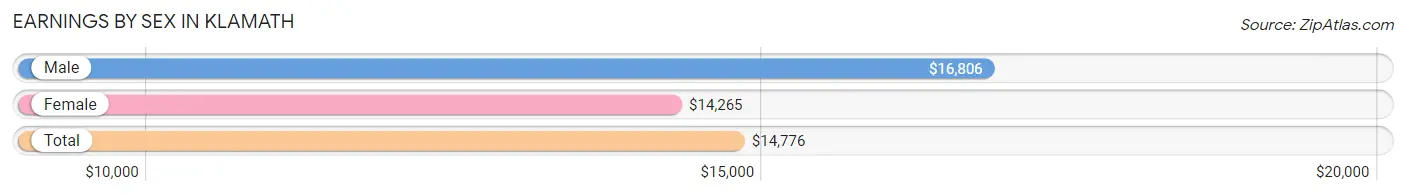
| Sex | Number | Average Earnings |
| Male | 121 (34.7%) | $16,806 |
| Female | 228 (65.3%) | $14,265 |
| Total | 349 (100.0%) | $14,776 |
Earnings by Sex by Income Bracket in Klamath
The most common earnings brackets in Klamath are $5,000 to $7,499 for men (21 | 17.4%) and $2,499 or less for women (48 | 21.0%).
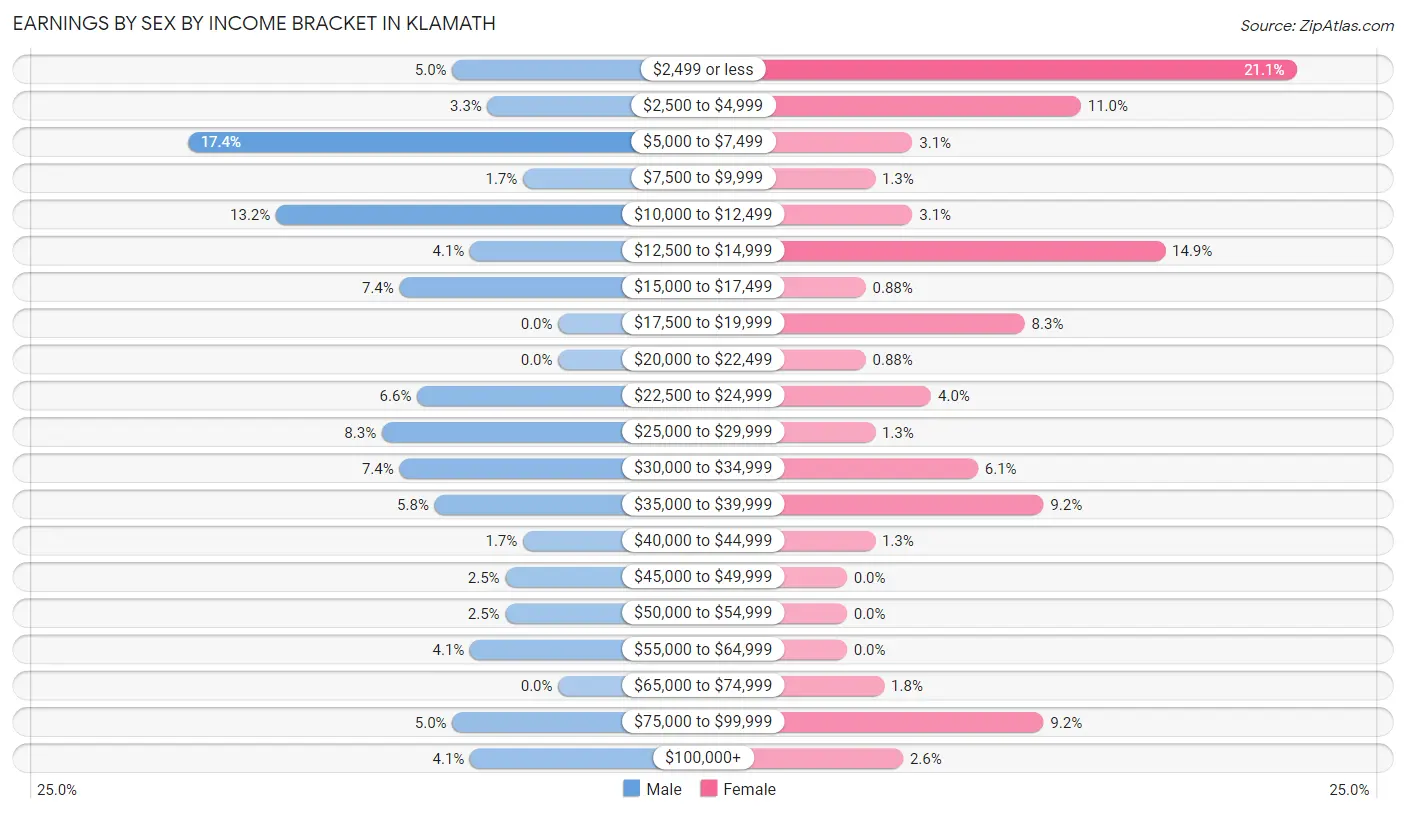
| Income | Male | Female |
| $2,499 or less | 6 (5.0%) | 48 (21.0%) |
| $2,500 to $4,999 | 4 (3.3%) | 25 (11.0%) |
| $5,000 to $7,499 | 21 (17.4%) | 7 (3.1%) |
| $7,500 to $9,999 | 2 (1.7%) | 3 (1.3%) |
| $10,000 to $12,499 | 16 (13.2%) | 7 (3.1%) |
| $12,500 to $14,999 | 5 (4.1%) | 34 (14.9%) |
| $15,000 to $17,499 | 9 (7.4%) | 2 (0.9%) |
| $17,500 to $19,999 | 0 (0.0%) | 19 (8.3%) |
| $20,000 to $22,499 | 0 (0.0%) | 2 (0.9%) |
| $22,500 to $24,999 | 8 (6.6%) | 9 (4.0%) |
| $25,000 to $29,999 | 10 (8.3%) | 3 (1.3%) |
| $30,000 to $34,999 | 9 (7.4%) | 14 (6.1%) |
| $35,000 to $39,999 | 7 (5.8%) | 21 (9.2%) |
| $40,000 to $44,999 | 2 (1.7%) | 3 (1.3%) |
| $45,000 to $49,999 | 3 (2.5%) | 0 (0.0%) |
| $50,000 to $54,999 | 3 (2.5%) | 0 (0.0%) |
| $55,000 to $64,999 | 5 (4.1%) | 0 (0.0%) |
| $65,000 to $74,999 | 0 (0.0%) | 4 (1.8%) |
| $75,000 to $99,999 | 6 (5.0%) | 21 (9.2%) |
| $100,000+ | 5 (4.1%) | 6 (2.6%) |
| Total | 121 (100.0%) | 228 (100.0%) |
Earnings by Sex by Educational Attainment in Klamath
Average earnings in Klamath are $16,944 for men and $14,926 for women, a difference of 11.9%. Men with an educational attainment of less than high school enjoy the highest average annual earnings of $36,250, while those with high school diploma education earn the least with $26,875. Women with an educational attainment of high school diploma earn the most with the average annual earnings of $24,375, while those with college or associate's degree education have the smallest earnings of $13,629.
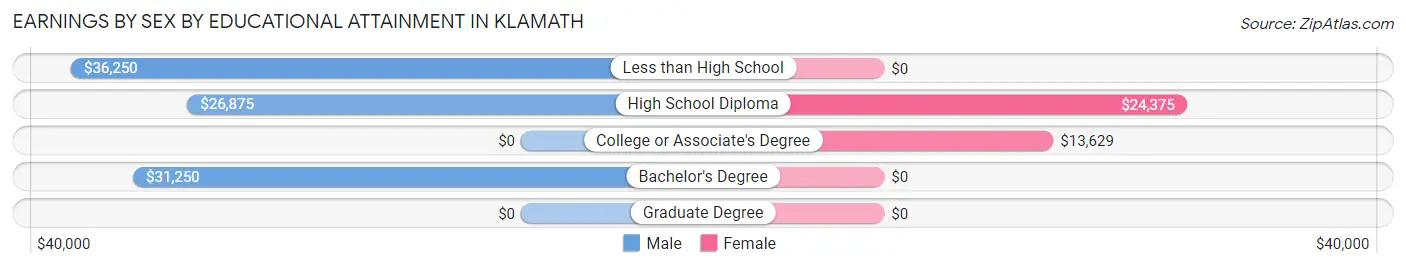
| Educational Attainment | Male Income | Female Income |
| Less than High School | $36,250 | $0 |
| High School Diploma | $26,875 | $24,375 |
| College or Associate's Degree | - | - |
| Bachelor's Degree | $31,250 | $0 |
| Graduate Degree | - | - |
| Total | $16,944 | $14,926 |
Family Income in Klamath
Family Income Brackets in Klamath
According to the Klamath family income data, there are 59 families falling into the $100,000 to $149,999 income range, which is the most common income bracket and makes up 24.7% of all families. Conversely, the $10,000 to $14,999 income bracket is the least frequent group with only 3 families (1.3%) belonging to this category.
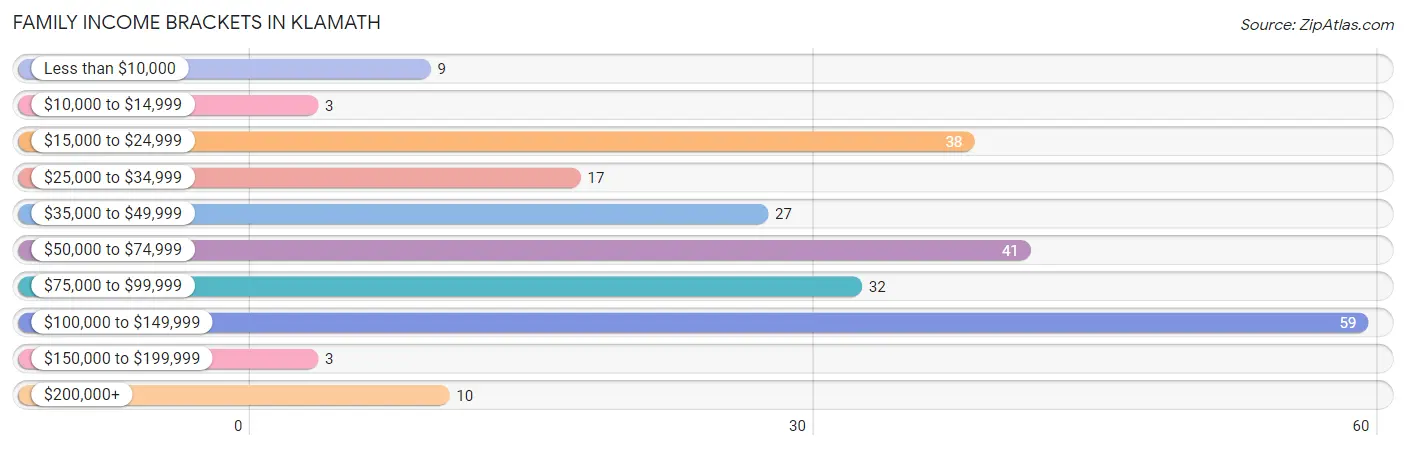
| Income Bracket | # Families | % Families |
| Less than $10,000 | 9 | 3.8% |
| $10,000 to $14,999 | 3 | 1.3% |
| $15,000 to $24,999 | 38 | 15.9% |
| $25,000 to $34,999 | 17 | 7.1% |
| $35,000 to $49,999 | 27 | 11.3% |
| $50,000 to $74,999 | 41 | 17.2% |
| $75,000 to $99,999 | 32 | 13.4% |
| $100,000 to $149,999 | 59 | 24.7% |
| $150,000 to $199,999 | 3 | 1.3% |
| $200,000+ | 10 | 4.2% |
Family Income by Famaliy Size in Klamath
5-person families (42 | 17.6%) account for the highest median family income in Klamath with $128,500 per family, while 5-person families (42 | 17.6%) have the highest median income of $25,700 per family member.
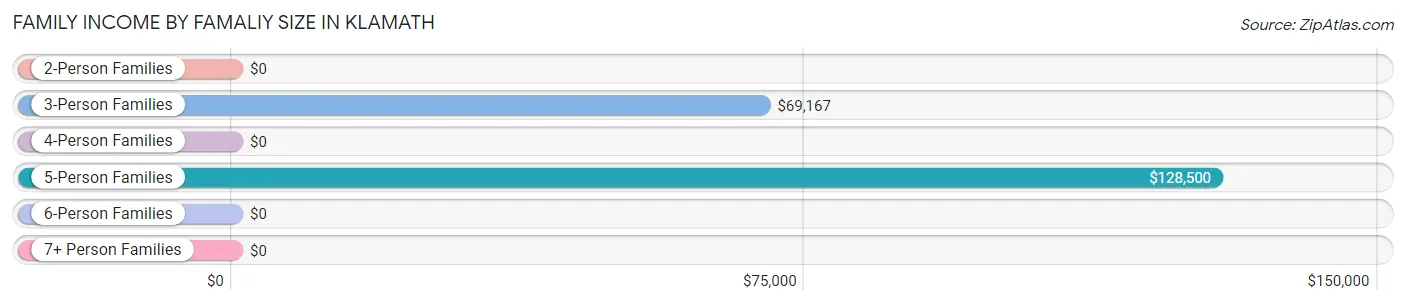
| Income Bracket | # Families | Median Income |
| 2-Person Families | 89 (37.2%) | $0 |
| 3-Person Families | 72 (30.1%) | $69,167 |
| 4-Person Families | 26 (10.9%) | $0 |
| 5-Person Families | 42 (17.6%) | $128,500 |
| 6-Person Families | 1 (0.4%) | $0 |
| 7+ Person Families | 9 (3.8%) | $0 |
| Total | 239 (100.0%) | $68,850 |
Family Income by Number of Earners in Klamath
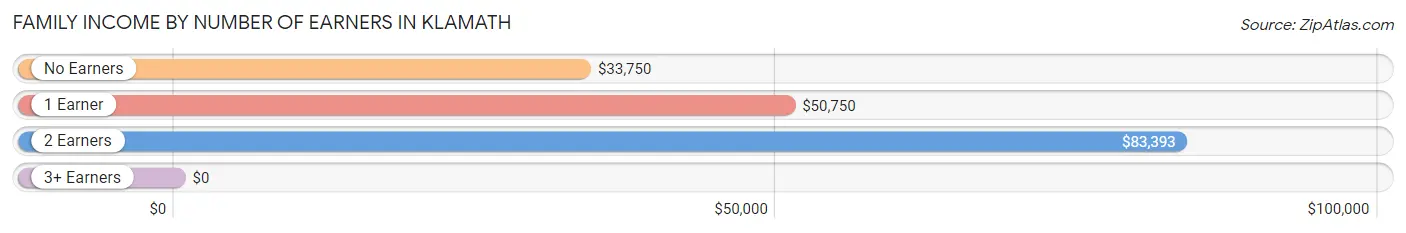
| Number of Earners | # Families | Median Income |
| No Earners | 51 (21.3%) | $33,750 |
| 1 Earner | 103 (43.1%) | $50,750 |
| 2 Earners | 77 (32.2%) | $83,393 |
| 3+ Earners | 8 (3.4%) | $0 |
| Total | 239 (100.0%) | $68,850 |
Household Income in Klamath
Household Income Brackets in Klamath
With 71 households falling in the category, the $15,000 to $24,999 income range is the most frequent in Klamath, accounting for 20.2% of all households. In contrast, only 5 households (1.4%) fall into the $150,000 to $199,999 income bracket, making it the least populous group.
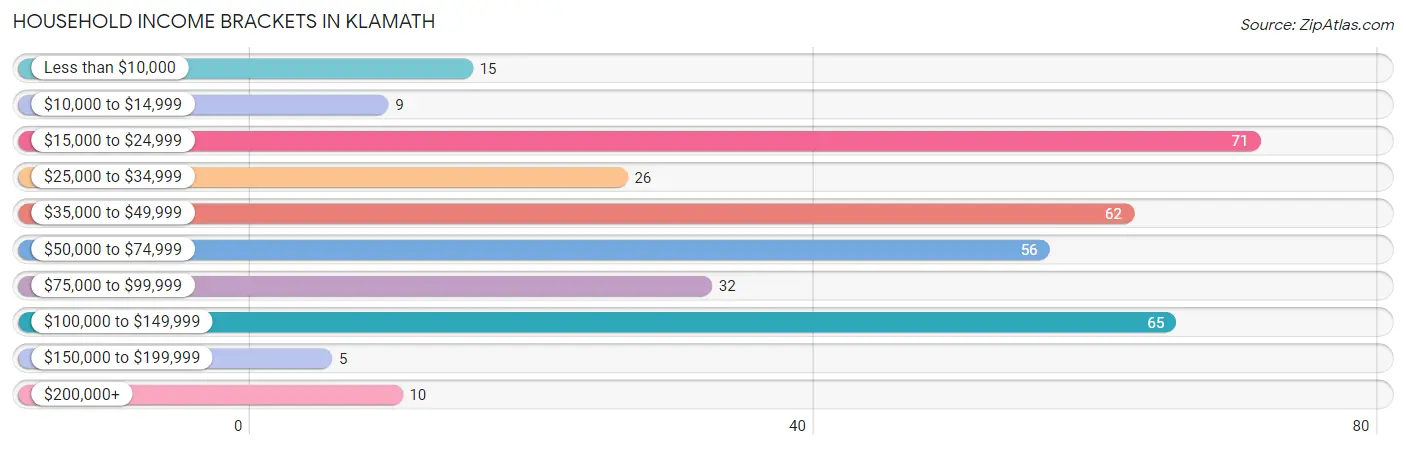
| Income Bracket | # Households | % Households |
| Less than $10,000 | 15 | 4.3% |
| $10,000 to $14,999 | 9 | 2.6% |
| $15,000 to $24,999 | 71 | 20.2% |
| $25,000 to $34,999 | 26 | 7.4% |
| $35,000 to $49,999 | 62 | 17.7% |
| $50,000 to $74,999 | 56 | 16.0% |
| $75,000 to $99,999 | 32 | 9.1% |
| $100,000 to $149,999 | 65 | 18.5% |
| $150,000 to $199,999 | 5 | 1.4% |
| $200,000+ | 10 | 2.8% |
Household Income by Householder Age in Klamath
The median household income in Klamath is $49,353, with the highest median household income of $68,750 found in the 65+ years age bracket for the primary householder. A total of 187 households (53.3%) fall into this category.
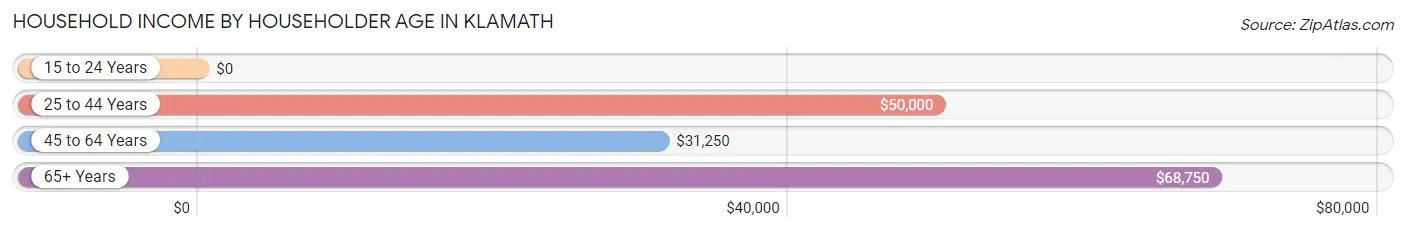
| Income Bracket | # Households | Median Income |
| 15 to 24 Years | 0 (0.0%) | $0 |
| 25 to 44 Years | 78 (22.2%) | $50,000 |
| 45 to 64 Years | 86 (24.5%) | $31,250 |
| 65+ Years | 187 (53.3%) | $68,750 |
| Total | 351 (100.0%) | $49,353 |
Poverty in Klamath
Income Below Poverty by Sex and Age in Klamath
With 24.7% poverty level for males and 26.4% for females among the residents of Klamath, 12 to 14 year old males and under 5 year old females are the most vulnerable to poverty, with 11 males (73.3%) and 18 females (100.0%) in their respective age groups living below the poverty level.
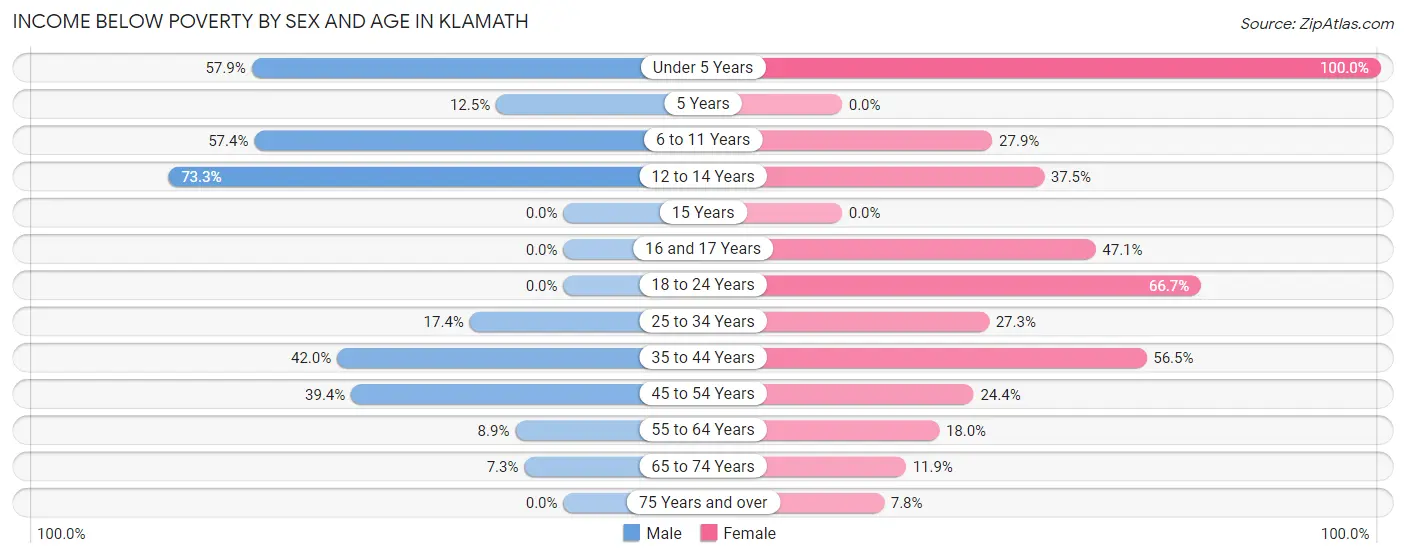
| Age Bracket | Male | Female |
| Under 5 Years | 11 (57.9%) | 18 (100.0%) |
| 5 Years | 3 (12.5%) | 0 (0.0%) |
| 6 to 11 Years | 35 (57.4%) | 12 (27.9%) |
| 12 to 14 Years | 11 (73.3%) | 3 (37.5%) |
| 15 Years | 0 (0.0%) | 0 (0.0%) |
| 16 and 17 Years | 0 (0.0%) | 8 (47.1%) |
| 18 to 24 Years | 0 (0.0%) | 12 (66.7%) |
| 25 to 34 Years | 4 (17.4%) | 15 (27.3%) |
| 35 to 44 Years | 21 (42.0%) | 13 (56.5%) |
| 45 to 54 Years | 13 (39.4%) | 22 (24.4%) |
| 55 to 64 Years | 5 (8.9%) | 11 (18.0%) |
| 65 to 74 Years | 5 (7.2%) | 7 (11.9%) |
| 75 Years and over | 0 (0.0%) | 6 (7.8%) |
| Total | 108 (24.7%) | 127 (26.4%) |
Income Above Poverty by Sex and Age in Klamath
According to the poverty statistics in Klamath, males aged 15 years and females aged 15 years are the age groups that are most secure financially, with 100.0% of males and 100.0% of females in these age groups living above the poverty line.
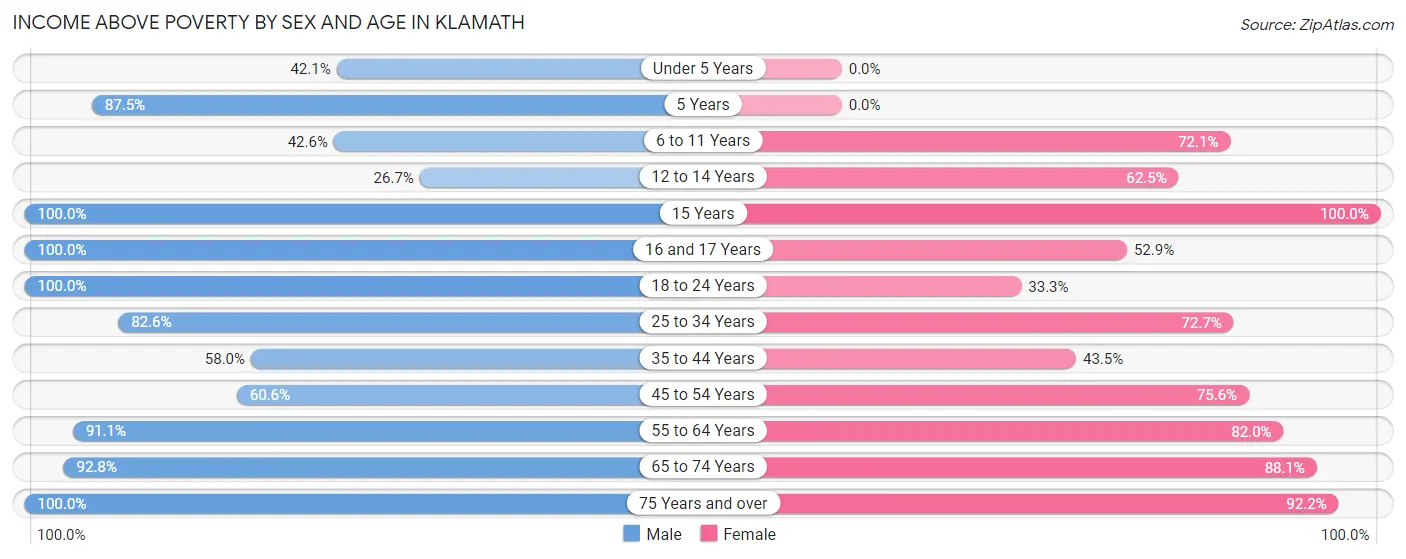
| Age Bracket | Male | Female |
| Under 5 Years | 8 (42.1%) | 0 (0.0%) |
| 5 Years | 21 (87.5%) | 0 (0.0%) |
| 6 to 11 Years | 26 (42.6%) | 31 (72.1%) |
| 12 to 14 Years | 4 (26.7%) | 5 (62.5%) |
| 15 Years | 7 (100.0%) | 12 (100.0%) |
| 16 and 17 Years | 3 (100.0%) | 9 (52.9%) |
| 18 to 24 Years | 5 (100.0%) | 6 (33.3%) |
| 25 to 34 Years | 19 (82.6%) | 40 (72.7%) |
| 35 to 44 Years | 29 (58.0%) | 10 (43.5%) |
| 45 to 54 Years | 20 (60.6%) | 68 (75.6%) |
| 55 to 64 Years | 51 (91.1%) | 50 (82.0%) |
| 65 to 74 Years | 64 (92.7%) | 52 (88.1%) |
| 75 Years and over | 73 (100.0%) | 71 (92.2%) |
| Total | 330 (75.3%) | 354 (73.6%) |
Income Below Poverty Among Married-Couple Families in Klamath
The poverty statistics for married-couple families in Klamath show that 12.0% or 17 of the total 142 families live below the poverty line. Families with 1 or 2 children have the highest poverty rate of 34.9%, comprising of 15 families. On the other hand, families with 3 or 4 children have the lowest poverty rate of 0.0%, which includes 0 families.
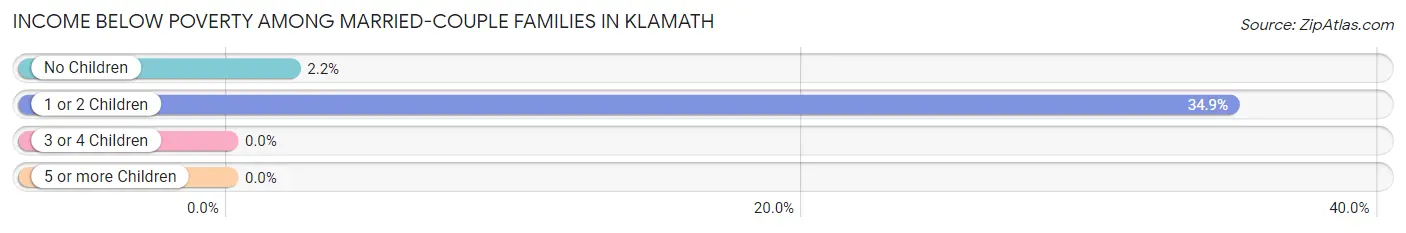
| Children | Above Poverty | Below Poverty |
| No Children | 90 (97.8%) | 2 (2.2%) |
| 1 or 2 Children | 28 (65.1%) | 15 (34.9%) |
| 3 or 4 Children | 2 (100.0%) | 0 (0.0%) |
| 5 or more Children | 5 (100.0%) | 0 (0.0%) |
| Total | 125 (88.0%) | 17 (12.0%) |
Income Below Poverty Among Single-Parent Households in Klamath
According to the poverty data in Klamath, 6.2% or 2 single-father households and 38.5% or 25 single-mother households are living below the poverty line. Among single-father households, those with 3 or 4 children have the highest poverty rate, with 2 households (100.0%) experiencing poverty. Likewise, among single-mother households, those with 3 or 4 children have the highest poverty rate, with 10 households (100.0%) falling below the poverty line.
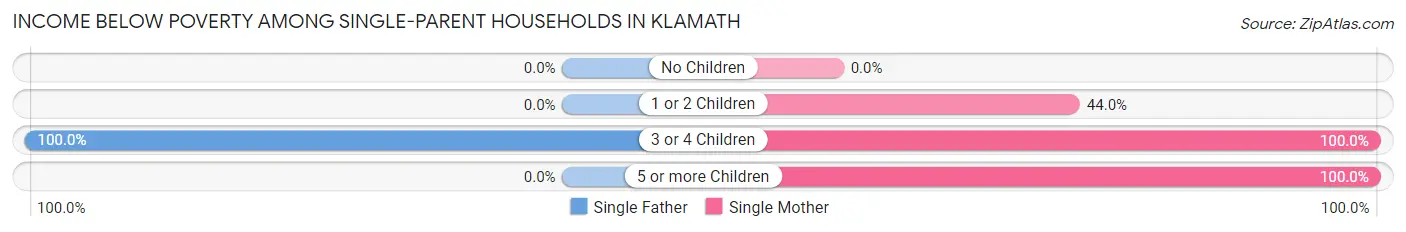
| Children | Single Father | Single Mother |
| No Children | 0 (0.0%) | 0 (0.0%) |
| 1 or 2 Children | 0 (0.0%) | 11 (44.0%) |
| 3 or 4 Children | 2 (100.0%) | 10 (100.0%) |
| 5 or more Children | 0 (0.0%) | 4 (100.0%) |
| Total | 2 (6.2%) | 25 (38.5%) |
Income Below Poverty Among Married-Couple vs Single-Parent Households in Klamath
The poverty data for Klamath shows that 17 of the married-couple family households (12.0%) and 27 of the single-parent households (27.8%) are living below the poverty level. Within the married-couple family households, those with 1 or 2 children have the highest poverty rate, with 15 households (34.9%) falling below the poverty line. Among the single-parent households, those with 3 or 4 children have the highest poverty rate, with 12 household (100.0%) living below poverty.
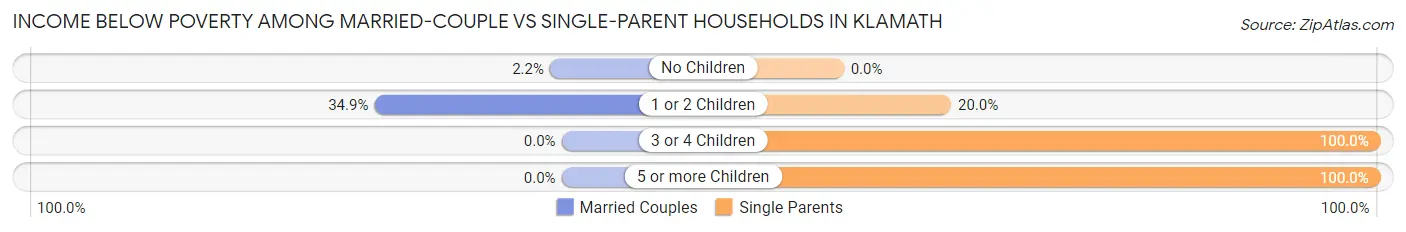
| Children | Married-Couple Families | Single-Parent Households |
| No Children | 2 (2.2%) | 0 (0.0%) |
| 1 or 2 Children | 15 (34.9%) | 11 (20.0%) |
| 3 or 4 Children | 0 (0.0%) | 12 (100.0%) |
| 5 or more Children | 0 (0.0%) | 4 (100.0%) |
| Total | 17 (12.0%) | 27 (27.8%) |
Race in Klamath
The most populous races in Klamath are White / Caucasian (469 | 50.8%), Native / Alaskan (320 | 34.6%), and Hispanic or Latino (117 | 12.7%).
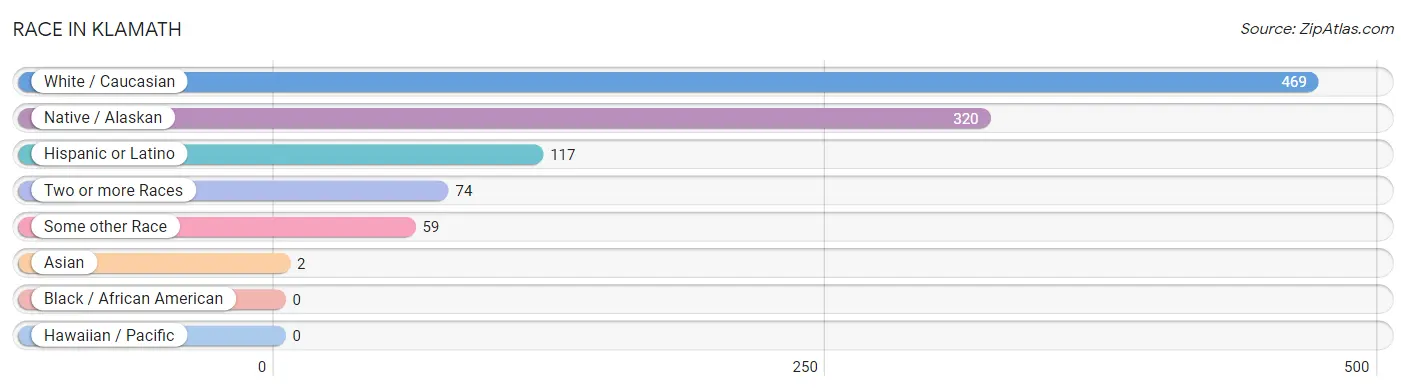
| Race | # Population | % Population |
| Asian | 2 | 0.2% |
| Black / African American | 0 | 0.0% |
| Hawaiian / Pacific | 0 | 0.0% |
| Hispanic or Latino | 117 | 12.7% |
| Native / Alaskan | 320 | 34.6% |
| White / Caucasian | 469 | 50.8% |
| Two or more Races | 74 | 8.0% |
| Some other Race | 59 | 6.4% |
| Total | 924 | 100.0% |
Ancestry in Klamath
The most populous ancestries reported in Klamath are Irish (143 | 15.5%), German (135 | 14.6%), Mexican (111 | 12.0%), English (106 | 11.5%), and Cherokee (63 | 6.8%), together accounting for 60.4% of all Klamath residents.
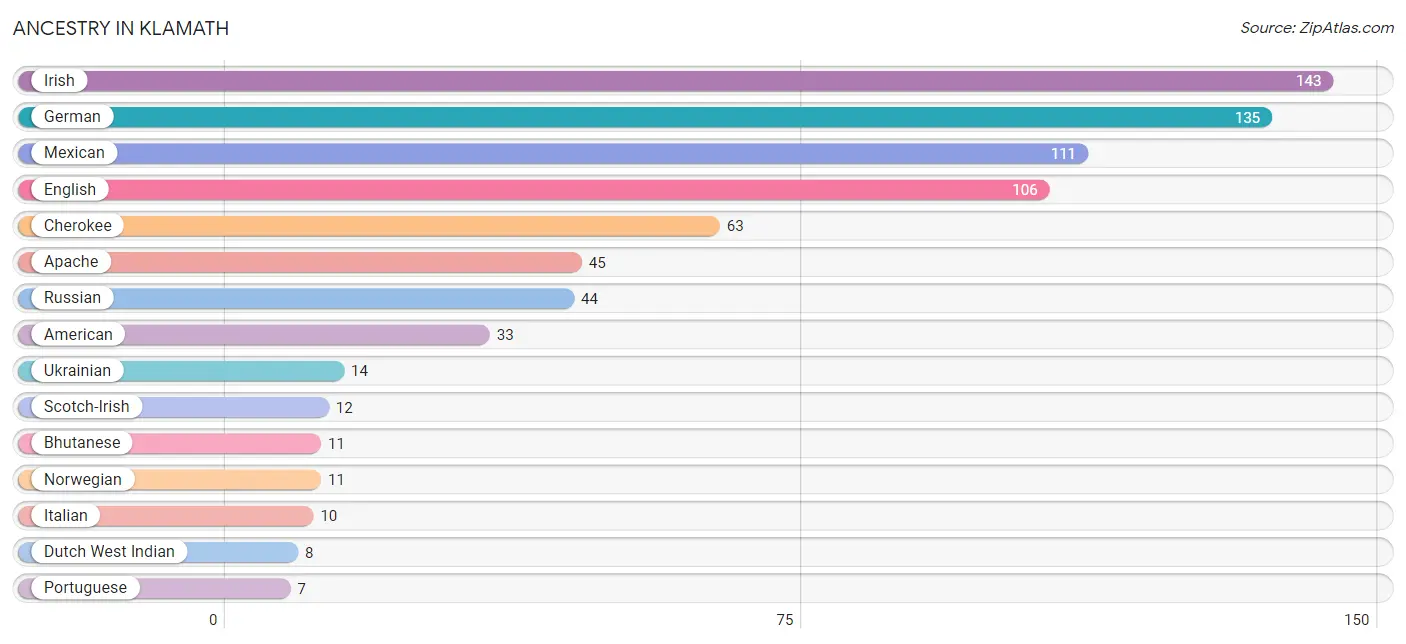
| Ancestry | # Population | % Population |
| American | 33 | 3.6% |
| Apache | 45 | 4.9% |
| Bhutanese | 11 | 1.2% |
| Blackfeet | 1 | 0.1% |
| Central American | 1 | 0.1% |
| Cherokee | 63 | 6.8% |
| Danish | 5 | 0.5% |
| Dutch | 3 | 0.3% |
| Dutch West Indian | 8 | 0.9% |
| English | 106 | 11.5% |
| European | 4 | 0.4% |
| French | 6 | 0.6% |
| French Canadian | 3 | 0.3% |
| German | 135 | 14.6% |
| Guatemalan | 1 | 0.1% |
| Indian (Asian) | 1 | 0.1% |
| Irish | 143 | 15.5% |
| Italian | 10 | 1.1% |
| Korean | 1 | 0.1% |
| Mexican | 111 | 12.0% |
| Native Hawaiian | 2 | 0.2% |
| Norwegian | 11 | 1.2% |
| Polish | 4 | 0.4% |
| Portuguese | 7 | 0.8% |
| Potawatomi | 3 | 0.3% |
| Russian | 44 | 4.8% |
| Samoan | 3 | 0.3% |
| Scandinavian | 7 | 0.8% |
| Scotch-Irish | 12 | 1.3% |
| Scottish | 2 | 0.2% |
| Spanish | 5 | 0.5% |
| Swedish | 6 | 0.6% |
| Swiss | 3 | 0.3% |
| Ukrainian | 14 | 1.5% | View All 34 Rows |
Immigrants in Klamath
The most numerous immigrant groups reported in Klamath came from Europe (14 | 1.5%), Eastern Europe (10 | 1.1%), Russia (10 | 1.1%), Asia (7 | 0.8%), and Western Asia (5 | 0.5%), together accounting for 5.0% of all Klamath residents.
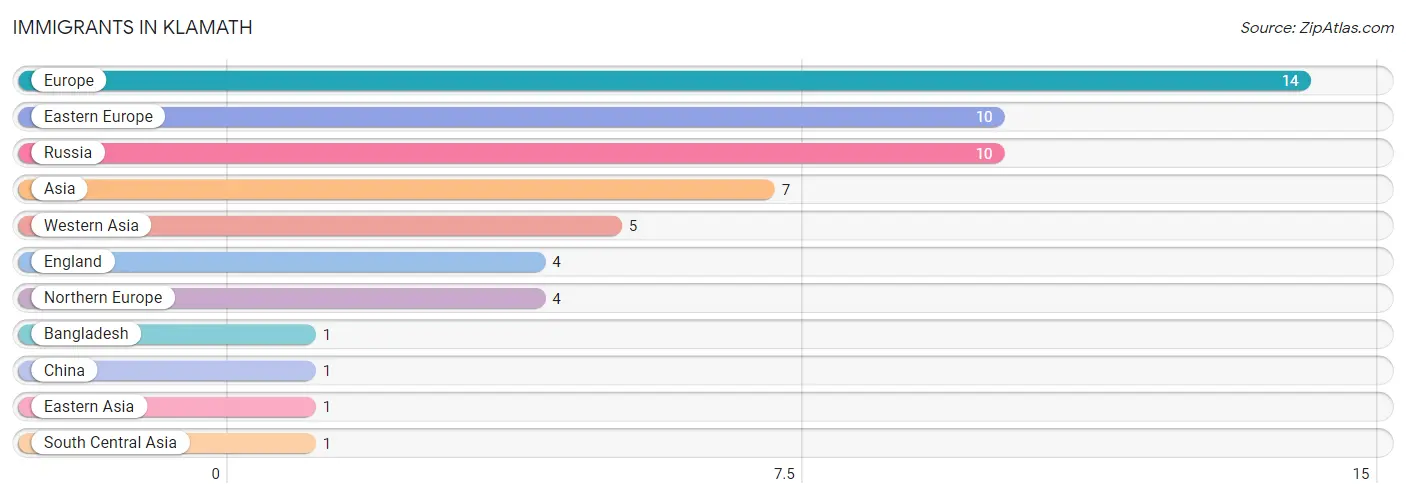
| Immigration Origin | # Population | % Population |
| Asia | 7 | 0.8% |
| Bangladesh | 1 | 0.1% |
| China | 1 | 0.1% |
| Eastern Asia | 1 | 0.1% |
| Eastern Europe | 10 | 1.1% |
| England | 4 | 0.4% |
| Europe | 14 | 1.5% |
| Northern Europe | 4 | 0.4% |
| Russia | 10 | 1.1% |
| South Central Asia | 1 | 0.1% |
| Western Asia | 5 | 0.5% | View All 11 Rows |
Sex and Age in Klamath
Sex and Age in Klamath
The most populous age groups in Klamath are 5 to 9 Years (77 | 17.4%) for men and 50 to 54 Years (79 | 16.4%) for women.
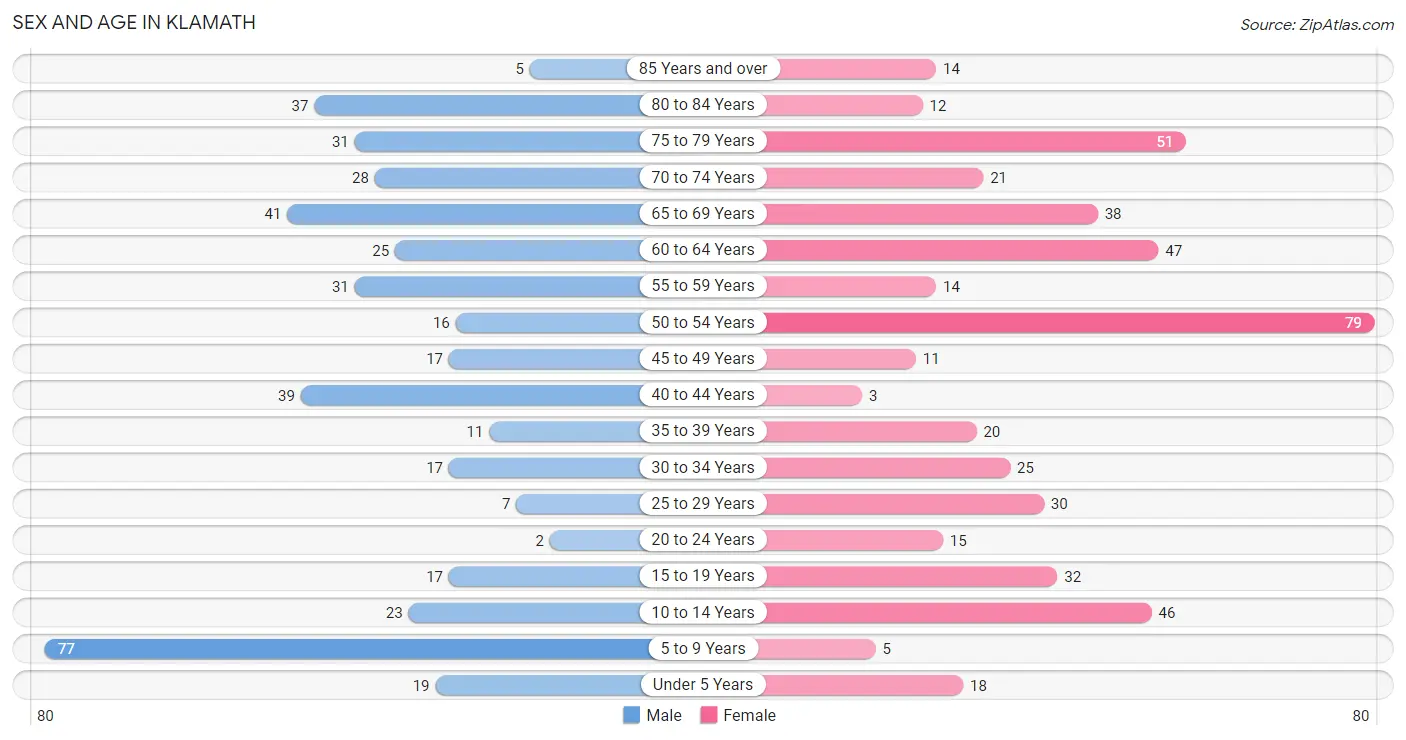
| Age Bracket | Male | Female |
| Under 5 Years | 19 (4.3%) | 18 (3.7%) |
| 5 to 9 Years | 77 (17.4%) | 5 (1.0%) |
| 10 to 14 Years | 23 (5.2%) | 46 (9.6%) |
| 15 to 19 Years | 17 (3.8%) | 32 (6.7%) |
| 20 to 24 Years | 2 (0.4%) | 15 (3.1%) |
| 25 to 29 Years | 7 (1.6%) | 30 (6.2%) |
| 30 to 34 Years | 17 (3.8%) | 25 (5.2%) |
| 35 to 39 Years | 11 (2.5%) | 20 (4.2%) |
| 40 to 44 Years | 39 (8.8%) | 3 (0.6%) |
| 45 to 49 Years | 17 (3.8%) | 11 (2.3%) |
| 50 to 54 Years | 16 (3.6%) | 79 (16.4%) |
| 55 to 59 Years | 31 (7.0%) | 14 (2.9%) |
| 60 to 64 Years | 25 (5.6%) | 47 (9.8%) |
| 65 to 69 Years | 41 (9.3%) | 38 (7.9%) |
| 70 to 74 Years | 28 (6.3%) | 21 (4.4%) |
| 75 to 79 Years | 31 (7.0%) | 51 (10.6%) |
| 80 to 84 Years | 37 (8.4%) | 12 (2.5%) |
| 85 Years and over | 5 (1.1%) | 14 (2.9%) |
| Total | 443 (100.0%) | 481 (100.0%) |
Families and Households in Klamath
Median Family Size in Klamath
The median family size in Klamath is 3.12 persons per family, with single female/mother families (65 | 27.2%) accounting for the largest median family size of 3.46 persons per family. On the other hand, married-couple families (142 | 59.4%) represent the smallest median family size with 2.92 persons per family.
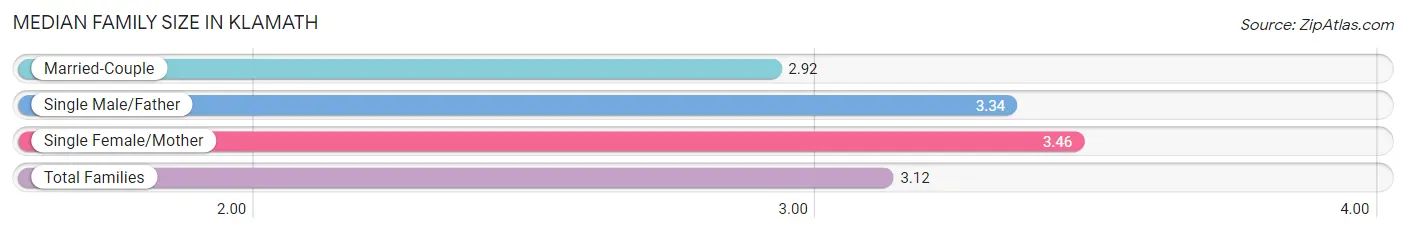
| Family Type | # Families | Family Size |
| Married-Couple | 142 (59.4%) | 2.92 |
| Single Male/Father | 32 (13.4%) | 3.34 |
| Single Female/Mother | 65 (27.2%) | 3.46 |
| Total Families | 239 (100.0%) | 3.12 |
Median Household Size in Klamath
The median household size in Klamath is 2.62 persons per household, with single female/mother households (65 | 18.5%) accounting for the largest median household size of 3.54 persons per household. non-family households (112 | 31.9%) represent the smallest median household size with 1.44 persons per household.
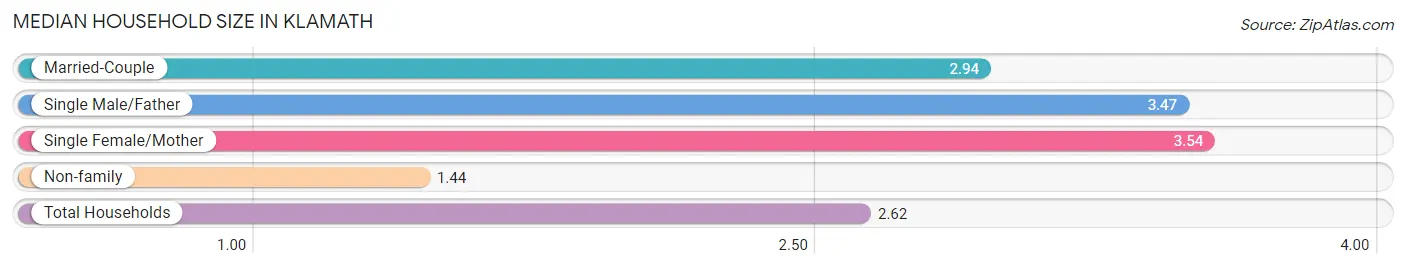
| Household Type | # Households | Household Size |
| Married-Couple | 142 (40.5%) | 2.94 |
| Single Male/Father | 32 (9.1%) | 3.47 |
| Single Female/Mother | 65 (18.5%) | 3.54 |
| Non-family | 112 (31.9%) | 1.44 |
| Total Households | 351 (100.0%) | 2.62 |
Household Size by Marriage Status in Klamath
Out of a total of 351 households in Klamath, 239 (68.1%) are family households, while 112 (31.9%) are nonfamily households. The most numerous type of family households are 2-person households, comprising 89, and the most common type of nonfamily households are 1-person households, comprising 79.
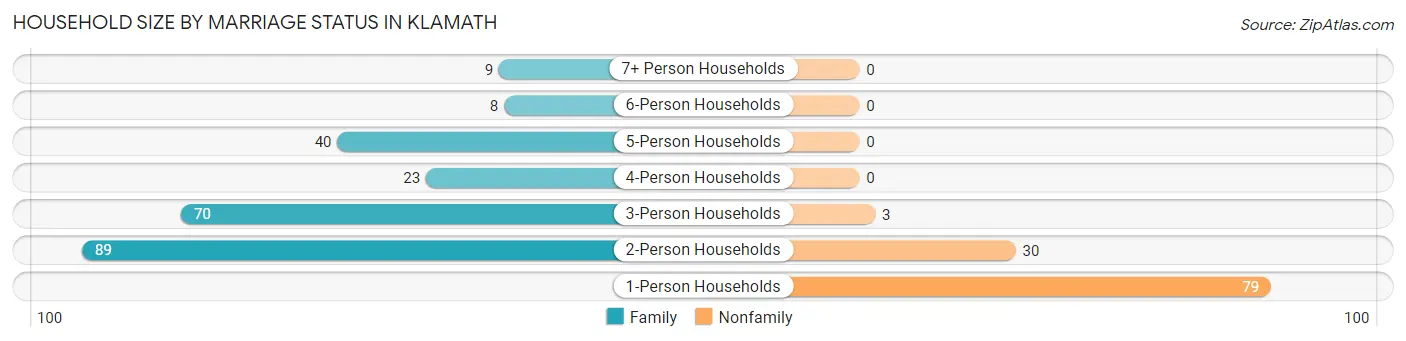
| Household Size | Family Households | Nonfamily Households |
| 1-Person Households | - | 79 (22.5%) |
| 2-Person Households | 89 (25.4%) | 30 (8.6%) |
| 3-Person Households | 70 (19.9%) | 3 (0.9%) |
| 4-Person Households | 23 (6.6%) | 0 (0.0%) |
| 5-Person Households | 40 (11.4%) | 0 (0.0%) |
| 6-Person Households | 8 (2.3%) | 0 (0.0%) |
| 7+ Person Households | 9 (2.6%) | 0 (0.0%) |
| Total | 239 (68.1%) | 112 (31.9%) |
Female Fertility in Klamath
Fertility by Age in Klamath
Average fertility rate in Klamath is 125.0 births per 1,000 women. Women in the age bracket of 15 to 19 years have the highest fertility rate with 250.0 births per 1,000 women. Women in the age bracket of 20 to 34 years acount for 52.9% of all women with births.
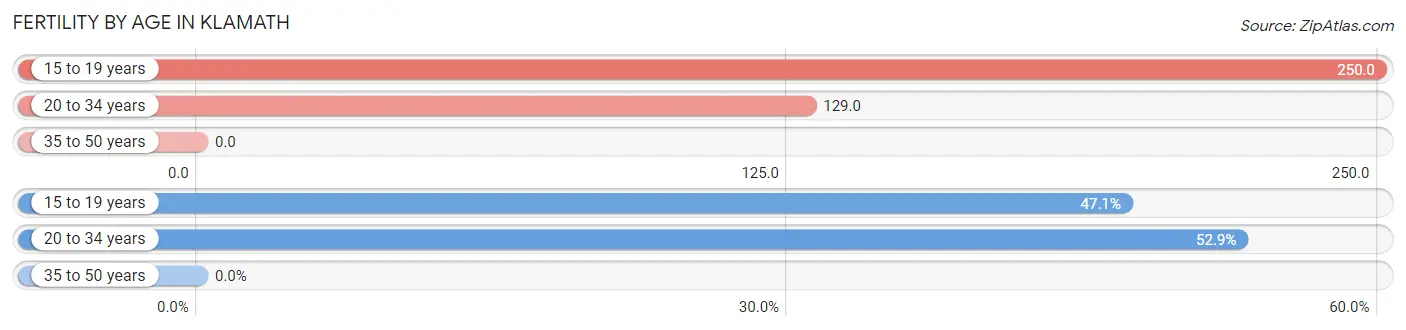
| Age Bracket | Women with Births | Births / 1,000 Women |
| 15 to 19 years | 8 (47.1%) | 250.0 |
| 20 to 34 years | 9 (52.9%) | 129.0 |
| 35 to 50 years | 0 (0.0%) | 0.0 |
| Total | 17 (100.0%) | 125.0 |
Fertility by Age by Marriage Status in Klamath
52.9% of women with births (17) in Klamath are married. The highest percentage of unmarried women with births falls into 15 to 19 years age bracket with 100.0% of them unmarried at the time of birth, while the lowest percentage of unmarried women with births belong to 20 to 34 years age bracket with 0.0% of them unmarried.
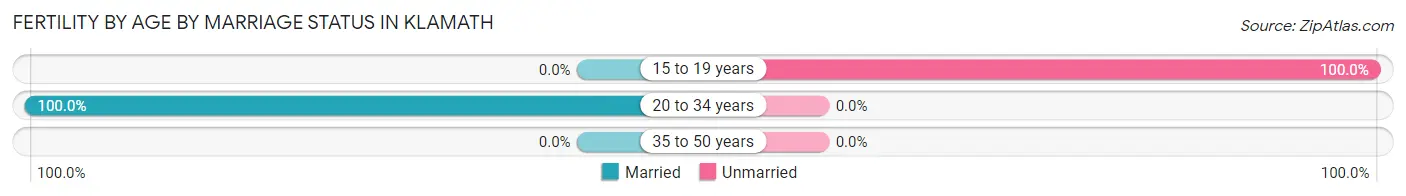
| Age Bracket | Married | Unmarried |
| 15 to 19 years | 0 (0.0%) | 8 (100.0%) |
| 20 to 34 years | 9 (100.0%) | 0 (0.0%) |
| 35 to 50 years | 0 (0.0%) | 0 (0.0%) |
| Total | 9 (52.9%) | 8 (47.1%) |
Fertility by Education in Klamath
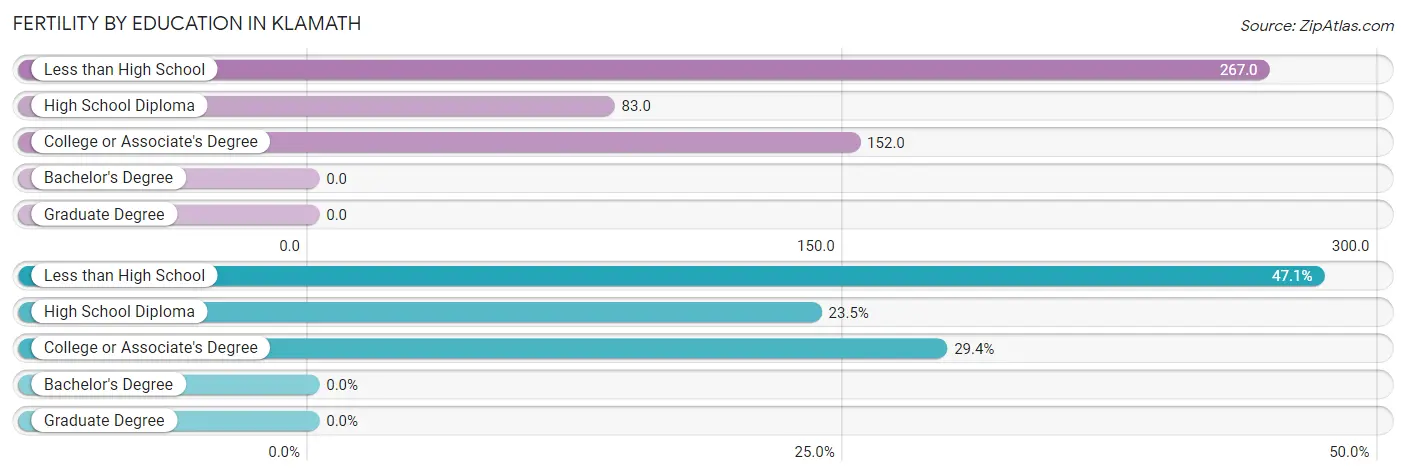
| Educational Attainment | Women with Births | Births / 1,000 Women |
| Less than High School | 8 (47.1%) | 267.0 |
| High School Diploma | 4 (23.5%) | 83.0 |
| College or Associate's Degree | 5 (29.4%) | 152.0 |
| Bachelor's Degree | 0 (0.0%) | 0.0 |
| Graduate Degree | 0 (0.0%) | 0.0 |
| Total | 17 (100.0%) | 125.0 |
Fertility by Education by Marriage Status in Klamath
47.1% of women with births in Klamath are unmarried. Women with the educational attainment of high school diploma are most likely to be married with 100.0% of them married at childbirth, while women with the educational attainment of less than high school are least likely to be married with 100.0% of them unmarried at childbirth.
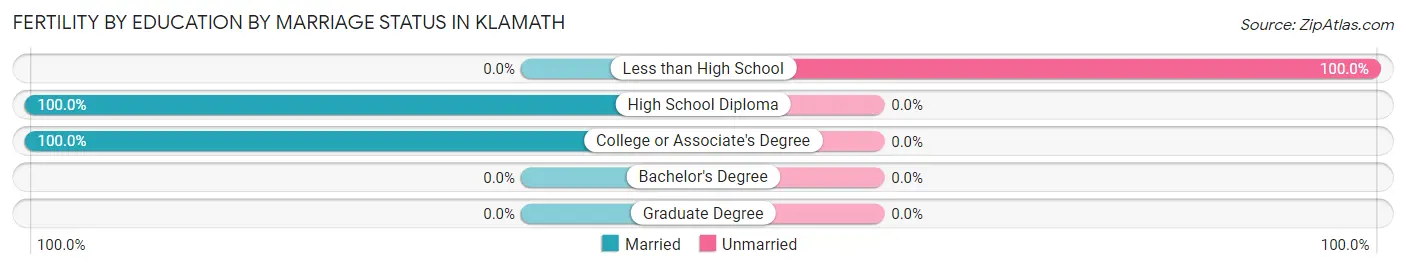
| Educational Attainment | Married | Unmarried |
| Less than High School | 0 (0.0%) | 8 (100.0%) |
| High School Diploma | 4 (100.0%) | 0 (0.0%) |
| College or Associate's Degree | 5 (100.0%) | 0 (0.0%) |
| Bachelor's Degree | 0 (0.0%) | 0 (0.0%) |
| Graduate Degree | 0 (0.0%) | 0 (0.0%) |
| Total | 9 (52.9%) | 8 (47.1%) |
Employment Characteristics in Klamath
Employment by Class of Employer in Klamath
Among the 237 employed individuals in Klamath, private company employees (63 | 26.6%), local government employees (59 | 24.9%), and self-employed (not incorporated) (56 | 23.6%) make up the most common classes of employment.
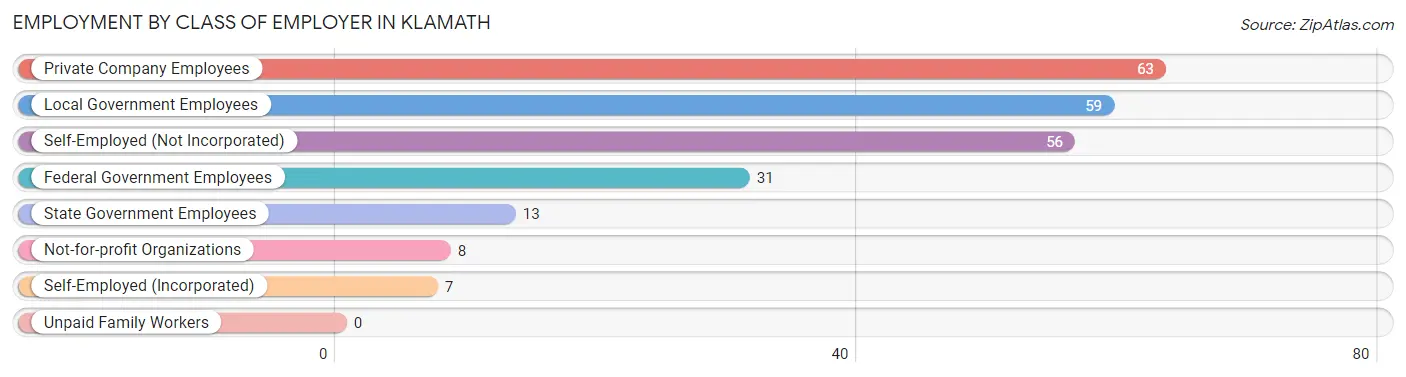
| Employer Class | # Employees | % Employees |
| Private Company Employees | 63 | 26.6% |
| Self-Employed (Incorporated) | 7 | 2.9% |
| Self-Employed (Not Incorporated) | 56 | 23.6% |
| Not-for-profit Organizations | 8 | 3.4% |
| Local Government Employees | 59 | 24.9% |
| State Government Employees | 13 | 5.5% |
| Federal Government Employees | 31 | 13.1% |
| Unpaid Family Workers | 0 | 0.0% |
| Total | 237 | 100.0% |
Employment Status by Age in Klamath
According to the labor force statistics for Klamath, out of the total population over 16 years of age (716), 41.2% or 295 individuals are in the labor force, with 18.0% or 53 of them unemployed. The age group with the highest labor force participation rate is 20 to 24 years, with 100.0% or 17 individuals in the labor force. Within the labor force, the 45 to 54 years age range has the highest percentage of unemployed individuals, with 46.3% or 37 of them being unemployed.
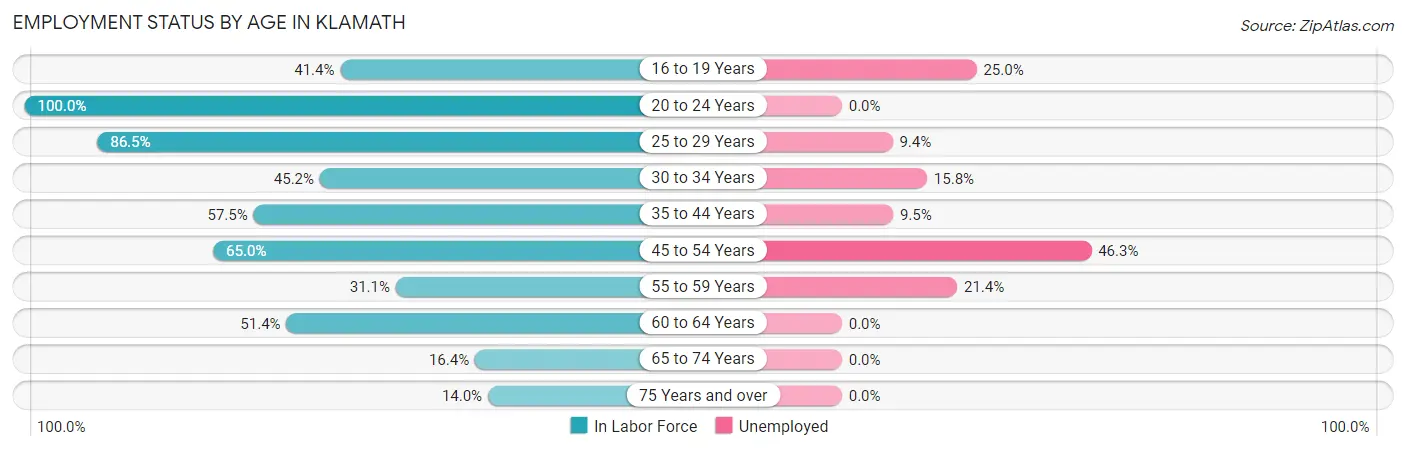
| Age Bracket | In Labor Force | Unemployed |
| 16 to 19 Years | 12 (41.4%) | 3 (25.0%) |
| 20 to 24 Years | 17 (100.0%) | 0 (0.0%) |
| 25 to 29 Years | 32 (86.5%) | 3 (9.4%) |
| 30 to 34 Years | 19 (45.2%) | 3 (15.8%) |
| 35 to 44 Years | 42 (57.5%) | 4 (9.5%) |
| 45 to 54 Years | 80 (65.0%) | 37 (46.3%) |
| 55 to 59 Years | 14 (31.1%) | 3 (21.4%) |
| 60 to 64 Years | 37 (51.4%) | 0 (0.0%) |
| 65 to 74 Years | 21 (16.4%) | 0 (0.0%) |
| 75 Years and over | 21 (14.0%) | 0 (0.0%) |
| Total | 295 (41.2%) | 53 (18.0%) |
Employment Status by Educational Attainment in Klamath
According to labor force statistics for Klamath, 57.1% of individuals (224) out of the total population between 25 and 64 years of age (392) are in the labor force, with 22.3% or 50 of them being unemployed. The group with the highest labor force participation rate are those with the educational attainment of college / associate degree, with 70.8% or 119 individuals in the labor force. Within the labor force, individuals with less than high school education have the highest percentage of unemployment, with 35.7% or 5 of them being unemployed.
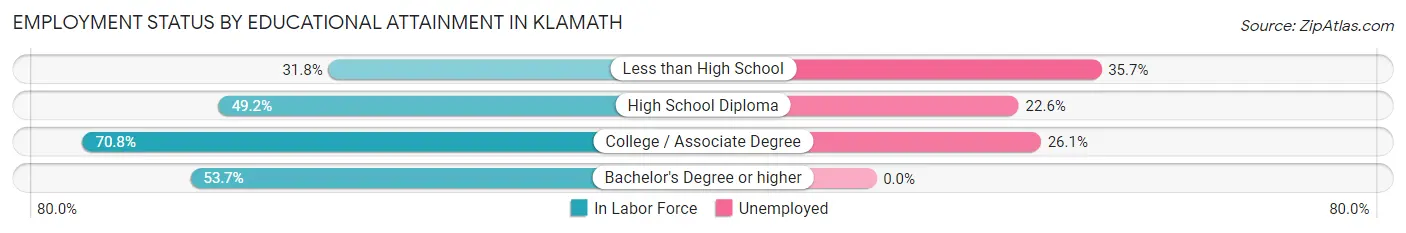
| Educational Attainment | In Labor Force | Unemployed |
| Less than High School | 14 (31.8%) | 16 (35.7%) |
| High School Diploma | 62 (49.2%) | 28 (22.6%) |
| College / Associate Degree | 119 (70.8%) | 44 (26.1%) |
| Bachelor's Degree or higher | 29 (53.7%) | 0 (0.0%) |
| Total | 224 (57.1%) | 87 (22.3%) |
Employment Occupations by Sex in Klamath
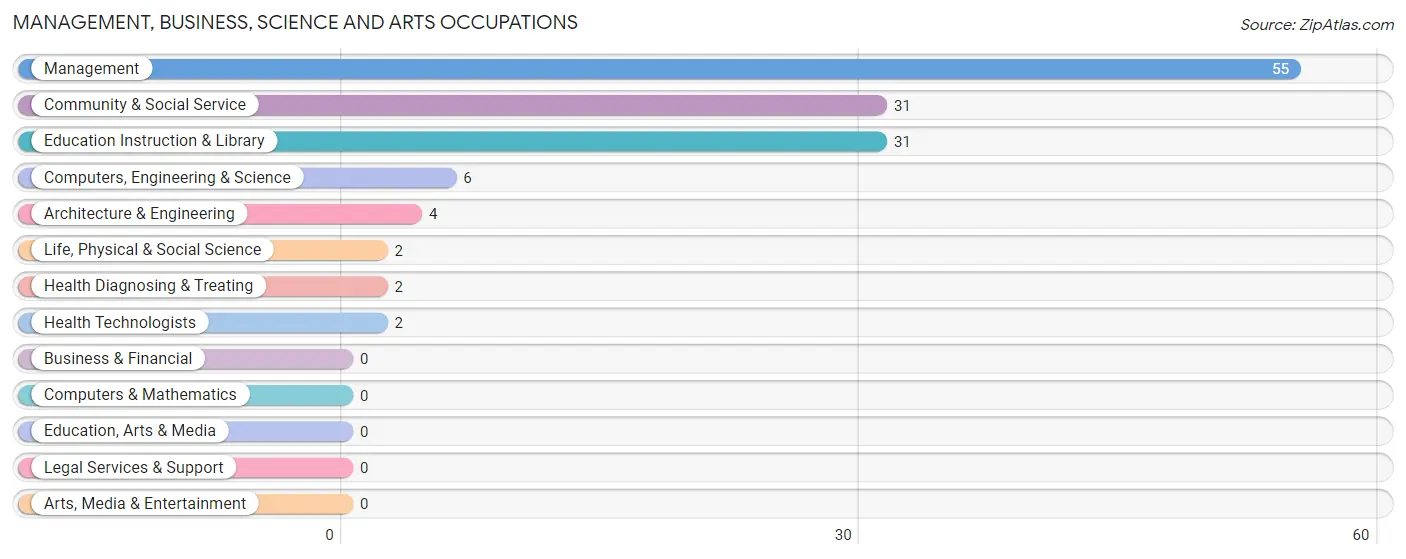
Management, Business, Science and Arts Occupations
The most common Management, Business, Science and Arts occupations in Klamath are Management (55 | 22.7%), Community & Social Service (31 | 12.8%), Education Instruction & Library (31 | 12.8%), Computers, Engineering & Science (6 | 2.5%), and Architecture & Engineering (4 | 1.7%).
Management, Business, Science and Arts Occupations by Sex
Within the Management, Business, Science and Arts occupations in Klamath, the most male-oriented occupations are Computers, Engineering & Science (100.0%), Architecture & Engineering (100.0%), and Life, Physical & Social Science (100.0%), while the most female-oriented occupations are Health Diagnosing & Treating (100.0%), Health Technologists (100.0%), and Community & Social Service (93.5%).
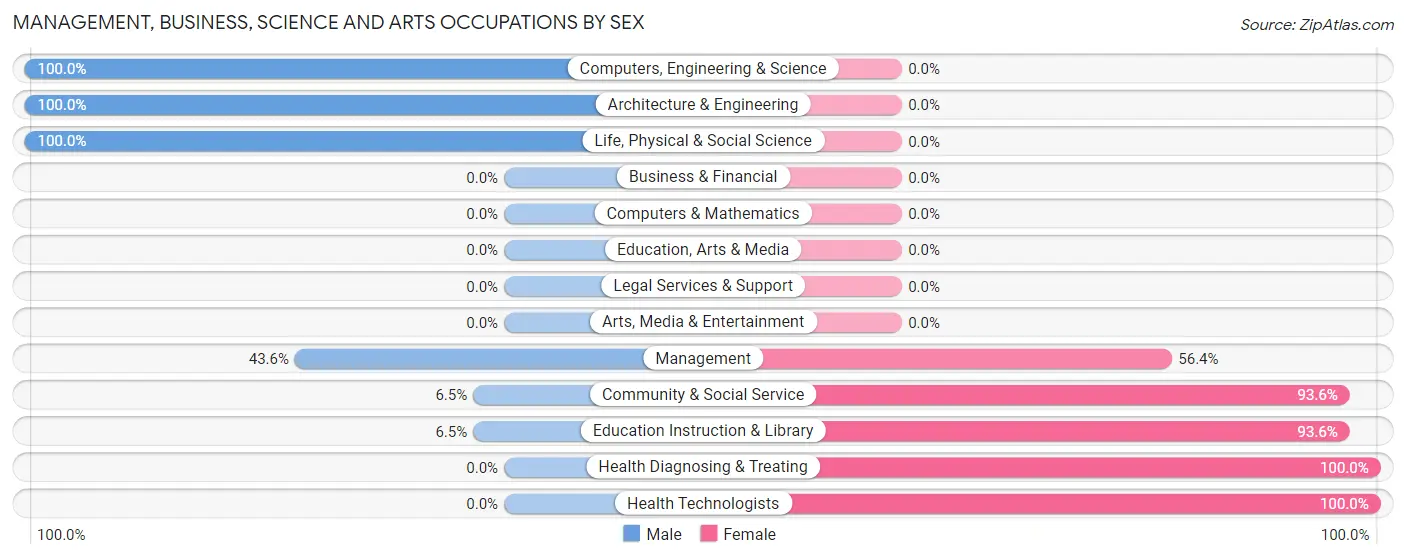
| Occupation | Male | Female |
| Management | 24 (43.6%) | 31 (56.4%) |
| Business & Financial | 0 (0.0%) | 0 (0.0%) |
| Computers, Engineering & Science | 6 (100.0%) | 0 (0.0%) |
| Computers & Mathematics | 0 (0.0%) | 0 (0.0%) |
| Architecture & Engineering | 4 (100.0%) | 0 (0.0%) |
| Life, Physical & Social Science | 2 (100.0%) | 0 (0.0%) |
| Community & Social Service | 2 (6.5%) | 29 (93.5%) |
| Education, Arts & Media | 0 (0.0%) | 0 (0.0%) |
| Legal Services & Support | 0 (0.0%) | 0 (0.0%) |
| Education Instruction & Library | 2 (6.5%) | 29 (93.5%) |
| Arts, Media & Entertainment | 0 (0.0%) | 0 (0.0%) |
| Health Diagnosing & Treating | 0 (0.0%) | 2 (100.0%) |
| Health Technologists | 0 (0.0%) | 2 (100.0%) |
| Total (Category) | 32 (34.0%) | 62 (66.0%) |
| Total (Overall) | 85 (35.1%) | 157 (64.9%) |
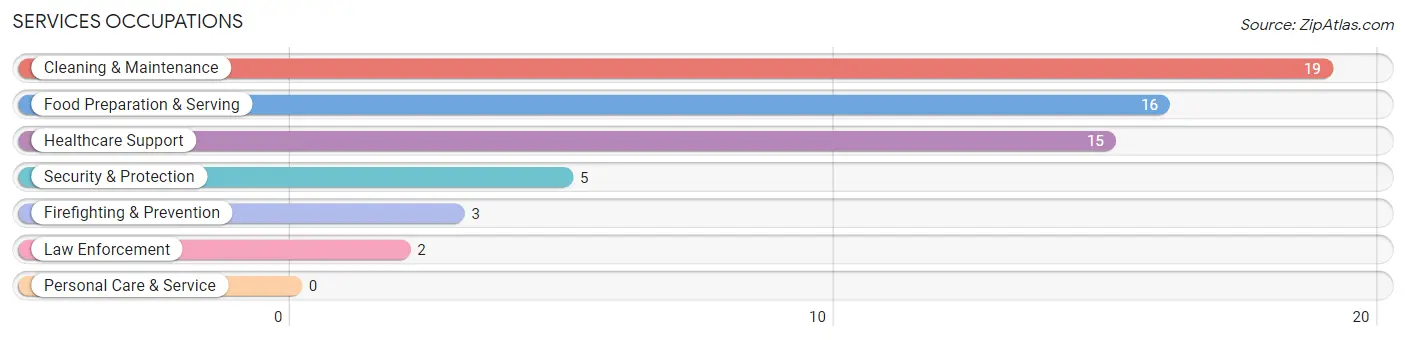
Services Occupations
The most common Services occupations in Klamath are Cleaning & Maintenance (19 | 7.9%), Food Preparation & Serving (16 | 6.6%), Healthcare Support (15 | 6.2%), Security & Protection (5 | 2.1%), and Firefighting & Prevention (3 | 1.2%).
Services Occupations by Sex
Within the Services occupations in Klamath, the most male-oriented occupations are Law Enforcement (100.0%), Security & Protection (40.0%), and Healthcare Support (33.3%), while the most female-oriented occupations are Firefighting & Prevention (100.0%), Food Preparation & Serving (93.8%), and Cleaning & Maintenance (78.9%).
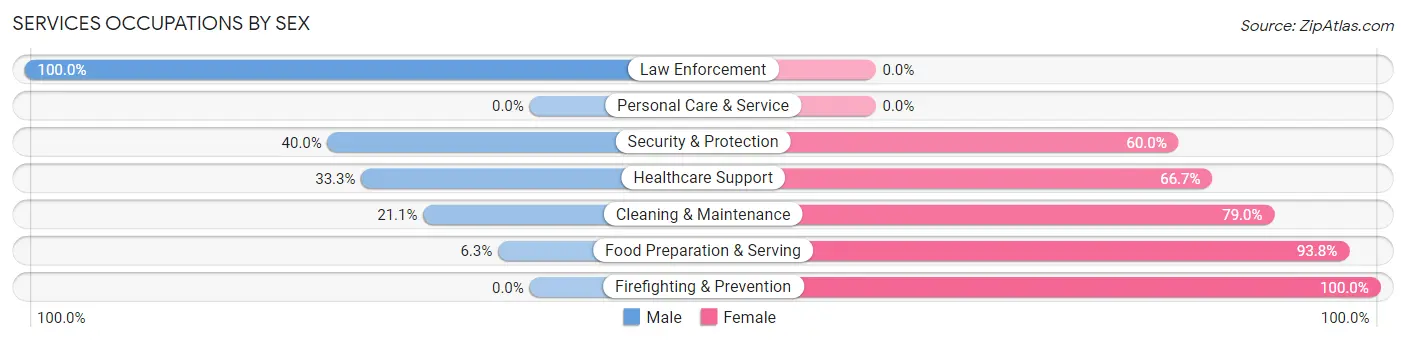
| Occupation | Male | Female |
| Healthcare Support | 5 (33.3%) | 10 (66.7%) |
| Security & Protection | 2 (40.0%) | 3 (60.0%) |
| Firefighting & Prevention | 0 (0.0%) | 3 (100.0%) |
| Law Enforcement | 2 (100.0%) | 0 (0.0%) |
| Food Preparation & Serving | 1 (6.2%) | 15 (93.8%) |
| Cleaning & Maintenance | 4 (21.0%) | 15 (78.9%) |
| Personal Care & Service | 0 (0.0%) | 0 (0.0%) |
| Total (Category) | 12 (21.8%) | 43 (78.2%) |
| Total (Overall) | 85 (35.1%) | 157 (64.9%) |
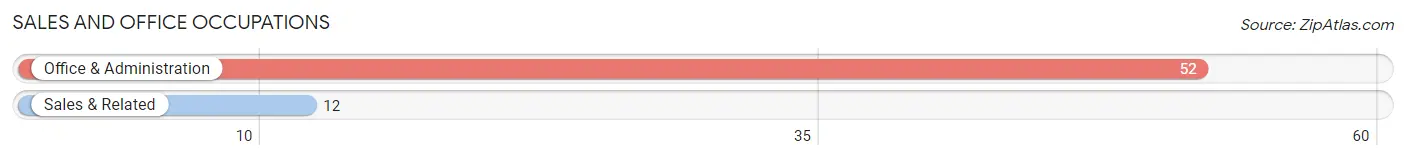
Sales and Office Occupations
The most common Sales and Office occupations in Klamath are Office & Administration (52 | 21.5%), and Sales & Related (12 | 5.0%).
Sales and Office Occupations by Sex
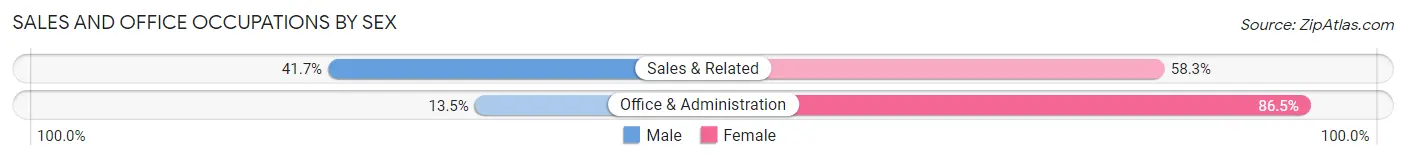
| Occupation | Male | Female |
| Sales & Related | 5 (41.7%) | 7 (58.3%) |
| Office & Administration | 7 (13.5%) | 45 (86.5%) |
| Total (Category) | 12 (18.8%) | 52 (81.2%) |
| Total (Overall) | 85 (35.1%) | 157 (64.9%) |
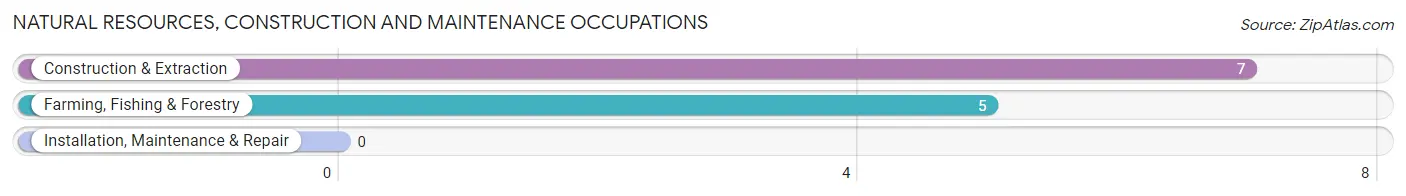
Natural Resources, Construction and Maintenance Occupations
The most common Natural Resources, Construction and Maintenance occupations in Klamath are Construction & Extraction (7 | 2.9%), and Farming, Fishing & Forestry (5 | 2.1%).
Natural Resources, Construction and Maintenance Occupations by Sex
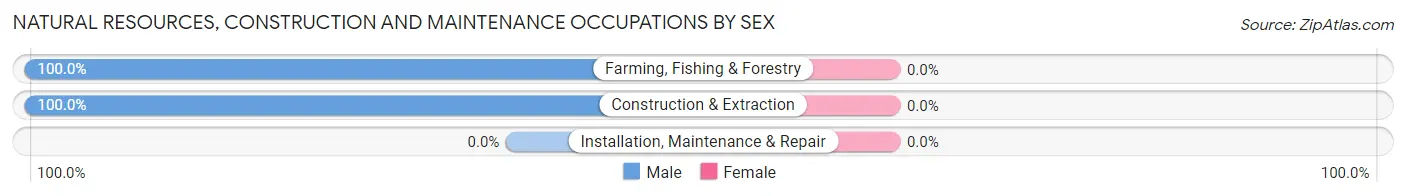
| Occupation | Male | Female |
| Farming, Fishing & Forestry | 5 (100.0%) | 0 (0.0%) |
| Construction & Extraction | 7 (100.0%) | 0 (0.0%) |
| Installation, Maintenance & Repair | 0 (0.0%) | 0 (0.0%) |
| Total (Category) | 12 (100.0%) | 0 (0.0%) |
| Total (Overall) | 85 (35.1%) | 157 (64.9%) |
Production, Transportation and Moving Occupations
The most common Production, Transportation and Moving occupations in Klamath are Transportation (10 | 4.1%), Production (4 | 1.7%), and Material Moving (3 | 1.2%).
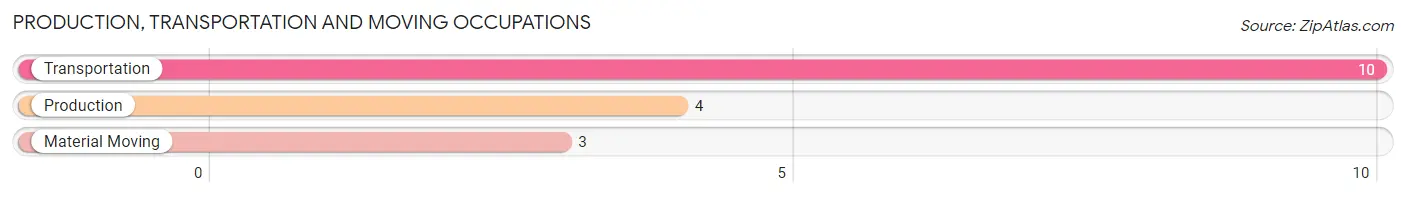
Production, Transportation and Moving Occupations by Sex
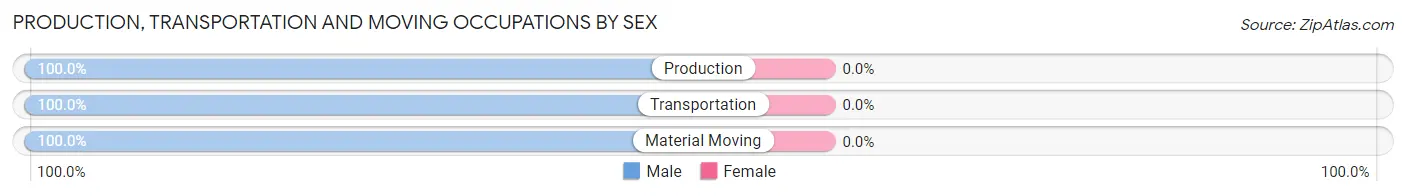
| Occupation | Male | Female |
| Production | 4 (100.0%) | 0 (0.0%) |
| Transportation | 10 (100.0%) | 0 (0.0%) |
| Material Moving | 3 (100.0%) | 0 (0.0%) |
| Total (Category) | 17 (100.0%) | 0 (0.0%) |
| Total (Overall) | 85 (35.1%) | 157 (64.9%) |
Employment Industries by Sex in Klamath
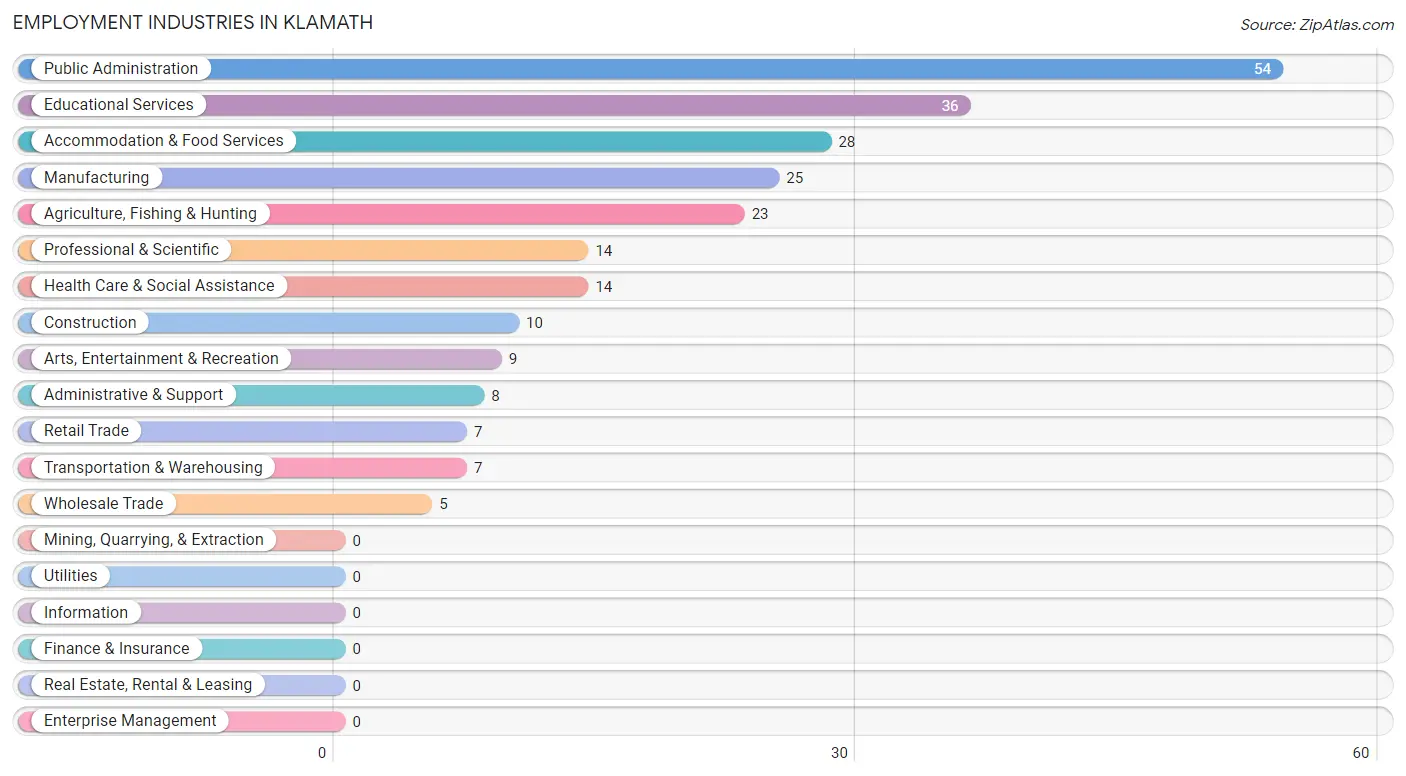
Employment Industries in Klamath
The major employment industries in Klamath include Public Administration (54 | 22.3%), Educational Services (36 | 14.9%), Accommodation & Food Services (28 | 11.6%), Manufacturing (25 | 10.3%), and Agriculture, Fishing & Hunting (23 | 9.5%).
Employment Industries by Sex in Klamath
The Klamath industries that see more men than women are Agriculture, Fishing & Hunting (100.0%), Construction (100.0%), and Wholesale Trade (100.0%), whereas the industries that tend to have a higher number of women are Retail Trade (100.0%), Administrative & Support (100.0%), and Educational Services (100.0%).
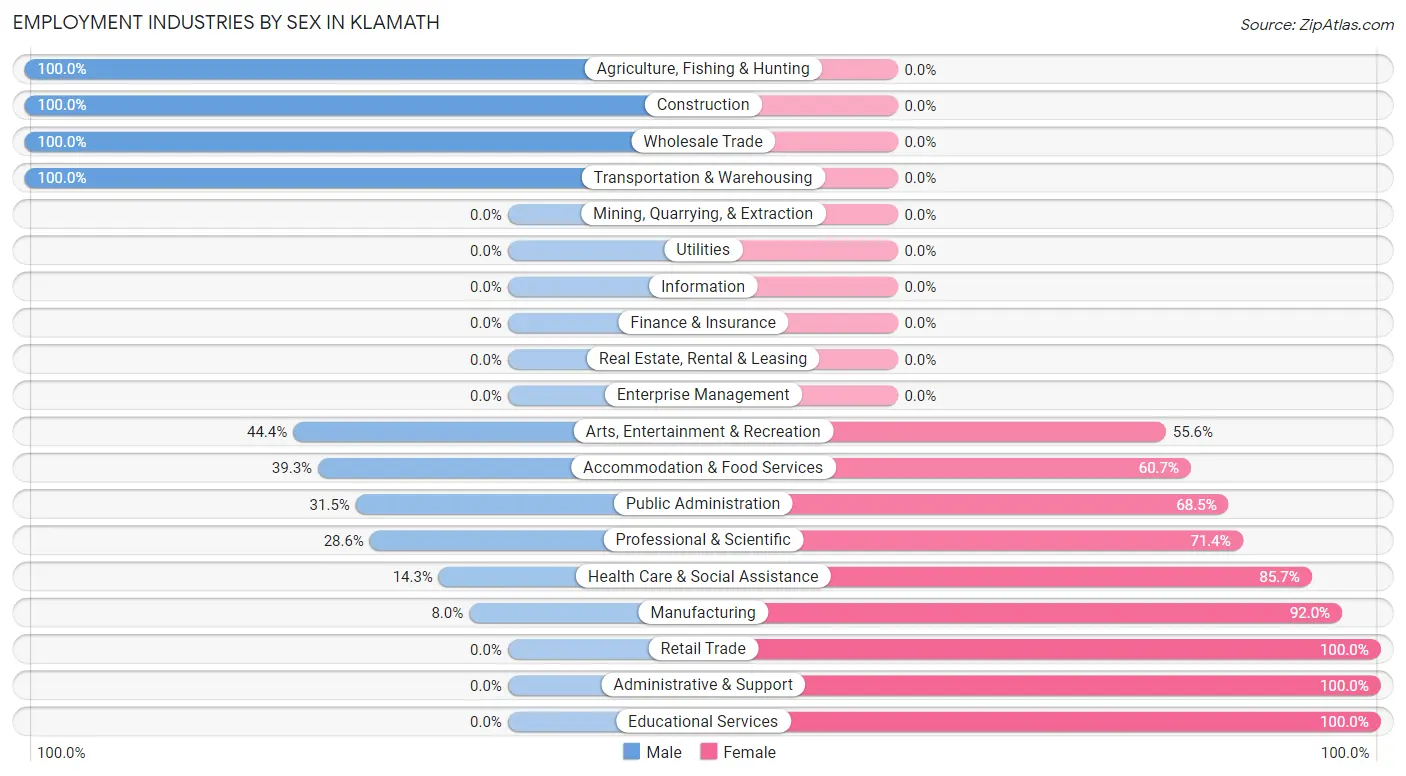
| Industry | Male | Female |
| Agriculture, Fishing & Hunting | 23 (100.0%) | 0 (0.0%) |
| Mining, Quarrying, & Extraction | 0 (0.0%) | 0 (0.0%) |
| Construction | 10 (100.0%) | 0 (0.0%) |
| Manufacturing | 2 (8.0%) | 23 (92.0%) |
| Wholesale Trade | 5 (100.0%) | 0 (0.0%) |
| Retail Trade | 0 (0.0%) | 7 (100.0%) |
| Transportation & Warehousing | 7 (100.0%) | 0 (0.0%) |
| Utilities | 0 (0.0%) | 0 (0.0%) |
| Information | 0 (0.0%) | 0 (0.0%) |
| Finance & Insurance | 0 (0.0%) | 0 (0.0%) |
| Real Estate, Rental & Leasing | 0 (0.0%) | 0 (0.0%) |
| Professional & Scientific | 4 (28.6%) | 10 (71.4%) |
| Enterprise Management | 0 (0.0%) | 0 (0.0%) |
| Administrative & Support | 0 (0.0%) | 8 (100.0%) |
| Educational Services | 0 (0.0%) | 36 (100.0%) |
| Health Care & Social Assistance | 2 (14.3%) | 12 (85.7%) |
| Arts, Entertainment & Recreation | 4 (44.4%) | 5 (55.6%) |
| Accommodation & Food Services | 11 (39.3%) | 17 (60.7%) |
| Public Administration | 17 (31.5%) | 37 (68.5%) |
| Total | 85 (35.1%) | 157 (64.9%) |
Education in Klamath
School Enrollment in Klamath
The most common levels of schooling among the 179 students in Klamath are middle school (60 | 33.5%), elementary school (59 | 33.0%), and high school (42 | 23.5%).
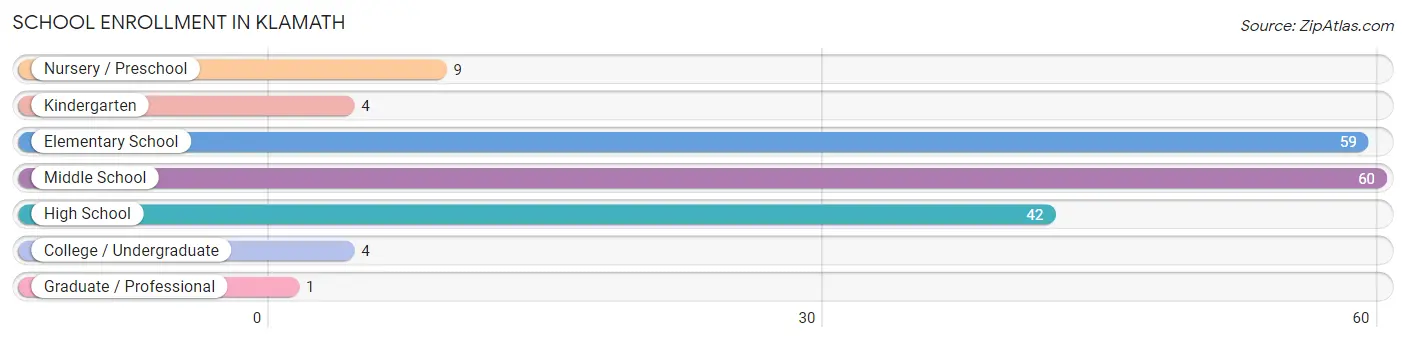
| School Level | # Students | % Students |
| Nursery / Preschool | 9 | 5.0% |
| Kindergarten | 4 | 2.2% |
| Elementary School | 59 | 33.0% |
| Middle School | 60 | 33.5% |
| High School | 42 | 23.5% |
| College / Undergraduate | 4 | 2.2% |
| Graduate / Professional | 1 | 0.6% |
| Total | 179 | 100.0% |
School Enrollment by Age by Funding Source in Klamath
Out of a total of 179 students who are enrolled in schools in Klamath, 41 (22.9%) attend a private institution, while the remaining 138 (77.1%) are enrolled in public schools. The age group of 25 to 34 year olds has the highest likelihood of being enrolled in private schools, with 1 (100.0% in the age bracket) enrolled. Conversely, the age group of 18 to 19 year olds has the lowest likelihood of being enrolled in a private school, with 4 (100.0% in the age bracket) attending a public institution.
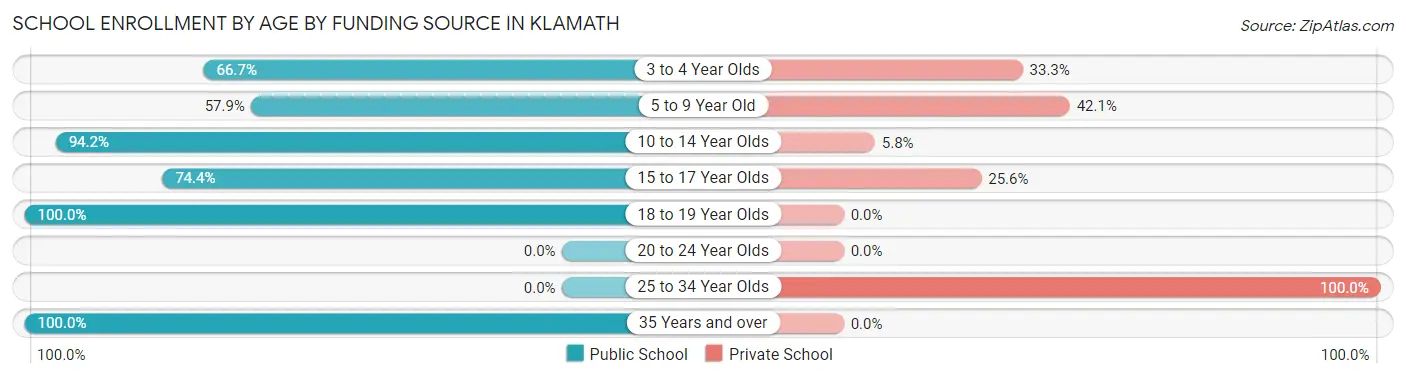
| Age Bracket | Public School | Private School |
| 3 to 4 Year Olds | 4 (66.7%) | 2 (33.3%) |
| 5 to 9 Year Old | 33 (57.9%) | 24 (42.1%) |
| 10 to 14 Year Olds | 65 (94.2%) | 4 (5.8%) |
| 15 to 17 Year Olds | 29 (74.4%) | 10 (25.6%) |
| 18 to 19 Year Olds | 4 (100.0%) | 0 (0.0%) |
| 20 to 24 Year Olds | 0 (0.0%) | 0 (0.0%) |
| 25 to 34 Year Olds | 0 (0.0%) | 1 (100.0%) |
| 35 Years and over | 3 (100.0%) | 0 (0.0%) |
| Total | 138 (77.1%) | 41 (22.9%) |
Educational Attainment by Field of Study in Klamath
Social sciences (21 | 23.6%), business (20 | 22.5%), arts & humanities (12 | 13.5%), liberal arts & history (11 | 12.4%), and bio, nature & agricultural (10 | 11.2%) are the most common fields of study among 89 individuals in Klamath who have obtained a bachelor's degree or higher.
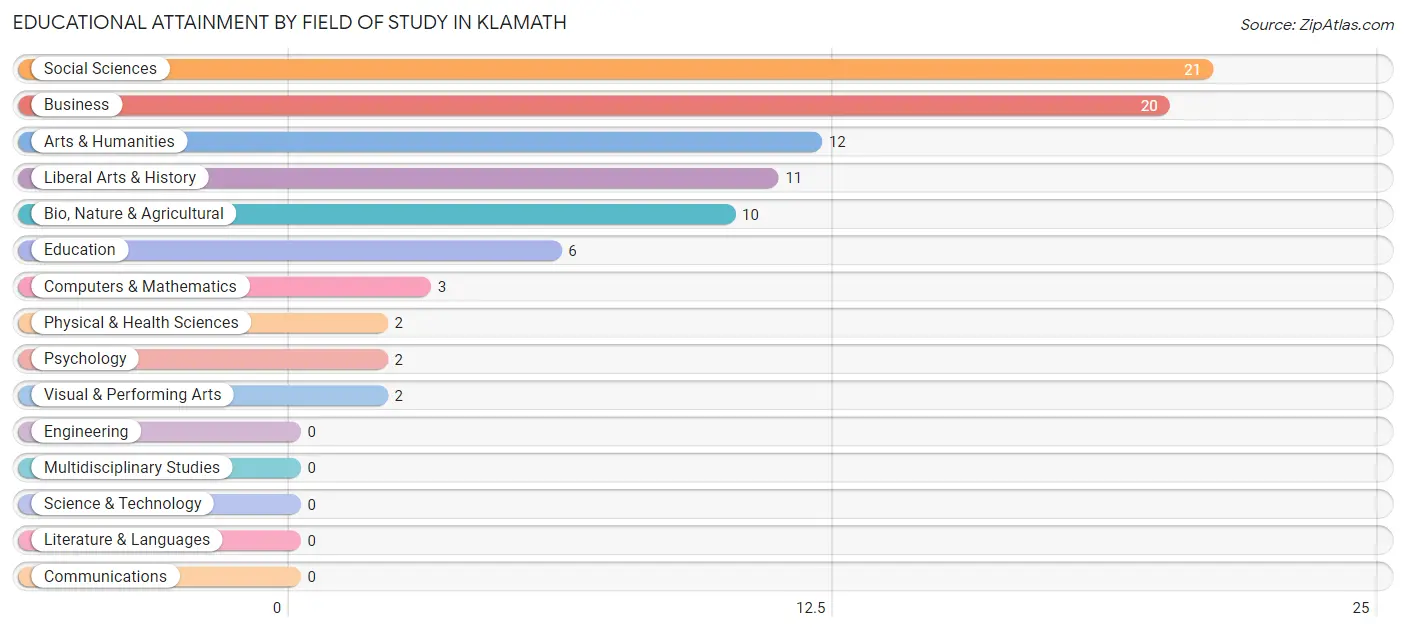
| Field of Study | # Graduates | % Graduates |
| Computers & Mathematics | 3 | 3.4% |
| Bio, Nature & Agricultural | 10 | 11.2% |
| Physical & Health Sciences | 2 | 2.2% |
| Psychology | 2 | 2.2% |
| Social Sciences | 21 | 23.6% |
| Engineering | 0 | 0.0% |
| Multidisciplinary Studies | 0 | 0.0% |
| Science & Technology | 0 | 0.0% |
| Business | 20 | 22.5% |
| Education | 6 | 6.7% |
| Literature & Languages | 0 | 0.0% |
| Liberal Arts & History | 11 | 12.4% |
| Visual & Performing Arts | 2 | 2.2% |
| Communications | 0 | 0.0% |
| Arts & Humanities | 12 | 13.5% |
| Total | 89 | 100.0% |
Transportation & Commute in Klamath
Vehicle Availability by Sex in Klamath
The most prevalent vehicle ownership categories in Klamath are males with 2 vehicles (45, accounting for 52.9%) and females with 2 vehicles (34, making up 29.6%).
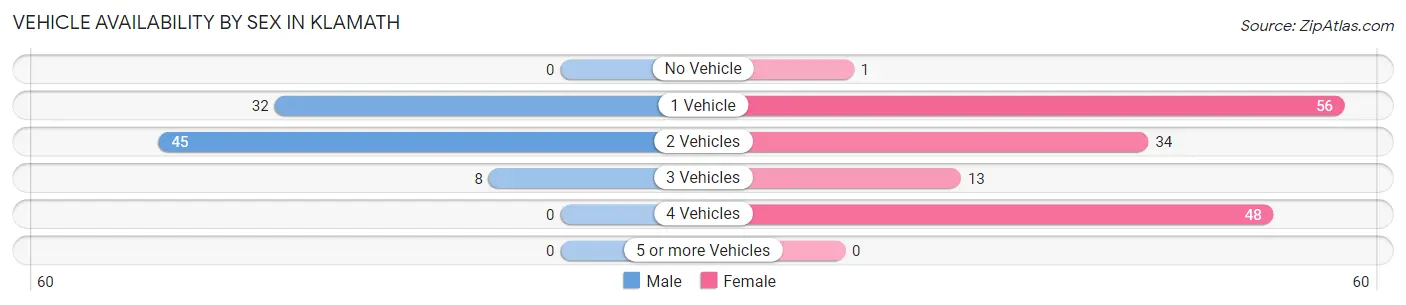
| Vehicles Available | Male | Female |
| No Vehicle | 0 (0.0%) | 1 (0.7%) |
| 1 Vehicle | 32 (37.7%) | 56 (36.8%) |
| 2 Vehicles | 45 (52.9%) | 34 (22.4%) |
| 3 Vehicles | 8 (9.4%) | 13 (8.6%) |
| 4 Vehicles | 0 (0.0%) | 48 (31.6%) |
| 5 or more Vehicles | 0 (0.0%) | 0 (0.0%) |
| Total | 85 (100.0%) | 152 (100.0%) |
Commute Time in Klamath
The most frequently occuring commute durations in Klamath are 30 to 34 minutes (51 commuters, 27.4%), 15 to 19 minutes (38 commuters, 20.4%), and 5 to 9 minutes (31 commuters, 16.7%).
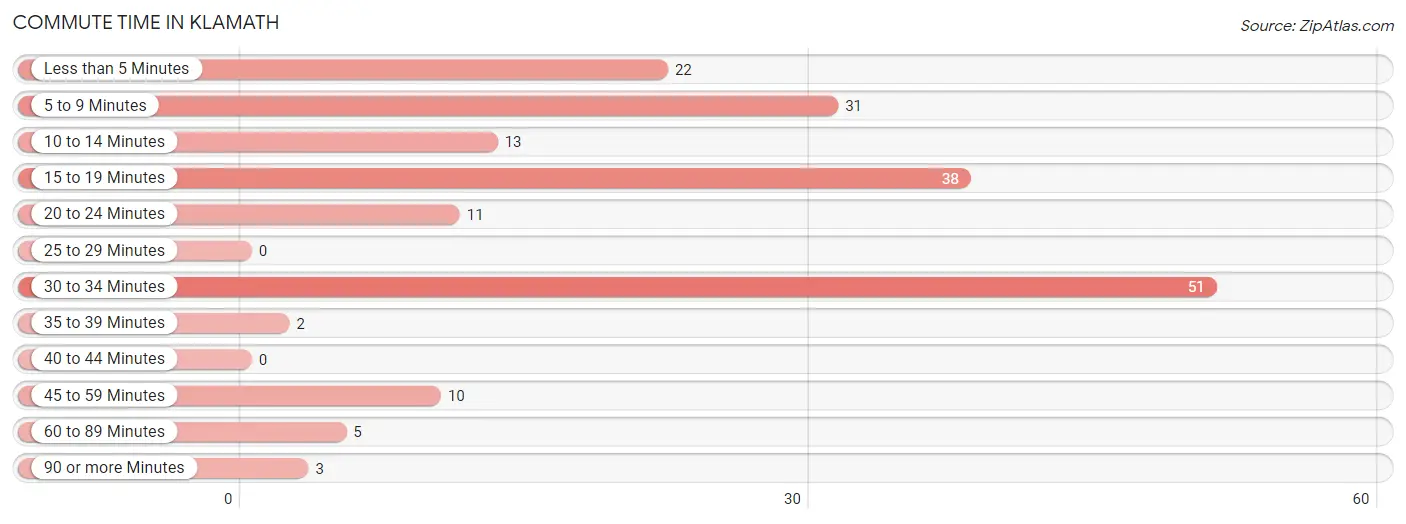
| Commute Time | # Commuters | % Commuters |
| Less than 5 Minutes | 22 | 11.8% |
| 5 to 9 Minutes | 31 | 16.7% |
| 10 to 14 Minutes | 13 | 7.0% |
| 15 to 19 Minutes | 38 | 20.4% |
| 20 to 24 Minutes | 11 | 5.9% |
| 25 to 29 Minutes | 0 | 0.0% |
| 30 to 34 Minutes | 51 | 27.4% |
| 35 to 39 Minutes | 2 | 1.1% |
| 40 to 44 Minutes | 0 | 0.0% |
| 45 to 59 Minutes | 10 | 5.4% |
| 60 to 89 Minutes | 5 | 2.7% |
| 90 or more Minutes | 3 | 1.6% |
Commute Time by Sex in Klamath
The most common commute times in Klamath are 30 to 34 minutes (22 commuters, 32.8%) for males and 30 to 34 minutes (29 commuters, 24.4%) for females.
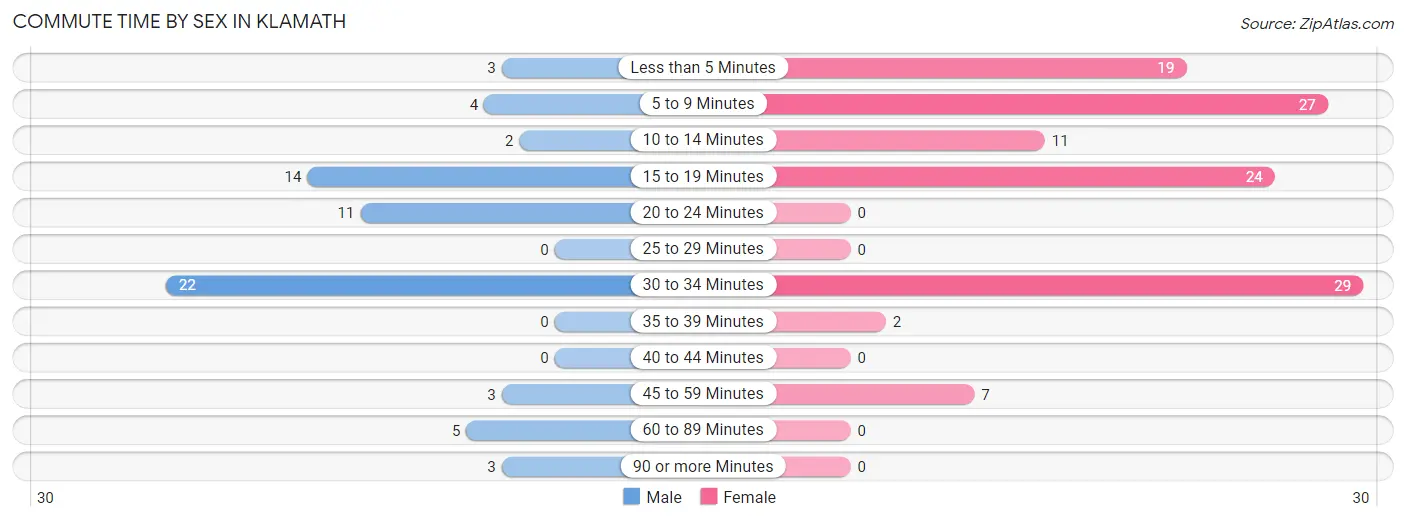
| Commute Time | Male | Female |
| Less than 5 Minutes | 3 (4.5%) | 19 (16.0%) |
| 5 to 9 Minutes | 4 (6.0%) | 27 (22.7%) |
| 10 to 14 Minutes | 2 (3.0%) | 11 (9.2%) |
| 15 to 19 Minutes | 14 (20.9%) | 24 (20.2%) |
| 20 to 24 Minutes | 11 (16.4%) | 0 (0.0%) |
| 25 to 29 Minutes | 0 (0.0%) | 0 (0.0%) |
| 30 to 34 Minutes | 22 (32.8%) | 29 (24.4%) |
| 35 to 39 Minutes | 0 (0.0%) | 2 (1.7%) |
| 40 to 44 Minutes | 0 (0.0%) | 0 (0.0%) |
| 45 to 59 Minutes | 3 (4.5%) | 7 (5.9%) |
| 60 to 89 Minutes | 5 (7.5%) | 0 (0.0%) |
| 90 or more Minutes | 3 (4.5%) | 0 (0.0%) |
Time of Departure to Work by Sex in Klamath
The most frequent times of departure to work in Klamath are 8:00 AM to 8:29 AM (17, 25.4%) for males and 8:00 AM to 8:29 AM (45, 37.8%) for females.
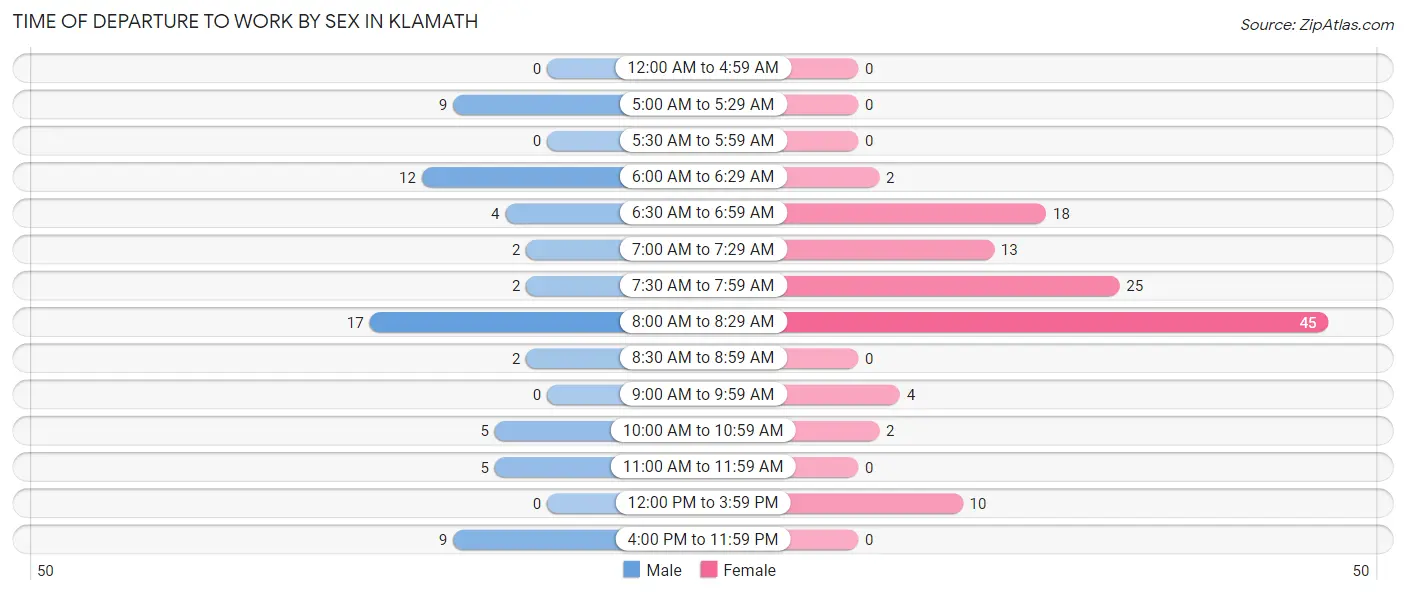
| Time of Departure | Male | Female |
| 12:00 AM to 4:59 AM | 0 (0.0%) | 0 (0.0%) |
| 5:00 AM to 5:29 AM | 9 (13.4%) | 0 (0.0%) |
| 5:30 AM to 5:59 AM | 0 (0.0%) | 0 (0.0%) |
| 6:00 AM to 6:29 AM | 12 (17.9%) | 2 (1.7%) |
| 6:30 AM to 6:59 AM | 4 (6.0%) | 18 (15.1%) |
| 7:00 AM to 7:29 AM | 2 (3.0%) | 13 (10.9%) |
| 7:30 AM to 7:59 AM | 2 (3.0%) | 25 (21.0%) |
| 8:00 AM to 8:29 AM | 17 (25.4%) | 45 (37.8%) |
| 8:30 AM to 8:59 AM | 2 (3.0%) | 0 (0.0%) |
| 9:00 AM to 9:59 AM | 0 (0.0%) | 4 (3.4%) |
| 10:00 AM to 10:59 AM | 5 (7.5%) | 2 (1.7%) |
| 11:00 AM to 11:59 AM | 5 (7.5%) | 0 (0.0%) |
| 12:00 PM to 3:59 PM | 0 (0.0%) | 10 (8.4%) |
| 4:00 PM to 11:59 PM | 9 (13.4%) | 0 (0.0%) |
| Total | 67 (100.0%) | 119 (100.0%) |
Housing Occupancy in Klamath
Occupancy by Ownership in Klamath
Of the total 351 dwellings in Klamath, owner-occupied units account for 269 (76.6%), while renter-occupied units make up 82 (23.4%).
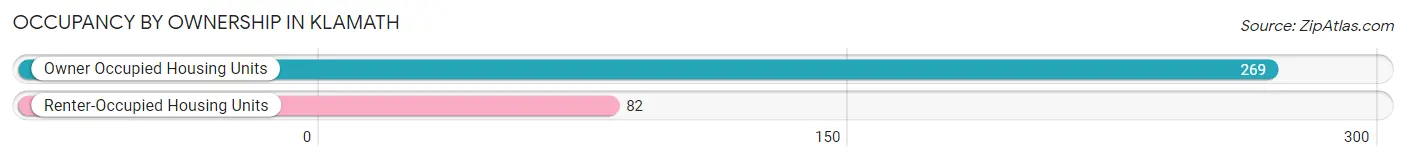
| Occupancy | # Housing Units | % Housing Units |
| Owner Occupied Housing Units | 269 | 76.6% |
| Renter-Occupied Housing Units | 82 | 23.4% |
| Total Occupied Housing Units | 351 | 100.0% |
Occupancy by Household Size in Klamath
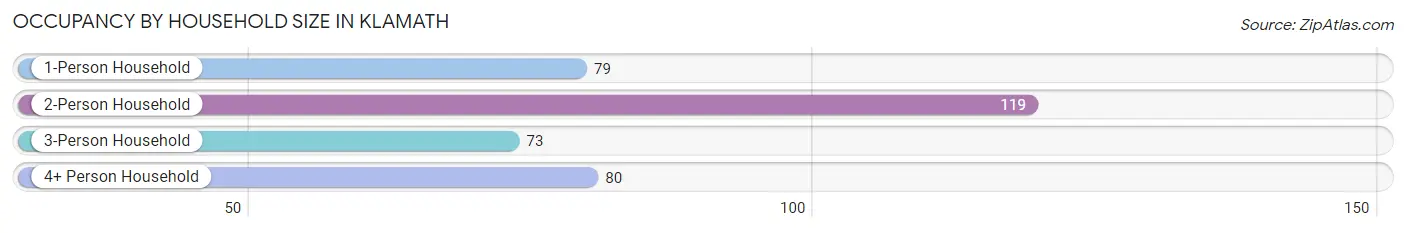
| Household Size | # Housing Units | % Housing Units |
| 1-Person Household | 79 | 22.5% |
| 2-Person Household | 119 | 33.9% |
| 3-Person Household | 73 | 20.8% |
| 4+ Person Household | 80 | 22.8% |
| Total Housing Units | 351 | 100.0% |
Occupancy by Ownership by Household Size in Klamath
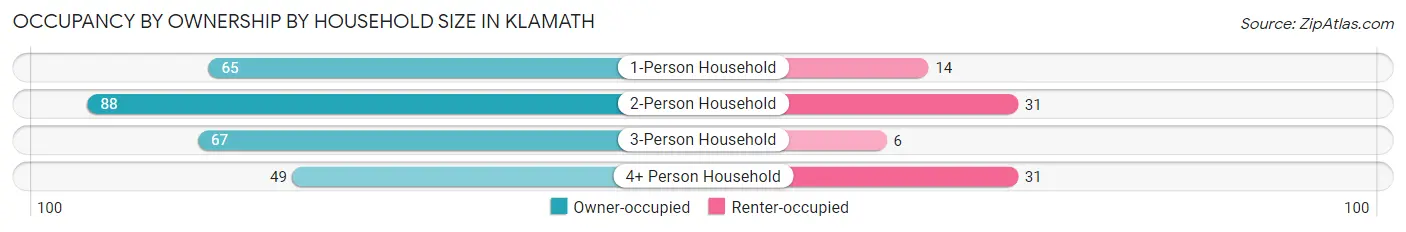
| Household Size | Owner-occupied | Renter-occupied |
| 1-Person Household | 65 (82.3%) | 14 (17.7%) |
| 2-Person Household | 88 (74.0%) | 31 (26.1%) |
| 3-Person Household | 67 (91.8%) | 6 (8.2%) |
| 4+ Person Household | 49 (61.3%) | 31 (38.8%) |
| Total Housing Units | 269 (76.6%) | 82 (23.4%) |
Occupancy by Educational Attainment in Klamath
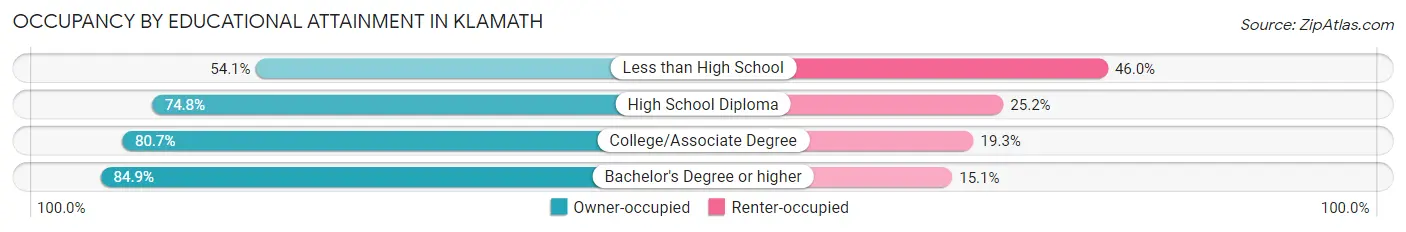
| Household Size | Owner-occupied | Renter-occupied |
| Less than High School | 20 (54.0%) | 17 (46.0%) |
| High School Diploma | 83 (74.8%) | 28 (25.2%) |
| College/Associate Degree | 121 (80.7%) | 29 (19.3%) |
| Bachelor's Degree or higher | 45 (84.9%) | 8 (15.1%) |
Occupancy by Age of Householder in Klamath
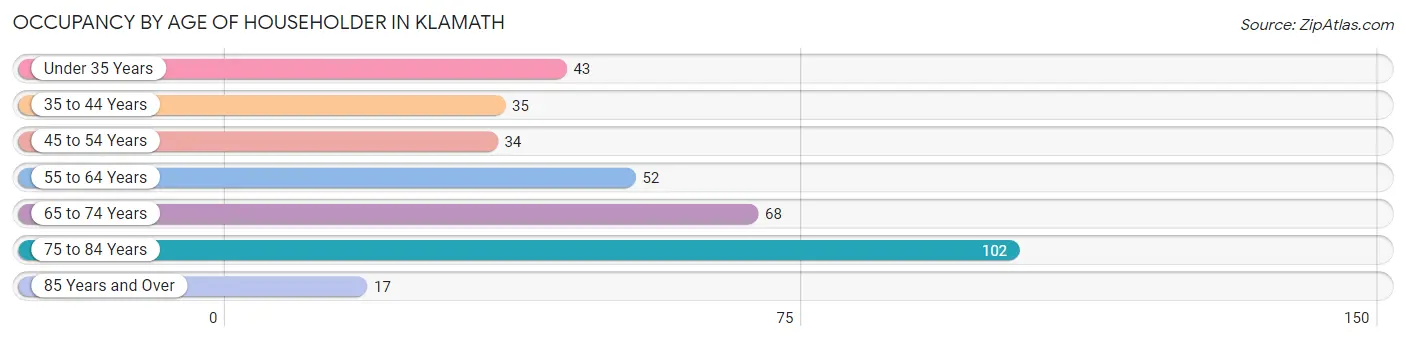
| Age Bracket | # Households | % Households |
| Under 35 Years | 43 | 12.2% |
| 35 to 44 Years | 35 | 10.0% |
| 45 to 54 Years | 34 | 9.7% |
| 55 to 64 Years | 52 | 14.8% |
| 65 to 74 Years | 68 | 19.4% |
| 75 to 84 Years | 102 | 29.1% |
| 85 Years and Over | 17 | 4.8% |
| Total | 351 | 100.0% |
Housing Finances in Klamath
Median Income by Occupancy in Klamath
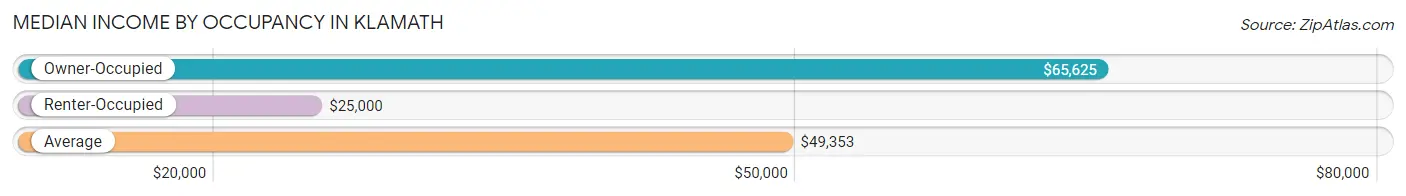
| Occupancy Type | # Households | Median Income |
| Owner-Occupied | 269 (76.6%) | $65,625 |
| Renter-Occupied | 82 (23.4%) | $25,000 |
| Average | 351 (100.0%) | $49,353 |
Occupancy by Householder Income Bracket in Klamath
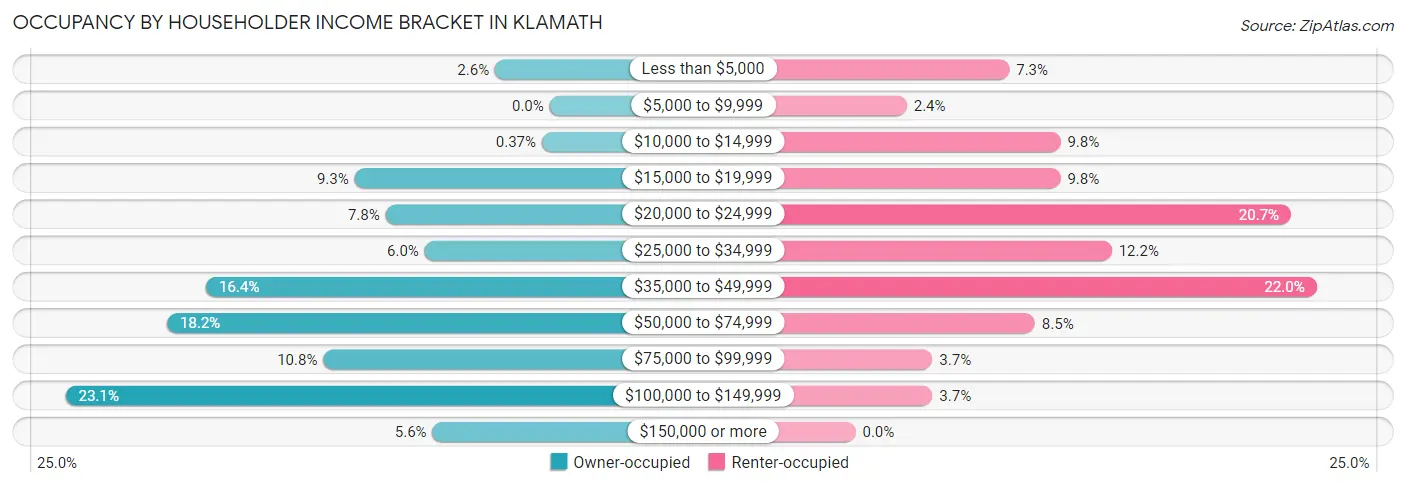
| Income Bracket | Owner-occupied | Renter-occupied |
| Less than $5,000 | 7 (2.6%) | 6 (7.3%) |
| $5,000 to $9,999 | 0 (0.0%) | 2 (2.4%) |
| $10,000 to $14,999 | 1 (0.4%) | 8 (9.8%) |
| $15,000 to $19,999 | 25 (9.3%) | 8 (9.8%) |
| $20,000 to $24,999 | 21 (7.8%) | 17 (20.7%) |
| $25,000 to $34,999 | 16 (5.9%) | 10 (12.2%) |
| $35,000 to $49,999 | 44 (16.4%) | 18 (22.0%) |
| $50,000 to $74,999 | 49 (18.2%) | 7 (8.5%) |
| $75,000 to $99,999 | 29 (10.8%) | 3 (3.7%) |
| $100,000 to $149,999 | 62 (23.1%) | 3 (3.7%) |
| $150,000 or more | 15 (5.6%) | 0 (0.0%) |
| Total | 269 (100.0%) | 82 (100.0%) |
Monthly Housing Cost Tiers in Klamath
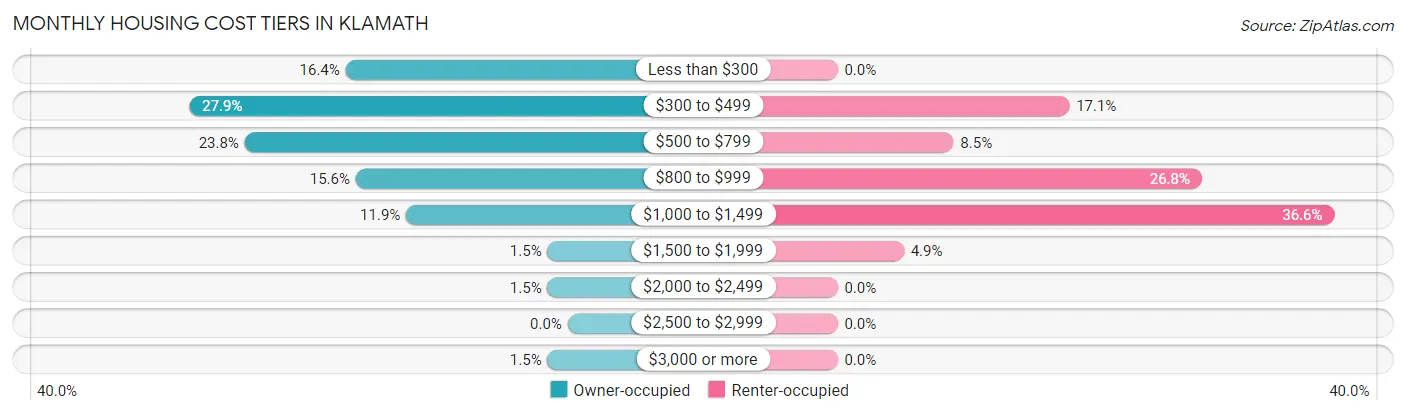
| Monthly Cost | Owner-occupied | Renter-occupied |
| Less than $300 | 44 (16.4%) | 0 (0.0%) |
| $300 to $499 | 75 (27.9%) | 14 (17.1%) |
| $500 to $799 | 64 (23.8%) | 7 (8.5%) |
| $800 to $999 | 42 (15.6%) | 22 (26.8%) |
| $1,000 to $1,499 | 32 (11.9%) | 30 (36.6%) |
| $1,500 to $1,999 | 4 (1.5%) | 4 (4.9%) |
| $2,000 to $2,499 | 4 (1.5%) | 0 (0.0%) |
| $2,500 to $2,999 | 0 (0.0%) | 0 (0.0%) |
| $3,000 or more | 4 (1.5%) | 0 (0.0%) |
| Total | 269 (100.0%) | 82 (100.0%) |
Physical Housing Characteristics in Klamath
Housing Structures in Klamath
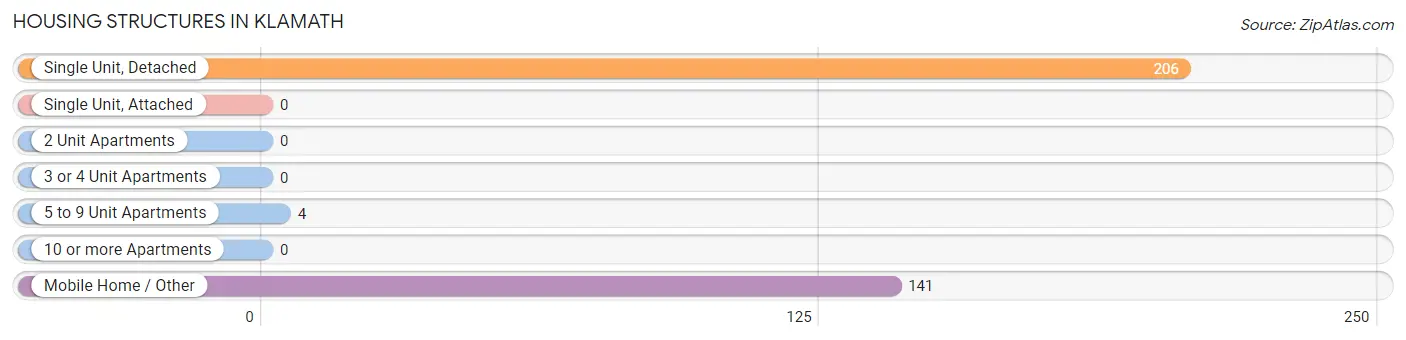
| Structure Type | # Housing Units | % Housing Units |
| Single Unit, Detached | 206 | 58.7% |
| Single Unit, Attached | 0 | 0.0% |
| 2 Unit Apartments | 0 | 0.0% |
| 3 or 4 Unit Apartments | 0 | 0.0% |
| 5 to 9 Unit Apartments | 4 | 1.1% |
| 10 or more Apartments | 0 | 0.0% |
| Mobile Home / Other | 141 | 40.2% |
| Total | 351 | 100.0% |
Housing Structures by Occupancy in Klamath
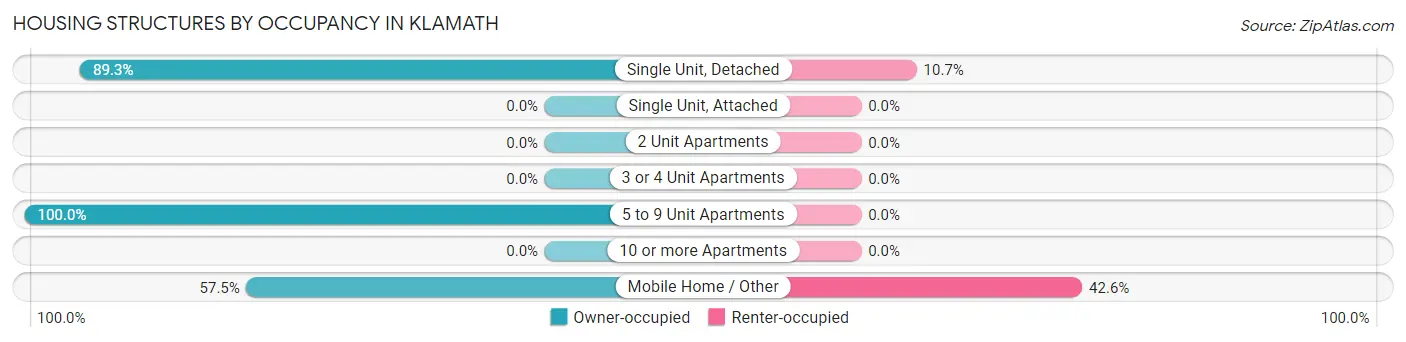
| Structure Type | Owner-occupied | Renter-occupied |
| Single Unit, Detached | 184 (89.3%) | 22 (10.7%) |
| Single Unit, Attached | 0 (0.0%) | 0 (0.0%) |
| 2 Unit Apartments | 0 (0.0%) | 0 (0.0%) |
| 3 or 4 Unit Apartments | 0 (0.0%) | 0 (0.0%) |
| 5 to 9 Unit Apartments | 4 (100.0%) | 0 (0.0%) |
| 10 or more Apartments | 0 (0.0%) | 0 (0.0%) |
| Mobile Home / Other | 81 (57.5%) | 60 (42.5%) |
| Total | 269 (76.6%) | 82 (23.4%) |
Housing Structures by Number of Rooms in Klamath
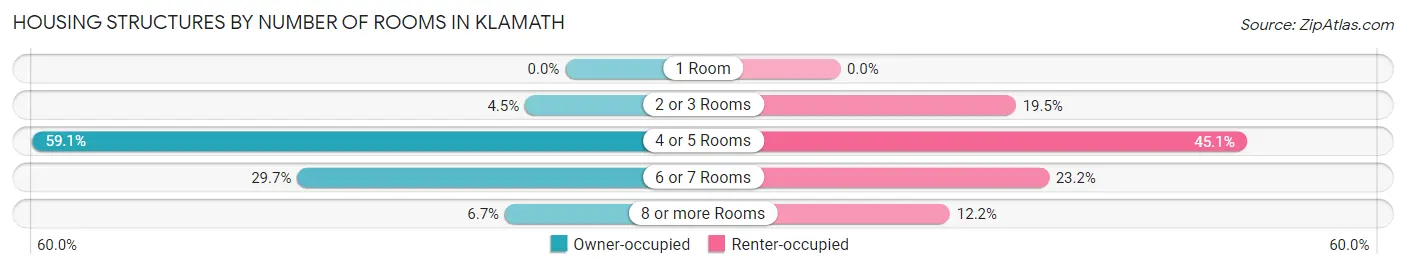
| Number of Rooms | Owner-occupied | Renter-occupied |
| 1 Room | 0 (0.0%) | 0 (0.0%) |
| 2 or 3 Rooms | 12 (4.5%) | 16 (19.5%) |
| 4 or 5 Rooms | 159 (59.1%) | 37 (45.1%) |
| 6 or 7 Rooms | 80 (29.7%) | 19 (23.2%) |
| 8 or more Rooms | 18 (6.7%) | 10 (12.2%) |
| Total | 269 (100.0%) | 82 (100.0%) |
Housing Structure by Heating Type in Klamath
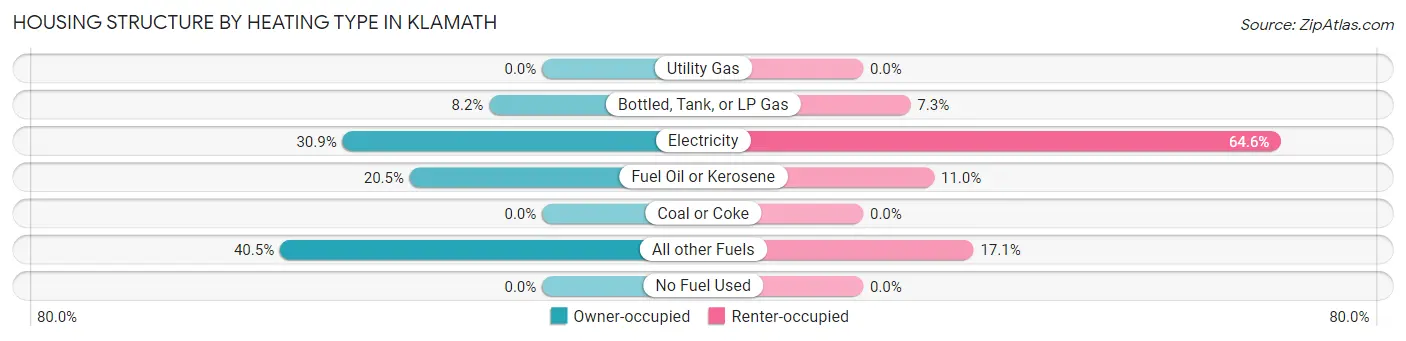
| Heating Type | Owner-occupied | Renter-occupied |
| Utility Gas | 0 (0.0%) | 0 (0.0%) |
| Bottled, Tank, or LP Gas | 22 (8.2%) | 6 (7.3%) |
| Electricity | 83 (30.9%) | 53 (64.6%) |
| Fuel Oil or Kerosene | 55 (20.4%) | 9 (11.0%) |
| Coal or Coke | 0 (0.0%) | 0 (0.0%) |
| All other Fuels | 109 (40.5%) | 14 (17.1%) |
| No Fuel Used | 0 (0.0%) | 0 (0.0%) |
| Total | 269 (100.0%) | 82 (100.0%) |
Household Vehicle Usage in Klamath
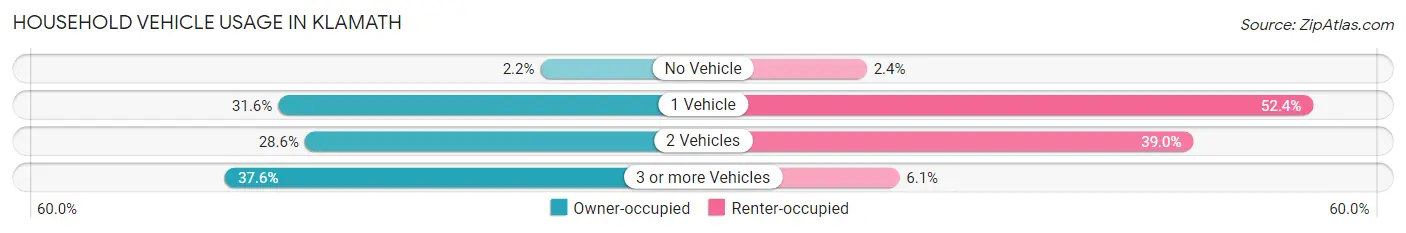
| Vehicles per Household | Owner-occupied | Renter-occupied |
| No Vehicle | 6 (2.2%) | 2 (2.4%) |
| 1 Vehicle | 85 (31.6%) | 43 (52.4%) |
| 2 Vehicles | 77 (28.6%) | 32 (39.0%) |
| 3 or more Vehicles | 101 (37.6%) | 5 (6.1%) |
| Total | 269 (100.0%) | 82 (100.0%) |
Real Estate & Mortgages in Klamath
Real Estate and Mortgage Overview in Klamath
| Characteristic | Without Mortgage | With Mortgage |
| Housing Units | 197 | 72 |
| Median Property Value | $277,700 | $213,200 |
| Median Household Income | $61,750 | $8 |
| Monthly Housing Costs | $480 | $4 |
| Real Estate Taxes | $1,209 | $2 |
Property Value by Mortgage Status in Klamath
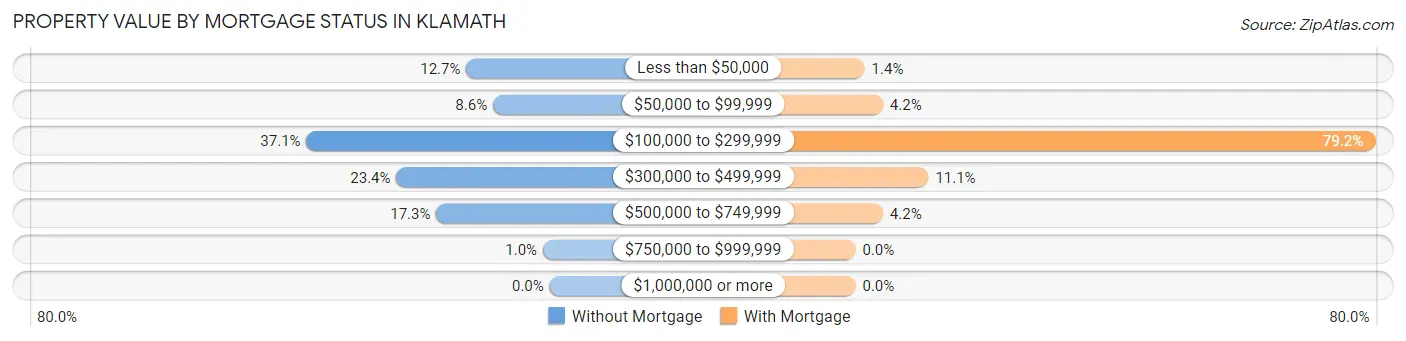
| Property Value | Without Mortgage | With Mortgage |
| Less than $50,000 | 25 (12.7%) | 1 (1.4%) |
| $50,000 to $99,999 | 17 (8.6%) | 3 (4.2%) |
| $100,000 to $299,999 | 73 (37.1%) | 57 (79.2%) |
| $300,000 to $499,999 | 46 (23.4%) | 8 (11.1%) |
| $500,000 to $749,999 | 34 (17.3%) | 3 (4.2%) |
| $750,000 to $999,999 | 2 (1.0%) | 0 (0.0%) |
| $1,000,000 or more | 0 (0.0%) | 0 (0.0%) |
| Total | 197 (100.0%) | 72 (100.0%) |
Household Income by Mortgage Status in Klamath
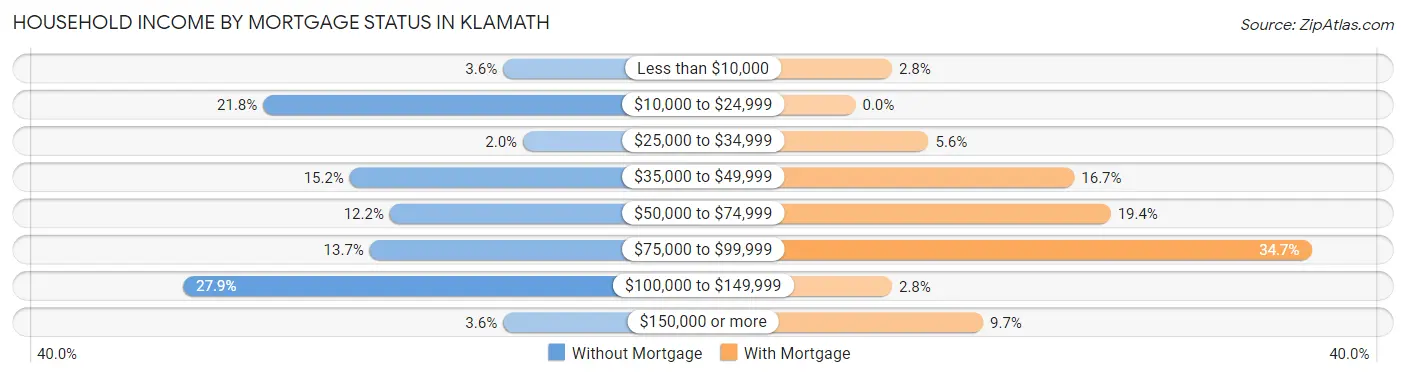
| Household Income | Without Mortgage | With Mortgage |
| Less than $10,000 | 7 (3.5%) | 2 (2.8%) |
| $10,000 to $24,999 | 43 (21.8%) | 0 (0.0%) |
| $25,000 to $34,999 | 4 (2.0%) | 4 (5.6%) |
| $35,000 to $49,999 | 30 (15.2%) | 12 (16.7%) |
| $50,000 to $74,999 | 24 (12.2%) | 14 (19.4%) |
| $75,000 to $99,999 | 27 (13.7%) | 25 (34.7%) |
| $100,000 to $149,999 | 55 (27.9%) | 2 (2.8%) |
| $150,000 or more | 7 (3.5%) | 7 (9.7%) |
| Total | 197 (100.0%) | 72 (100.0%) |
Property Value to Household Income Ratio in Klamath
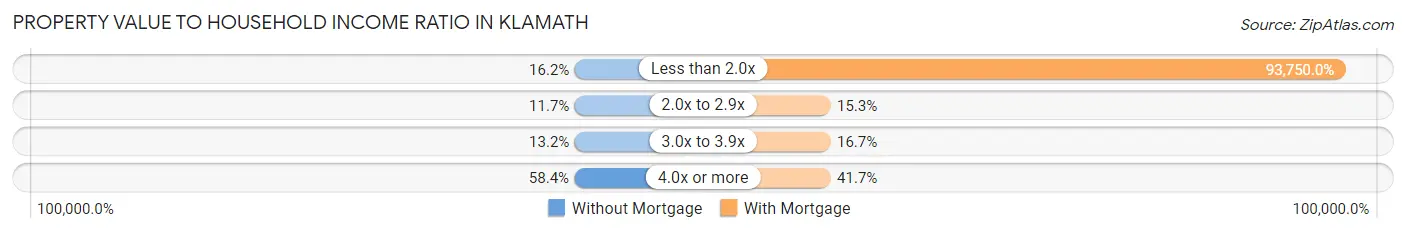
| Value-to-Income Ratio | Without Mortgage | With Mortgage |
| Less than 2.0x | 32 (16.2%) | 67,500 (93,750.0%) |
| 2.0x to 2.9x | 23 (11.7%) | 11 (15.3%) |
| 3.0x to 3.9x | 26 (13.2%) | 12 (16.7%) |
| 4.0x or more | 115 (58.4%) | 30 (41.7%) |
| Total | 197 (100.0%) | 72 (100.0%) |
Real Estate Taxes by Mortgage Status in Klamath
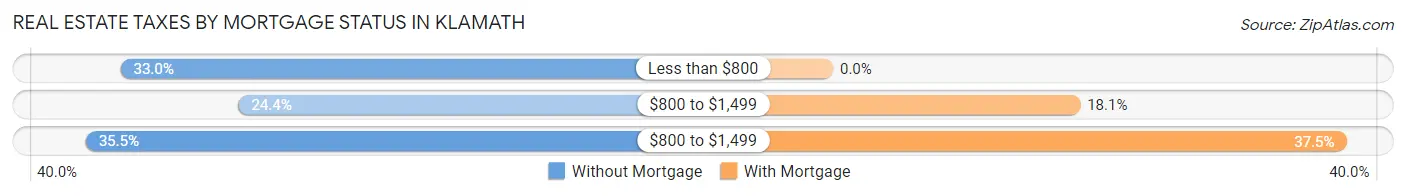
| Property Taxes | Without Mortgage | With Mortgage |
| Less than $800 | 65 (33.0%) | 0 (0.0%) |
| $800 to $1,499 | 48 (24.4%) | 13 (18.1%) |
| $800 to $1,499 | 70 (35.5%) | 27 (37.5%) |
| Total | 197 (100.0%) | 72 (100.0%) |
Health & Disability in Klamath
Health Insurance Coverage by Age in Klamath
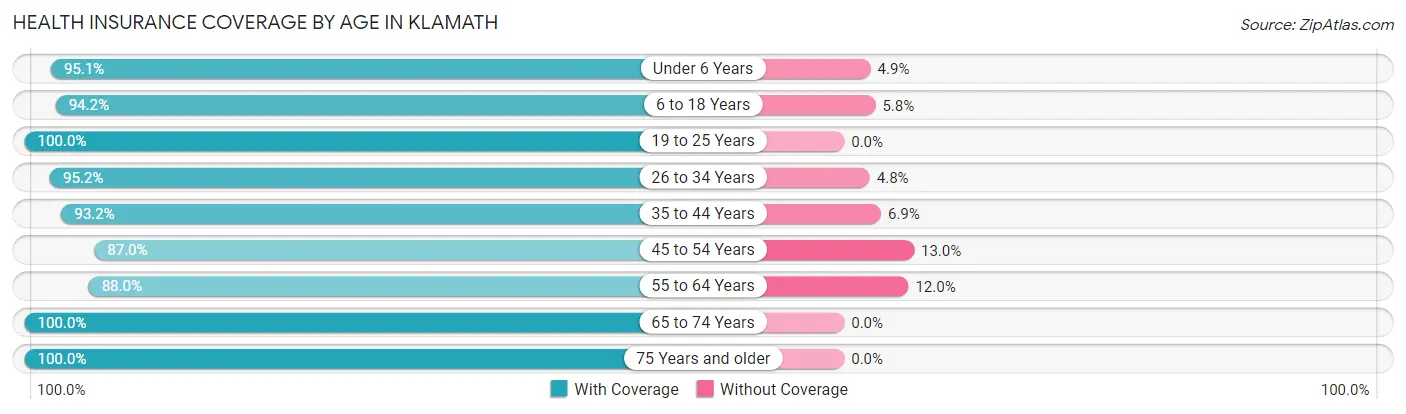
| Age Bracket | With Coverage | Without Coverage |
| Under 6 Years | 58 (95.1%) | 3 (4.9%) |
| 6 to 18 Years | 162 (94.2%) | 10 (5.8%) |
| 19 to 25 Years | 32 (100.0%) | 0 (0.0%) |
| 26 to 34 Years | 60 (95.2%) | 3 (4.8%) |
| 35 to 44 Years | 68 (93.1%) | 5 (6.9%) |
| 45 to 54 Years | 107 (87.0%) | 16 (13.0%) |
| 55 to 64 Years | 103 (88.0%) | 14 (12.0%) |
| 65 to 74 Years | 128 (100.0%) | 0 (0.0%) |
| 75 Years and older | 150 (100.0%) | 0 (0.0%) |
| Total | 868 (94.5%) | 51 (5.6%) |
Health Insurance Coverage by Citizenship Status in Klamath
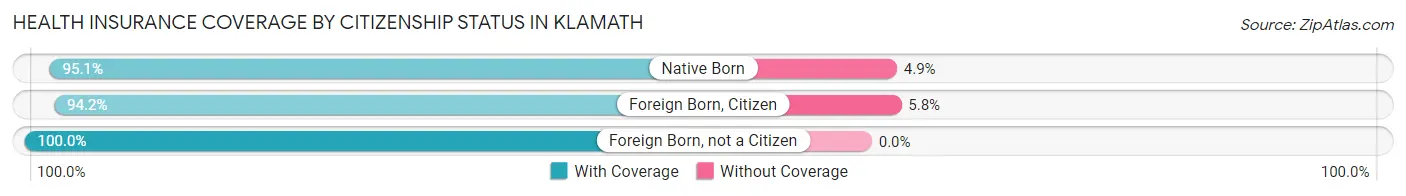
| Citizenship Status | With Coverage | Without Coverage |
| Native Born | 58 (95.1%) | 3 (4.9%) |
| Foreign Born, Citizen | 162 (94.2%) | 10 (5.8%) |
| Foreign Born, not a Citizen | 32 (100.0%) | 0 (0.0%) |
Health Insurance Coverage by Household Income in Klamath
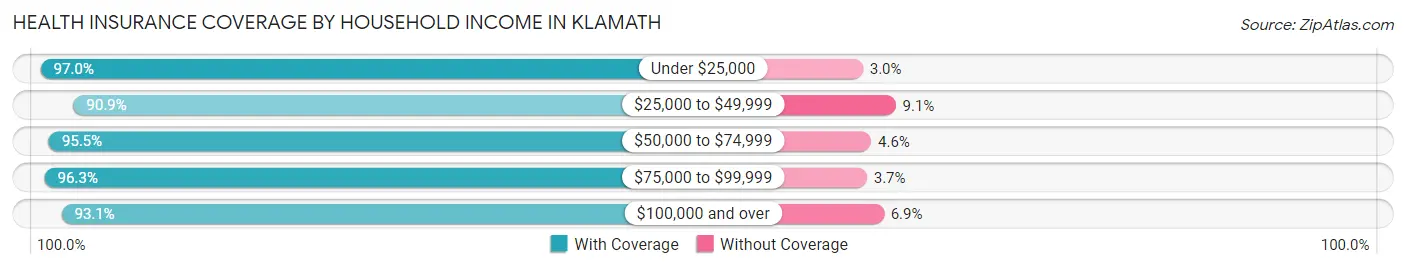
| Household Income | With Coverage | Without Coverage |
| Under $25,000 | 226 (97.0%) | 7 (3.0%) |
| $25,000 to $49,999 | 169 (90.9%) | 17 (9.1%) |
| $50,000 to $74,999 | 168 (95.5%) | 8 (4.5%) |
| $75,000 to $99,999 | 103 (96.3%) | 4 (3.7%) |
| $100,000 and over | 202 (93.1%) | 15 (6.9%) |
Public vs Private Health Insurance Coverage by Age in Klamath
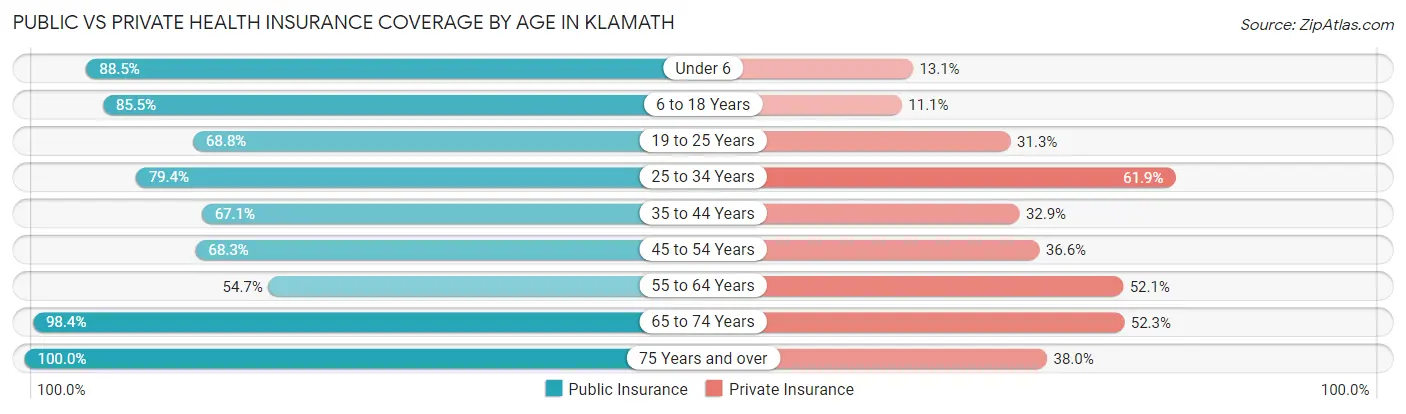
| Age Bracket | Public Insurance | Private Insurance |
| Under 6 | 54 (88.5%) | 8 (13.1%) |
| 6 to 18 Years | 147 (85.5%) | 19 (11.1%) |
| 19 to 25 Years | 22 (68.8%) | 10 (31.2%) |
| 25 to 34 Years | 50 (79.4%) | 39 (61.9%) |
| 35 to 44 Years | 49 (67.1%) | 24 (32.9%) |
| 45 to 54 Years | 84 (68.3%) | 45 (36.6%) |
| 55 to 64 Years | 64 (54.7%) | 61 (52.1%) |
| 65 to 74 Years | 126 (98.4%) | 67 (52.3%) |
| 75 Years and over | 150 (100.0%) | 57 (38.0%) |
| Total | 746 (81.2%) | 330 (35.9%) |
Disability Status by Sex by Age in Klamath
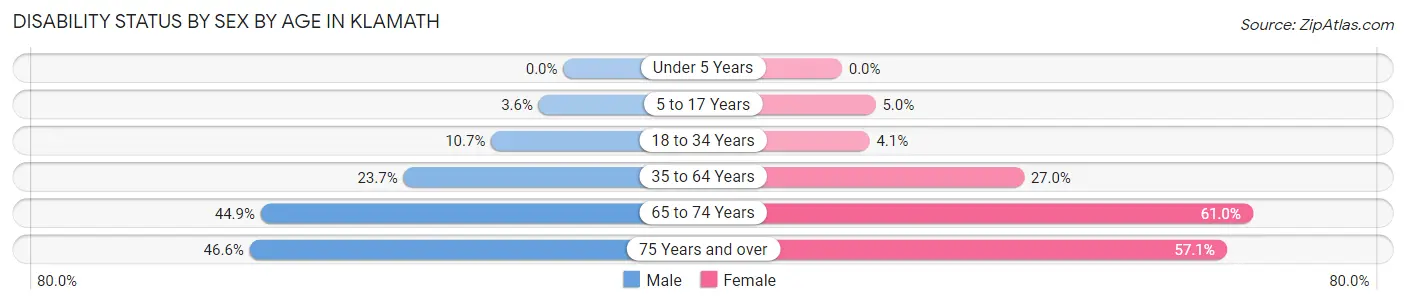
| Age Bracket | Male | Female |
| Under 5 Years | 0 (0.0%) | 0 (0.0%) |
| 5 to 17 Years | 4 (3.6%) | 4 (5.0%) |
| 18 to 34 Years | 3 (10.7%) | 3 (4.1%) |
| 35 to 64 Years | 33 (23.7%) | 47 (27.0%) |
| 65 to 74 Years | 31 (44.9%) | 36 (61.0%) |
| 75 Years and over | 34 (46.6%) | 44 (57.1%) |
Disability Class by Sex by Age in Klamath
Disability Class: Hearing Difficulty
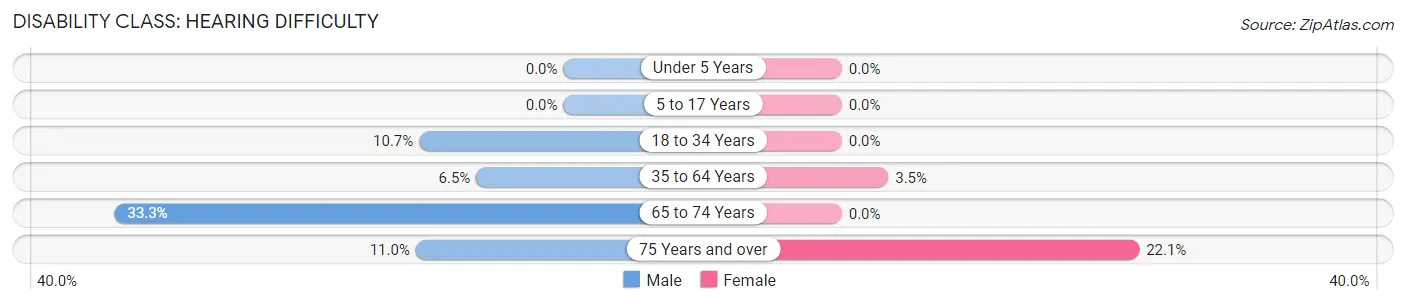
| Age Bracket | Male | Female |
| Under 5 Years | 0 (0.0%) | 0 (0.0%) |
| 5 to 17 Years | 0 (0.0%) | 0 (0.0%) |
| 18 to 34 Years | 3 (10.7%) | 0 (0.0%) |
| 35 to 64 Years | 9 (6.5%) | 6 (3.5%) |
| 65 to 74 Years | 23 (33.3%) | 0 (0.0%) |
| 75 Years and over | 8 (11.0%) | 17 (22.1%) |
Disability Class: Vision Difficulty
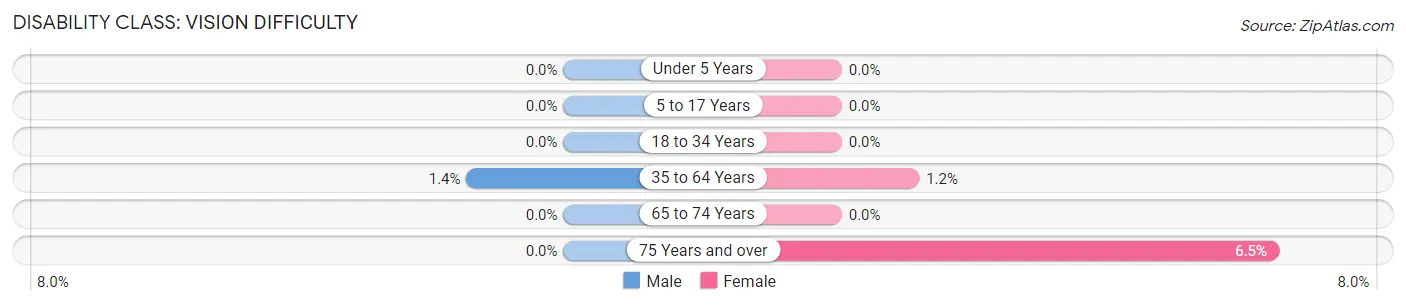
| Age Bracket | Male | Female |
| Under 5 Years | 0 (0.0%) | 0 (0.0%) |
| 5 to 17 Years | 0 (0.0%) | 0 (0.0%) |
| 18 to 34 Years | 0 (0.0%) | 0 (0.0%) |
| 35 to 64 Years | 2 (1.4%) | 2 (1.1%) |
| 65 to 74 Years | 0 (0.0%) | 0 (0.0%) |
| 75 Years and over | 0 (0.0%) | 5 (6.5%) |
Disability Class: Cognitive Difficulty
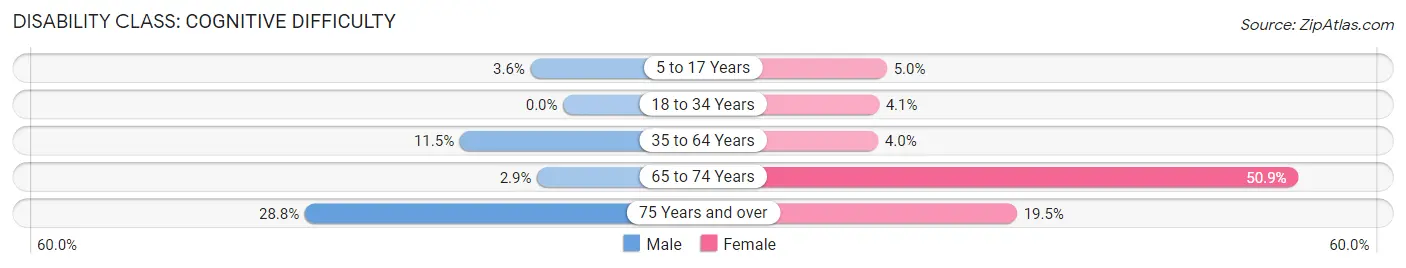
| Age Bracket | Male | Female |
| 5 to 17 Years | 4 (3.6%) | 4 (5.0%) |
| 18 to 34 Years | 0 (0.0%) | 3 (4.1%) |
| 35 to 64 Years | 16 (11.5%) | 7 (4.0%) |
| 65 to 74 Years | 2 (2.9%) | 30 (50.8%) |
| 75 Years and over | 21 (28.8%) | 15 (19.5%) |
Disability Class: Ambulatory Difficulty
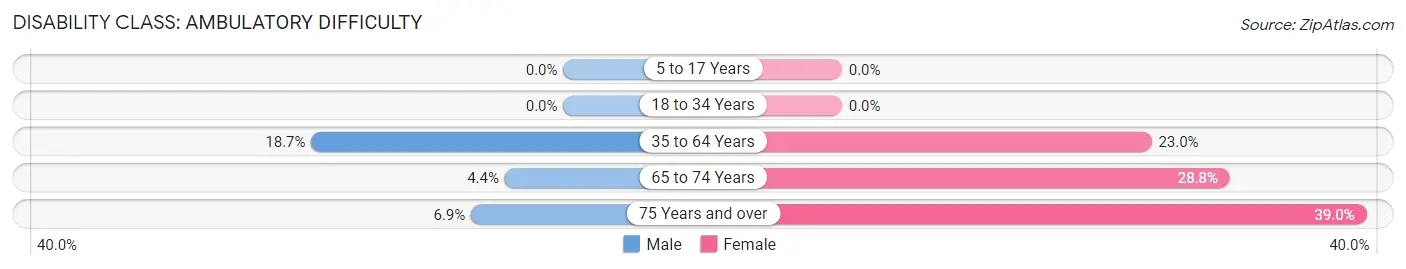
| Age Bracket | Male | Female |
| 5 to 17 Years | 0 (0.0%) | 0 (0.0%) |
| 18 to 34 Years | 0 (0.0%) | 0 (0.0%) |
| 35 to 64 Years | 26 (18.7%) | 40 (23.0%) |
| 65 to 74 Years | 3 (4.3%) | 17 (28.8%) |
| 75 Years and over | 5 (6.9%) | 30 (39.0%) |
Disability Class: Self-Care Difficulty
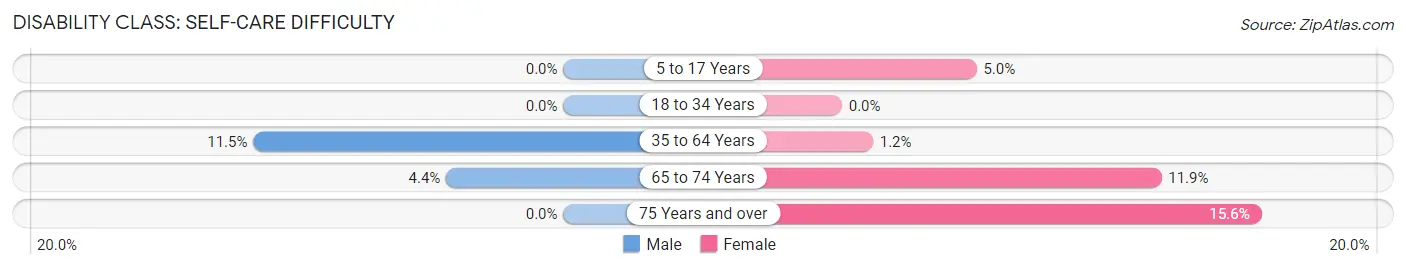
| Age Bracket | Male | Female |
| 5 to 17 Years | 0 (0.0%) | 4 (5.0%) |
| 18 to 34 Years | 0 (0.0%) | 0 (0.0%) |
| 35 to 64 Years | 16 (11.5%) | 2 (1.1%) |
| 65 to 74 Years | 3 (4.3%) | 7 (11.9%) |
| 75 Years and over | 0 (0.0%) | 12 (15.6%) |
Technology Access in Klamath
Computing Device Access in Klamath
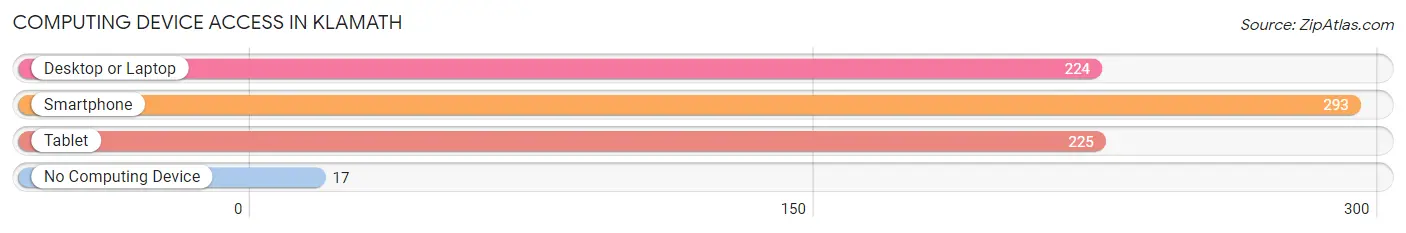
| Device Type | # Households | % Households |
| Desktop or Laptop | 224 | 63.8% |
| Smartphone | 293 | 83.5% |
| Tablet | 225 | 64.1% |
| No Computing Device | 17 | 4.8% |
| Total | 351 | 100.0% |
Internet Access in Klamath
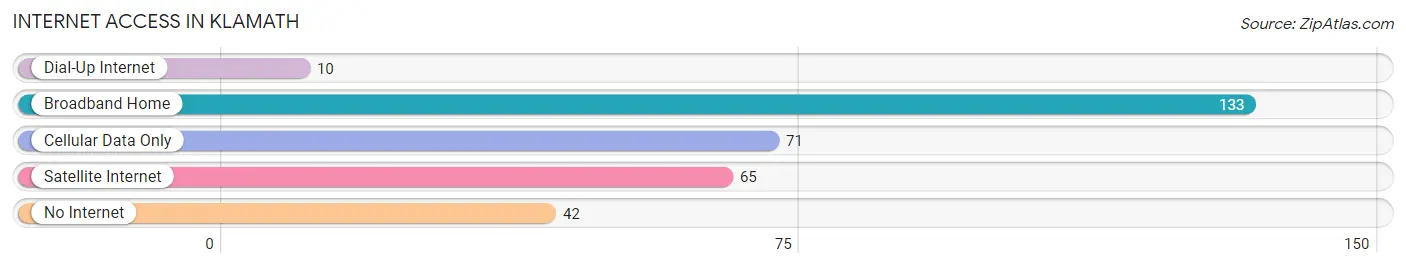
| Internet Type | # Households | % Households |
| Dial-Up Internet | 10 | 2.9% |
| Broadband Home | 133 | 37.9% |
| Cellular Data Only | 71 | 20.2% |
| Satellite Internet | 65 | 18.5% |
| No Internet | 42 | 12.0% |
| Total | 351 | 100.0% |
Klamath Summary
Klamath, California is a small unincorporated community located in Siskiyou County, California. It is situated on the Klamath River, approximately 20 miles east of Yreka, the county seat. The population of Klamath was estimated to be around 1,000 in 2020.
History
Klamath was originally inhabited by the Karuk people, who lived in the area for thousands of years before the arrival of European settlers. The first recorded European settlement in the area was in 1851, when a group of miners established a trading post near the mouth of the Klamath River. The settlement was named Klamath after the river, which was named by the Karuk people.
In 1855, the Klamath River Mining District was established, and the town of Klamath was officially founded. The town quickly grew, and by the late 1800s, it had become a bustling center of commerce and industry. The town was home to several sawmills, a flour mill, a tannery, and a brickyard.
In the early 1900s, Klamath was a popular destination for tourists, who came to enjoy the area’s natural beauty and recreational opportunities. The town was also home to several resorts, including the Klamath Hotel, which was built in 1906.
In the 1950s, the town began to decline as the timber industry moved away and the population dwindled. In the 1970s, the town was revitalized with the construction of a new bridge over the Klamath River. The bridge was completed in 1975, and it helped to bring new life to the town.
Geography
Klamath is located in the Klamath River Valley, which is part of the Cascade Range. The town is situated on the banks of the Klamath River, which is a major tributary of the Sacramento River. The town is surrounded by mountains, including the Trinity Alps to the east and the Marble Mountains to the west.
The climate in Klamath is mild and temperate, with warm summers and cool winters. The average annual temperature is around 50°F, and the average annual precipitation is around 25 inches.
Economy
Klamath’s economy is largely based on tourism and recreation. The town is home to several resorts, campgrounds, and other tourist attractions. The Klamath River is a popular destination for fishing, rafting, and other outdoor activities.
The town is also home to several small businesses, including restaurants, shops, and other services. The local economy is also supported by the timber industry, which is still active in the area.
Demographics
Klamath has a population of around 1,000 people. The town is predominantly white, with a small Hispanic population. The median household income is around $35,000, and the median home value is around $150,000.
Klamath is a small, rural community with a strong sense of community and a rich history. The town is a popular destination for tourists, and it is home to several small businesses and recreational opportunities. The town is also home to a diverse population, with a mix of cultures and backgrounds.
Common Questions
What is Per Capita Income in Klamath?
Per Capita income in Klamath is $25,498.
What is the Median Family Income in Klamath?
Median Family Income in Klamath is $68,850.
What is the Median Household income in Klamath?
Median Household Income in Klamath is $49,353.
What is Income or Wage Gap in Klamath?
Income or Wage Gap in Klamath is 15.1%.
Women in Klamath earn 84.9 cents for every dollar earned by a man.
What is Inequality or Gini Index in Klamath?
Inequality or Gini Index in Klamath is 0.49.
What is the Total Population of Klamath?
Total Population of Klamath is 924.
What is the Total Male Population of Klamath?
Total Male Population of Klamath is 443.
What is the Total Female Population of Klamath?
Total Female Population of Klamath is 481.
What is the Ratio of Males per 100 Females in Klamath?
There are 92.10 Males per 100 Females in Klamath.
What is the Ratio of Females per 100 Males in Klamath?
There are 108.58 Females per 100 Males in Klamath.
What is the Median Population Age in Klamath?
Median Population Age in Klamath is 53.2 Years.
What is the Average Family Size in Klamath
Average Family Size in Klamath is 3.1 People.
What is the Average Household Size in Klamath
Average Household Size in Klamath is 2.6 People.
How Large is the Labor Force in Klamath?
There are 295 People in the Labor Forcein in Klamath.
What is the Percentage of People in the Labor Force in Klamath?
41.2% of People are in the Labor Force in Klamath.
What is the Unemployment Rate in Klamath?
Unemployment Rate in Klamath is 18.0%.