Zip Codes with the Highest Poverty Level Among Children Under the Age of 5 in Los Angeles, CA

RELATED REPORTS & OPTIONS

Highest Poverty | Child 0-5
Population
Families and Households
Female Fertility
Female Fertility (Unmarried)
Race (Community Size)
Race (Percentage)
Ancestry (Community Size)
AfghanAfricanAlaska NativeAlaskan AthabascanAlbanianAlsatianAmericanApacheArabArgentineanArmenianAssyrian / Chaldean / SyriacAustralianAustrianBahamianBangladeshiBarbadianBasqueBelgianBelizeanBhutaneseBlackfeetBolivianBrazilianBritishBritish West IndianBulgarianBurmeseCajunCambodianCanadianCape VerdeanCarpatho RusynCelticCentral AmericanCentral American IndianCherokeeCheyenneChickasawChileanChineseChippewaChoctawColombianColvilleComancheCosta RicanCreeCreekCroatianCubanCypriotCzechCzechoslovakianDanishDelawareDominicanDutchEastern EuropeanEcuadorianEgyptianEnglishEstonianEthiopianEuropeanFilipinoFinnishFrenchFrench American IndianFrench CanadianGermanGerman RussianGhanaianGreekGuamanian / ChamorroGuatemalanGuyaneseHaitianHonduranHopiHungarianIcelanderIndian (Asian)IndonesianIranianIraqiIrishIroquoisIsraeliItalianJamaicanJapaneseJordanianKenyanKiowaKoreanLaotianLatvianLebaneseLiberianLithuanianLumbeeLuxembourgerMacedonianMalaysianMalteseMexicanMexican American IndianMongolianMoroccanNative HawaiianNavajoNew ZealanderNicaraguanNigerianNorthern EuropeanNorwegianOkinawanOsagePaiutePakistaniPalestinianPanamanianParaguayanPennsylvania GermanPeruvianPimaPolishPortuguesePotawatomiPuebloPuerto RicanPuget Sound SalishRomanianRussianSalvadoranSamoanScandinavianScotch-IrishScottishSeminoleSenegaleseSerbianShoshoneSierra LeoneanSiouxSlavicSlovakSloveneSomaliSouth AfricanSouth AmericanSouth American IndianSoviet UnionSpaniardSpanishSpanish AmericanSpanish American IndianSri LankanSubsaharan AfricanSudaneseSwedishSwissSyrianTaiwaneseThaiTlingit-HaidaTohono O'OdhamTonganTrinidadian and TobagonianTurkishU.S. Virgin IslanderUkrainianUruguayanUteVenezuelanVietnameseWelshWest IndianYaquiYugoslavianYumanZimbabwean
Ancestry (Percentage)
AfghanAfricanAlaska NativeAlaskan AthabascanAlbanianAlsatianAmericanApacheArabArgentineanArmenianAssyrian / Chaldean / SyriacAustralianAustrianBahamianBangladeshiBarbadianBasqueBelgianBelizeanBhutaneseBlackfeetBolivianBrazilianBritishBritish West IndianBulgarianBurmeseCajunCambodianCanadianCape VerdeanCarpatho RusynCelticCentral AmericanCentral American IndianCherokeeCheyenneChickasawChileanChineseChippewaChoctawColombianColvilleComancheCosta RicanCreeCreekCroatianCubanCypriotCzechCzechoslovakianDanishDelawareDominicanDutchEastern EuropeanEcuadorianEgyptianEnglishEstonianEthiopianEuropeanFilipinoFinnishFrenchFrench American IndianFrench CanadianGermanGerman RussianGhanaianGreekGuamanian / ChamorroGuatemalanGuyaneseHaitianHonduranHopiHungarianIcelanderIndian (Asian)IndonesianIranianIraqiIrishIroquoisIsraeliItalianJamaicanJapaneseJordanianKenyanKiowaKoreanLaotianLatvianLebaneseLiberianLithuanianLumbeeLuxembourgerMacedonianMalaysianMalteseMexicanMexican American IndianMongolianMoroccanNative HawaiianNavajoNew ZealanderNicaraguanNigerianNorthern EuropeanNorwegianOkinawanOsagePaiutePakistaniPalestinianPanamanianParaguayanPennsylvania GermanPeruvianPimaPolishPortuguesePotawatomiPuebloPuerto RicanPuget Sound SalishRomanianRussianSalvadoranSamoanScandinavianScotch-IrishScottishSeminoleSenegaleseSerbianShoshoneSierra LeoneanSiouxSlavicSlovakSloveneSomaliSouth AfricanSouth AmericanSouth American IndianSoviet UnionSpaniardSpanishSpanish AmericanSpanish American IndianSri LankanSubsaharan AfricanSudaneseSwedishSwissSyrianTaiwaneseThaiTlingit-HaidaTohono O'OdhamTonganTrinidadian and TobagonianTurkishU.S. Virgin IslanderUkrainianUruguayanUteVenezuelanVietnameseWelshWest IndianYaquiYugoslavianYumanZimbabwean
Immigrant Origin (Total)
AfghanistanAfricaArgentinaArmeniaAsiaAustraliaAustriaAzoresBahamasBangladeshBarbadosBelarusBelgiumBelizeBoliviaBosnia and HerzegovinaBrazilBulgariaBurma / MyanmarCambodiaCameroonCanadaCaribbeanCentral AmericaChileChinaColombiaCongoCosta RicaCroatiaCubaCzechoslovakiaDenmarkDominicaDominican RepublicEastern AfricaEastern AsiaEastern EuropeEcuadorEgyptEl SalvadorEnglandEritreaEthiopiaEuropeFijiFranceGermanyGhanaGreeceGrenadaGuatemalaGuyanaHaitiHondurasHong KongHungaryIndiaIndonesiaIranIraqIrelandIsraelItalyJamaicaJapanJordanKazakhstanKenyaKoreaKuwaitLaosLatin AmericaLatviaLebanonLiberiaLithuaniaMalaysiaMexicoMicronesiaMiddle AfricaMoldovaMoroccoNepalNetherlandsNicaraguaNigeriaNorthern AfricaNorthern EuropeNorwayOceaniaPakistanPanamaPeruPhilippinesPolandPortugalRomaniaRussiaSaudi ArabiaScotlandSenegalSerbiaSierra LeoneSingaporeSouth AfricaSouth AmericaSouth Central AsiaSouth Eastern AsiaSouthern EuropeSpainSri LankaSt. Vincent and the GrenadinesSudanSwedenSwitzerlandSyriaTaiwanThailandTrinidad and TobagoTurkeyUgandaUkraineUruguayUzbekistanVenezuelaVietnamWest IndiesWestern AfricaWestern AsiaWestern EuropeZaireZimbabwe
Immigrant Origin (Percentage)
AfghanistanAfricaArgentinaArmeniaAsiaAustraliaAustriaAzoresBahamasBangladeshBarbadosBelarusBelgiumBelizeBoliviaBosnia and HerzegovinaBrazilBulgariaBurma / MyanmarCambodiaCameroonCanadaCaribbeanCentral AmericaChileChinaColombiaCongoCosta RicaCroatiaCubaCzechoslovakiaDenmarkDominicaDominican RepublicEastern AfricaEastern AsiaEastern EuropeEcuadorEgyptEl SalvadorEnglandEritreaEthiopiaEuropeFijiFranceGermanyGhanaGreeceGrenadaGuatemalaGuyanaHaitiHondurasHong KongHungaryIndiaIndonesiaIranIraqIrelandIsraelItalyJamaicaJapanJordanKazakhstanKenyaKoreaKuwaitLaosLatin AmericaLatviaLebanonLiberiaLithuaniaMalaysiaMexicoMicronesiaMiddle AfricaMoldovaMoroccoNepalNetherlandsNicaraguaNigeriaNorthern AfricaNorthern EuropeNorwayOceaniaPakistanPanamaPeruPhilippinesPolandPortugalRomaniaRussiaSaudi ArabiaScotlandSenegalSerbiaSierra LeoneSingaporeSouth AfricaSouth AmericaSouth Central AsiaSouth Eastern AsiaSouthern EuropeSpainSri LankaSt. Vincent and the GrenadinesSudanSwedenSwitzerlandSyriaTaiwanThailandTrinidad and TobagoTurkeyUgandaUkraineUruguayUzbekistanVenezuelaVietnamWest IndiesWestern AfricaWestern AsiaWestern EuropeZaireZimbabwe
Income
Income (Families)
Income (Households)
Poverty
Poverty (Families)
Unemployment
Employment Occupations
Employment Industries
Employer Class
Commute Time
Commute Means
School Enrollment
Education by Degree Field
Occupancy
Finances
Physical Characteristics
Los Angeles
States
California Cities
AlhambraAnaheimAntiochApple ValleyArcadiaAuburnBakersfieldBerkeleyBreaBuena ParkBurbankCamarilloCanoga ParkCanyon CountryCarlsbadCarsonChicoChinoChula VistaCitrus HeightsClovisComptonConcordCoronaCosta MesaCovinaDaly CityDavisDesert Hot SpringsDowneyEl CajonEl MonteElk GroveEscondidoEurekaFairfieldFontanaFremontFresnoFullertonGarden GroveGardenaGlendaleGlendoraGrass ValleyHaywardHemetHesperiaHuntington BeachIndioInglewoodIrvineLa MesaLa PuenteLake ElsinoreLakewoodLancasterLivermoreLodiLompocLong BeachLos AngelesLos GatosMaderaMantecaMenifeeMercedMission ViejoModestoMonterey ParkMoreno ValleyMountain ViewMurrietaNapaNewport BeachNorth HollywoodNorthridgeNovatoOaklandOceansideOntarioOrangeOrovilleOxnardPalm DesertPalm SpringsPalmdalePalo AltoPasadenaPerrisPetalumaPleasantonPomonaPortervilleRancho CordovaRancho CucamongaReddingRedlandsRedondo BeachRedwood CityRichmondRiversideRosevilleSacramentoSalinasSan BernardinoSan DiegoSan FranciscoSan GabrielSan JacintoSan JoseSan LeandroSan Luis ObispoSan MarcosSan MateoSan PedroSan RafaelSanta AnaSanta BarbaraSanta ClaraSanta ClaritaSanta CruzSanta MariaSanta MonicaSanta RosaSherman OaksSimi ValleySpring ValleyStocktonSunnyvaleTemeculaThousand OaksTorranceTrabuco CanyonTracyTurlockTustinUplandVacavilleValenciaVallejoVan NuysVenturaVictorvilleVisaliaVistaWalnut CreekWest CovinaWest SacramentoWhittierWoodlandWoodland HillsYuba City
Compare Zip Codes
Comparison Subject

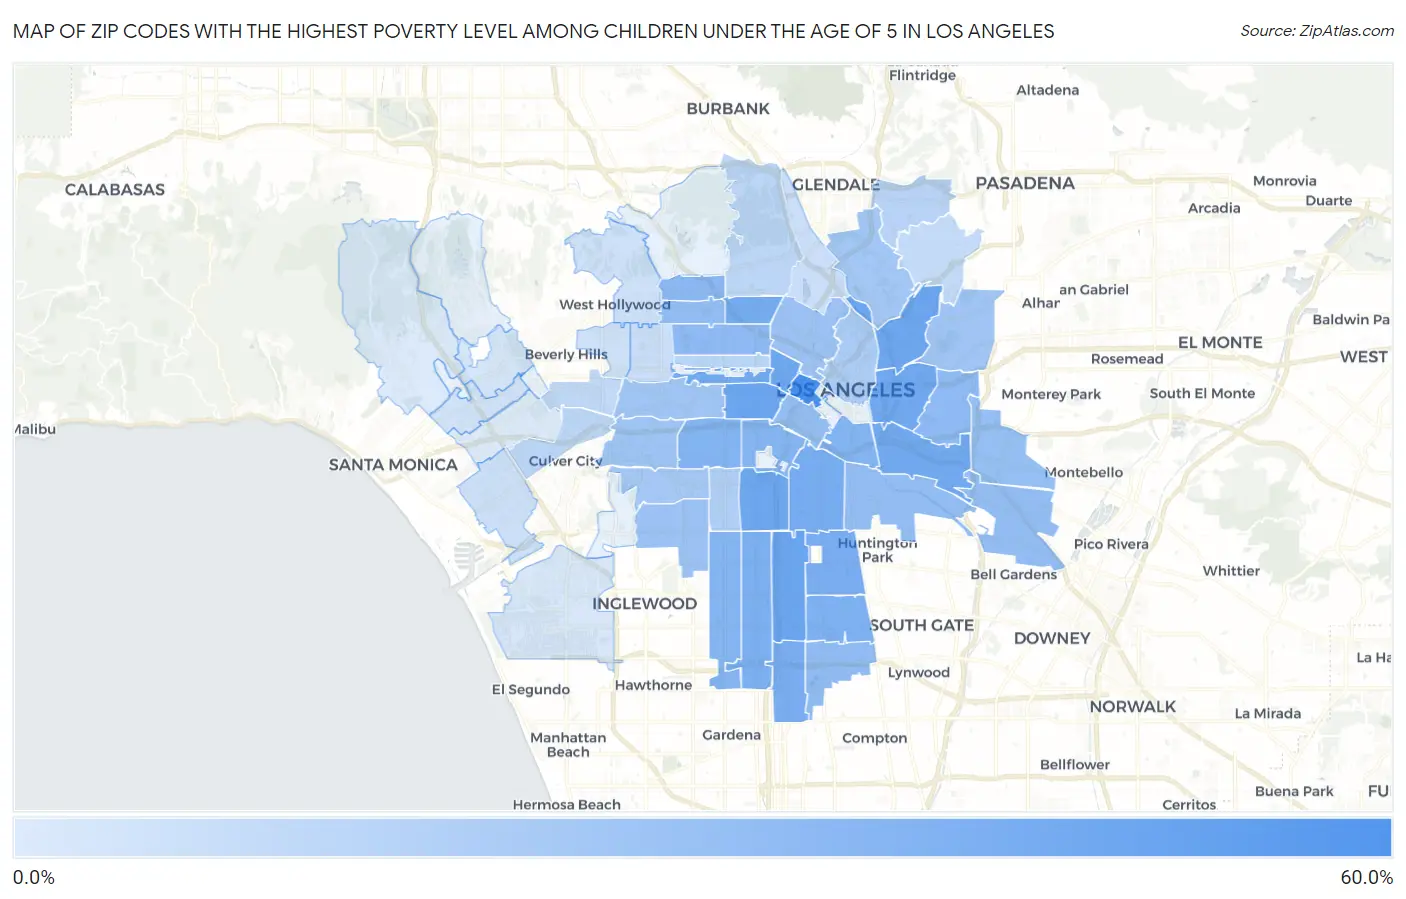
Map of Zip Codes with the Highest Poverty Level Among Children Under the Age of 5 in Los Angeles

0.0%
60.0%
Zip Codes with the Highest Poverty Level Among Children Under the Age of 5 in Los Angeles Map

Zip Codes with the Highest Poverty Level Among Children Under the Age of 5 in Los Angeles, CA

Zip Code Child Poverty vs State vs National
1.9001755.7%15.6%(+40.1)#7818.1%(+37.6)#2,013
2.9000640.3%15.6%(+24.7)#13718.1%(+22.2)#3,965
3.9000340.2%15.6%(+24.6)#13918.1%(+22.1)#3,985
4.9003139.4%15.6%(+23.8)#14118.1%(+21.4)#4,131
5.9003738.9%15.6%(+23.3)#14718.1%(+20.8)#4,238
6.9005738.7%15.6%(+23.1)#14818.1%(+20.7)#4,259
7.9003337.8%15.6%(+22.2)#15518.1%(+19.7)#4,449
8.9002337.2%15.6%(+21.6)#16118.1%(+19.1)#4,561
9.9000536.9%15.6%(+21.3)#16418.1%(+18.9)#4,611
10.9002936.5%15.6%(+20.9)#16718.1%(+18.5)#4,691
11.9001135.4%15.6%(+19.8)#17818.1%(+17.3)#4,985
12.9000134.5%15.6%(+18.9)#18618.1%(+16.4)#5,196
13.9006134.4%15.6%(+18.8)#18718.1%(+16.3)#5,205
14.9004433.2%15.6%(+17.6)#20018.1%(+15.2)#5,545
15.9000232.6%15.6%(+17.0)#20818.1%(+14.5)#5,703
16.9002131.0%15.6%(+15.4)#22518.1%(+13.0)#6,072
17.9001831.0%15.6%(+15.4)#22618.1%(+13.0)#6,078
18.9004730.2%15.6%(+14.6)#23718.1%(+12.1)#6,299
19.9000730.0%15.6%(+14.4)#23918.1%(+11.9)#6,367
20.9002827.8%15.6%(+12.2)#27118.1%(+9.79)#7,007
21.9006326.6%15.6%(+11.0)#29618.1%(+8.55)#7,436
22.9000426.3%15.6%(+10.6)#30618.1%(+8.19)#7,563
23.9005925.4%15.6%(+9.84)#32418.1%(+7.39)#7,839
24.9001525.3%15.6%(+9.65)#32518.1%(+7.20)#7,898
25.9005825.0%15.6%(+9.39)#33118.1%(+6.94)#7,970
26.9003824.8%15.6%(+9.23)#33618.1%(+6.78)#8,076
27.9004024.7%15.6%(+9.08)#33818.1%(+6.62)#8,118
28.9002224.0%15.6%(+8.42)#34818.1%(+5.97)#8,336
29.9002622.4%15.6%(+6.78)#38518.1%(+4.33)#9,008
30.9004321.7%15.6%(+6.06)#40518.1%(+3.61)#9,323
31.9001620.7%15.6%(+5.09)#42818.1%(+2.64)#9,718
32.9003220.2%15.6%(+4.63)#44218.1%(+2.18)#9,917
33.9001919.8%15.6%(+4.17)#45318.1%(+1.72)#10,145
34.9006518.9%15.6%(+3.29)#47918.1%(+0.842)#10,544
35.9000818.4%15.6%(+2.78)#49818.1%(+0.331)#10,770
36.9001216.3%15.6%(+0.666)#55318.1%(-1.79)#11,778
37.9006214.3%15.6%(-1.35)#61918.1%(-3.80)#12,903
38.9004111.9%15.6%(-3.73)#71118.1%(-6.19)#14,285
39.9002011.8%15.6%(-3.81)#71218.1%(-6.26)#14,336
40.9002711.1%15.6%(-4.54)#73518.1%(-6.99)#14,796
41.9003410.9%15.6%(-4.75)#74318.1%(-7.20)#14,921
42.900359.2%15.6%(-6.39)#81218.1%(-8.84)#15,907
43.900428.5%15.6%(-7.11)#85018.1%(-9.56)#16,416
44.900396.6%15.6%(-8.99)#94918.1%(-11.4)#17,661
45.900366.3%15.6%(-9.29)#95718.1%(-11.7)#17,840
46.900665.4%15.6%(-10.2)#99418.1%(-12.6)#18,493
47.900465.2%15.6%(-10.4)#1,00818.1%(-12.9)#18,634
48.900485.0%15.6%(-10.6)#1,02018.1%(-13.1)#18,786
49.900254.1%15.6%(-11.5)#1,07118.1%(-13.9)#19,404
50.900243.1%15.6%(-12.5)#1,12318.1%(-14.9)#20,066
51.900452.1%15.6%(-13.5)#1,16318.1%(-16.0)#20,772
52.900491.0%15.6%(-14.6)#1,21018.1%(-17.0)#21,381
53.900640.85%15.6%(-14.8)#1,22118.1%(-17.2)#21,470

Common Questions

What are the Top 10 Zip Codes with the Highest Poverty Level Among Children Under the Age of 5 in Los Angeles, CA?
Top 10 Zip Codes with the Highest Poverty Level Among Children Under the Age of 5 in Los Angeles, CA are:
#1
55.7%
#2
40.3%
#3
40.2%
#4
39.4%
#5
38.9%
#6
38.7%
#7
37.8%
#8
37.2%
#9
36.9%
#10
36.5%
What zip code has the Highest Poverty Level Among Children Under the Age of 5 in Los Angeles, CA?
90017 has the Highest Poverty Level Among Children Under the Age of 5 in Los Angeles, CA with 55.7%.
What is the Poverty Level Among Children Under the Age of 5 in Los Angeles, CA?
Poverty Level Among Children Under the Age of 5 in Los Angeles is 20.6%.
What is the Poverty Level Among Children Under the Age of 5 in California?
Poverty Level Among Children Under the Age of 5 in California is 15.6%.
What is the Poverty Level Among Children Under the Age of 5 in the United States?
Poverty Level Among Children Under the Age of 5 in the United States is 18.1%.