Tonyville, CA Map & Demographics
Tonyville Map
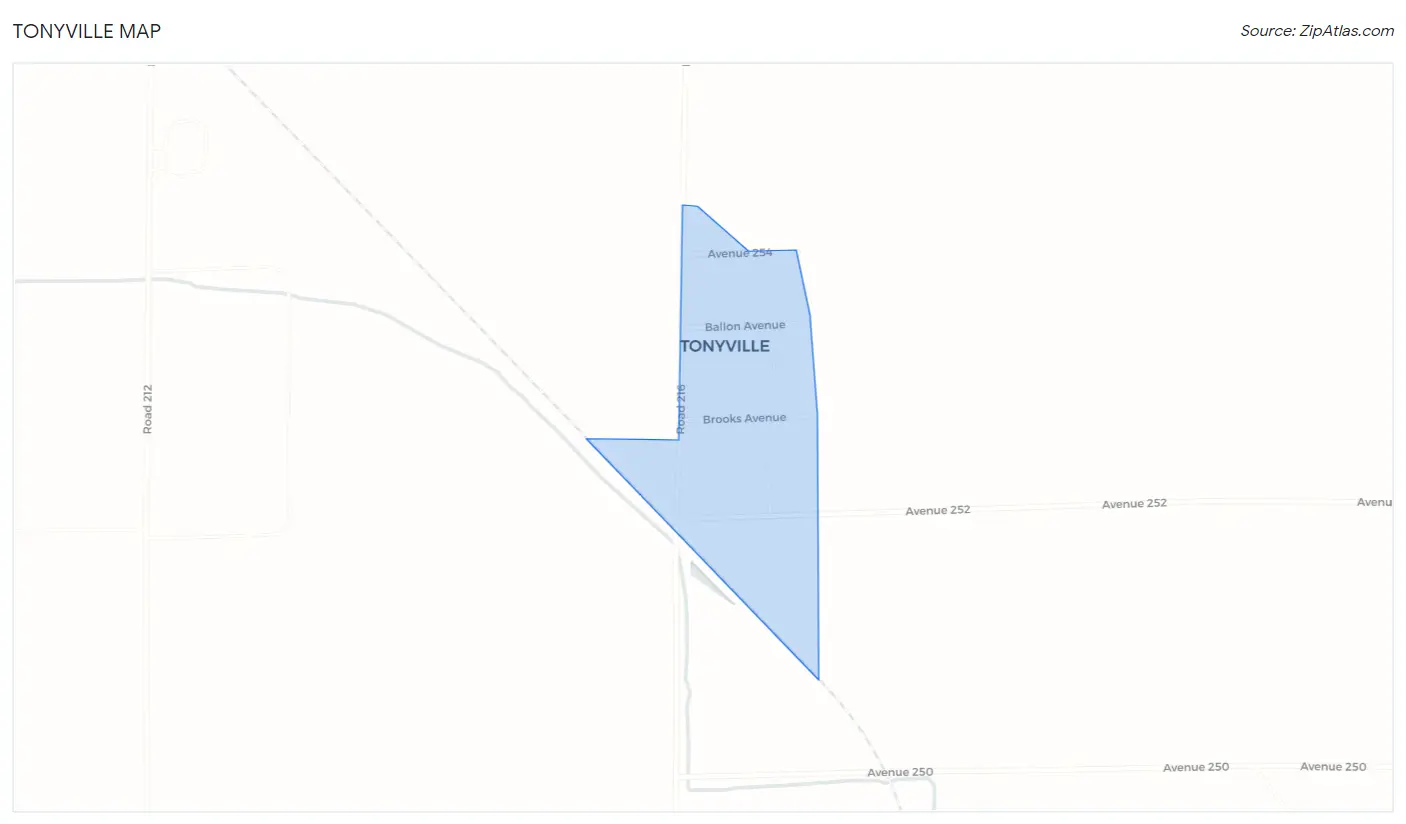
Tonyville Overview
$8,231
PER CAPITA INCOME
$23,295
AVG HOUSEHOLD INCOME
0.27
INEQUALITY / GINI INDEX
314
TOTAL POPULATION
214
MALE POPULATION
100
FEMALE POPULATION
214.00
MALES / 100 FEMALES
46.73
FEMALES / 100 MALES
11.9
MEDIAN AGE
4.7
AVG FAMILY SIZE
4.0
AVG HOUSEHOLD SIZE
78
LABOR FORCE [ PEOPLE ]
50.3%
PERCENT IN LABOR FORCE
14.1%
UNEMPLOYMENT RATE
Income in Tonyville
Income Overview in Tonyville
| Characteristic | Number | Measure |
| Per Capita Income | 314 | $8,231 |
| Median Family Income | 63 | $0 |
| Mean Family Income | 63 | $28,690 |
| Median Household Income | 79 | $23,295 |
| Mean Household Income | 79 | $27,052 |
| Income Deficit | 63 | $0 |
| Wage / Income Gap (%) | 314 | 0.00% |
| Wage / Income Gap ($) | 314 | 100.00¢ per $1 |
| Gini / Inequality Index | 314 | 0.27 |
Earnings by Sex in Tonyville
| Sex | Number | Average Earnings |
| Male | 78 (100.0%) | $0 |
| Female | 0 (0.0%) | $0 |
| Total | 78 (100.0%) | $0 |
Earnings by Sex by Income Bracket in Tonyville
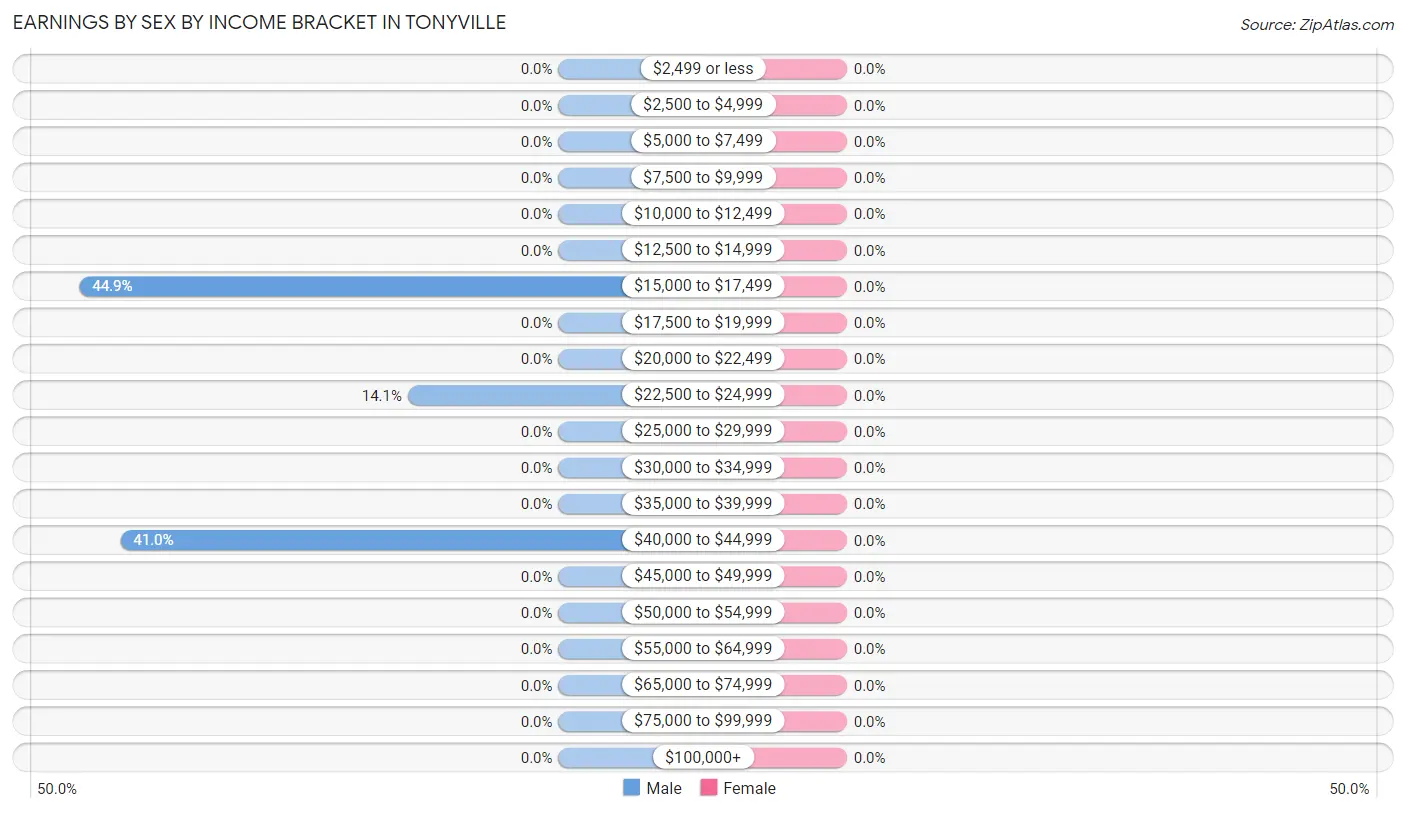
| Income | Male | Female |
| $2,499 or less | 0 (0.0%) | 0 (0.0%) |
| $2,500 to $4,999 | 0 (0.0%) | 0 (0.0%) |
| $5,000 to $7,499 | 0 (0.0%) | 0 (0.0%) |
| $7,500 to $9,999 | 0 (0.0%) | 0 (0.0%) |
| $10,000 to $12,499 | 0 (0.0%) | 0 (0.0%) |
| $12,500 to $14,999 | 0 (0.0%) | 0 (0.0%) |
| $15,000 to $17,499 | 35 (44.9%) | 0 (0.0%) |
| $17,500 to $19,999 | 0 (0.0%) | 0 (0.0%) |
| $20,000 to $22,499 | 0 (0.0%) | 0 (0.0%) |
| $22,500 to $24,999 | 11 (14.1%) | 0 (0.0%) |
| $25,000 to $29,999 | 0 (0.0%) | 0 (0.0%) |
| $30,000 to $34,999 | 0 (0.0%) | 0 (0.0%) |
| $35,000 to $39,999 | 0 (0.0%) | 0 (0.0%) |
| $40,000 to $44,999 | 32 (41.0%) | 0 (0.0%) |
| $45,000 to $49,999 | 0 (0.0%) | 0 (0.0%) |
| $50,000 to $54,999 | 0 (0.0%) | 0 (0.0%) |
| $55,000 to $64,999 | 0 (0.0%) | 0 (0.0%) |
| $65,000 to $74,999 | 0 (0.0%) | 0 (0.0%) |
| $75,000 to $99,999 | 0 (0.0%) | 0 (0.0%) |
| $100,000+ | 0 (0.0%) | 0 (0.0%) |
| Total | 78 (100.0%) | 0 (0.0%) |
Earnings by Sex by Educational Attainment in Tonyville
| Educational Attainment | Male Income | Female Income |
| Less than High School | - | - |
| High School Diploma | - | - |
| College or Associate's Degree | - | - |
| Bachelor's Degree | - | - |
| Graduate Degree | - | - |
| Total | - | - |
Family Income in Tonyville
Family Income Brackets in Tonyville
According to the Tonyville family income data, there are 31 families falling into the $15,000 to $24,999 income range, which is the most common income bracket and makes up 49.2% of all families.
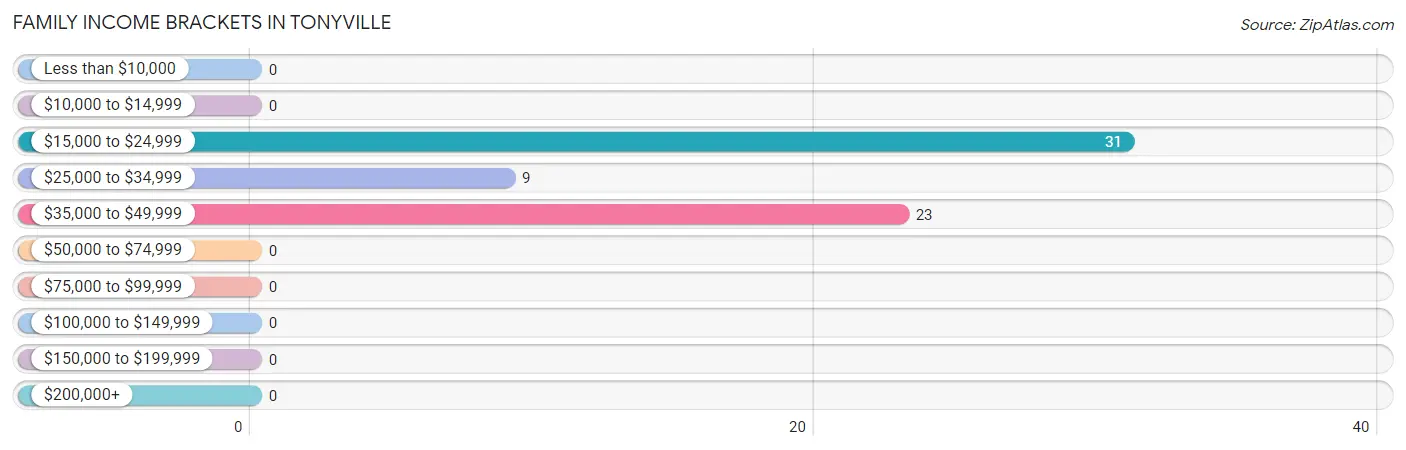
| Income Bracket | # Families | % Families |
| Less than $10,000 | 0 | 0.0% |
| $10,000 to $14,999 | 0 | 0.0% |
| $15,000 to $24,999 | 31 | 49.2% |
| $25,000 to $34,999 | 9 | 14.3% |
| $35,000 to $49,999 | 23 | 36.5% |
| $50,000 to $74,999 | 0 | 0.0% |
| $75,000 to $99,999 | 0 | 0.0% |
| $100,000 to $149,999 | 0 | 0.0% |
| $150,000 to $199,999 | 0 | 0.0% |
| $200,000+ | 0 | 0.0% |
Family Income by Famaliy Size in Tonyville
| Income Bracket | # Families | Median Income |
| 2-Person Families | 9 (14.3%) | $0 |
| 3-Person Families | 23 (36.5%) | $0 |
| 4-Person Families | 0 (0.0%) | $0 |
| 5-Person Families | 0 (0.0%) | $0 |
| 6-Person Families | 31 (49.2%) | $0 |
| 7+ Person Families | 0 (0.0%) | $0 |
| Total | 63 (100.0%) | $0 |
Family Income by Number of Earners in Tonyville
| Number of Earners | # Families | Median Income |
| No Earners | 9 (14.3%) | $0 |
| 1 Earner | 54 (85.7%) | $0 |
| 2 Earners | 0 (0.0%) | $0 |
| 3+ Earners | 0 (0.0%) | $0 |
| Total | 63 (100.0%) | $0 |
Household Income in Tonyville
Household Income Brackets in Tonyville
With 47 households falling in the category, the $15,000 to $24,999 income range is the most frequent in Tonyville, accounting for 59.5% of all households.
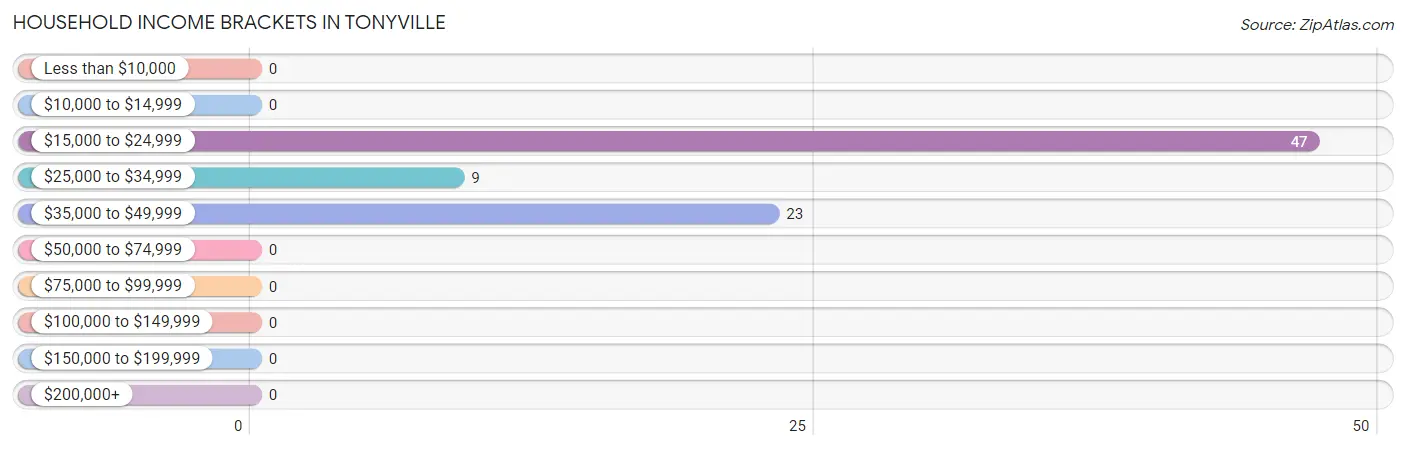
| Income Bracket | # Households | % Households |
| Less than $10,000 | 0 | 0.0% |
| $10,000 to $14,999 | 0 | 0.0% |
| $15,000 to $24,999 | 47 | 59.5% |
| $25,000 to $34,999 | 9 | 11.4% |
| $35,000 to $49,999 | 23 | 29.1% |
| $50,000 to $74,999 | 0 | 0.0% |
| $75,000 to $99,999 | 0 | 0.0% |
| $100,000 to $149,999 | 0 | 0.0% |
| $150,000 to $199,999 | 0 | 0.0% |
| $200,000+ | 0 | 0.0% |
Household Income by Householder Age in Tonyville
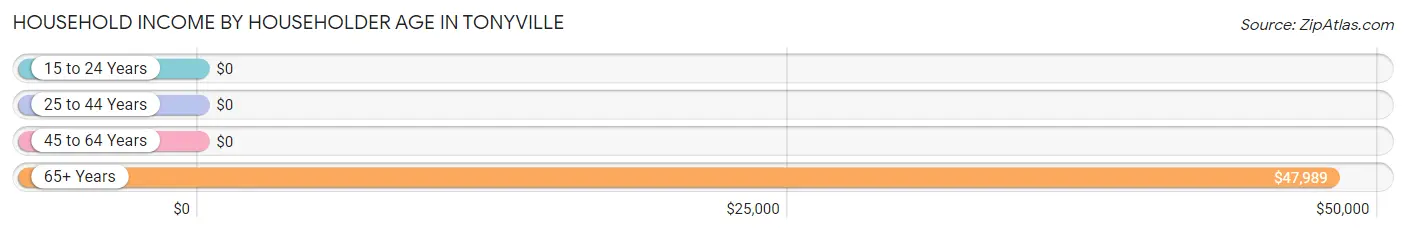
The median household income in Tonyville is $23,295, with the highest median household income of $47,989 found in the 65+ years age bracket for the primary householder. A total of 37 households (46.8%) fall into this category.
| Income Bracket | # Households | Median Income |
| 15 to 24 Years | 0 (0.0%) | $0 |
| 25 to 44 Years | 31 (39.2%) | $0 |
| 45 to 64 Years | 11 (13.9%) | $0 |
| 65+ Years | 37 (46.8%) | $47,989 |
| Total | 79 (100.0%) | $23,295 |
Poverty in Tonyville
Income Below Poverty by Sex and Age in Tonyville
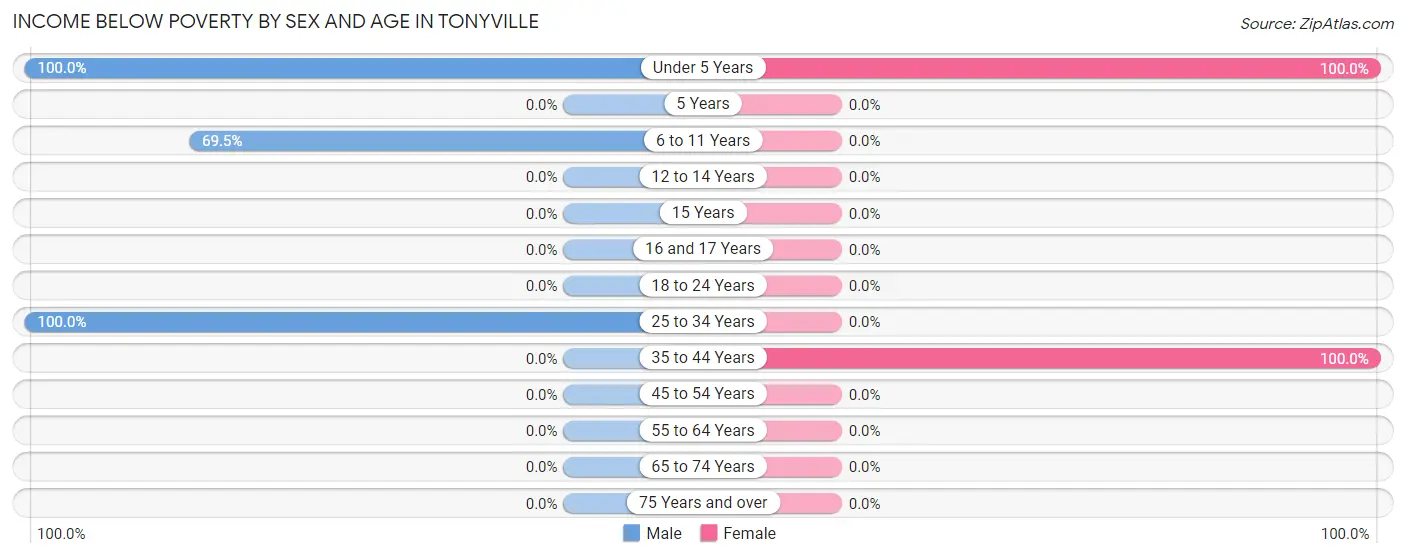
With 62.2% poverty level for males and 63.0% for females among the residents of Tonyville, under 5 year old males and under 5 year old females are the most vulnerable to poverty, with 32 males (100.0%) and 32 females (100.0%) in their respective age groups living below the poverty level.
| Age Bracket | Male | Female |
| Under 5 Years | 32 (100.0%) | 32 (100.0%) |
| 5 Years | 0 (0.0%) | 0 (0.0%) |
| 6 to 11 Years | 66 (69.5%) | 0 (0.0%) |
| 12 to 14 Years | 0 (0.0%) | 0 (0.0%) |
| 15 Years | 0 (0.0%) | 0 (0.0%) |
| 16 and 17 Years | 0 (0.0%) | 0 (0.0%) |
| 18 to 24 Years | 0 (0.0%) | 0 (0.0%) |
| 25 to 34 Years | 35 (100.0%) | 0 (0.0%) |
| 35 to 44 Years | 0 (0.0%) | 31 (100.0%) |
| 45 to 54 Years | 0 (0.0%) | 0 (0.0%) |
| 55 to 64 Years | 0 (0.0%) | 0 (0.0%) |
| 65 to 74 Years | 0 (0.0%) | 0 (0.0%) |
| 75 Years and over | 0 (0.0%) | 0 (0.0%) |
| Total | 133 (62.2%) | 63 (63.0%) |
Income Above Poverty by Sex and Age in Tonyville
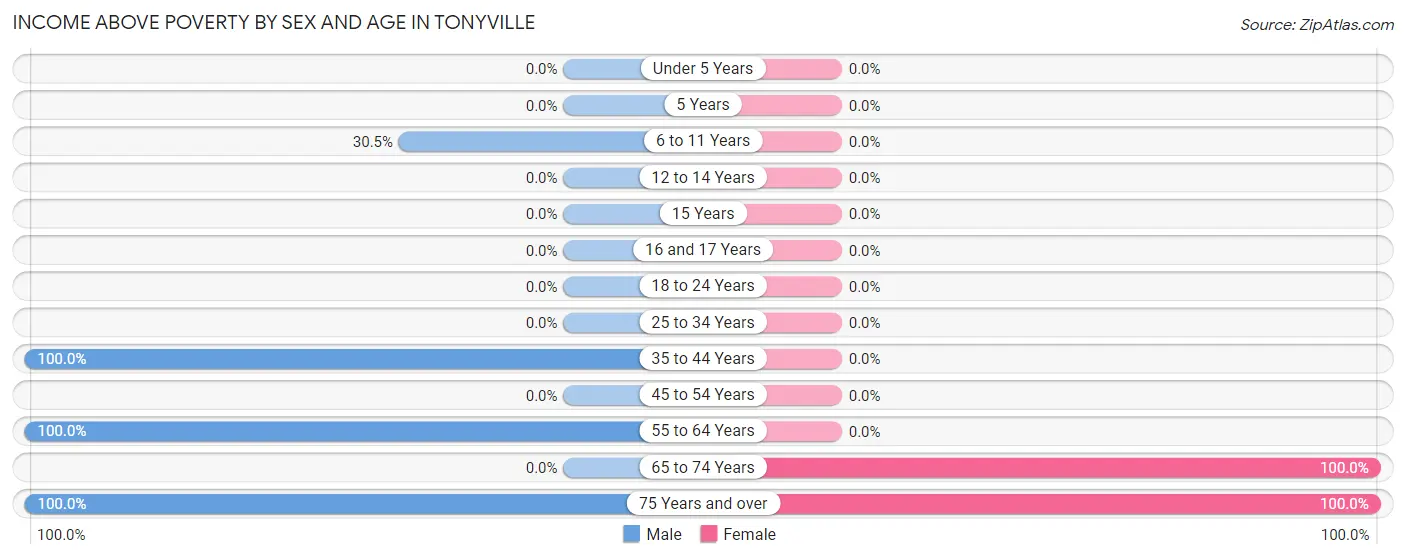
According to the poverty statistics in Tonyville, males aged 35 to 44 years and females aged 65 to 74 years are the age groups that are most secure financially, with 100.0% of males and 100.0% of females in these age groups living above the poverty line.
| Age Bracket | Male | Female |
| Under 5 Years | 0 (0.0%) | 0 (0.0%) |
| 5 Years | 0 (0.0%) | 0 (0.0%) |
| 6 to 11 Years | 29 (30.5%) | 0 (0.0%) |
| 12 to 14 Years | 0 (0.0%) | 0 (0.0%) |
| 15 Years | 0 (0.0%) | 0 (0.0%) |
| 16 and 17 Years | 0 (0.0%) | 0 (0.0%) |
| 18 to 24 Years | 0 (0.0%) | 0 (0.0%) |
| 25 to 34 Years | 0 (0.0%) | 0 (0.0%) |
| 35 to 44 Years | 32 (100.0%) | 0 (0.0%) |
| 45 to 54 Years | 0 (0.0%) | 0 (0.0%) |
| 55 to 64 Years | 11 (100.0%) | 0 (0.0%) |
| 65 to 74 Years | 0 (0.0%) | 23 (100.0%) |
| 75 Years and over | 9 (100.0%) | 14 (100.0%) |
| Total | 81 (37.9%) | 37 (37.0%) |
Income Below Poverty Among Married-Couple Families in Tonyville
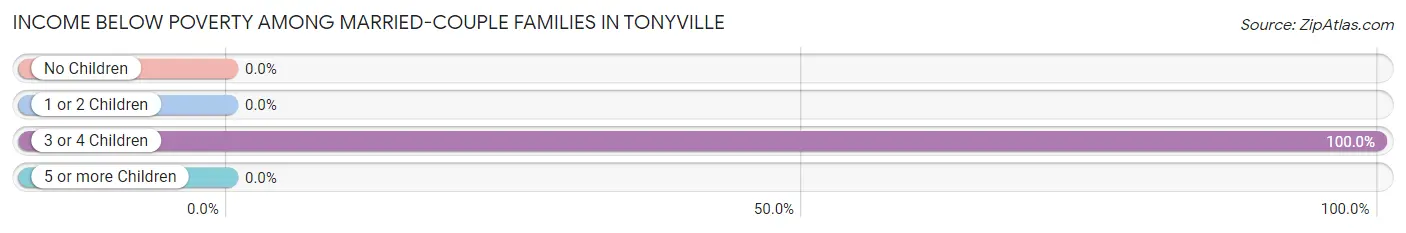
The poverty statistics for married-couple families in Tonyville show that 77.5% or 31 of the total 40 families live below the poverty line. Families with 3 or 4 children have the highest poverty rate of 100.0%, comprising of 31 families. On the other hand, families with no children have the lowest poverty rate of 0.0%, which includes 0 families.
| Children | Above Poverty | Below Poverty |
| No Children | 9 (100.0%) | 0 (0.0%) |
| 1 or 2 Children | 0 (0.0%) | 0 (0.0%) |
| 3 or 4 Children | 0 (0.0%) | 31 (100.0%) |
| 5 or more Children | 0 (0.0%) | 0 (0.0%) |
| Total | 9 (22.5%) | 31 (77.5%) |
Income Below Poverty Among Single-Parent Households in Tonyville
| Children | Single Father | Single Mother |
| No Children | 0 (0.0%) | 0 (0.0%) |
| 1 or 2 Children | 0 (0.0%) | 0 (0.0%) |
| 3 or 4 Children | 0 (0.0%) | 0 (0.0%) |
| 5 or more Children | 0 (0.0%) | 0 (0.0%) |
| Total | 0 (0.0%) | 0 (0.0%) |
Income Below Poverty Among Married-Couple vs Single-Parent Households in Tonyville
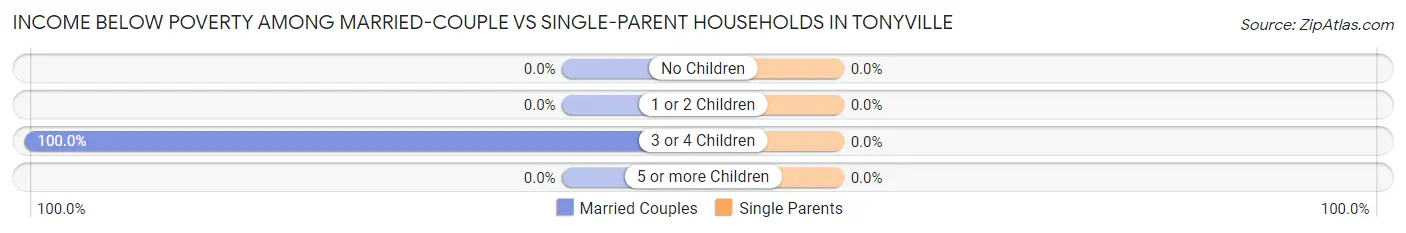
| Children | Married-Couple Families | Single-Parent Households |
| No Children | 0 (0.0%) | 0 (0.0%) |
| 1 or 2 Children | 0 (0.0%) | 0 (0.0%) |
| 3 or 4 Children | 31 (100.0%) | 0 (0.0%) |
| 5 or more Children | 0 (0.0%) | 0 (0.0%) |
| Total | 31 (77.5%) | 0 (0.0%) |
Race in Tonyville
The most populous races in Tonyville are Hispanic or Latino (314 | 100.0%), Some other Race (196 | 62.4%), and Two or more Races (84 | 26.8%).
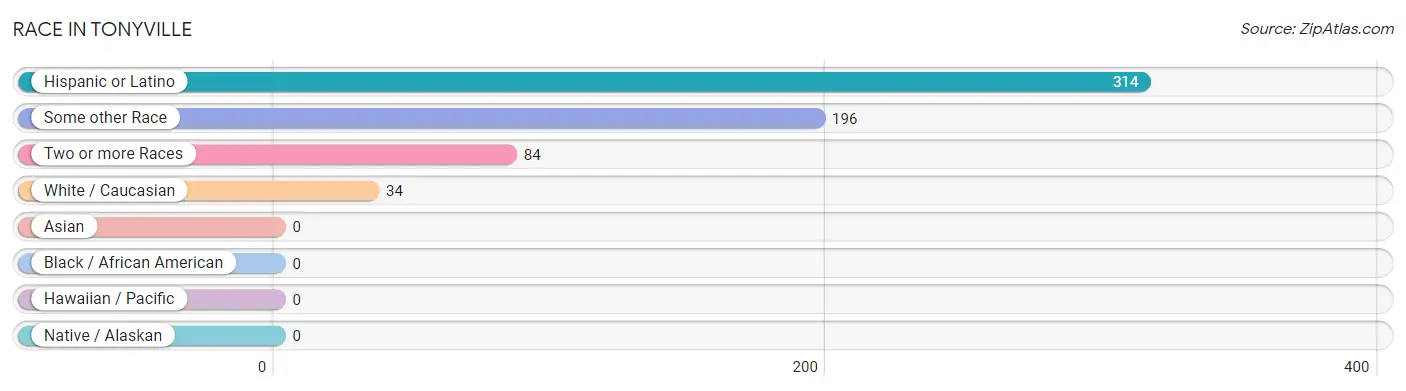
| Race | # Population | % Population |
| Asian | 0 | 0.0% |
| Black / African American | 0 | 0.0% |
| Hawaiian / Pacific | 0 | 0.0% |
| Hispanic or Latino | 314 | 100.0% |
| Native / Alaskan | 0 | 0.0% |
| White / Caucasian | 34 | 10.8% |
| Two or more Races | 84 | 26.8% |
| Some other Race | 196 | 62.4% |
| Total | 314 | 100.0% |
Ancestry in Tonyville
The most populous ancestries reported in Tonyville are Mexican (303 | 96.5%), Central American (11 | 3.5%), and Guatemalan (11 | 3.5%), together accounting for 103.5% of all Tonyville residents.
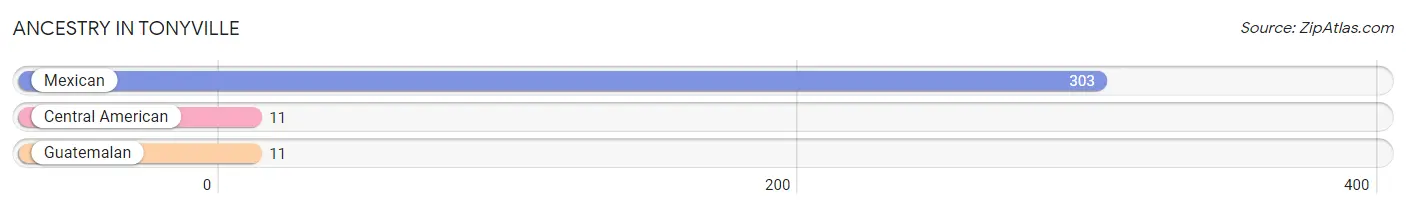
| Ancestry | # Population | % Population |
| Central American | 11 | 3.5% |
| Guatemalan | 11 | 3.5% |
| Mexican | 303 | 96.5% | View All 3 Rows |
Immigrants in Tonyville
The most numerous immigrant groups reported in Tonyville came from Central America (132 | 42.0%), Latin America (132 | 42.0%), Mexico (121 | 38.5%), and Guatemala (11 | 3.5%), together accounting for 126.1% of all Tonyville residents.
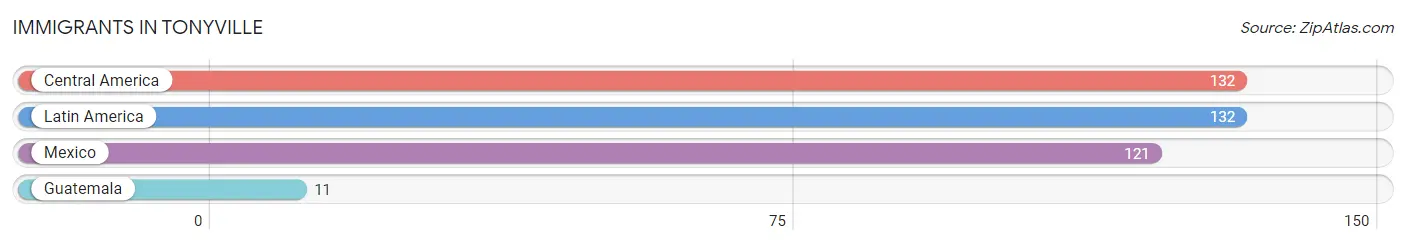
| Immigration Origin | # Population | % Population |
| Central America | 132 | 42.0% |
| Guatemala | 11 | 3.5% |
| Latin America | 132 | 42.0% |
| Mexico | 121 | 38.5% | View All 4 Rows |
Sex and Age in Tonyville
Sex and Age in Tonyville
The most populous age groups in Tonyville are 10 to 14 Years (62 | 29.0%) for men and Under 5 Years (32 | 32.0%) for women.
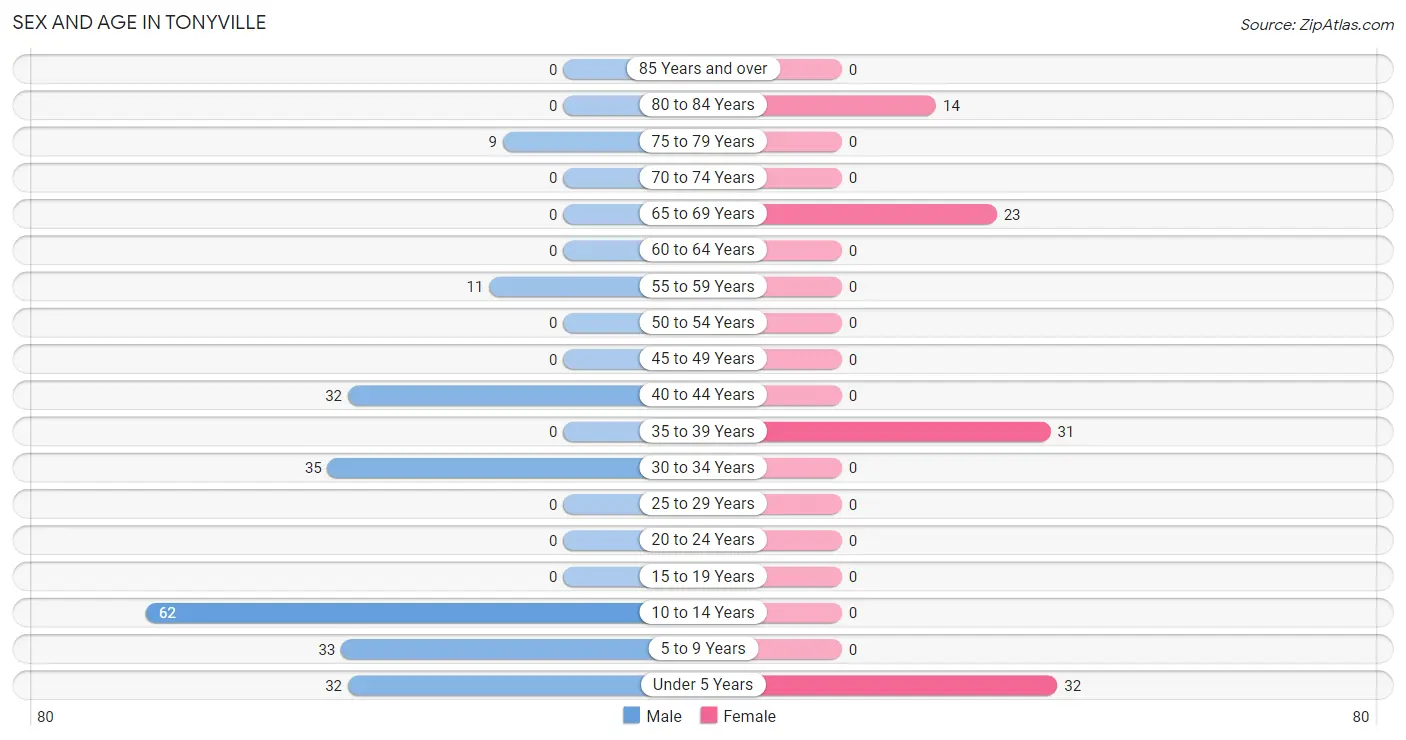
| Age Bracket | Male | Female |
| Under 5 Years | 32 (14.9%) | 32 (32.0%) |
| 5 to 9 Years | 33 (15.4%) | 0 (0.0%) |
| 10 to 14 Years | 62 (29.0%) | 0 (0.0%) |
| 15 to 19 Years | 0 (0.0%) | 0 (0.0%) |
| 20 to 24 Years | 0 (0.0%) | 0 (0.0%) |
| 25 to 29 Years | 0 (0.0%) | 0 (0.0%) |
| 30 to 34 Years | 35 (16.4%) | 0 (0.0%) |
| 35 to 39 Years | 0 (0.0%) | 31 (31.0%) |
| 40 to 44 Years | 32 (14.9%) | 0 (0.0%) |
| 45 to 49 Years | 0 (0.0%) | 0 (0.0%) |
| 50 to 54 Years | 0 (0.0%) | 0 (0.0%) |
| 55 to 59 Years | 11 (5.1%) | 0 (0.0%) |
| 60 to 64 Years | 0 (0.0%) | 0 (0.0%) |
| 65 to 69 Years | 0 (0.0%) | 23 (23.0%) |
| 70 to 74 Years | 0 (0.0%) | 0 (0.0%) |
| 75 to 79 Years | 9 (4.2%) | 0 (0.0%) |
| 80 to 84 Years | 0 (0.0%) | 14 (14.0%) |
| 85 Years and over | 0 (0.0%) | 0 (0.0%) |
| Total | 214 (100.0%) | 100 (100.0%) |
Families and Households in Tonyville
Median Family Size in Tonyville
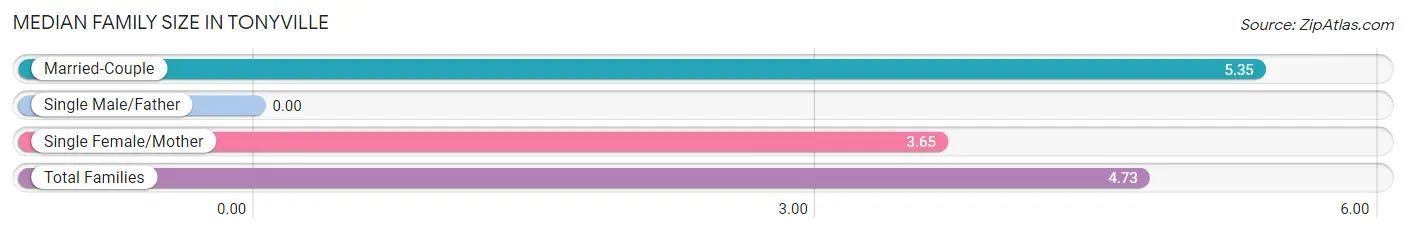
| Family Type | # Families | Family Size |
| Married-Couple | 40 (63.5%) | 5.35 |
| Single Male/Father | 0 (0.0%) | - |
| Single Female/Mother | 23 (36.5%) | 3.65 |
| Total Families | 63 (100.0%) | 4.73 |
Median Household Size in Tonyville
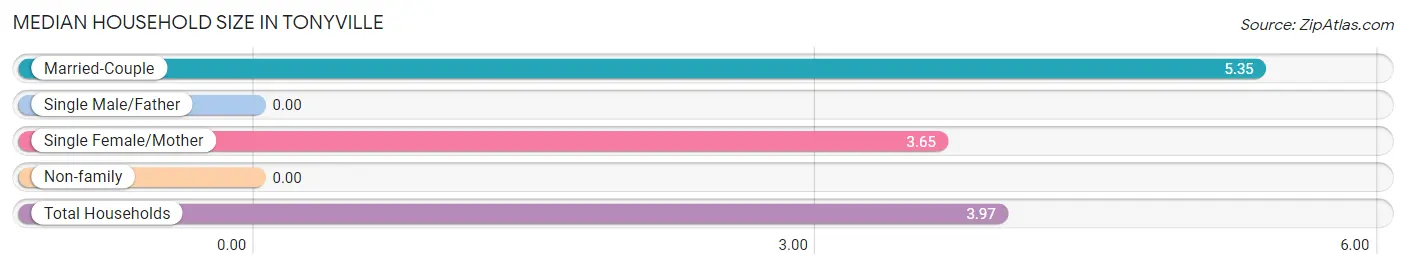
| Household Type | # Households | Household Size |
| Married-Couple | 40 (50.6%) | 5.35 |
| Single Male/Father | 0 (0.0%) | - |
| Single Female/Mother | 23 (29.1%) | 3.65 |
| Non-family | 16 (20.3%) | - |
| Total Households | 79 (100.0%) | 3.97 |
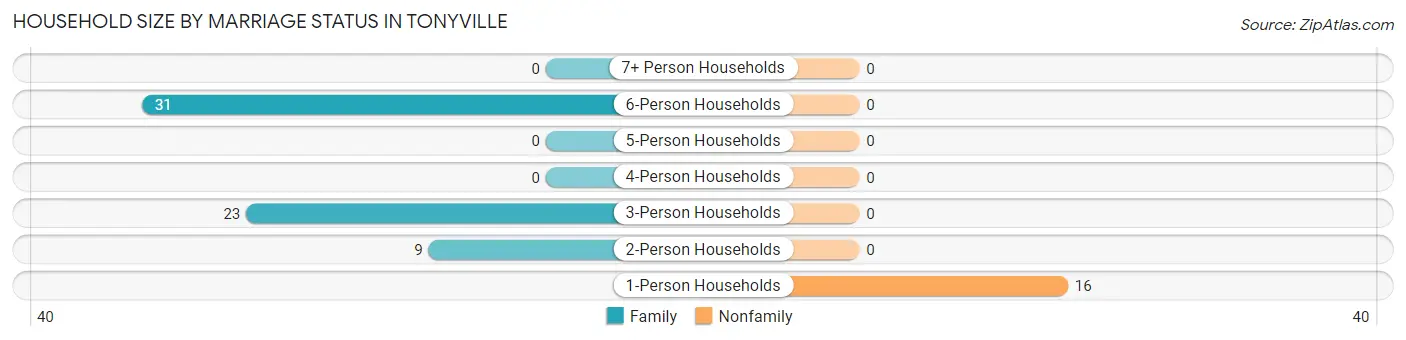
Household Size by Marriage Status in Tonyville
Out of a total of 79 households in Tonyville, 63 (79.7%) are family households, while 16 (20.3%) are nonfamily households. The most numerous type of family households are 6-person households, comprising 31, and the most common type of nonfamily households are 1-person households, comprising 16.
| Household Size | Family Households | Nonfamily Households |
| 1-Person Households | - | 16 (20.3%) |
| 2-Person Households | 9 (11.4%) | 0 (0.0%) |
| 3-Person Households | 23 (29.1%) | 0 (0.0%) |
| 4-Person Households | 0 (0.0%) | 0 (0.0%) |
| 5-Person Households | 0 (0.0%) | 0 (0.0%) |
| 6-Person Households | 31 (39.2%) | 0 (0.0%) |
| 7+ Person Households | 0 (0.0%) | 0 (0.0%) |
| Total | 63 (79.7%) | 16 (20.3%) |
Female Fertility in Tonyville
Fertility by Age in Tonyville
| Age Bracket | Women with Births | Births / 1,000 Women |
| 15 to 19 years | 0 (0.0%) | 0.0 |
| 20 to 34 years | 0 (0.0%) | 0.0 |
| 35 to 50 years | 0 (0.0%) | 0.0 |
| Total | 0 (0.0%) | 0.0 |
Fertility by Age by Marriage Status in Tonyville
| Age Bracket | Married | Unmarried |
| 15 to 19 years | 0 (0.0%) | 0 (0.0%) |
| 20 to 34 years | 0 (0.0%) | 0 (0.0%) |
| 35 to 50 years | 0 (0.0%) | 0 (0.0%) |
| Total | 0 (0.0%) | 0 (0.0%) |
Fertility by Education in Tonyville
| Educational Attainment | Women with Births | Births / 1,000 Women |
| Less than High School | 0 (0.0%) | 0.0 |
| High School Diploma | 0 (0.0%) | 0.0 |
| College or Associate's Degree | 0 (0.0%) | 0.0 |
| Bachelor's Degree | 0 (0.0%) | 0.0 |
| Graduate Degree | 0 (0.0%) | 0.0 |
| Total | 0 (0.0%) | 0.0 |
Fertility by Education by Marriage Status in Tonyville
| Educational Attainment | Married | Unmarried |
| Less than High School | 0 (0.0%) | 0 (0.0%) |
| High School Diploma | 0 (0.0%) | 0 (0.0%) |
| College or Associate's Degree | 0 (0.0%) | 0 (0.0%) |
| Bachelor's Degree | 0 (0.0%) | 0 (0.0%) |
| Graduate Degree | 0 (0.0%) | 0 (0.0%) |
| Total | 0 (0.0%) | 0 (0.0%) |
Employment Characteristics in Tonyville
Employment by Class of Employer in Tonyville
Among the 67 employed individuals in Tonyville, , and private company employees (67 | 100.0%) make up the most common classes of employment.
| Employer Class | # Employees | % Employees |
| Private Company Employees | 67 | 100.0% |
| Self-Employed (Incorporated) | 0 | 0.0% |
| Self-Employed (Not Incorporated) | 0 | 0.0% |
| Not-for-profit Organizations | 0 | 0.0% |
| Local Government Employees | 0 | 0.0% |
| State Government Employees | 0 | 0.0% |
| Federal Government Employees | 0 | 0.0% |
| Unpaid Family Workers | 0 | 0.0% |
| Total | 67 | 100.0% |
Employment Status by Age in Tonyville
According to the labor force statistics for Tonyville, out of the total population over 16 years of age (155), 50.3% or 78 individuals are in the labor force, with 14.1% or 11 of them unemployed. The age group with the highest labor force participation rate is 30 to 34 years, with 100.0% or 35 individuals in the labor force. Within the labor force, the 55 to 59 years age range has the highest percentage of unemployed individuals, with 100.0% or 11 of them being unemployed.
| Age Bracket | In Labor Force | Unemployed |
| 16 to 19 Years | 0 (0.0%) | 0 (0.0%) |
| 20 to 24 Years | 0 (0.0%) | 0 (0.0%) |
| 25 to 29 Years | 0 (0.0%) | 0 (0.0%) |
| 30 to 34 Years | 35 (100.0%) | 0 (0.0%) |
| 35 to 44 Years | 32 (50.8%) | 0 (0.0%) |
| 45 to 54 Years | 0 (0.0%) | 0 (0.0%) |
| 55 to 59 Years | 11 (100.0%) | 11 (100.0%) |
| 60 to 64 Years | 0 (0.0%) | 0 (0.0%) |
| 65 to 74 Years | 0 (0.0%) | 0 (0.0%) |
| 75 Years and over | 0 (0.0%) | 0 (0.0%) |
| Total | 78 (50.3%) | 11 (14.1%) |
Employment Status by Educational Attainment in Tonyville
According to labor force statistics for Tonyville, 71.6% of individuals (78) out of the total population between 25 and 64 years of age (109) are in the labor force, with 14.1% or 11 of them being unemployed. The group with the highest labor force participation rate are those with the educational attainment of high school diploma, with 100.0% or 32 individuals in the labor force. Within the labor force, individuals with less than high school education have the highest percentage of unemployment, with 23.9% or 11 of them being unemployed.
| Educational Attainment | In Labor Force | Unemployed |
| Less than High School | 46 (59.7%) | 18 (23.9%) |
| High School Diploma | 32 (100.0%) | 0 (0.0%) |
| College / Associate Degree | 0 (0.0%) | 0 (0.0%) |
| Bachelor's Degree or higher | 0 (0.0%) | 0 (0.0%) |
| Total | 78 (71.6%) | 15 (14.1%) |
Employment Occupations by Sex in Tonyville
Management, Business, Science and Arts Occupations
Management, Business, Science and Arts Occupations by Sex
| Occupation | Male | Female |
| Management | 0 (0.0%) | 0 (0.0%) |
| Business & Financial | 0 (0.0%) | 0 (0.0%) |
| Computers, Engineering & Science | 0 (0.0%) | 0 (0.0%) |
| Computers & Mathematics | 0 (0.0%) | 0 (0.0%) |
| Architecture & Engineering | 0 (0.0%) | 0 (0.0%) |
| Life, Physical & Social Science | 0 (0.0%) | 0 (0.0%) |
| Community & Social Service | 0 (0.0%) | 0 (0.0%) |
| Education, Arts & Media | 0 (0.0%) | 0 (0.0%) |
| Legal Services & Support | 0 (0.0%) | 0 (0.0%) |
| Education Instruction & Library | 0 (0.0%) | 0 (0.0%) |
| Arts, Media & Entertainment | 0 (0.0%) | 0 (0.0%) |
| Health Diagnosing & Treating | 0 (0.0%) | 0 (0.0%) |
| Health Technologists | 0 (0.0%) | 0 (0.0%) |
| Total (Category) | 0 (0.0%) | 0 (0.0%) |
| Total (Overall) | 67 (100.0%) | 0 (0.0%) |
Services Occupations
Services Occupations by Sex
| Occupation | Male | Female |
| Healthcare Support | 0 (0.0%) | 0 (0.0%) |
| Security & Protection | 0 (0.0%) | 0 (0.0%) |
| Firefighting & Prevention | 0 (0.0%) | 0 (0.0%) |
| Law Enforcement | 0 (0.0%) | 0 (0.0%) |
| Food Preparation & Serving | 0 (0.0%) | 0 (0.0%) |
| Cleaning & Maintenance | 0 (0.0%) | 0 (0.0%) |
| Personal Care & Service | 0 (0.0%) | 0 (0.0%) |
| Total (Category) | 0 (0.0%) | 0 (0.0%) |
| Total (Overall) | 67 (100.0%) | 0 (0.0%) |
Sales and Office Occupations
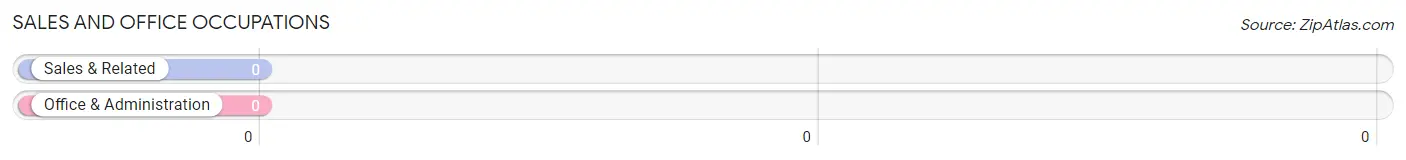
Sales and Office Occupations by Sex
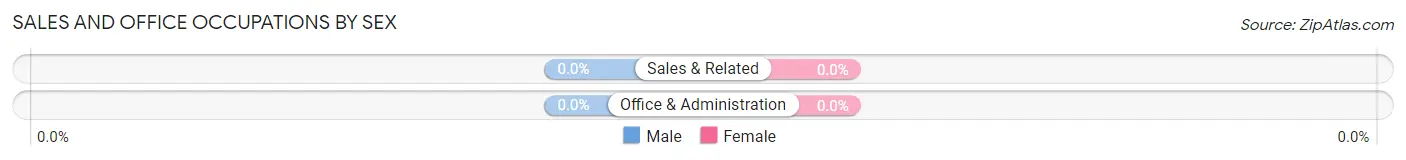
| Occupation | Male | Female |
| Sales & Related | 0 (0.0%) | 0 (0.0%) |
| Office & Administration | 0 (0.0%) | 0 (0.0%) |
| Total (Category) | 0 (0.0%) | 0 (0.0%) |
| Total (Overall) | 67 (100.0%) | 0 (0.0%) |
Natural Resources, Construction and Maintenance Occupations
The most common Natural Resources, Construction and Maintenance occupations in Tonyville are , and Farming, Fishing & Forestry (35 | 52.2%).
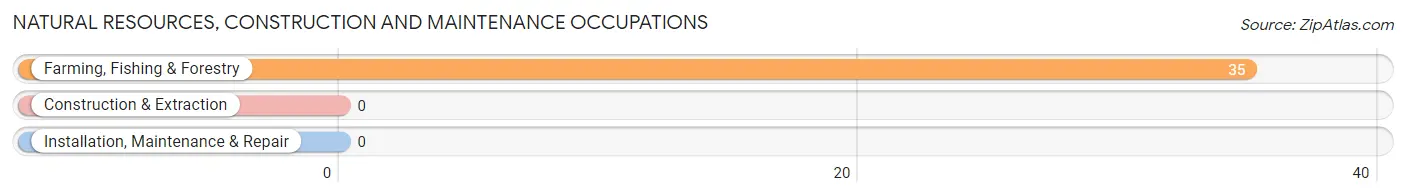
Natural Resources, Construction and Maintenance Occupations by Sex
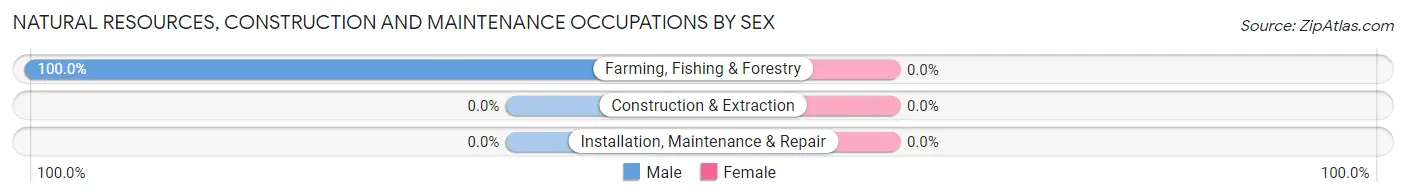
| Occupation | Male | Female |
| Farming, Fishing & Forestry | 35 (100.0%) | 0 (0.0%) |
| Construction & Extraction | 0 (0.0%) | 0 (0.0%) |
| Installation, Maintenance & Repair | 0 (0.0%) | 0 (0.0%) |
| Total (Category) | 35 (100.0%) | 0 (0.0%) |
| Total (Overall) | 67 (100.0%) | 0 (0.0%) |
Production, Transportation and Moving Occupations
The most common Production, Transportation and Moving occupations in Tonyville are , and Transportation (32 | 47.8%).
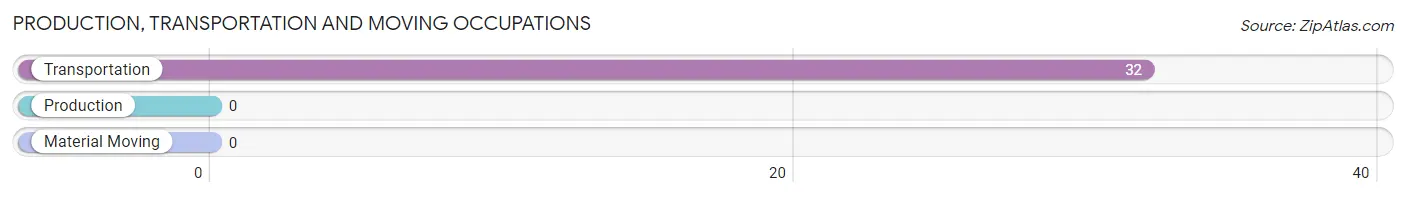
Production, Transportation and Moving Occupations by Sex
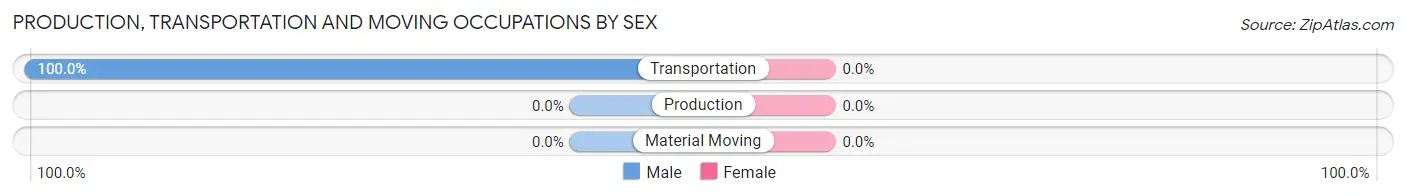
| Occupation | Male | Female |
| Production | 0 (0.0%) | 0 (0.0%) |
| Transportation | 32 (100.0%) | 0 (0.0%) |
| Material Moving | 0 (0.0%) | 0 (0.0%) |
| Total (Category) | 32 (100.0%) | 0 (0.0%) |
| Total (Overall) | 67 (100.0%) | 0 (0.0%) |
Employment Industries by Sex in Tonyville
Employment Industries in Tonyville
The major employment industries in Tonyville include Agriculture, Fishing & Hunting (35 | 52.2%), and Transportation & Warehousing (32 | 47.8%).
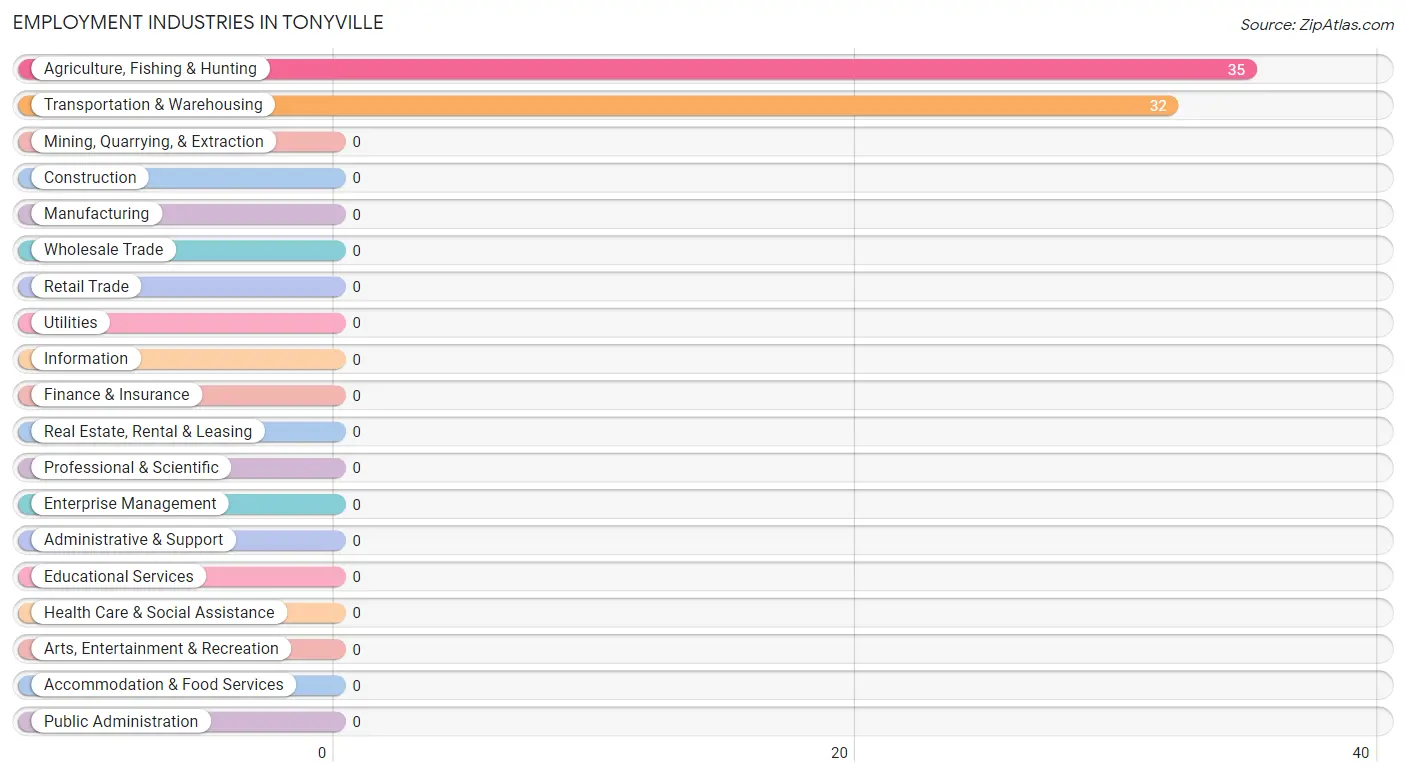
Employment Industries by Sex in Tonyville
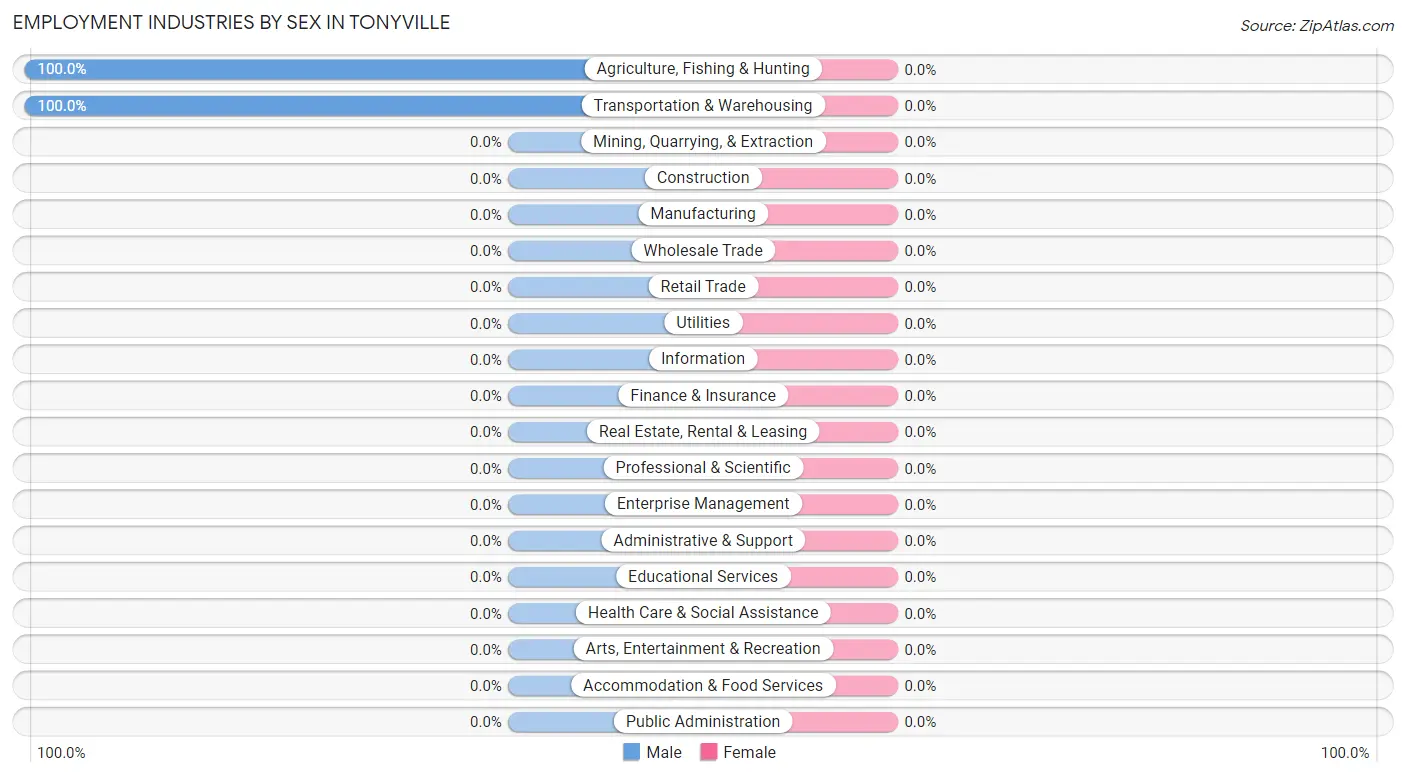
| Industry | Male | Female |
| Agriculture, Fishing & Hunting | 35 (100.0%) | 0 (0.0%) |
| Mining, Quarrying, & Extraction | 0 (0.0%) | 0 (0.0%) |
| Construction | 0 (0.0%) | 0 (0.0%) |
| Manufacturing | 0 (0.0%) | 0 (0.0%) |
| Wholesale Trade | 0 (0.0%) | 0 (0.0%) |
| Retail Trade | 0 (0.0%) | 0 (0.0%) |
| Transportation & Warehousing | 32 (100.0%) | 0 (0.0%) |
| Utilities | 0 (0.0%) | 0 (0.0%) |
| Information | 0 (0.0%) | 0 (0.0%) |
| Finance & Insurance | 0 (0.0%) | 0 (0.0%) |
| Real Estate, Rental & Leasing | 0 (0.0%) | 0 (0.0%) |
| Professional & Scientific | 0 (0.0%) | 0 (0.0%) |
| Enterprise Management | 0 (0.0%) | 0 (0.0%) |
| Administrative & Support | 0 (0.0%) | 0 (0.0%) |
| Educational Services | 0 (0.0%) | 0 (0.0%) |
| Health Care & Social Assistance | 0 (0.0%) | 0 (0.0%) |
| Arts, Entertainment & Recreation | 0 (0.0%) | 0 (0.0%) |
| Accommodation & Food Services | 0 (0.0%) | 0 (0.0%) |
| Public Administration | 0 (0.0%) | 0 (0.0%) |
| Total | 67 (100.0%) | 0 (0.0%) |
Education in Tonyville
School Enrollment in Tonyville
The most common levels of schooling among the 127 students in Tonyville are elementary school (66 | 52.0%), nursery / preschool (32 | 25.2%), and middle school (29 | 22.8%).
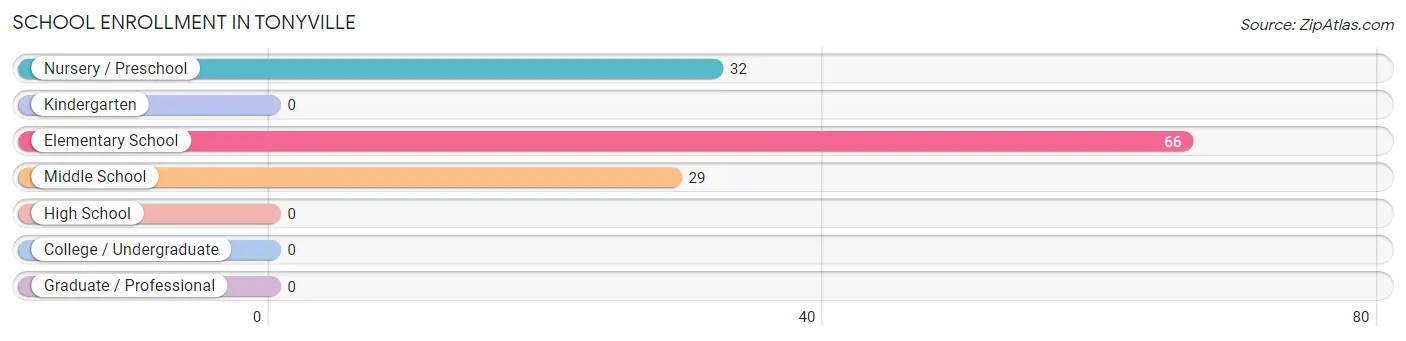
| School Level | # Students | % Students |
| Nursery / Preschool | 32 | 25.2% |
| Kindergarten | 0 | 0.0% |
| Elementary School | 66 | 52.0% |
| Middle School | 29 | 22.8% |
| High School | 0 | 0.0% |
| College / Undergraduate | 0 | 0.0% |
| Graduate / Professional | 0 | 0.0% |
| Total | 127 | 100.0% |
School Enrollment by Age by Funding Source in Tonyville
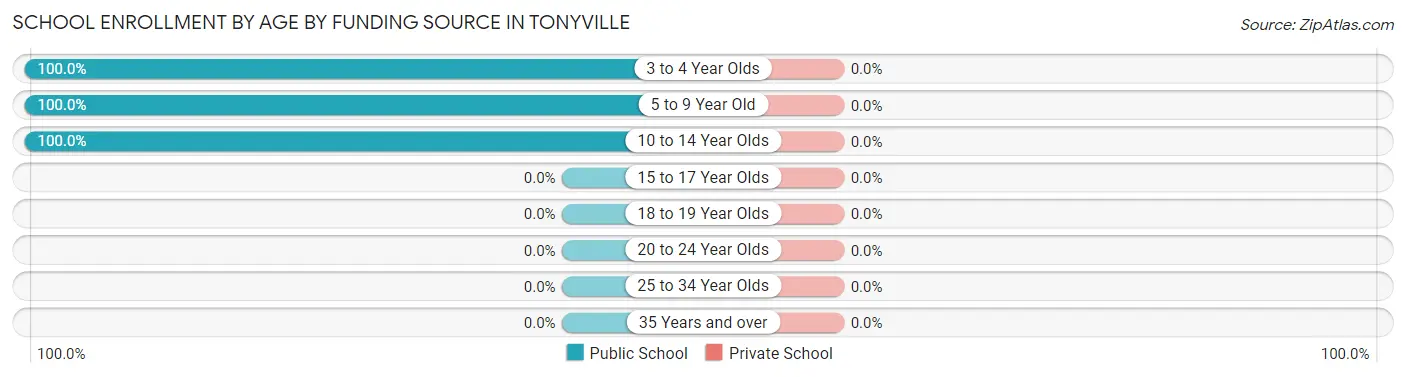
| Age Bracket | Public School | Private School |
| 3 to 4 Year Olds | 32 (100.0%) | 0 (0.0%) |
| 5 to 9 Year Old | 33 (100.0%) | 0 (0.0%) |
| 10 to 14 Year Olds | 62 (100.0%) | 0 (0.0%) |
| 15 to 17 Year Olds | 0 (0.0%) | 0 (0.0%) |
| 18 to 19 Year Olds | 0 (0.0%) | 0 (0.0%) |
| 20 to 24 Year Olds | 0 (0.0%) | 0 (0.0%) |
| 25 to 34 Year Olds | 0 (0.0%) | 0 (0.0%) |
| 35 Years and over | 0 (0.0%) | 0 (0.0%) |
| Total | 127 (100.0%) | 0 (0.0%) |
Educational Attainment by Field of Study in Tonyville
| Field of Study | # Graduates | % Graduates |
| Computers & Mathematics | 0 | 0.0% |
| Bio, Nature & Agricultural | 0 | 0.0% |
| Physical & Health Sciences | 0 | 0.0% |
| Psychology | 0 | 0.0% |
| Social Sciences | 0 | 0.0% |
| Engineering | 0 | 0.0% |
| Multidisciplinary Studies | 0 | 0.0% |
| Science & Technology | 0 | 0.0% |
| Business | 0 | 0.0% |
| Education | 0 | 0.0% |
| Literature & Languages | 0 | 0.0% |
| Liberal Arts & History | 0 | 0.0% |
| Visual & Performing Arts | 0 | 0.0% |
| Communications | 0 | 0.0% |
| Arts & Humanities | 0 | 0.0% |
| Total | 0 | 0.0% |
Transportation & Commute in Tonyville
Vehicle Availability by Sex in Tonyville
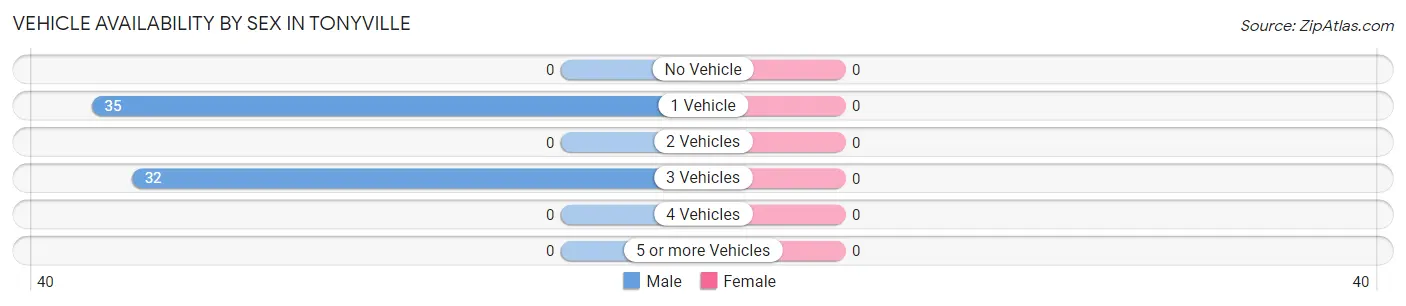
| Vehicles Available | Male | Female |
| No Vehicle | 0 (0.0%) | 0 (0.0%) |
| 1 Vehicle | 35 (52.2%) | 0 (0.0%) |
| 2 Vehicles | 0 (0.0%) | 0 (0.0%) |
| 3 Vehicles | 32 (47.8%) | 0 (0.0%) |
| 4 Vehicles | 0 (0.0%) | 0 (0.0%) |
| 5 or more Vehicles | 0 (0.0%) | 0 (0.0%) |
| Total | 67 (100.0%) | 0 (0.0%) |
Commute Time in Tonyville
The most frequently occuring commute durations in Tonyville are 30 to 34 minutes (35 commuters, 52.2%), 90 or more minutes (32 commuters, 47.8%), and less than 5 minutes (0 commuters, 0.0%).
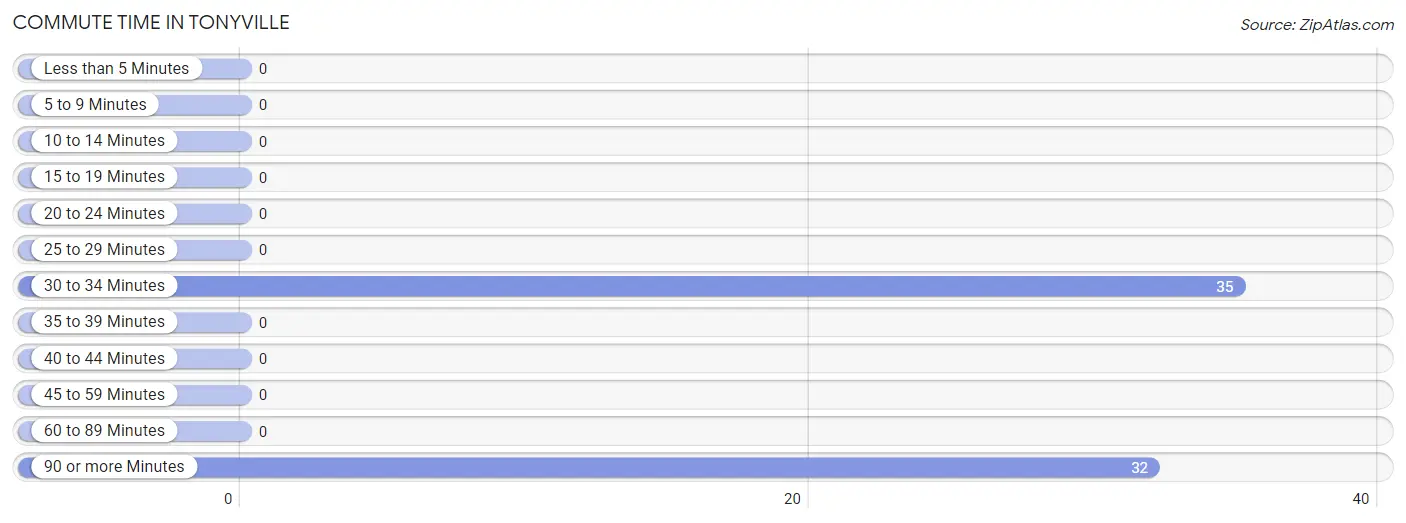
| Commute Time | # Commuters | % Commuters |
| Less than 5 Minutes | 0 | 0.0% |
| 5 to 9 Minutes | 0 | 0.0% |
| 10 to 14 Minutes | 0 | 0.0% |
| 15 to 19 Minutes | 0 | 0.0% |
| 20 to 24 Minutes | 0 | 0.0% |
| 25 to 29 Minutes | 0 | 0.0% |
| 30 to 34 Minutes | 35 | 52.2% |
| 35 to 39 Minutes | 0 | 0.0% |
| 40 to 44 Minutes | 0 | 0.0% |
| 45 to 59 Minutes | 0 | 0.0% |
| 60 to 89 Minutes | 0 | 0.0% |
| 90 or more Minutes | 32 | 47.8% |
Commute Time by Sex in Tonyville
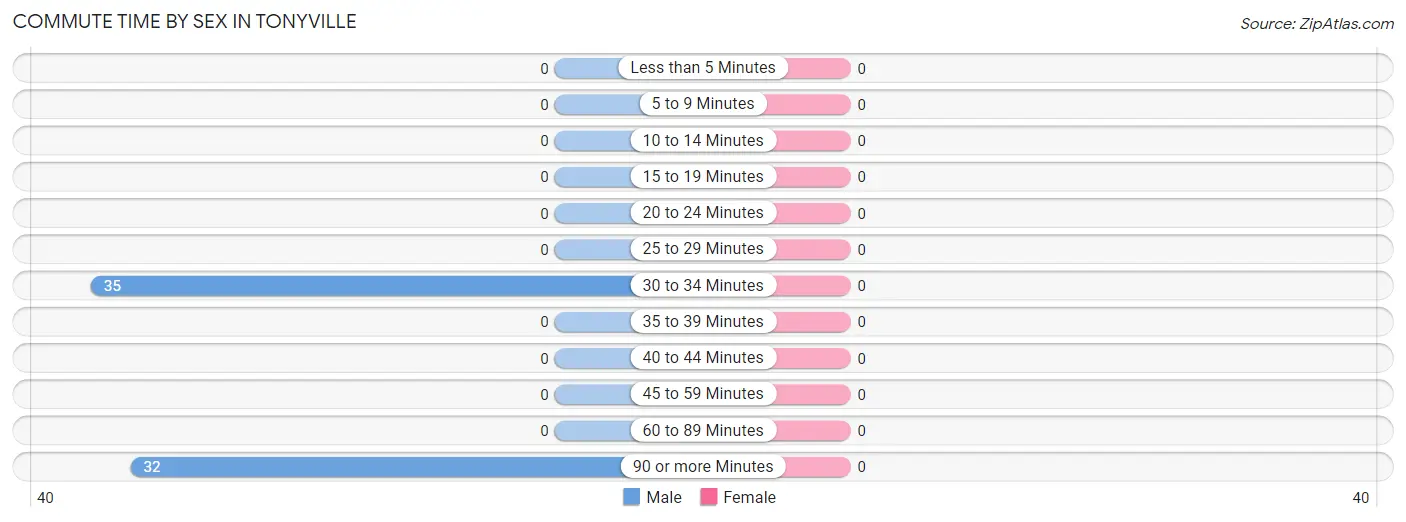
| Commute Time | Male | Female |
| Less than 5 Minutes | 0 (0.0%) | 0 (0.0%) |
| 5 to 9 Minutes | 0 (0.0%) | 0 (0.0%) |
| 10 to 14 Minutes | 0 (0.0%) | 0 (0.0%) |
| 15 to 19 Minutes | 0 (0.0%) | 0 (0.0%) |
| 20 to 24 Minutes | 0 (0.0%) | 0 (0.0%) |
| 25 to 29 Minutes | 0 (0.0%) | 0 (0.0%) |
| 30 to 34 Minutes | 35 (52.2%) | 0 (0.0%) |
| 35 to 39 Minutes | 0 (0.0%) | 0 (0.0%) |
| 40 to 44 Minutes | 0 (0.0%) | 0 (0.0%) |
| 45 to 59 Minutes | 0 (0.0%) | 0 (0.0%) |
| 60 to 89 Minutes | 0 (0.0%) | 0 (0.0%) |
| 90 or more Minutes | 32 (47.8%) | 0 (0.0%) |
Time of Departure to Work by Sex in Tonyville
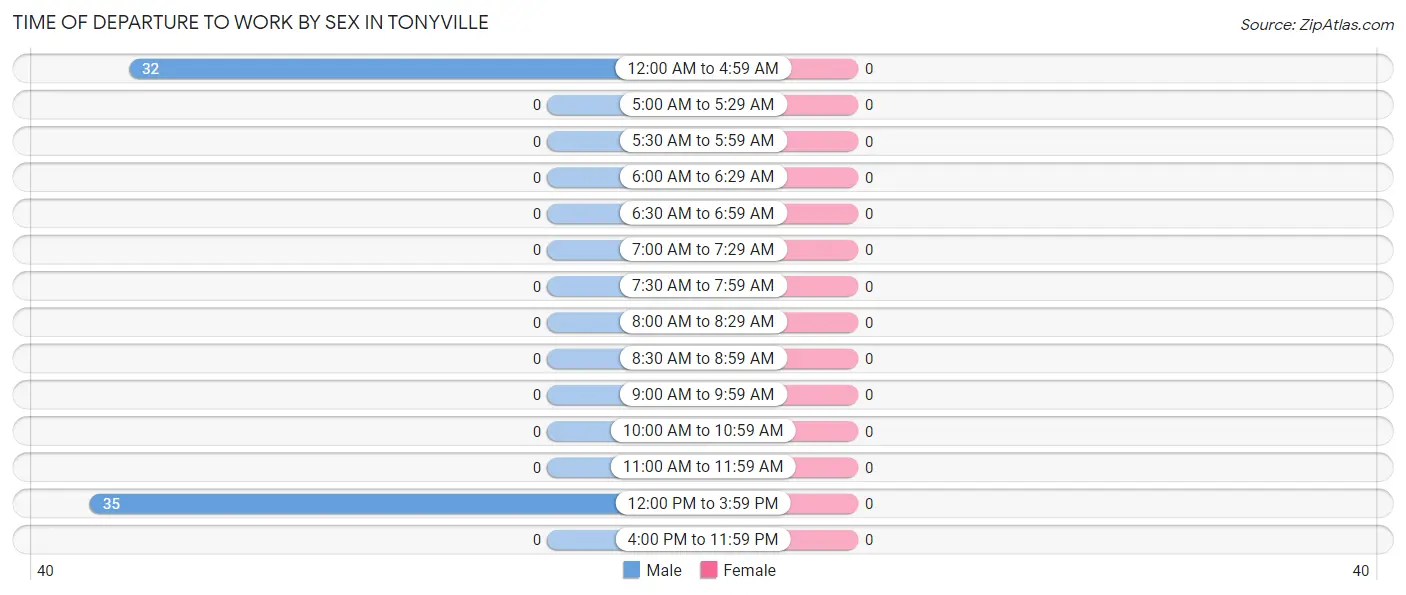
| Time of Departure | Male | Female |
| 12:00 AM to 4:59 AM | 32 (47.8%) | 0 (0.0%) |
| 5:00 AM to 5:29 AM | 0 (0.0%) | 0 (0.0%) |
| 5:30 AM to 5:59 AM | 0 (0.0%) | 0 (0.0%) |
| 6:00 AM to 6:29 AM | 0 (0.0%) | 0 (0.0%) |
| 6:30 AM to 6:59 AM | 0 (0.0%) | 0 (0.0%) |
| 7:00 AM to 7:29 AM | 0 (0.0%) | 0 (0.0%) |
| 7:30 AM to 7:59 AM | 0 (0.0%) | 0 (0.0%) |
| 8:00 AM to 8:29 AM | 0 (0.0%) | 0 (0.0%) |
| 8:30 AM to 8:59 AM | 0 (0.0%) | 0 (0.0%) |
| 9:00 AM to 9:59 AM | 0 (0.0%) | 0 (0.0%) |
| 10:00 AM to 10:59 AM | 0 (0.0%) | 0 (0.0%) |
| 11:00 AM to 11:59 AM | 0 (0.0%) | 0 (0.0%) |
| 12:00 PM to 3:59 PM | 35 (52.2%) | 0 (0.0%) |
| 4:00 PM to 11:59 PM | 0 (0.0%) | 0 (0.0%) |
| Total | 67 (100.0%) | 0 (0.0%) |
Housing Occupancy in Tonyville
Occupancy by Ownership in Tonyville
Of the total 79 dwellings in Tonyville, owner-occupied units account for 48 (60.8%), while renter-occupied units make up 31 (39.2%).
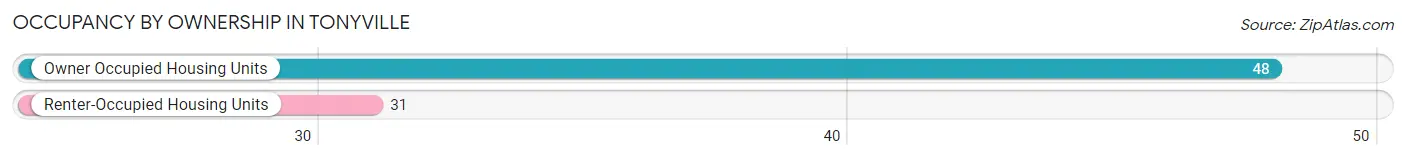
| Occupancy | # Housing Units | % Housing Units |
| Owner Occupied Housing Units | 48 | 60.8% |
| Renter-Occupied Housing Units | 31 | 39.2% |
| Total Occupied Housing Units | 79 | 100.0% |
Occupancy by Household Size in Tonyville
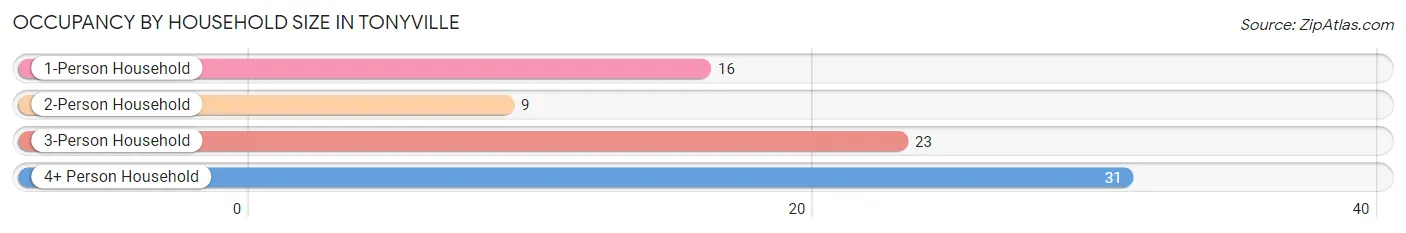
| Household Size | # Housing Units | % Housing Units |
| 1-Person Household | 16 | 20.3% |
| 2-Person Household | 9 | 11.4% |
| 3-Person Household | 23 | 29.1% |
| 4+ Person Household | 31 | 39.2% |
| Total Housing Units | 79 | 100.0% |
Occupancy by Ownership by Household Size in Tonyville
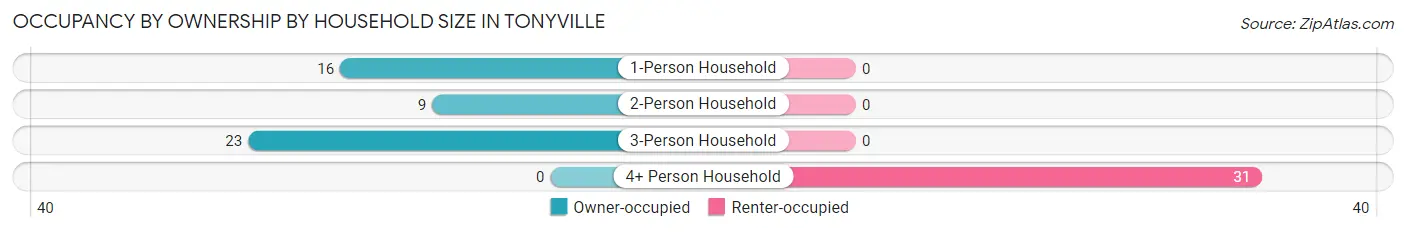
| Household Size | Owner-occupied | Renter-occupied |
| 1-Person Household | 16 (100.0%) | 0 (0.0%) |
| 2-Person Household | 9 (100.0%) | 0 (0.0%) |
| 3-Person Household | 23 (100.0%) | 0 (0.0%) |
| 4+ Person Household | 0 (0.0%) | 31 (100.0%) |
| Total Housing Units | 48 (60.8%) | 31 (39.2%) |
Occupancy by Educational Attainment in Tonyville
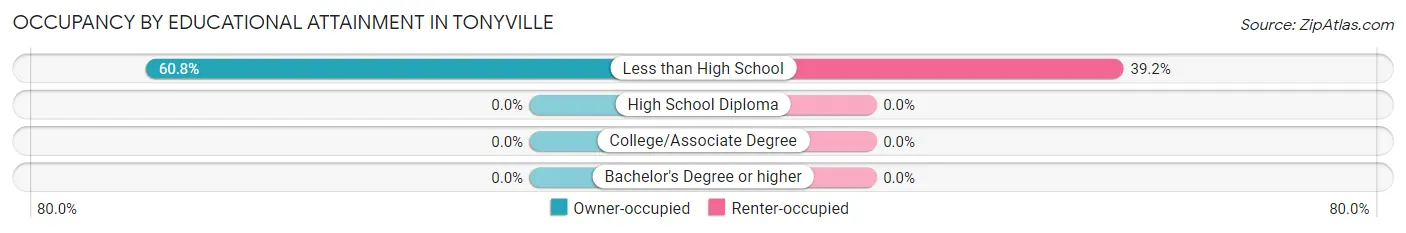
| Household Size | Owner-occupied | Renter-occupied |
| Less than High School | 48 (60.8%) | 31 (39.2%) |
| High School Diploma | 0 (0.0%) | 0 (0.0%) |
| College/Associate Degree | 0 (0.0%) | 0 (0.0%) |
| Bachelor's Degree or higher | 0 (0.0%) | 0 (0.0%) |
Occupancy by Age of Householder in Tonyville
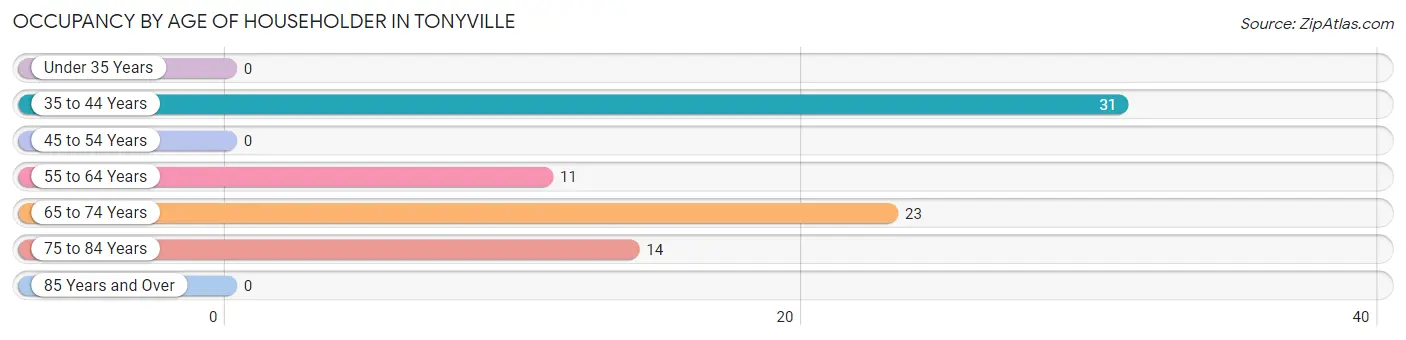
| Age Bracket | # Households | % Households |
| Under 35 Years | 0 | 0.0% |
| 35 to 44 Years | 31 | 39.2% |
| 45 to 54 Years | 0 | 0.0% |
| 55 to 64 Years | 11 | 13.9% |
| 65 to 74 Years | 23 | 29.1% |
| 75 to 84 Years | 14 | 17.7% |
| 85 Years and Over | 0 | 0.0% |
| Total | 79 | 100.0% |
Housing Finances in Tonyville
Median Income by Occupancy in Tonyville
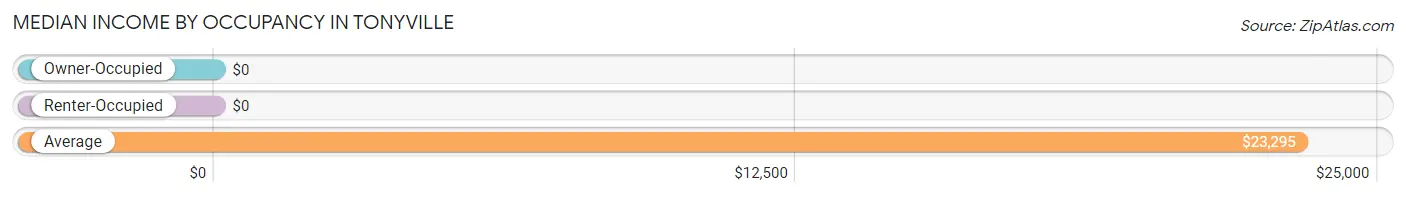
| Occupancy Type | # Households | Median Income |
| Owner-Occupied | 48 (60.8%) | $0 |
| Renter-Occupied | 31 (39.2%) | $0 |
| Average | 79 (100.0%) | $23,295 |
Occupancy by Householder Income Bracket in Tonyville
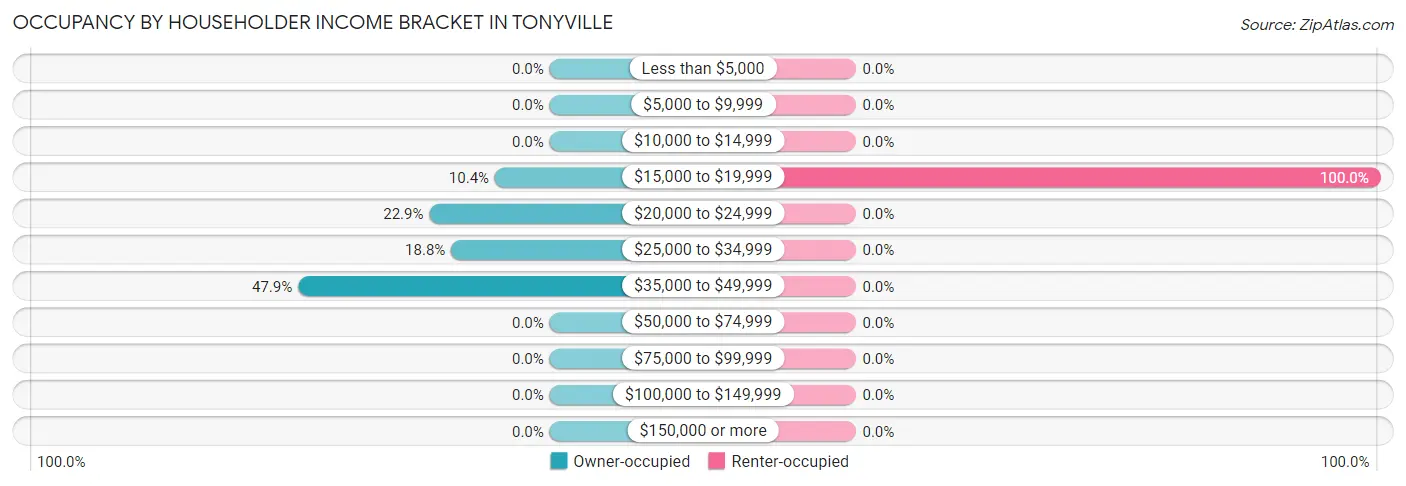
| Income Bracket | Owner-occupied | Renter-occupied |
| Less than $5,000 | 0 (0.0%) | 0 (0.0%) |
| $5,000 to $9,999 | 0 (0.0%) | 0 (0.0%) |
| $10,000 to $14,999 | 0 (0.0%) | 0 (0.0%) |
| $15,000 to $19,999 | 5 (10.4%) | 31 (100.0%) |
| $20,000 to $24,999 | 11 (22.9%) | 0 (0.0%) |
| $25,000 to $34,999 | 9 (18.8%) | 0 (0.0%) |
| $35,000 to $49,999 | 23 (47.9%) | 0 (0.0%) |
| $50,000 to $74,999 | 0 (0.0%) | 0 (0.0%) |
| $75,000 to $99,999 | 0 (0.0%) | 0 (0.0%) |
| $100,000 to $149,999 | 0 (0.0%) | 0 (0.0%) |
| $150,000 or more | 0 (0.0%) | 0 (0.0%) |
| Total | 48 (100.0%) | 31 (100.0%) |
Monthly Housing Cost Tiers in Tonyville
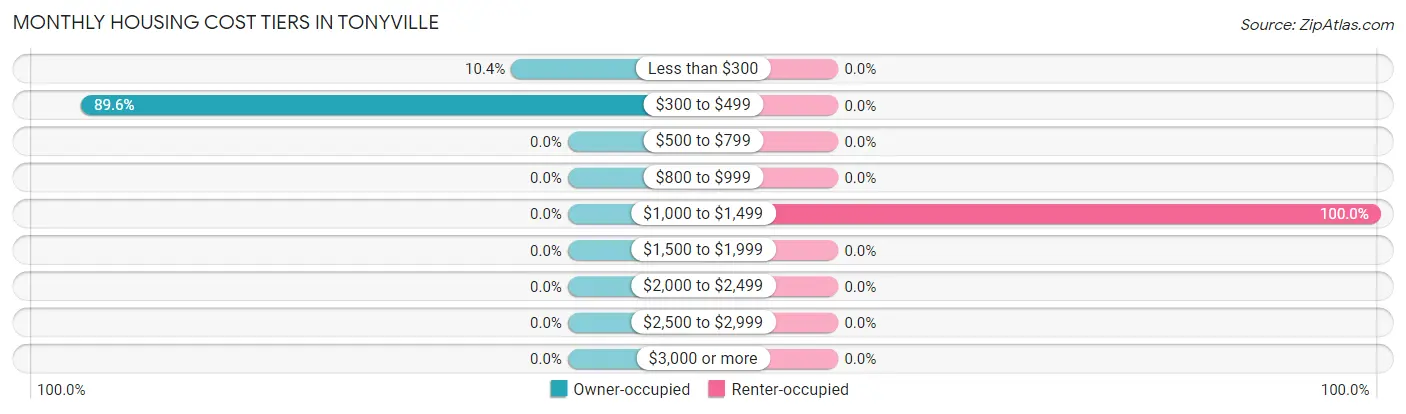
| Monthly Cost | Owner-occupied | Renter-occupied |
| Less than $300 | 5 (10.4%) | 0 (0.0%) |
| $300 to $499 | 43 (89.6%) | 0 (0.0%) |
| $500 to $799 | 0 (0.0%) | 0 (0.0%) |
| $800 to $999 | 0 (0.0%) | 0 (0.0%) |
| $1,000 to $1,499 | 0 (0.0%) | 31 (100.0%) |
| $1,500 to $1,999 | 0 (0.0%) | 0 (0.0%) |
| $2,000 to $2,499 | 0 (0.0%) | 0 (0.0%) |
| $2,500 to $2,999 | 0 (0.0%) | 0 (0.0%) |
| $3,000 or more | 0 (0.0%) | 0 (0.0%) |
| Total | 48 (100.0%) | 31 (100.0%) |
Physical Housing Characteristics in Tonyville
Housing Structures in Tonyville
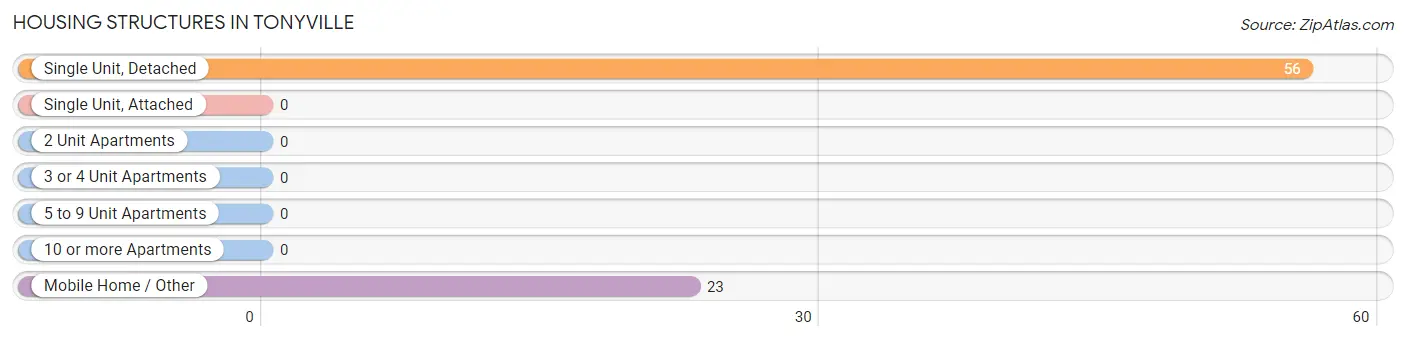
| Structure Type | # Housing Units | % Housing Units |
| Single Unit, Detached | 56 | 70.9% |
| Single Unit, Attached | 0 | 0.0% |
| 2 Unit Apartments | 0 | 0.0% |
| 3 or 4 Unit Apartments | 0 | 0.0% |
| 5 to 9 Unit Apartments | 0 | 0.0% |
| 10 or more Apartments | 0 | 0.0% |
| Mobile Home / Other | 23 | 29.1% |
| Total | 79 | 100.0% |
Housing Structures by Occupancy in Tonyville
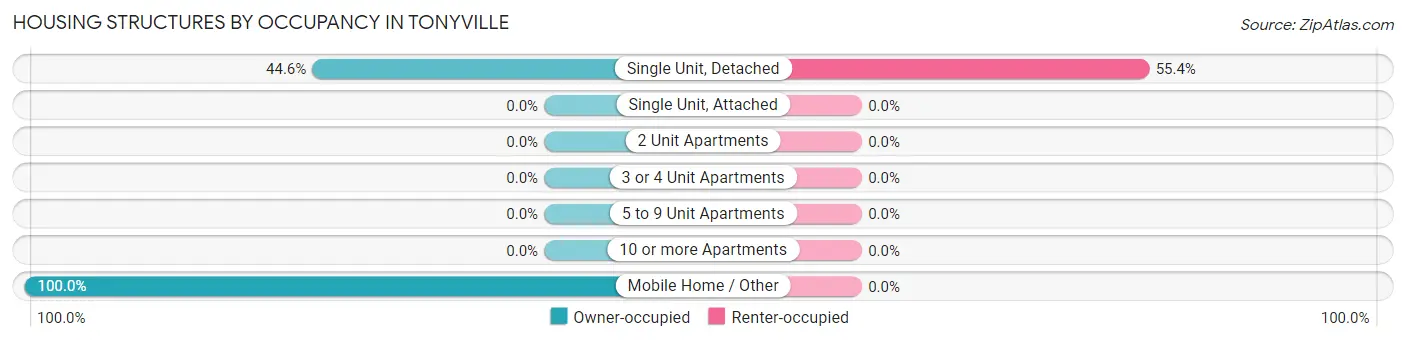
| Structure Type | Owner-occupied | Renter-occupied |
| Single Unit, Detached | 25 (44.6%) | 31 (55.4%) |
| Single Unit, Attached | 0 (0.0%) | 0 (0.0%) |
| 2 Unit Apartments | 0 (0.0%) | 0 (0.0%) |
| 3 or 4 Unit Apartments | 0 (0.0%) | 0 (0.0%) |
| 5 to 9 Unit Apartments | 0 (0.0%) | 0 (0.0%) |
| 10 or more Apartments | 0 (0.0%) | 0 (0.0%) |
| Mobile Home / Other | 23 (100.0%) | 0 (0.0%) |
| Total | 48 (60.8%) | 31 (39.2%) |
Housing Structures by Number of Rooms in Tonyville
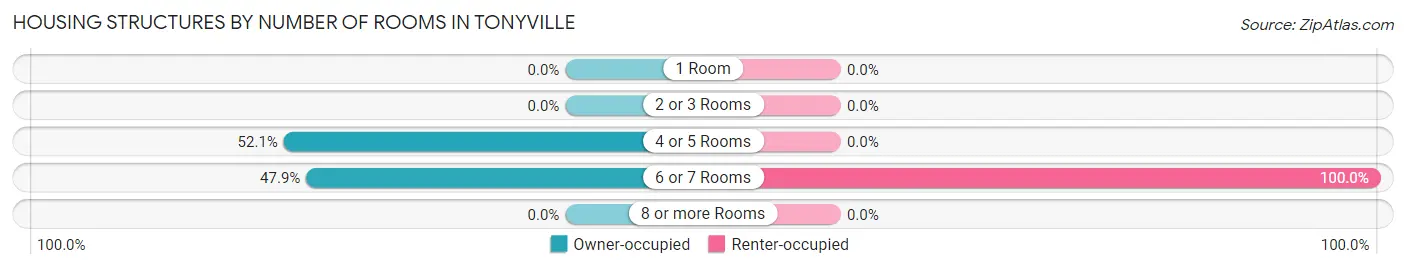
| Number of Rooms | Owner-occupied | Renter-occupied |
| 1 Room | 0 (0.0%) | 0 (0.0%) |
| 2 or 3 Rooms | 0 (0.0%) | 0 (0.0%) |
| 4 or 5 Rooms | 25 (52.1%) | 0 (0.0%) |
| 6 or 7 Rooms | 23 (47.9%) | 31 (100.0%) |
| 8 or more Rooms | 0 (0.0%) | 0 (0.0%) |
| Total | 48 (100.0%) | 31 (100.0%) |
Housing Structure by Heating Type in Tonyville
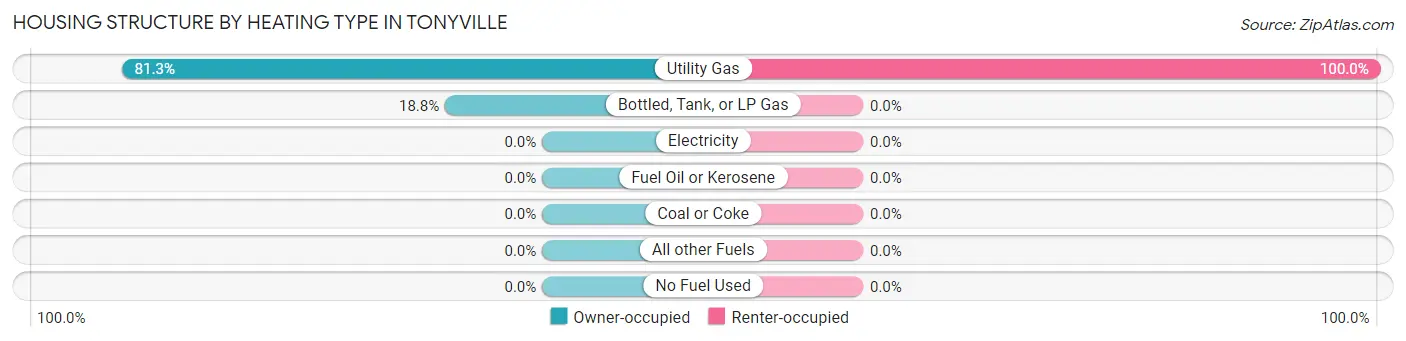
| Heating Type | Owner-occupied | Renter-occupied |
| Utility Gas | 39 (81.2%) | 31 (100.0%) |
| Bottled, Tank, or LP Gas | 9 (18.8%) | 0 (0.0%) |
| Electricity | 0 (0.0%) | 0 (0.0%) |
| Fuel Oil or Kerosene | 0 (0.0%) | 0 (0.0%) |
| Coal or Coke | 0 (0.0%) | 0 (0.0%) |
| All other Fuels | 0 (0.0%) | 0 (0.0%) |
| No Fuel Used | 0 (0.0%) | 0 (0.0%) |
| Total | 48 (100.0%) | 31 (100.0%) |
Household Vehicle Usage in Tonyville
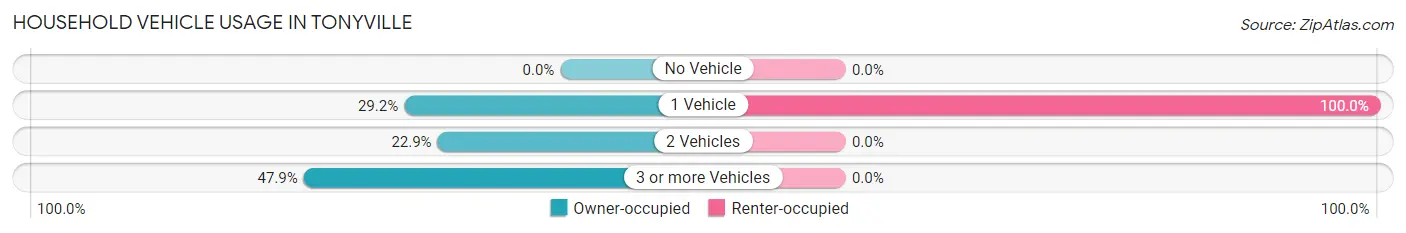
| Vehicles per Household | Owner-occupied | Renter-occupied |
| No Vehicle | 0 (0.0%) | 0 (0.0%) |
| 1 Vehicle | 14 (29.2%) | 31 (100.0%) |
| 2 Vehicles | 11 (22.9%) | 0 (0.0%) |
| 3 or more Vehicles | 23 (47.9%) | 0 (0.0%) |
| Total | 48 (100.0%) | 31 (100.0%) |
Real Estate & Mortgages in Tonyville
Real Estate and Mortgage Overview in Tonyville
| Characteristic | Without Mortgage | With Mortgage |
| Housing Units | 48 | 0 |
| Median Property Value | $58,900 | $0 |
| Median Household Income | - | - |
| Monthly Housing Costs | $395 | $0 |
| Real Estate Taxes | - | - |
Property Value by Mortgage Status in Tonyville
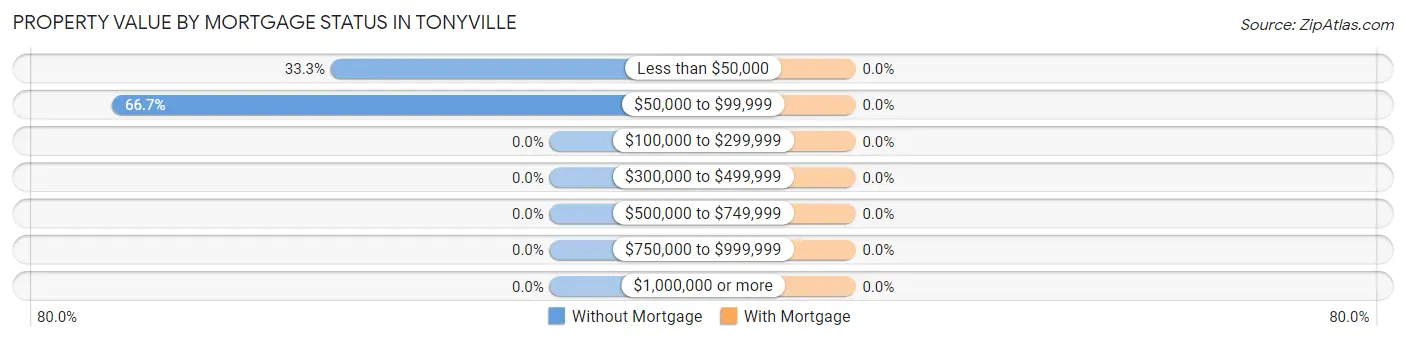
| Property Value | Without Mortgage | With Mortgage |
| Less than $50,000 | 16 (33.3%) | 0 (0.0%) |
| $50,000 to $99,999 | 32 (66.7%) | 0 (0.0%) |
| $100,000 to $299,999 | 0 (0.0%) | 0 (0.0%) |
| $300,000 to $499,999 | 0 (0.0%) | 0 (0.0%) |
| $500,000 to $749,999 | 0 (0.0%) | 0 (0.0%) |
| $750,000 to $999,999 | 0 (0.0%) | 0 (0.0%) |
| $1,000,000 or more | 0 (0.0%) | 0 (0.0%) |
| Total | 48 (100.0%) | 0 (0.0%) |
Household Income by Mortgage Status in Tonyville
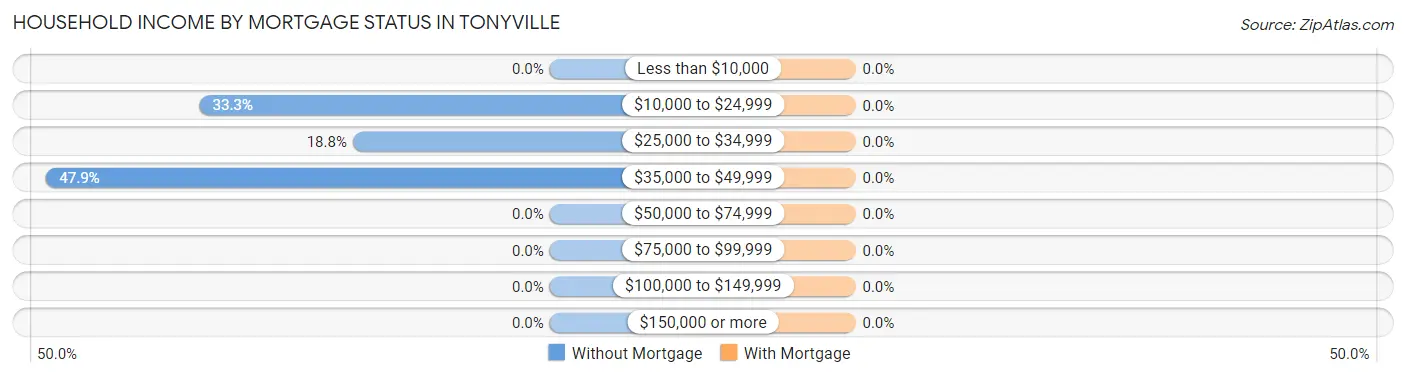
| Household Income | Without Mortgage | With Mortgage |
| Less than $10,000 | 0 (0.0%) | 0 (0.0%) |
| $10,000 to $24,999 | 16 (33.3%) | 0 (0.0%) |
| $25,000 to $34,999 | 9 (18.8%) | 0 (0.0%) |
| $35,000 to $49,999 | 23 (47.9%) | 0 (0.0%) |
| $50,000 to $74,999 | 0 (0.0%) | 0 (0.0%) |
| $75,000 to $99,999 | 0 (0.0%) | 0 (0.0%) |
| $100,000 to $149,999 | 0 (0.0%) | 0 (0.0%) |
| $150,000 or more | 0 (0.0%) | 0 (0.0%) |
| Total | 48 (100.0%) | 0 (0.0%) |
Property Value to Household Income Ratio in Tonyville
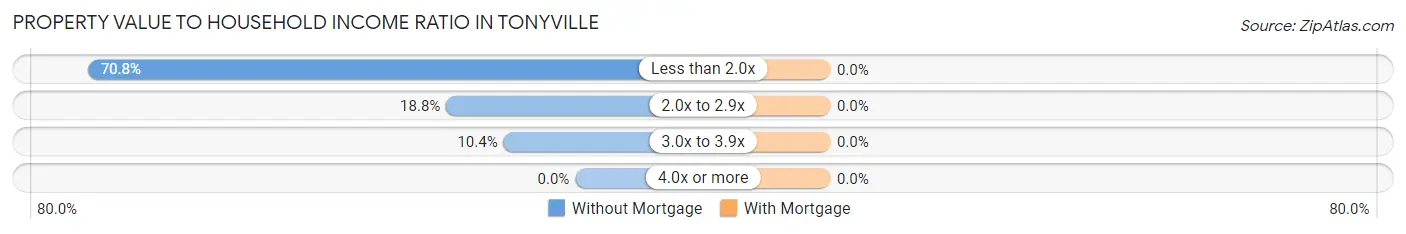
| Value-to-Income Ratio | Without Mortgage | With Mortgage |
| Less than 2.0x | 34 (70.8%) | 0 (0.0%) |
| 2.0x to 2.9x | 9 (18.8%) | 0 (0.0%) |
| 3.0x to 3.9x | 5 (10.4%) | 0 (0.0%) |
| 4.0x or more | 0 (0.0%) | 0 (0.0%) |
| Total | 48 (100.0%) | 0 (0.0%) |
Real Estate Taxes by Mortgage Status in Tonyville
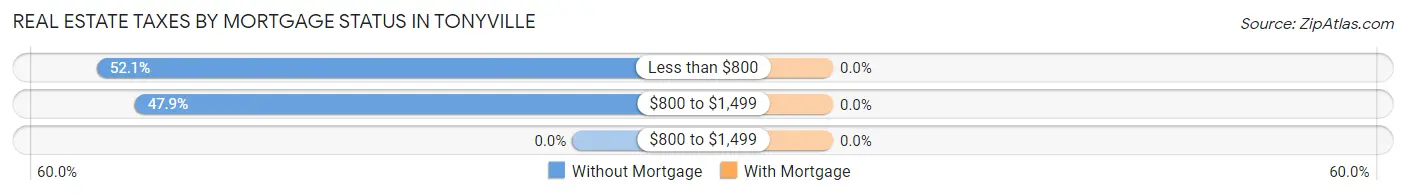
| Property Taxes | Without Mortgage | With Mortgage |
| Less than $800 | 25 (52.1%) | 0 (0.0%) |
| $800 to $1,499 | 23 (47.9%) | 0 (0.0%) |
| $800 to $1,499 | 0 (0.0%) | 0 (0.0%) |
| Total | 48 (100.0%) | 0 (0.0%) |
Health & Disability in Tonyville
Health Insurance Coverage by Age in Tonyville
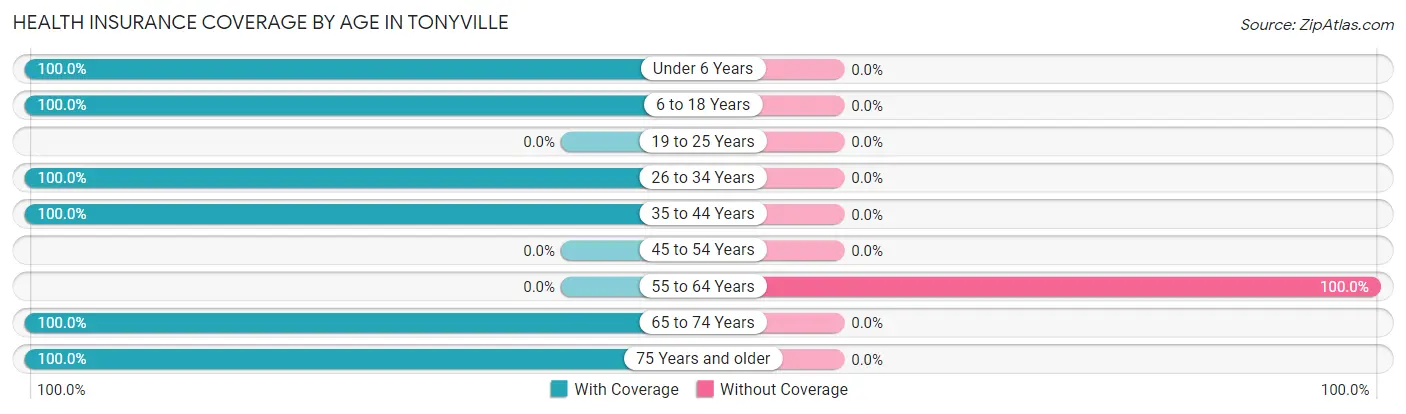
| Age Bracket | With Coverage | Without Coverage |
| Under 6 Years | 64 (100.0%) | 0 (0.0%) |
| 6 to 18 Years | 95 (100.0%) | 0 (0.0%) |
| 19 to 25 Years | 0 (0.0%) | 0 (0.0%) |
| 26 to 34 Years | 35 (100.0%) | 0 (0.0%) |
| 35 to 44 Years | 63 (100.0%) | 0 (0.0%) |
| 45 to 54 Years | 0 (0.0%) | 0 (0.0%) |
| 55 to 64 Years | 0 (0.0%) | 11 (100.0%) |
| 65 to 74 Years | 23 (100.0%) | 0 (0.0%) |
| 75 Years and older | 23 (100.0%) | 0 (0.0%) |
| Total | 303 (96.5%) | 11 (3.5%) |
Health Insurance Coverage by Citizenship Status in Tonyville
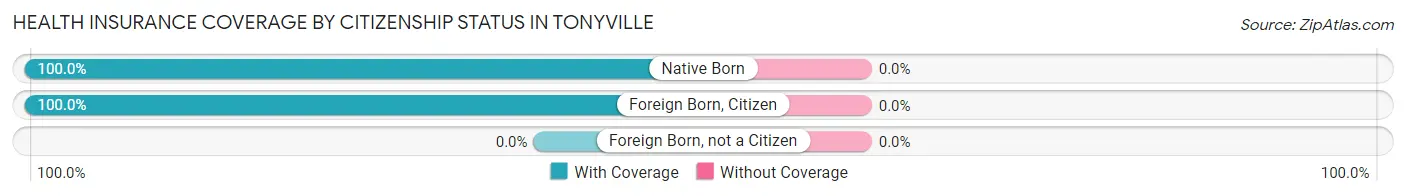
| Citizenship Status | With Coverage | Without Coverage |
| Native Born | 64 (100.0%) | 0 (0.0%) |
| Foreign Born, Citizen | 95 (100.0%) | 0 (0.0%) |
| Foreign Born, not a Citizen | 0 (0.0%) | 0 (0.0%) |
Health Insurance Coverage by Household Income in Tonyville
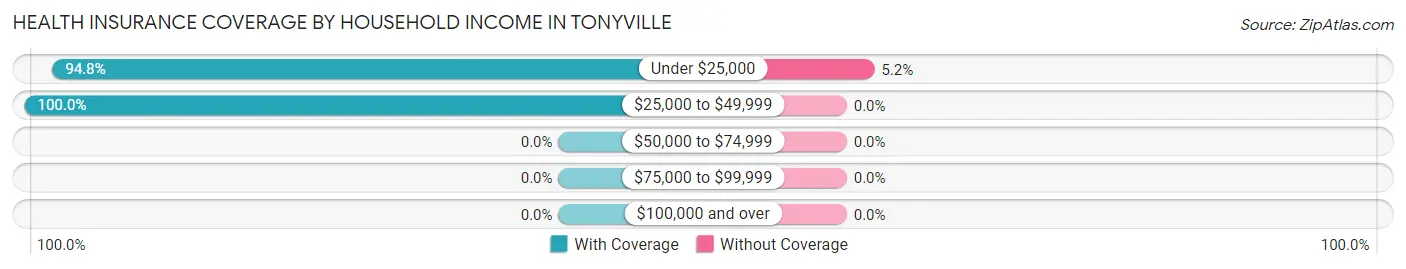
| Household Income | With Coverage | Without Coverage |
| Under $25,000 | 201 (94.8%) | 11 (5.2%) |
| $25,000 to $49,999 | 102 (100.0%) | 0 (0.0%) |
| $50,000 to $74,999 | 0 (0.0%) | 0 (0.0%) |
| $75,000 to $99,999 | 0 (0.0%) | 0 (0.0%) |
| $100,000 and over | 0 (0.0%) | 0 (0.0%) |
Public vs Private Health Insurance Coverage by Age in Tonyville
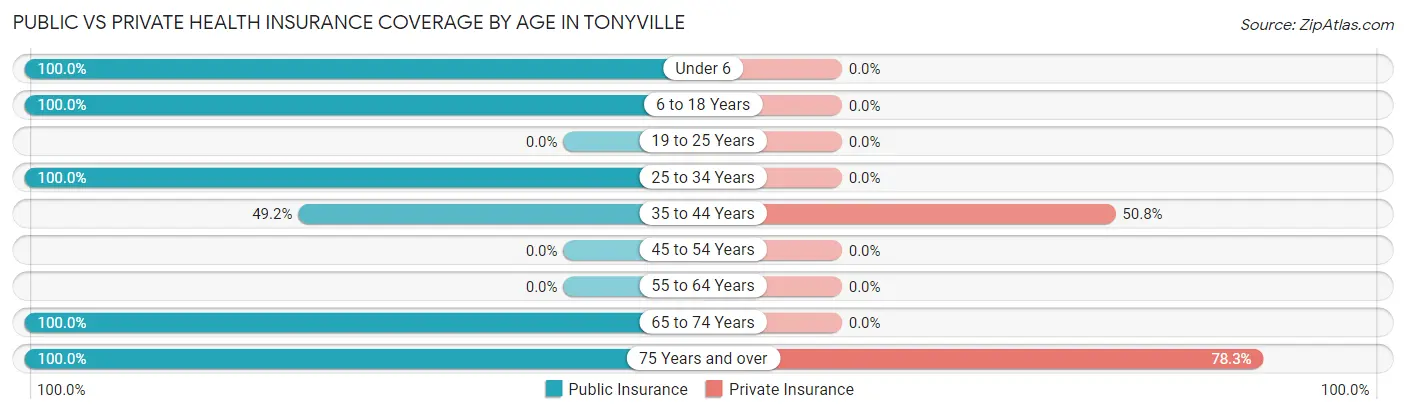
| Age Bracket | Public Insurance | Private Insurance |
| Under 6 | 64 (100.0%) | 0 (0.0%) |
| 6 to 18 Years | 95 (100.0%) | 0 (0.0%) |
| 19 to 25 Years | 0 (0.0%) | 0 (0.0%) |
| 25 to 34 Years | 35 (100.0%) | 0 (0.0%) |
| 35 to 44 Years | 31 (49.2%) | 32 (50.8%) |
| 45 to 54 Years | 0 (0.0%) | 0 (0.0%) |
| 55 to 64 Years | 0 (0.0%) | 0 (0.0%) |
| 65 to 74 Years | 23 (100.0%) | 0 (0.0%) |
| 75 Years and over | 23 (100.0%) | 18 (78.3%) |
| Total | 271 (86.3%) | 50 (15.9%) |
Disability Status by Sex by Age in Tonyville
| Age Bracket | Male | Female |
| Under 5 Years | 0 (0.0%) | 0 (0.0%) |
| 5 to 17 Years | 0 (0.0%) | 0 (0.0%) |
| 18 to 34 Years | 0 (0.0%) | 0 (0.0%) |
| 35 to 64 Years | 0 (0.0%) | 0 (0.0%) |
| 65 to 74 Years | 0 (0.0%) | 0 (0.0%) |
| 75 Years and over | 0 (0.0%) | 0 (0.0%) |
Disability Class by Sex by Age in Tonyville
Disability Class: Hearing Difficulty
| Age Bracket | Male | Female |
| Under 5 Years | 0 (0.0%) | 0 (0.0%) |
| 5 to 17 Years | 0 (0.0%) | 0 (0.0%) |
| 18 to 34 Years | 0 (0.0%) | 0 (0.0%) |
| 35 to 64 Years | 0 (0.0%) | 0 (0.0%) |
| 65 to 74 Years | 0 (0.0%) | 0 (0.0%) |
| 75 Years and over | 0 (0.0%) | 0 (0.0%) |
Disability Class: Vision Difficulty
| Age Bracket | Male | Female |
| Under 5 Years | 0 (0.0%) | 0 (0.0%) |
| 5 to 17 Years | 0 (0.0%) | 0 (0.0%) |
| 18 to 34 Years | 0 (0.0%) | 0 (0.0%) |
| 35 to 64 Years | 0 (0.0%) | 0 (0.0%) |
| 65 to 74 Years | 0 (0.0%) | 0 (0.0%) |
| 75 Years and over | 0 (0.0%) | 0 (0.0%) |
Disability Class: Cognitive Difficulty

| Age Bracket | Male | Female |
| 5 to 17 Years | 0 (0.0%) | 0 (0.0%) |
| 18 to 34 Years | 0 (0.0%) | 0 (0.0%) |
| 35 to 64 Years | 0 (0.0%) | 0 (0.0%) |
| 65 to 74 Years | 0 (0.0%) | 0 (0.0%) |
| 75 Years and over | 0 (0.0%) | 0 (0.0%) |
Disability Class: Ambulatory Difficulty
| Age Bracket | Male | Female |
| 5 to 17 Years | 0 (0.0%) | 0 (0.0%) |
| 18 to 34 Years | 0 (0.0%) | 0 (0.0%) |
| 35 to 64 Years | 0 (0.0%) | 0 (0.0%) |
| 65 to 74 Years | 0 (0.0%) | 0 (0.0%) |
| 75 Years and over | 0 (0.0%) | 0 (0.0%) |
Disability Class: Self-Care Difficulty
| Age Bracket | Male | Female |
| 5 to 17 Years | 0 (0.0%) | 0 (0.0%) |
| 18 to 34 Years | 0 (0.0%) | 0 (0.0%) |
| 35 to 64 Years | 0 (0.0%) | 0 (0.0%) |
| 65 to 74 Years | 0 (0.0%) | 0 (0.0%) |
| 75 Years and over | 0 (0.0%) | 0 (0.0%) |
Technology Access in Tonyville
Computing Device Access in Tonyville
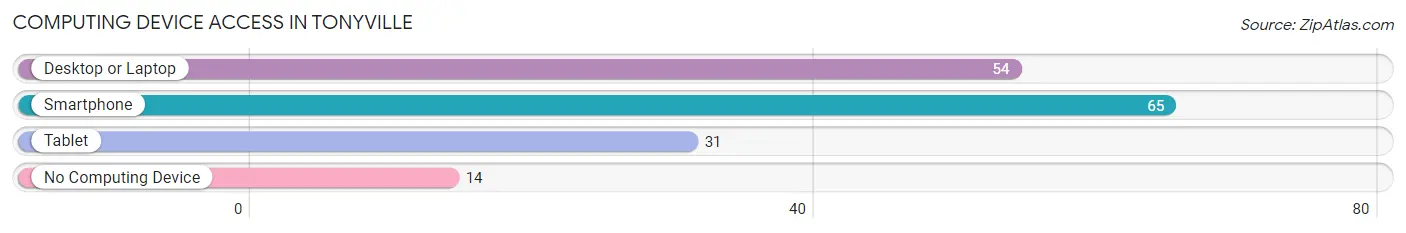
| Device Type | # Households | % Households |
| Desktop or Laptop | 54 | 68.3% |
| Smartphone | 65 | 82.3% |
| Tablet | 31 | 39.2% |
| No Computing Device | 14 | 17.7% |
| Total | 79 | 100.0% |
Internet Access in Tonyville
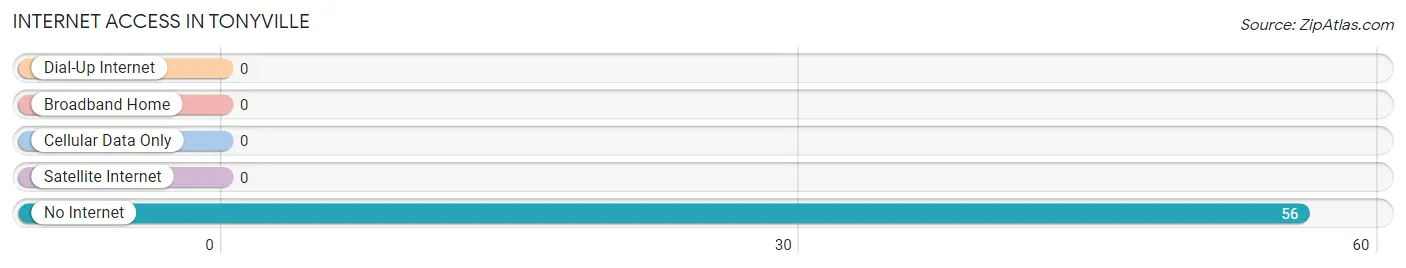
| Internet Type | # Households | % Households |
| Dial-Up Internet | 0 | 0.0% |
| Broadband Home | 0 | 0.0% |
| Cellular Data Only | 0 | 0.0% |
| Satellite Internet | 0 | 0.0% |
| No Internet | 56 | 70.9% |
| Total | 79 | 100.0% |
Tonyville Summary
History
Tonyville is a small town located in the Central Valley of California, about an hour and a half drive from the state capital of Sacramento. The town was founded in 1852 by a group of settlers from the East Coast who were looking for a place to start a new life. The town was named after Tony, the first settler to arrive in the area.
The town quickly grew and prospered, becoming a hub for the surrounding agricultural communities. The town was known for its abundance of fruit trees, and the local farmers grew a variety of crops, including apples, peaches, and grapes. The town also had a thriving dairy industry, and the local creamery was a popular destination for visitors.
In the early 1900s, the town began to experience a decline in population as many of the younger generations moved away to larger cities in search of better job opportunities. This trend continued until the 1950s, when the town began to experience a resurgence in population growth. This was due in part to the construction of a new highway that connected the town to the larger cities in the area.
The town continued to grow and prosper throughout the 1960s and 1970s, and by the 1980s it had become a popular tourist destination. The town was known for its quaint downtown area, which featured a variety of shops and restaurants.
Geography
Tonyville is located in the Central Valley of California, about an hour and a half drive from the state capital of Sacramento. The town is situated on the banks of the Sacramento River, and is surrounded by rolling hills and farmland. The town is located at an elevation of about 500 feet, and the climate is generally mild and dry.
The town is located in a rural area, and the nearest major city is Stockton, which is about 30 miles away. The town is also close to the Sierra Nevada Mountains, which provide a beautiful backdrop for the town.
Economy
The economy of Tonyville is largely based on agriculture. The town is surrounded by farmland, and the local farmers grow a variety of crops, including apples, peaches, and grapes. The town also has a thriving dairy industry, and the local creamery is a popular destination for visitors.
The town also has a number of small businesses, including restaurants, shops, and other services. The town is also home to a number of small manufacturing companies, which produce a variety of products, including furniture and clothing.
Demographics
As of the 2010 census, the population of Tonyville was 2,845. The town is predominantly white, with about 75% of the population identifying as such. The town also has a large Hispanic population, with about 20% of the population identifying as such. The town also has a small African American population, with about 3% of the population identifying as such. The median household income in the town is about $50,000, and the median home value is about $200,000.
Common Questions
What is Per Capita Income in Tonyville?
Per Capita income in Tonyville is $8,231.
What is the Median Household income in Tonyville?
Median Household Income in Tonyville is $23,295.
What is Inequality or Gini Index in Tonyville?
Inequality or Gini Index in Tonyville is 0.27.
What is the Total Population of Tonyville?
Total Population of Tonyville is 314.
What is the Total Male Population of Tonyville?
Total Male Population of Tonyville is 214.
What is the Total Female Population of Tonyville?
Total Female Population of Tonyville is 100.
What is the Ratio of Males per 100 Females in Tonyville?
There are 214.00 Males per 100 Females in Tonyville.
What is the Ratio of Females per 100 Males in Tonyville?
There are 46.73 Females per 100 Males in Tonyville.
What is the Median Population Age in Tonyville?
Median Population Age in Tonyville is 11.9 Years.
What is the Average Family Size in Tonyville
Average Family Size in Tonyville is 4.7 People.
What is the Average Household Size in Tonyville
Average Household Size in Tonyville is 4.0 People.
How Large is the Labor Force in Tonyville?
There are 78 People in the Labor Forcein in Tonyville.
What is the Percentage of People in the Labor Force in Tonyville?
50.3% of People are in the Labor Force in Tonyville.
What is the Unemployment Rate in Tonyville?
Unemployment Rate in Tonyville is 14.1%.