Cassel, CA Map & Demographics
Cassel Map
Cassel Overview
$14,801
PER CAPITA INCOME
0.47
INEQUALITY / GINI INDEX
228
TOTAL POPULATION
131
MALE POPULATION
97
FEMALE POPULATION
135.05
MALES / 100 FEMALES
74.05
FEMALES / 100 MALES
41.0
MEDIAN AGE
2.4
AVG FAMILY SIZE
2.4
AVG HOUSEHOLD SIZE
43
LABOR FORCE [ PEOPLE ]
25.1%
PERCENT IN LABOR FORCE
Cassel Zip Codes
Cassel Area Codes
Income in Cassel
Income Overview in Cassel
| Characteristic | Number | Measure |
| Per Capita Income | 228 | $14,801 |
| Median Family Income | 74 | $0 |
| Mean Family Income | 74 | $38,811 |
| Median Household Income | 97 | $0 |
| Mean Household Income | 97 | $34,790 |
| Income Deficit | 74 | $0 |
| Wage / Income Gap (%) | 228 | 0.00% |
| Wage / Income Gap ($) | 228 | 100.00¢ per $1 |
| Gini / Inequality Index | 228 | 0.47 |
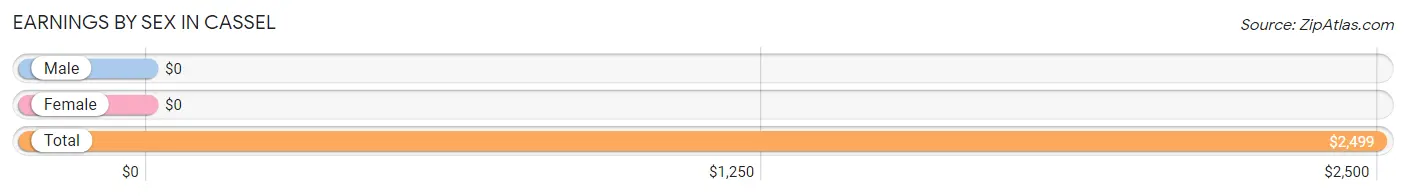
Earnings by Sex in Cassel
| Sex | Number | Average Earnings |
| Male | 36 (83.7%) | $0 |
| Female | 7 (16.3%) | $0 |
| Total | 43 (100.0%) | $2,499 |
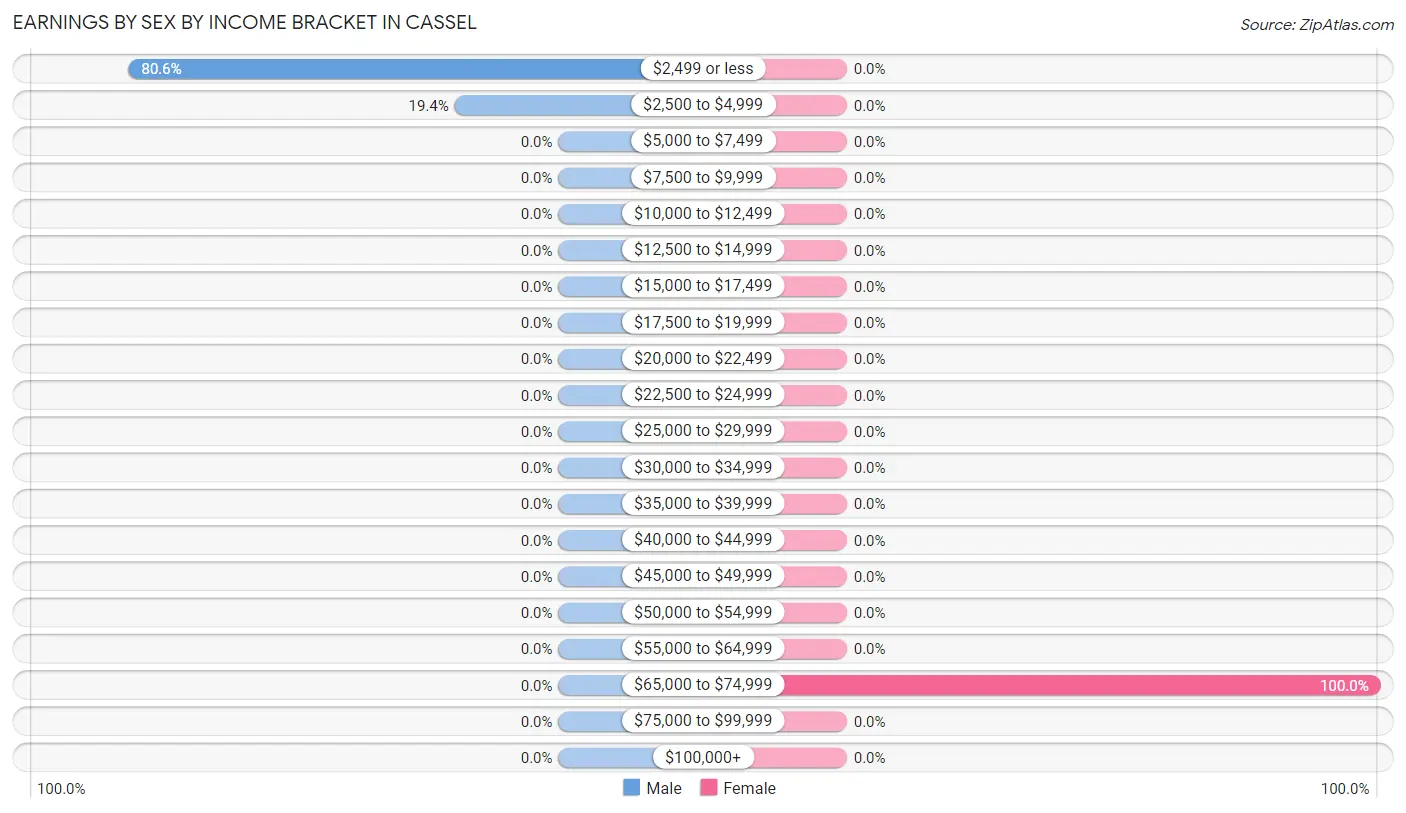
Earnings by Sex by Income Bracket in Cassel
The most common earnings brackets in Cassel are $2,499 or less for men (29 | 80.6%) and $65,000 to $74,999 for women (7 | 100.0%).
| Income | Male | Female |
| $2,499 or less | 29 (80.6%) | 0 (0.0%) |
| $2,500 to $4,999 | 7 (19.4%) | 0 (0.0%) |
| $5,000 to $7,499 | 0 (0.0%) | 0 (0.0%) |
| $7,500 to $9,999 | 0 (0.0%) | 0 (0.0%) |
| $10,000 to $12,499 | 0 (0.0%) | 0 (0.0%) |
| $12,500 to $14,999 | 0 (0.0%) | 0 (0.0%) |
| $15,000 to $17,499 | 0 (0.0%) | 0 (0.0%) |
| $17,500 to $19,999 | 0 (0.0%) | 0 (0.0%) |
| $20,000 to $22,499 | 0 (0.0%) | 0 (0.0%) |
| $22,500 to $24,999 | 0 (0.0%) | 0 (0.0%) |
| $25,000 to $29,999 | 0 (0.0%) | 0 (0.0%) |
| $30,000 to $34,999 | 0 (0.0%) | 0 (0.0%) |
| $35,000 to $39,999 | 0 (0.0%) | 0 (0.0%) |
| $40,000 to $44,999 | 0 (0.0%) | 0 (0.0%) |
| $45,000 to $49,999 | 0 (0.0%) | 0 (0.0%) |
| $50,000 to $54,999 | 0 (0.0%) | 0 (0.0%) |
| $55,000 to $64,999 | 0 (0.0%) | 0 (0.0%) |
| $65,000 to $74,999 | 0 (0.0%) | 7 (100.0%) |
| $75,000 to $99,999 | 0 (0.0%) | 0 (0.0%) |
| $100,000+ | 0 (0.0%) | 0 (0.0%) |
| Total | 36 (100.0%) | 7 (100.0%) |
Earnings by Sex by Educational Attainment in Cassel
| Educational Attainment | Male Income | Female Income |
| Less than High School | - | - |
| High School Diploma | - | - |
| College or Associate's Degree | - | - |
| Bachelor's Degree | - | - |
| Graduate Degree | - | - |
| Total | - | - |
Family Income in Cassel
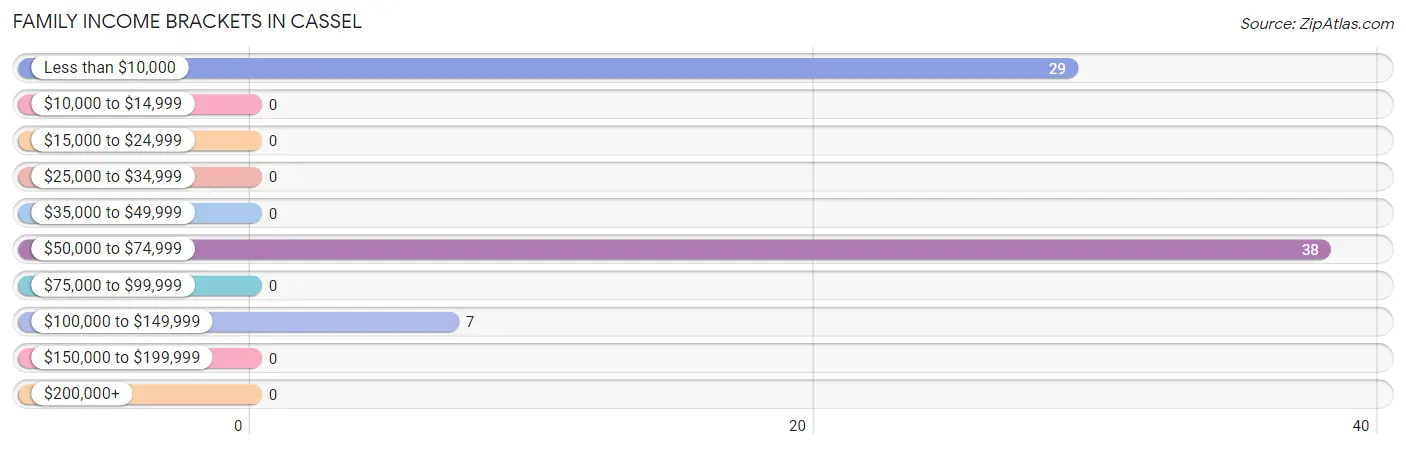
Family Income Brackets in Cassel
According to the Cassel family income data, there are 38 families falling into the $50,000 to $74,999 income range, which is the most common income bracket and makes up 51.3% of all families.
| Income Bracket | # Families | % Families |
| Less than $10,000 | 29 | 39.2% |
| $10,000 to $14,999 | 0 | 0.0% |
| $15,000 to $24,999 | 0 | 0.0% |
| $25,000 to $34,999 | 0 | 0.0% |
| $35,000 to $49,999 | 0 | 0.0% |
| $50,000 to $74,999 | 38 | 51.4% |
| $75,000 to $99,999 | 0 | 0.0% |
| $100,000 to $149,999 | 7 | 9.5% |
| $150,000 to $199,999 | 0 | 0.0% |
| $200,000+ | 0 | 0.0% |
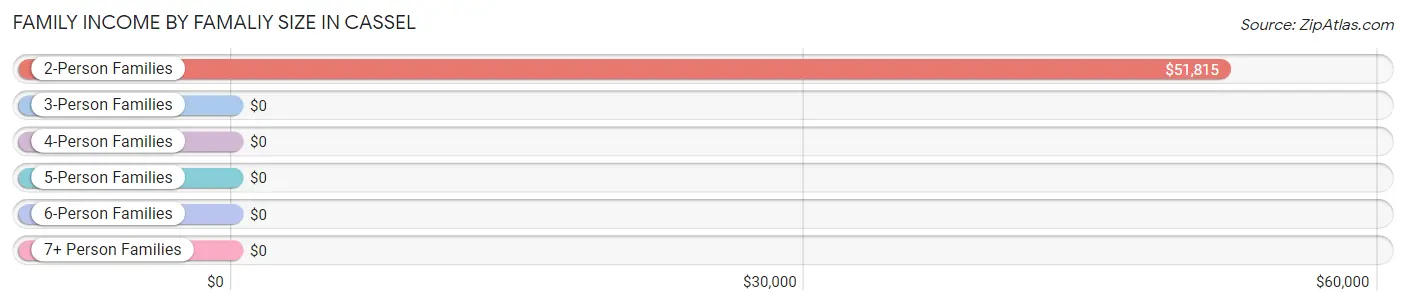
Family Income by Famaliy Size in Cassel
2-person families (45 | 60.8%) account for the highest median family income in Cassel with $51,815 per family, while 2-person families (45 | 60.8%) have the highest median income of $25,908 per family member.
| Income Bracket | # Families | Median Income |
| 2-Person Families | 45 (60.8%) | $51,815 |
| 3-Person Families | 29 (39.2%) | $0 |
| 4-Person Families | 0 (0.0%) | $0 |
| 5-Person Families | 0 (0.0%) | $0 |
| 6-Person Families | 0 (0.0%) | $0 |
| 7+ Person Families | 0 (0.0%) | $0 |
| Total | 74 (100.0%) | $0 |
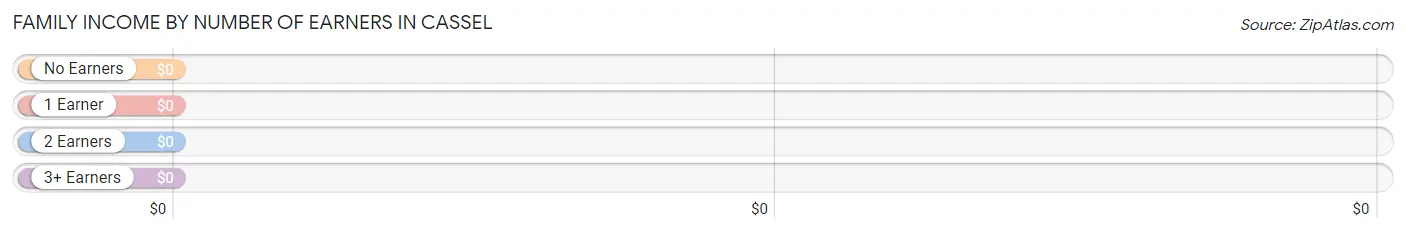
Family Income by Number of Earners in Cassel
| Number of Earners | # Families | Median Income |
| No Earners | 38 (51.3%) | $0 |
| 1 Earner | 29 (39.2%) | $0 |
| 2 Earners | 7 (9.5%) | $0 |
| 3+ Earners | 0 (0.0%) | $0 |
| Total | 74 (100.0%) | $0 |
Household Income in Cassel
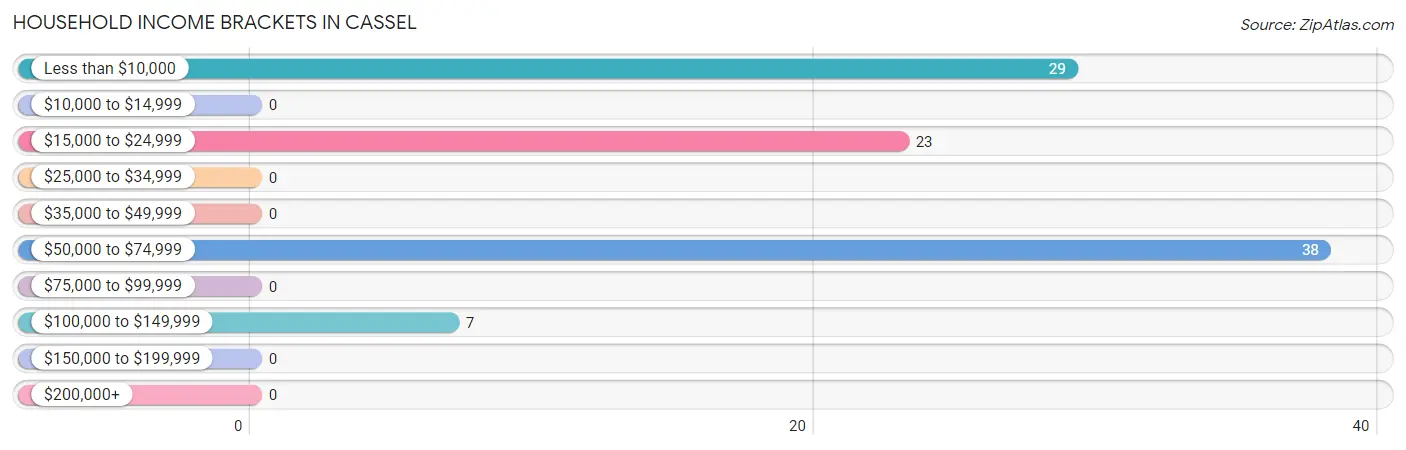
Household Income Brackets in Cassel
With 38 households falling in the category, the $50,000 to $74,999 income range is the most frequent in Cassel, accounting for 39.2% of all households.
| Income Bracket | # Households | % Households |
| Less than $10,000 | 29 | 29.9% |
| $10,000 to $14,999 | 0 | 0.0% |
| $15,000 to $24,999 | 23 | 23.7% |
| $25,000 to $34,999 | 0 | 0.0% |
| $35,000 to $49,999 | 0 | 0.0% |
| $50,000 to $74,999 | 38 | 39.2% |
| $75,000 to $99,999 | 0 | 0.0% |
| $100,000 to $149,999 | 7 | 7.2% |
| $150,000 to $199,999 | 0 | 0.0% |
| $200,000+ | 0 | 0.0% |
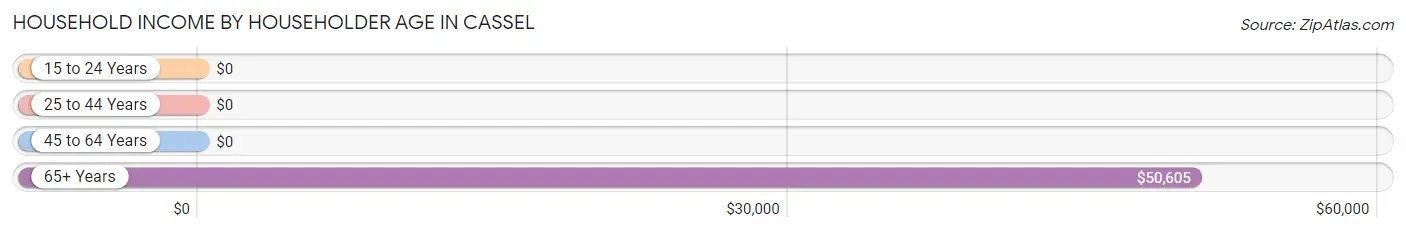
Household Income by Householder Age in Cassel
The median household income in Cassel is $0, with the highest median household income of $50,605 found in the 65+ years age bracket for the primary householder. A total of 61 households (62.9%) fall into this category.
| Income Bracket | # Households | Median Income |
| 15 to 24 Years | 0 (0.0%) | $0 |
| 25 to 44 Years | 29 (29.9%) | $0 |
| 45 to 64 Years | 7 (7.2%) | $0 |
| 65+ Years | 61 (62.9%) | $50,605 |
| Total | 97 (100.0%) | $0 |
Poverty in Cassel
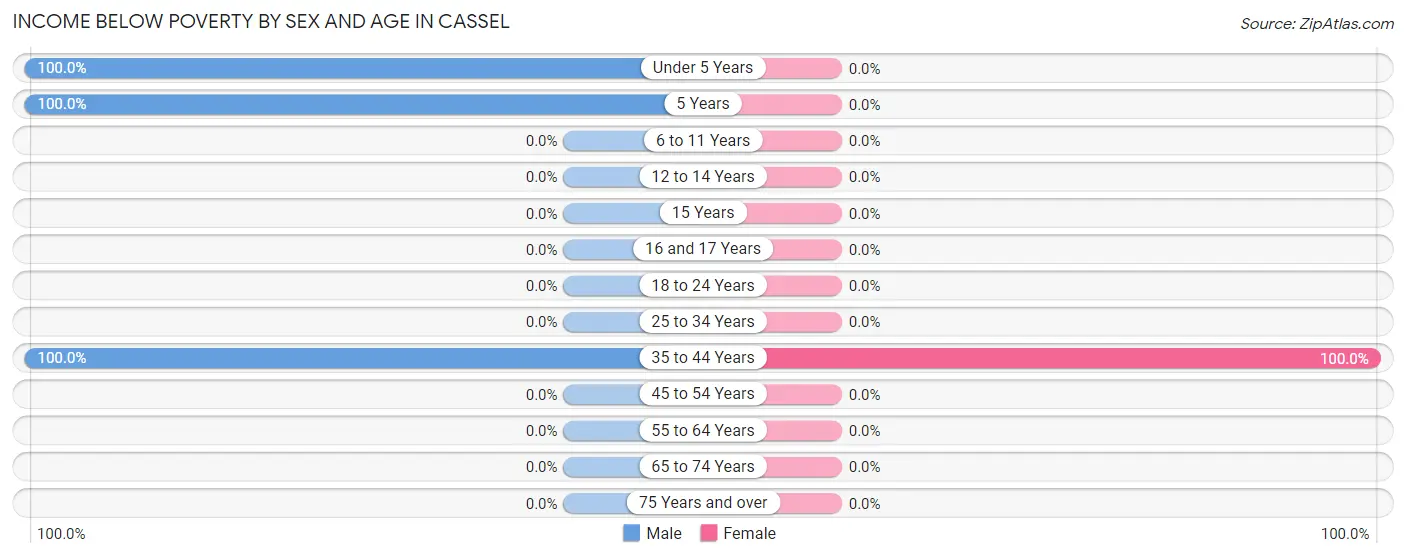
Income Below Poverty by Sex and Age in Cassel
With 65.6% poverty level for males and 29.9% for females among the residents of Cassel, under 5 year old males and 35 to 44 year old females are the most vulnerable to poverty, with 27 males (100.0%) and 29 females (100.0%) in their respective age groups living below the poverty level.
| Age Bracket | Male | Female |
| Under 5 Years | 27 (100.0%) | 0 (0.0%) |
| 5 Years | 30 (100.0%) | 0 (0.0%) |
| 6 to 11 Years | 0 (0.0%) | 0 (0.0%) |
| 12 to 14 Years | 0 (0.0%) | 0 (0.0%) |
| 15 Years | 0 (0.0%) | 0 (0.0%) |
| 16 and 17 Years | 0 (0.0%) | 0 (0.0%) |
| 18 to 24 Years | 0 (0.0%) | 0 (0.0%) |
| 25 to 34 Years | 0 (0.0%) | 0 (0.0%) |
| 35 to 44 Years | 29 (100.0%) | 29 (100.0%) |
| 45 to 54 Years | 0 (0.0%) | 0 (0.0%) |
| 55 to 64 Years | 0 (0.0%) | 0 (0.0%) |
| 65 to 74 Years | 0 (0.0%) | 0 (0.0%) |
| 75 Years and over | 0 (0.0%) | 0 (0.0%) |
| Total | 86 (65.6%) | 29 (29.9%) |
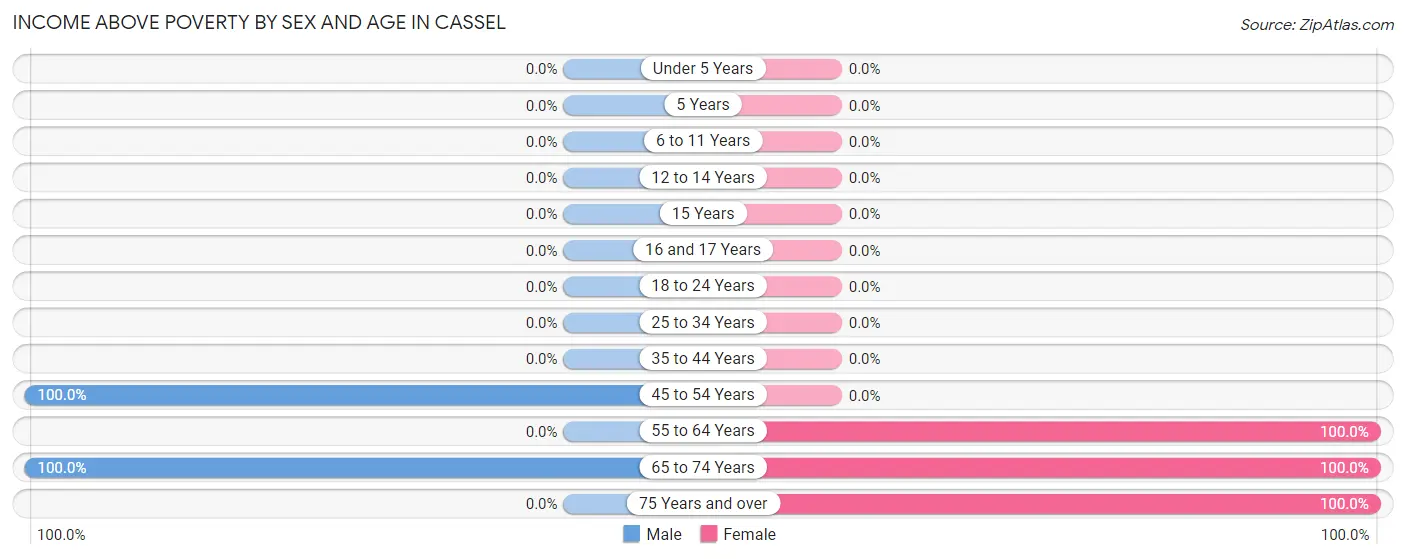
Income Above Poverty by Sex and Age in Cassel
According to the poverty statistics in Cassel, males aged 45 to 54 years and females aged 55 to 64 years are the age groups that are most secure financially, with 100.0% of males and 100.0% of females in these age groups living above the poverty line.
| Age Bracket | Male | Female |
| Under 5 Years | 0 (0.0%) | 0 (0.0%) |
| 5 Years | 0 (0.0%) | 0 (0.0%) |
| 6 to 11 Years | 0 (0.0%) | 0 (0.0%) |
| 12 to 14 Years | 0 (0.0%) | 0 (0.0%) |
| 15 Years | 0 (0.0%) | 0 (0.0%) |
| 16 and 17 Years | 0 (0.0%) | 0 (0.0%) |
| 18 to 24 Years | 0 (0.0%) | 0 (0.0%) |
| 25 to 34 Years | 0 (0.0%) | 0 (0.0%) |
| 35 to 44 Years | 0 (0.0%) | 0 (0.0%) |
| 45 to 54 Years | 7 (100.0%) | 0 (0.0%) |
| 55 to 64 Years | 0 (0.0%) | 7 (100.0%) |
| 65 to 74 Years | 38 (100.0%) | 38 (100.0%) |
| 75 Years and over | 0 (0.0%) | 23 (100.0%) |
| Total | 45 (34.4%) | 68 (70.1%) |
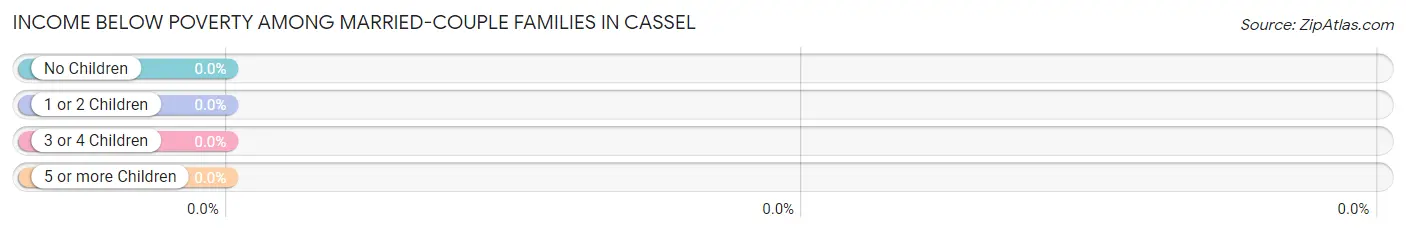
Income Below Poverty Among Married-Couple Families in Cassel
| Children | Above Poverty | Below Poverty |
| No Children | 45 (100.0%) | 0 (0.0%) |
| 1 or 2 Children | 0 (0.0%) | 0 (0.0%) |
| 3 or 4 Children | 0 (0.0%) | 0 (0.0%) |
| 5 or more Children | 0 (0.0%) | 0 (0.0%) |
| Total | 45 (100.0%) | 0 (0.0%) |
Income Below Poverty Among Single-Parent Households in Cassel
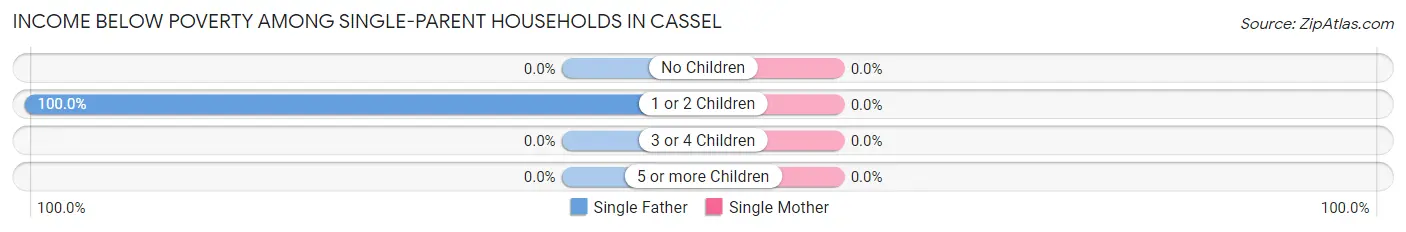
| Children | Single Father | Single Mother |
| No Children | 0 (0.0%) | 0 (0.0%) |
| 1 or 2 Children | 29 (100.0%) | 0 (0.0%) |
| 3 or 4 Children | 0 (0.0%) | 0 (0.0%) |
| 5 or more Children | 0 (0.0%) | 0 (0.0%) |
| Total | 29 (100.0%) | 0 (0.0%) |
Income Below Poverty Among Married-Couple vs Single-Parent Households in Cassel
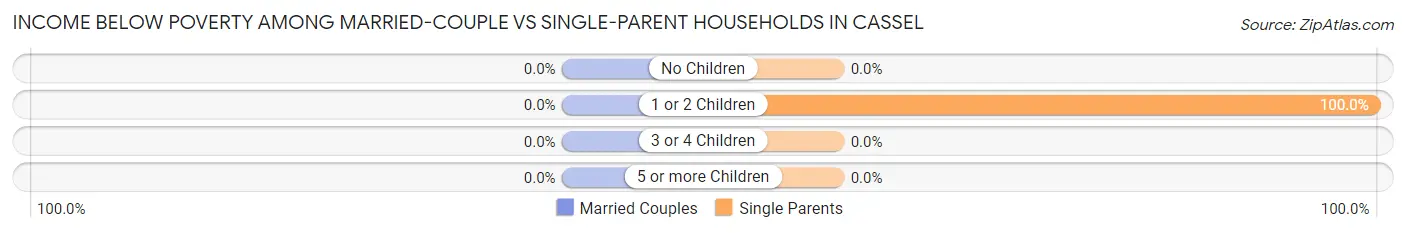
| Children | Married-Couple Families | Single-Parent Households |
| No Children | 0 (0.0%) | 0 (0.0%) |
| 1 or 2 Children | 0 (0.0%) | 29 (100.0%) |
| 3 or 4 Children | 0 (0.0%) | 0 (0.0%) |
| 5 or more Children | 0 (0.0%) | 0 (0.0%) |
| Total | 0 (0.0%) | 29 (100.0%) |
Race in Cassel
The most populous races in Cassel are , and White / Caucasian (228 | 100.0%).
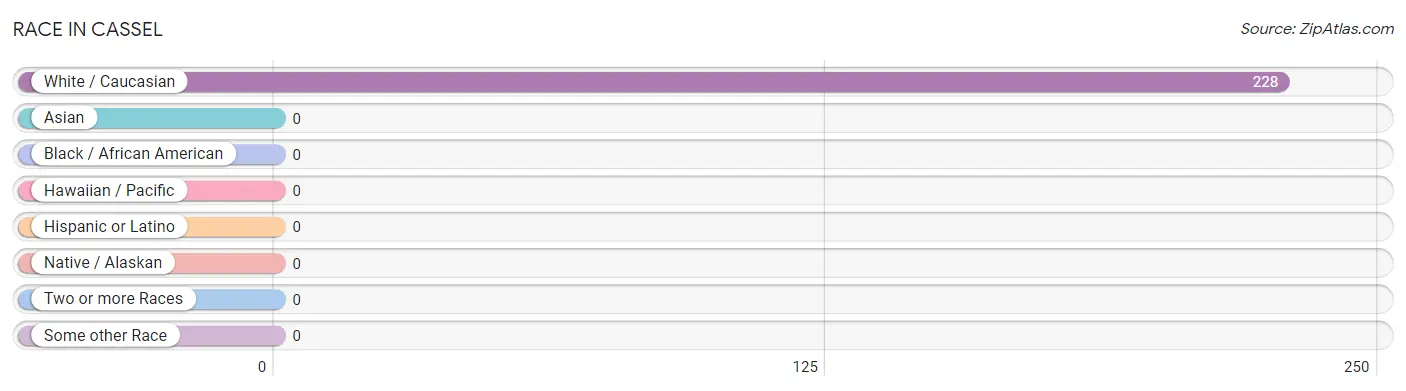
| Race | # Population | % Population |
| Asian | 0 | 0.0% |
| Black / African American | 0 | 0.0% |
| Hawaiian / Pacific | 0 | 0.0% |
| Hispanic or Latino | 0 | 0.0% |
| Native / Alaskan | 0 | 0.0% |
| White / Caucasian | 228 | 100.0% |
| Two or more Races | 0 | 0.0% |
| Some other Race | 0 | 0.0% |
| Total | 228 | 100.0% |
Ancestry in Cassel
The most populous ancestries reported in Cassel are Swiss (23 | 10.1%), Swedish (14 | 6.1%), British (7 | 3.1%), Finnish (7 | 3.1%), and German (7 | 3.1%), together accounting for 25.4% of all Cassel residents.
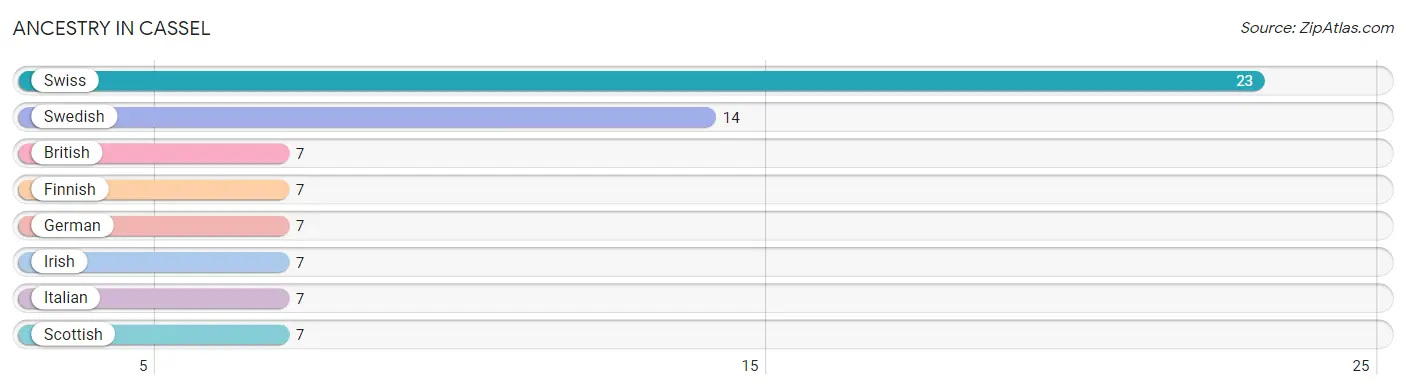
| Ancestry | # Population | % Population |
| British | 7 | 3.1% |
| Finnish | 7 | 3.1% |
| German | 7 | 3.1% |
| Irish | 7 | 3.1% |
| Italian | 7 | 3.1% |
| Scottish | 7 | 3.1% |
| Swedish | 14 | 6.1% |
| Swiss | 23 | 10.1% | View All 8 Rows |
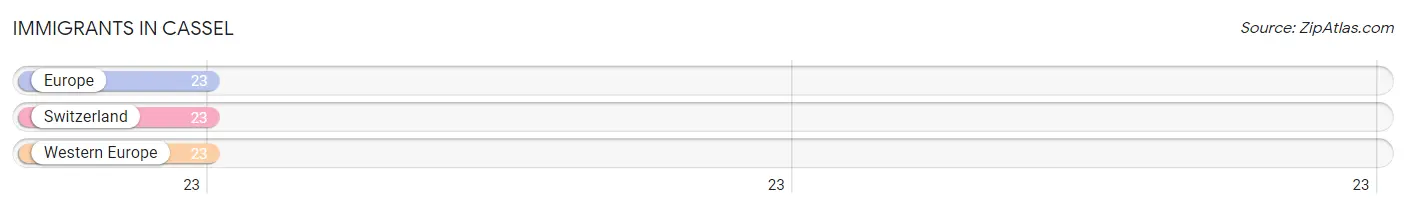
Immigrants in Cassel
The most numerous immigrant groups reported in Cassel came from Europe (23 | 10.1%), Switzerland (23 | 10.1%), and Western Europe (23 | 10.1%), together accounting for 30.3% of all Cassel residents.
| Immigration Origin | # Population | % Population |
| Europe | 23 | 10.1% |
| Switzerland | 23 | 10.1% |
| Western Europe | 23 | 10.1% | View All 3 Rows |
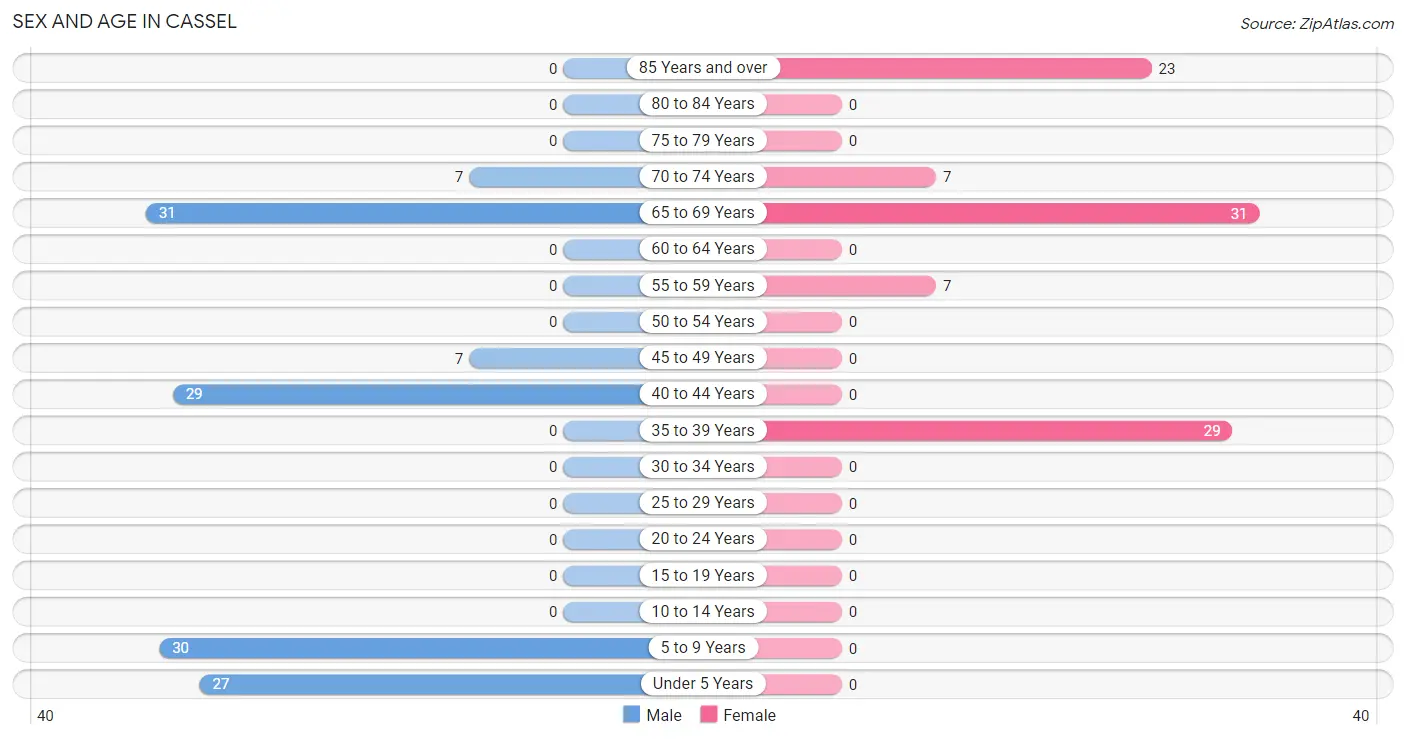
Sex and Age in Cassel
Sex and Age in Cassel
The most populous age groups in Cassel are 65 to 69 Years (31 | 23.7%) for men and 65 to 69 Years (31 | 32.0%) for women.
| Age Bracket | Male | Female |
| Under 5 Years | 27 (20.6%) | 0 (0.0%) |
| 5 to 9 Years | 30 (22.9%) | 0 (0.0%) |
| 10 to 14 Years | 0 (0.0%) | 0 (0.0%) |
| 15 to 19 Years | 0 (0.0%) | 0 (0.0%) |
| 20 to 24 Years | 0 (0.0%) | 0 (0.0%) |
| 25 to 29 Years | 0 (0.0%) | 0 (0.0%) |
| 30 to 34 Years | 0 (0.0%) | 0 (0.0%) |
| 35 to 39 Years | 0 (0.0%) | 29 (29.9%) |
| 40 to 44 Years | 29 (22.1%) | 0 (0.0%) |
| 45 to 49 Years | 7 (5.3%) | 0 (0.0%) |
| 50 to 54 Years | 0 (0.0%) | 0 (0.0%) |
| 55 to 59 Years | 0 (0.0%) | 7 (7.2%) |
| 60 to 64 Years | 0 (0.0%) | 0 (0.0%) |
| 65 to 69 Years | 31 (23.7%) | 31 (32.0%) |
| 70 to 74 Years | 7 (5.3%) | 7 (7.2%) |
| 75 to 79 Years | 0 (0.0%) | 0 (0.0%) |
| 80 to 84 Years | 0 (0.0%) | 0 (0.0%) |
| 85 Years and over | 0 (0.0%) | 23 (23.7%) |
| Total | 131 (100.0%) | 97 (100.0%) |
Families and Households in Cassel
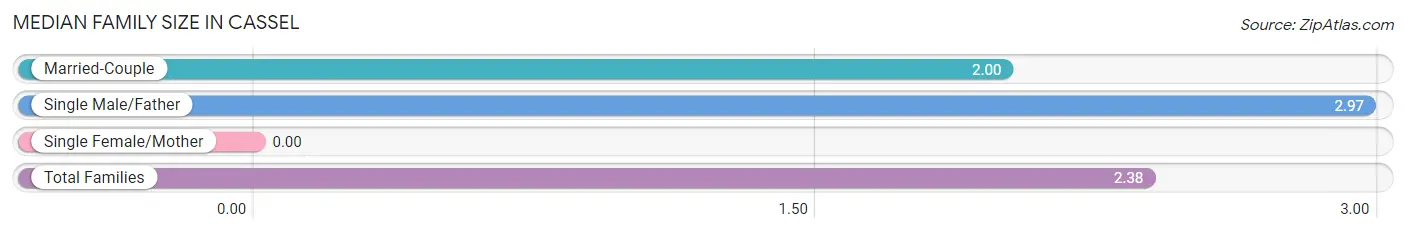
Median Family Size in Cassel
| Family Type | # Families | Family Size |
| Married-Couple | 45 (60.8%) | 2.00 |
| Single Male/Father | 29 (39.2%) | 2.97 |
| Single Female/Mother | 0 (0.0%) | - |
| Total Families | 74 (100.0%) | 2.38 |
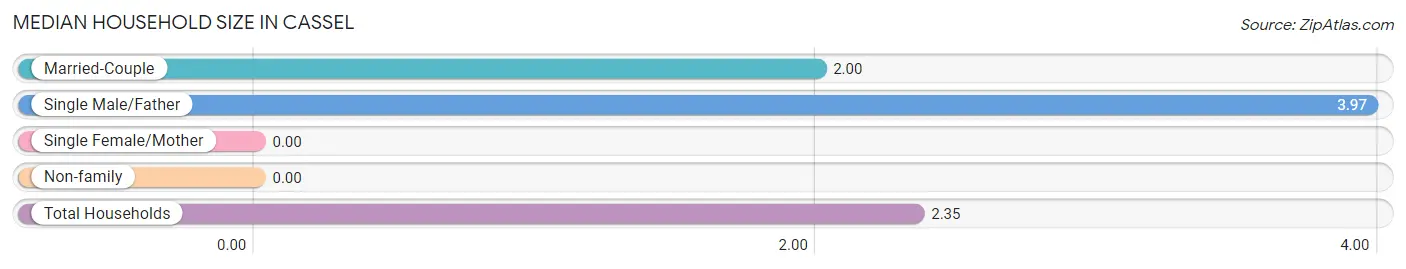
Median Household Size in Cassel
| Household Type | # Households | Household Size |
| Married-Couple | 45 (46.4%) | 2.00 |
| Single Male/Father | 29 (29.9%) | 3.97 |
| Single Female/Mother | 0 (0.0%) | - |
| Non-family | 23 (23.7%) | - |
| Total Households | 97 (100.0%) | 2.35 |
Household Size by Marriage Status in Cassel
Out of a total of 97 households in Cassel, 74 (76.3%) are family households, while 23 (23.7%) are nonfamily households. The most numerous type of family households are 2-person households, comprising 45, and the most common type of nonfamily households are 1-person households, comprising 23.
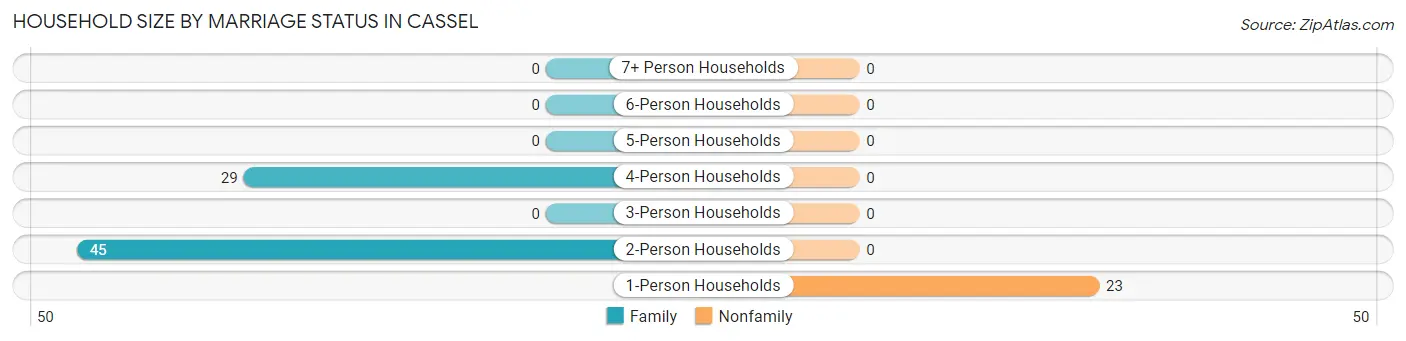
| Household Size | Family Households | Nonfamily Households |
| 1-Person Households | - | 23 (23.7%) |
| 2-Person Households | 45 (46.4%) | 0 (0.0%) |
| 3-Person Households | 0 (0.0%) | 0 (0.0%) |
| 4-Person Households | 29 (29.9%) | 0 (0.0%) |
| 5-Person Households | 0 (0.0%) | 0 (0.0%) |
| 6-Person Households | 0 (0.0%) | 0 (0.0%) |
| 7+ Person Households | 0 (0.0%) | 0 (0.0%) |
| Total | 74 (76.3%) | 23 (23.7%) |
Female Fertility in Cassel
Fertility by Age in Cassel
| Age Bracket | Women with Births | Births / 1,000 Women |
| 15 to 19 years | 0 (0.0%) | 0.0 |
| 20 to 34 years | 0 (0.0%) | 0.0 |
| 35 to 50 years | 0 (0.0%) | 0.0 |
| Total | 0 (0.0%) | 0.0 |
Fertility by Age by Marriage Status in Cassel
| Age Bracket | Married | Unmarried |
| 15 to 19 years | 0 (0.0%) | 0 (0.0%) |
| 20 to 34 years | 0 (0.0%) | 0 (0.0%) |
| 35 to 50 years | 0 (0.0%) | 0 (0.0%) |
| Total | 0 (0.0%) | 0 (0.0%) |
Fertility by Education in Cassel
| Educational Attainment | Women with Births | Births / 1,000 Women |
| Less than High School | 0 (0.0%) | 0.0 |
| High School Diploma | 0 (0.0%) | 0.0 |
| College or Associate's Degree | 0 (0.0%) | 0.0 |
| Bachelor's Degree | 0 (0.0%) | 0.0 |
| Graduate Degree | 0 (0.0%) | 0.0 |
| Total | 0 (0.0%) | 0.0 |
Fertility by Education by Marriage Status in Cassel
| Educational Attainment | Married | Unmarried |
| Less than High School | 0 (0.0%) | 0 (0.0%) |
| High School Diploma | 0 (0.0%) | 0 (0.0%) |
| College or Associate's Degree | 0 (0.0%) | 0 (0.0%) |
| Bachelor's Degree | 0 (0.0%) | 0 (0.0%) |
| Graduate Degree | 0 (0.0%) | 0 (0.0%) |
| Total | 0 (0.0%) | 0 (0.0%) |
Employment Characteristics in Cassel
Employment by Class of Employer in Cassel
Among the 43 employed individuals in Cassel, private company employees (36 | 83.7%), and self-employed (not incorporated) (7 | 16.3%) make up the most common classes of employment.
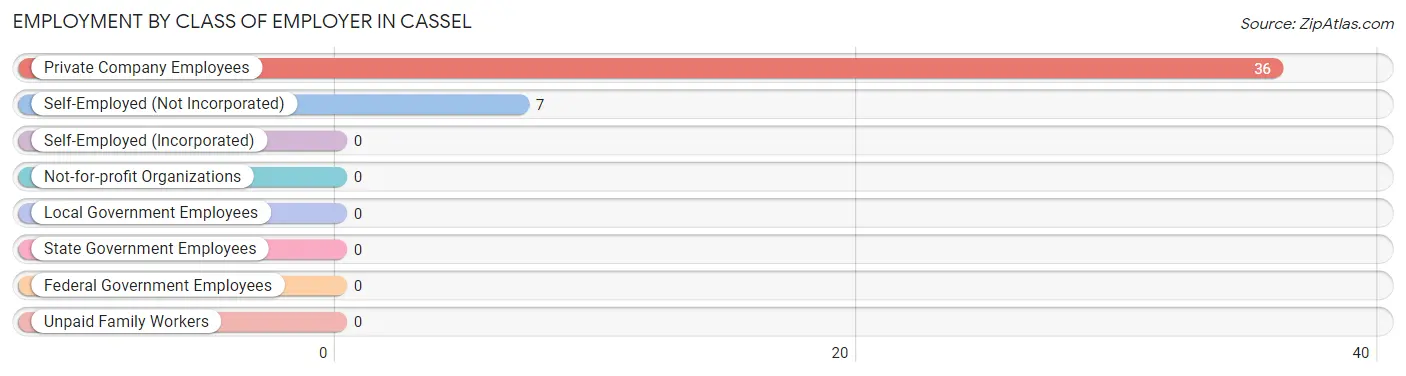
| Employer Class | # Employees | % Employees |
| Private Company Employees | 36 | 83.7% |
| Self-Employed (Incorporated) | 0 | 0.0% |
| Self-Employed (Not Incorporated) | 7 | 16.3% |
| Not-for-profit Organizations | 0 | 0.0% |
| Local Government Employees | 0 | 0.0% |
| State Government Employees | 0 | 0.0% |
| Federal Government Employees | 0 | 0.0% |
| Unpaid Family Workers | 0 | 0.0% |
| Total | 43 | 100.0% |
Employment Status by Age in Cassel
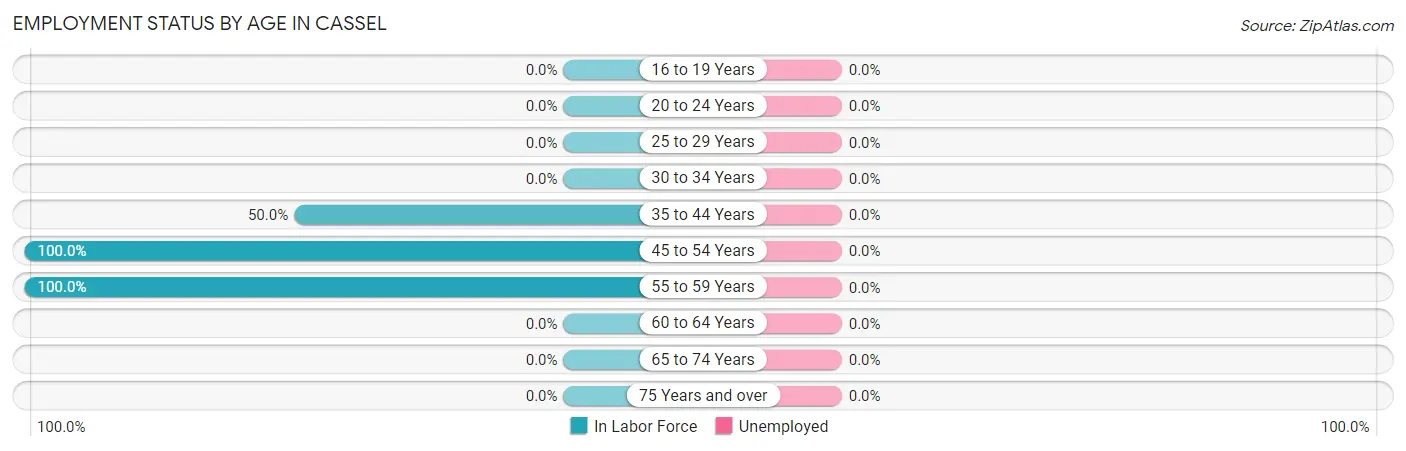
| Age Bracket | In Labor Force | Unemployed |
| 16 to 19 Years | 0 (0.0%) | 0 (0.0%) |
| 20 to 24 Years | 0 (0.0%) | 0 (0.0%) |
| 25 to 29 Years | 0 (0.0%) | 0 (0.0%) |
| 30 to 34 Years | 0 (0.0%) | 0 (0.0%) |
| 35 to 44 Years | 29 (50.0%) | 0 (0.0%) |
| 45 to 54 Years | 7 (100.0%) | 0 (0.0%) |
| 55 to 59 Years | 7 (100.0%) | 0 (0.0%) |
| 60 to 64 Years | 0 (0.0%) | 0 (0.0%) |
| 65 to 74 Years | 0 (0.0%) | 0 (0.0%) |
| 75 Years and over | 0 (0.0%) | 0 (0.0%) |
| Total | 43 (25.1%) | 0 (0.0%) |
Employment Status by Educational Attainment in Cassel
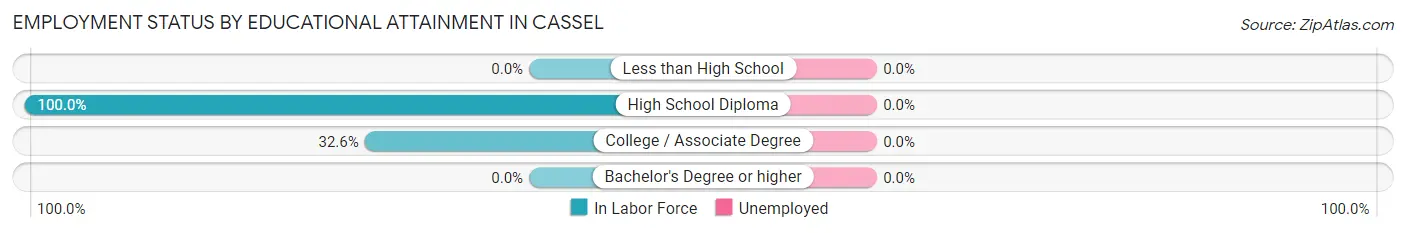
| Educational Attainment | In Labor Force | Unemployed |
| Less than High School | 0 (0.0%) | 0 (0.0%) |
| High School Diploma | 29 (100.0%) | 0 (0.0%) |
| College / Associate Degree | 14 (32.6%) | 0 (0.0%) |
| Bachelor's Degree or higher | 0 (0.0%) | 0 (0.0%) |
| Total | 43 (59.7%) | 0 (0.0%) |
Employment Occupations by Sex in Cassel
Management, Business, Science and Arts Occupations
The most common Management, Business, Science and Arts occupations in Cassel are , and Management (7 | 16.3%).
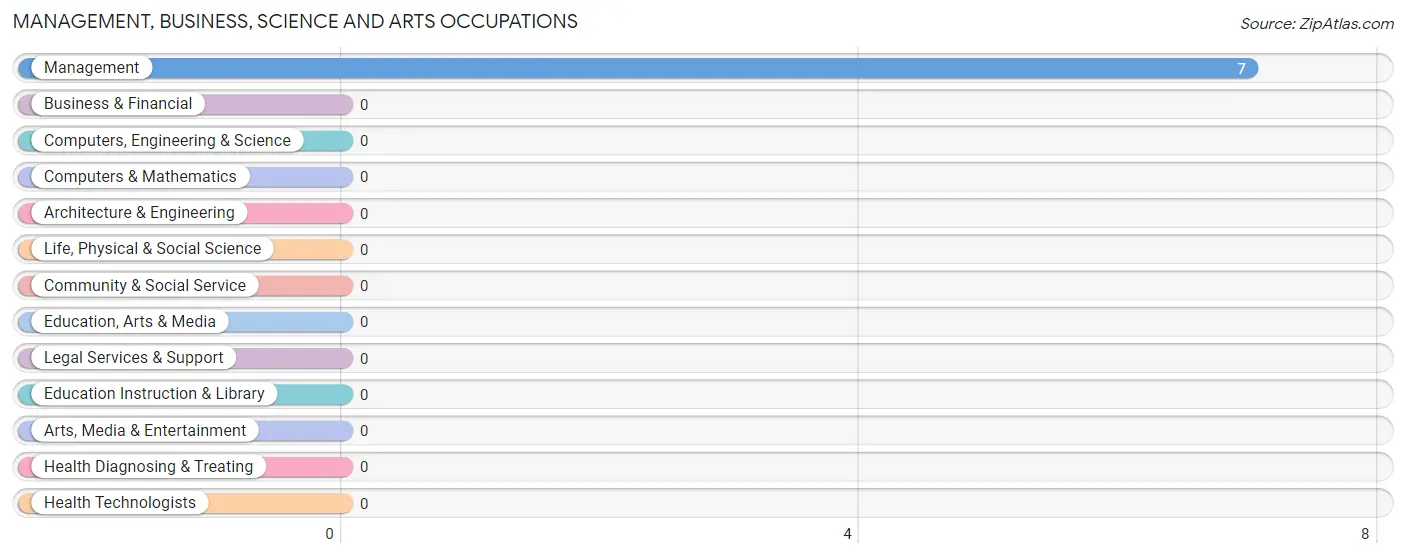
Management, Business, Science and Arts Occupations by Sex
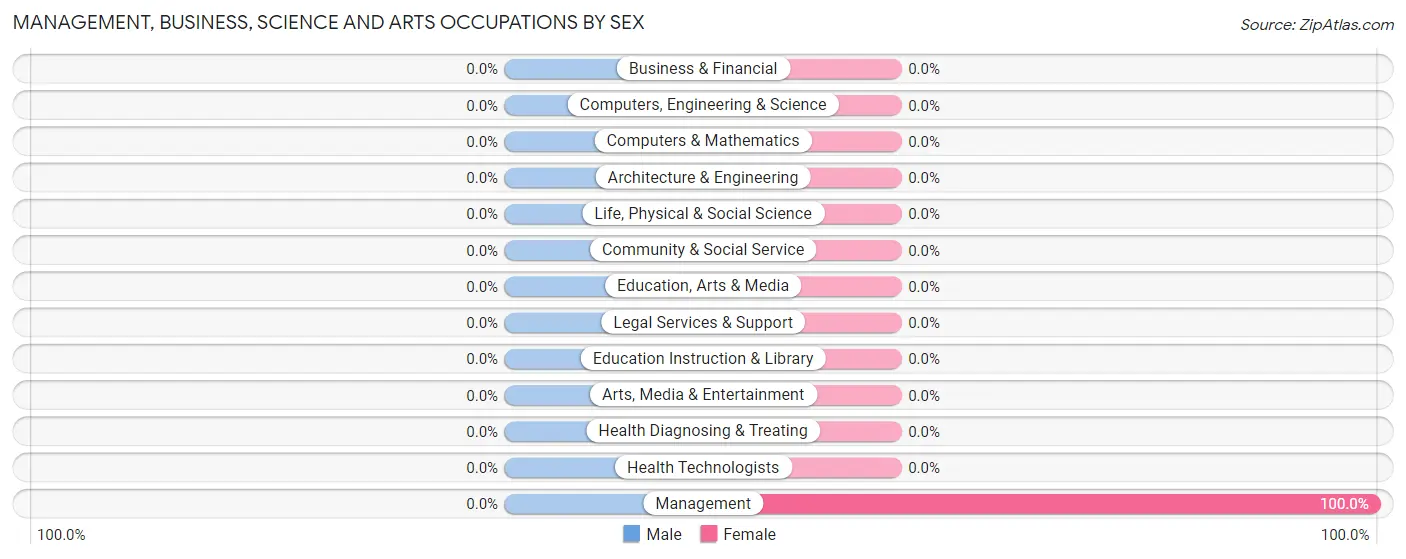
| Occupation | Male | Female |
| Management | 0 (0.0%) | 7 (100.0%) |
| Business & Financial | 0 (0.0%) | 0 (0.0%) |
| Computers, Engineering & Science | 0 (0.0%) | 0 (0.0%) |
| Computers & Mathematics | 0 (0.0%) | 0 (0.0%) |
| Architecture & Engineering | 0 (0.0%) | 0 (0.0%) |
| Life, Physical & Social Science | 0 (0.0%) | 0 (0.0%) |
| Community & Social Service | 0 (0.0%) | 0 (0.0%) |
| Education, Arts & Media | 0 (0.0%) | 0 (0.0%) |
| Legal Services & Support | 0 (0.0%) | 0 (0.0%) |
| Education Instruction & Library | 0 (0.0%) | 0 (0.0%) |
| Arts, Media & Entertainment | 0 (0.0%) | 0 (0.0%) |
| Health Diagnosing & Treating | 0 (0.0%) | 0 (0.0%) |
| Health Technologists | 0 (0.0%) | 0 (0.0%) |
| Total (Category) | 0 (0.0%) | 7 (100.0%) |
| Total (Overall) | 36 (83.7%) | 7 (16.3%) |
Services Occupations
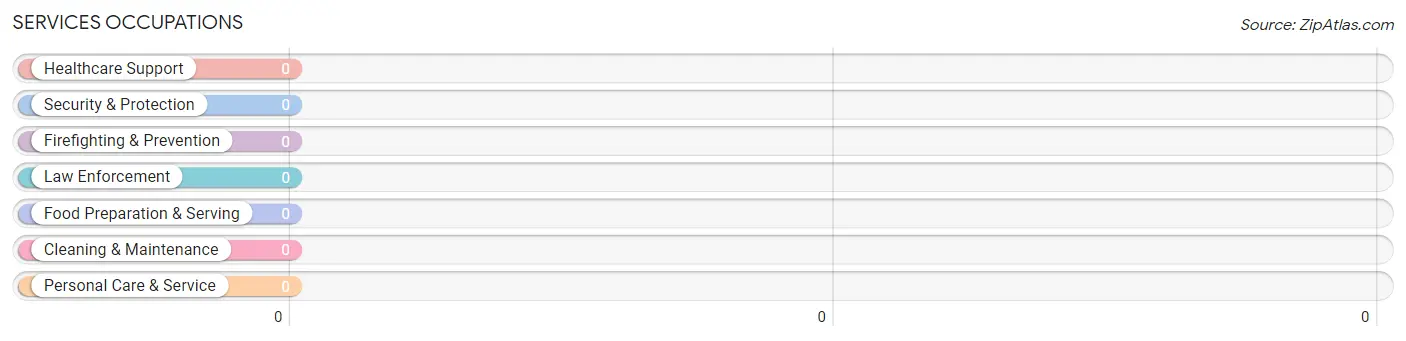
Services Occupations by Sex
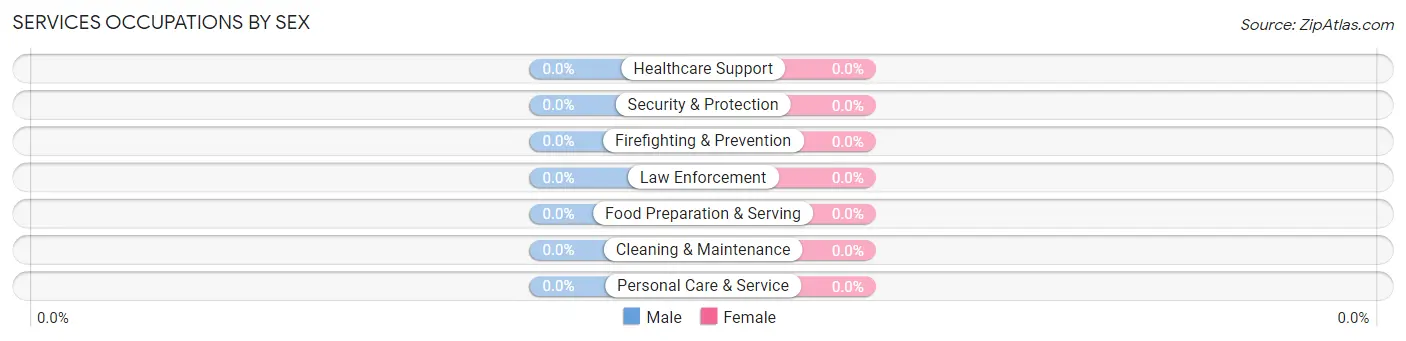
| Occupation | Male | Female |
| Healthcare Support | 0 (0.0%) | 0 (0.0%) |
| Security & Protection | 0 (0.0%) | 0 (0.0%) |
| Firefighting & Prevention | 0 (0.0%) | 0 (0.0%) |
| Law Enforcement | 0 (0.0%) | 0 (0.0%) |
| Food Preparation & Serving | 0 (0.0%) | 0 (0.0%) |
| Cleaning & Maintenance | 0 (0.0%) | 0 (0.0%) |
| Personal Care & Service | 0 (0.0%) | 0 (0.0%) |
| Total (Category) | 0 (0.0%) | 0 (0.0%) |
| Total (Overall) | 36 (83.7%) | 7 (16.3%) |
Sales and Office Occupations
Sales and Office Occupations by Sex
| Occupation | Male | Female |
| Sales & Related | 0 (0.0%) | 0 (0.0%) |
| Office & Administration | 0 (0.0%) | 0 (0.0%) |
| Total (Category) | 0 (0.0%) | 0 (0.0%) |
| Total (Overall) | 36 (83.7%) | 7 (16.3%) |
Natural Resources, Construction and Maintenance Occupations
The most common Natural Resources, Construction and Maintenance occupations in Cassel are Construction & Extraction (29 | 67.4%), and Farming, Fishing & Forestry (7 | 16.3%).
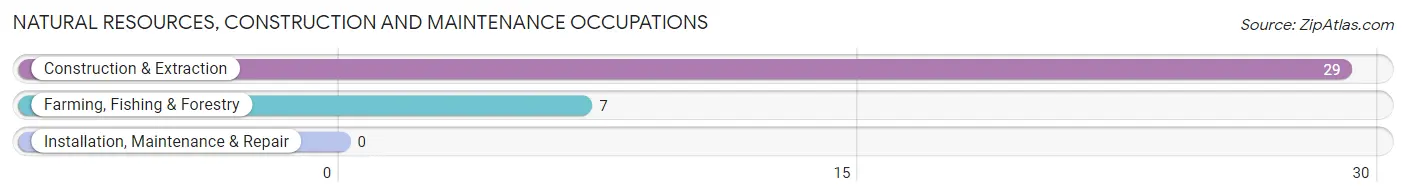
Natural Resources, Construction and Maintenance Occupations by Sex
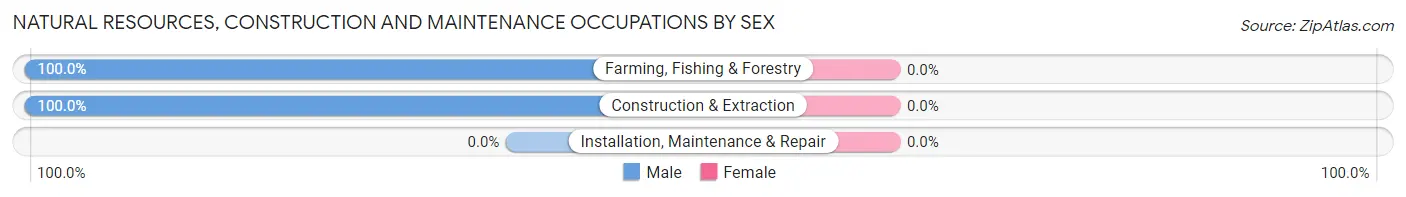
| Occupation | Male | Female |
| Farming, Fishing & Forestry | 7 (100.0%) | 0 (0.0%) |
| Construction & Extraction | 29 (100.0%) | 0 (0.0%) |
| Installation, Maintenance & Repair | 0 (0.0%) | 0 (0.0%) |
| Total (Category) | 36 (100.0%) | 0 (0.0%) |
| Total (Overall) | 36 (83.7%) | 7 (16.3%) |
Production, Transportation and Moving Occupations
Production, Transportation and Moving Occupations by Sex
| Occupation | Male | Female |
| Production | 0 (0.0%) | 0 (0.0%) |
| Transportation | 0 (0.0%) | 0 (0.0%) |
| Material Moving | 0 (0.0%) | 0 (0.0%) |
| Total (Category) | 0 (0.0%) | 0 (0.0%) |
| Total (Overall) | 36 (83.7%) | 7 (16.3%) |
Employment Industries by Sex in Cassel
Employment Industries in Cassel
The major employment industries in Cassel include Construction (29 | 67.4%), Agriculture, Fishing & Hunting (7 | 16.3%), and Finance & Insurance (7 | 16.3%).
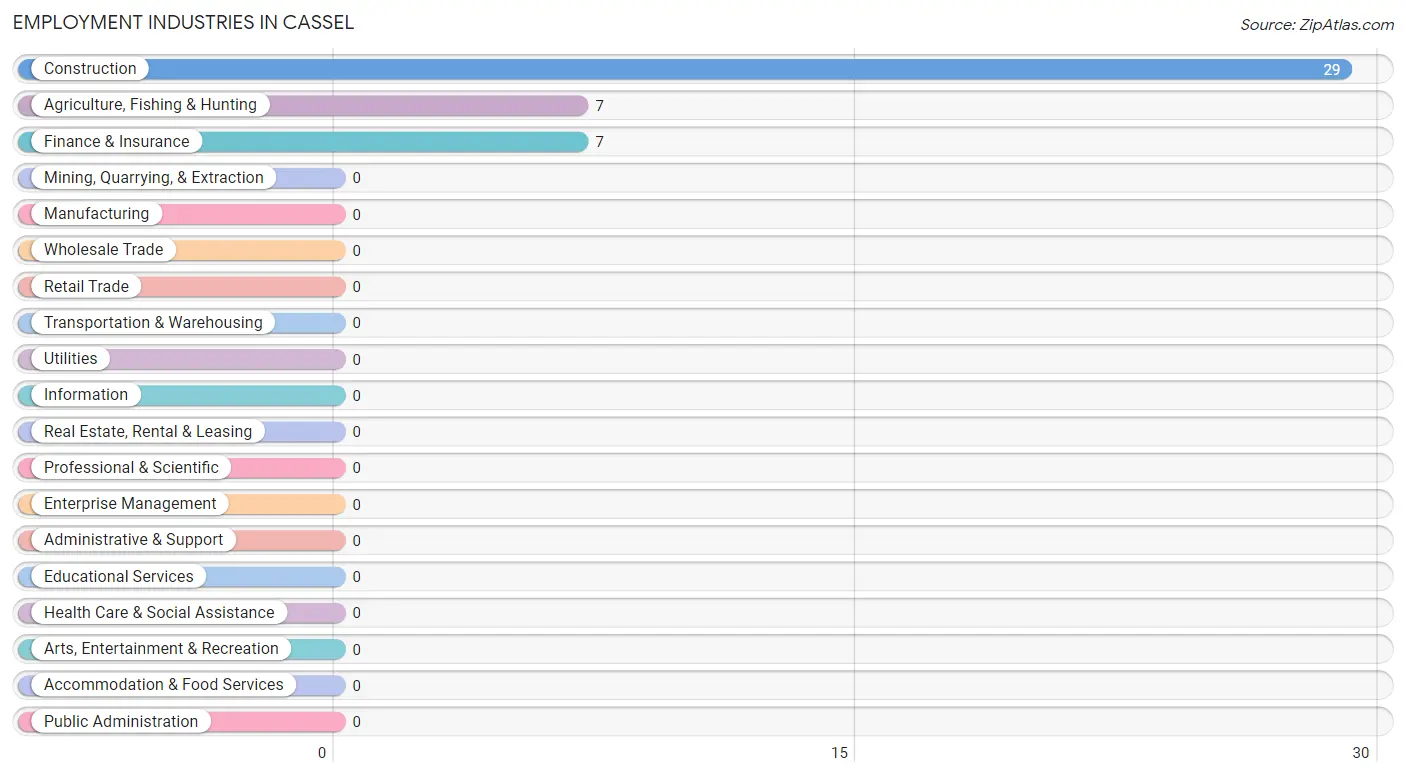
Employment Industries by Sex in Cassel
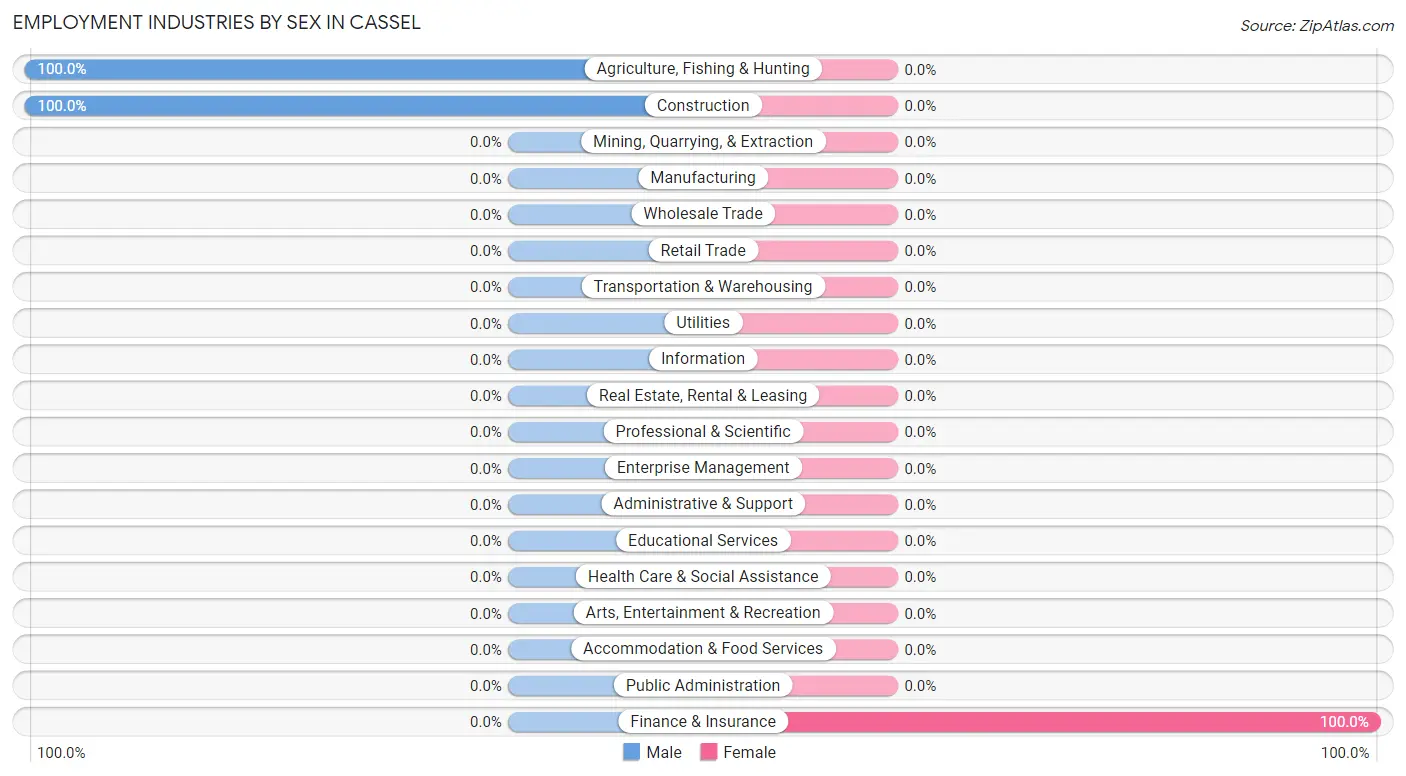
| Industry | Male | Female |
| Agriculture, Fishing & Hunting | 7 (100.0%) | 0 (0.0%) |
| Mining, Quarrying, & Extraction | 0 (0.0%) | 0 (0.0%) |
| Construction | 29 (100.0%) | 0 (0.0%) |
| Manufacturing | 0 (0.0%) | 0 (0.0%) |
| Wholesale Trade | 0 (0.0%) | 0 (0.0%) |
| Retail Trade | 0 (0.0%) | 0 (0.0%) |
| Transportation & Warehousing | 0 (0.0%) | 0 (0.0%) |
| Utilities | 0 (0.0%) | 0 (0.0%) |
| Information | 0 (0.0%) | 0 (0.0%) |
| Finance & Insurance | 0 (0.0%) | 7 (100.0%) |
| Real Estate, Rental & Leasing | 0 (0.0%) | 0 (0.0%) |
| Professional & Scientific | 0 (0.0%) | 0 (0.0%) |
| Enterprise Management | 0 (0.0%) | 0 (0.0%) |
| Administrative & Support | 0 (0.0%) | 0 (0.0%) |
| Educational Services | 0 (0.0%) | 0 (0.0%) |
| Health Care & Social Assistance | 0 (0.0%) | 0 (0.0%) |
| Arts, Entertainment & Recreation | 0 (0.0%) | 0 (0.0%) |
| Accommodation & Food Services | 0 (0.0%) | 0 (0.0%) |
| Public Administration | 0 (0.0%) | 0 (0.0%) |
| Total | 36 (83.7%) | 7 (16.3%) |
Education in Cassel
School Enrollment in Cassel
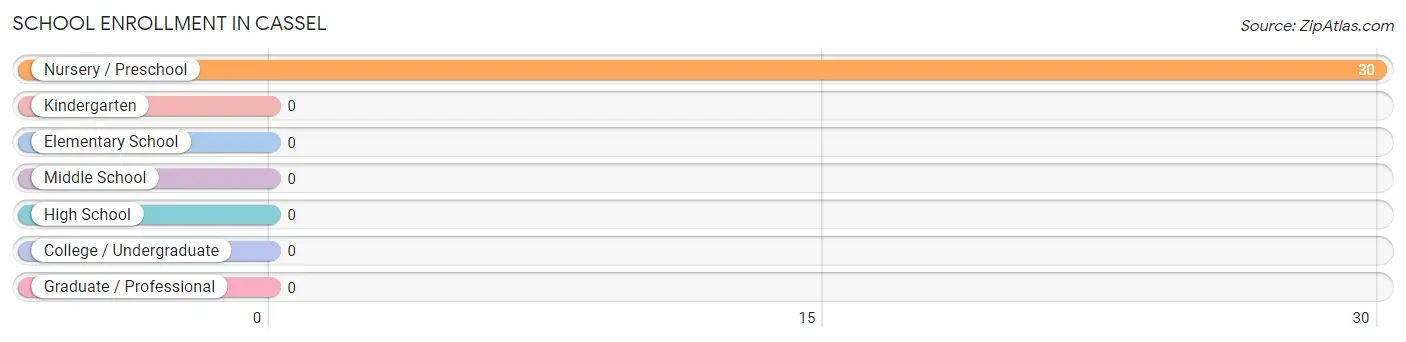
| School Level | # Students | % Students |
| Nursery / Preschool | 30 | 100.0% |
| Kindergarten | 0 | 0.0% |
| Elementary School | 0 | 0.0% |
| Middle School | 0 | 0.0% |
| High School | 0 | 0.0% |
| College / Undergraduate | 0 | 0.0% |
| Graduate / Professional | 0 | 0.0% |
| Total | 30 | 100.0% |
School Enrollment by Age by Funding Source in Cassel
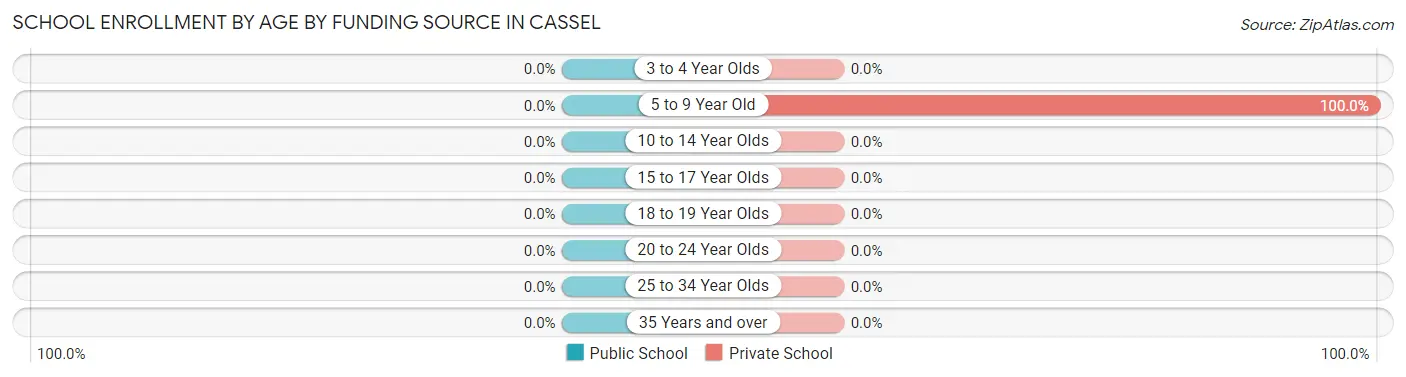
| Age Bracket | Public School | Private School |
| 3 to 4 Year Olds | 0 (0.0%) | 0 (0.0%) |
| 5 to 9 Year Old | 0 (0.0%) | 30 (100.0%) |
| 10 to 14 Year Olds | 0 (0.0%) | 0 (0.0%) |
| 15 to 17 Year Olds | 0 (0.0%) | 0 (0.0%) |
| 18 to 19 Year Olds | 0 (0.0%) | 0 (0.0%) |
| 20 to 24 Year Olds | 0 (0.0%) | 0 (0.0%) |
| 25 to 34 Year Olds | 0 (0.0%) | 0 (0.0%) |
| 35 Years and over | 0 (0.0%) | 0 (0.0%) |
| Total | 0 (0.0%) | 30 (100.0%) |
Educational Attainment by Field of Study in Cassel
Science & technology (23 | 52.3%), psychology (7 | 15.9%), business (7 | 15.9%), and arts & humanities (7 | 15.9%) are the most common fields of study among 44 individuals in Cassel who have obtained a bachelor's degree or higher.
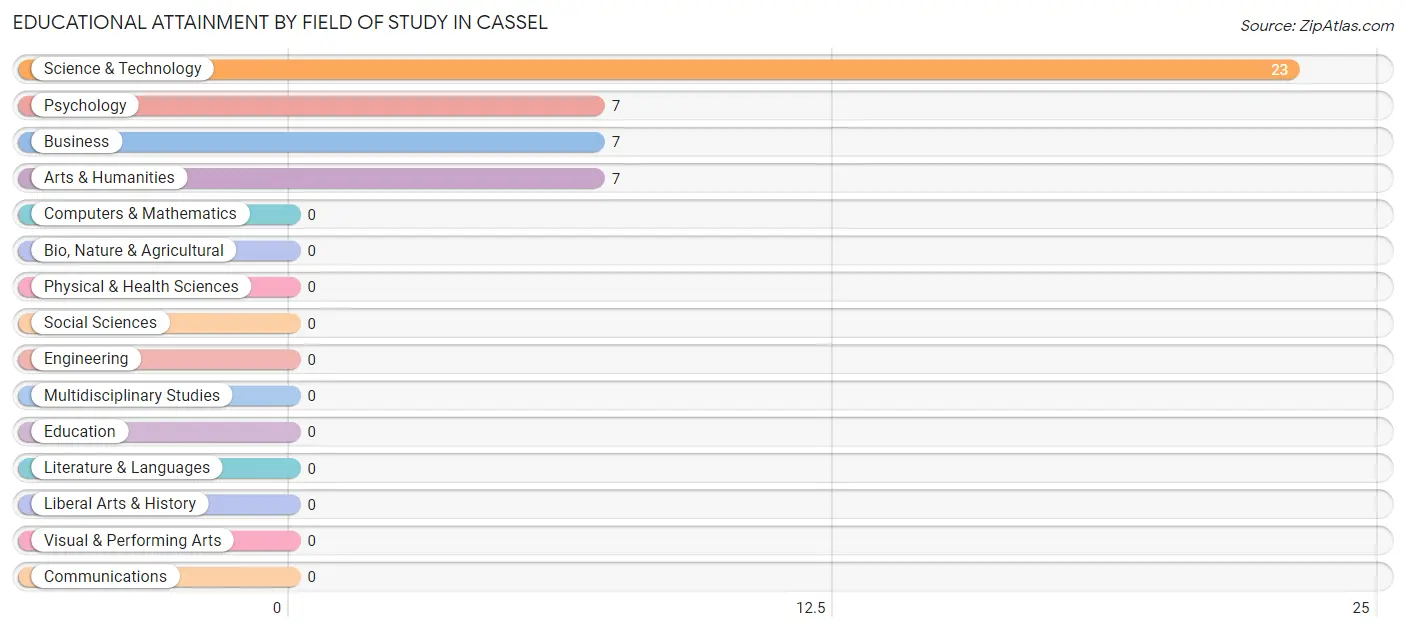
| Field of Study | # Graduates | % Graduates |
| Computers & Mathematics | 0 | 0.0% |
| Bio, Nature & Agricultural | 0 | 0.0% |
| Physical & Health Sciences | 0 | 0.0% |
| Psychology | 7 | 15.9% |
| Social Sciences | 0 | 0.0% |
| Engineering | 0 | 0.0% |
| Multidisciplinary Studies | 0 | 0.0% |
| Science & Technology | 23 | 52.3% |
| Business | 7 | 15.9% |
| Education | 0 | 0.0% |
| Literature & Languages | 0 | 0.0% |
| Liberal Arts & History | 0 | 0.0% |
| Visual & Performing Arts | 0 | 0.0% |
| Communications | 0 | 0.0% |
| Arts & Humanities | 7 | 15.9% |
| Total | 44 | 100.0% |
Transportation & Commute in Cassel
Vehicle Availability by Sex in Cassel
The most prevalent vehicle ownership categories in Cassel are males with 2 vehicles (36, accounting for 100.0%) and females with 2 vehicles (7, making up 514.3%).
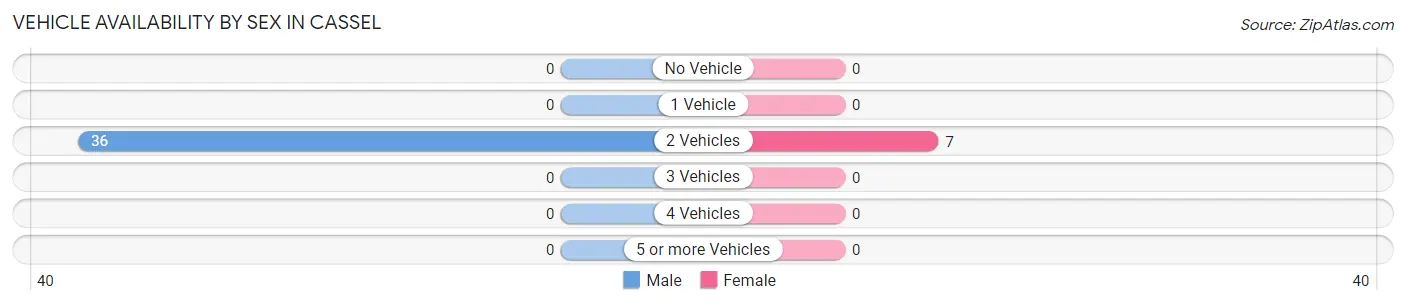
| Vehicles Available | Male | Female |
| No Vehicle | 0 (0.0%) | 0 (0.0%) |
| 1 Vehicle | 0 (0.0%) | 0 (0.0%) |
| 2 Vehicles | 36 (100.0%) | 7 (100.0%) |
| 3 Vehicles | 0 (0.0%) | 0 (0.0%) |
| 4 Vehicles | 0 (0.0%) | 0 (0.0%) |
| 5 or more Vehicles | 0 (0.0%) | 0 (0.0%) |
| Total | 36 (100.0%) | 7 (100.0%) |
Commute Time in Cassel
The most frequently occuring commute durations in Cassel are 30 to 34 minutes (29 commuters, 80.6%), 15 to 19 minutes (7 commuters, 19.4%), and less than 5 minutes (0 commuters, 0.0%).
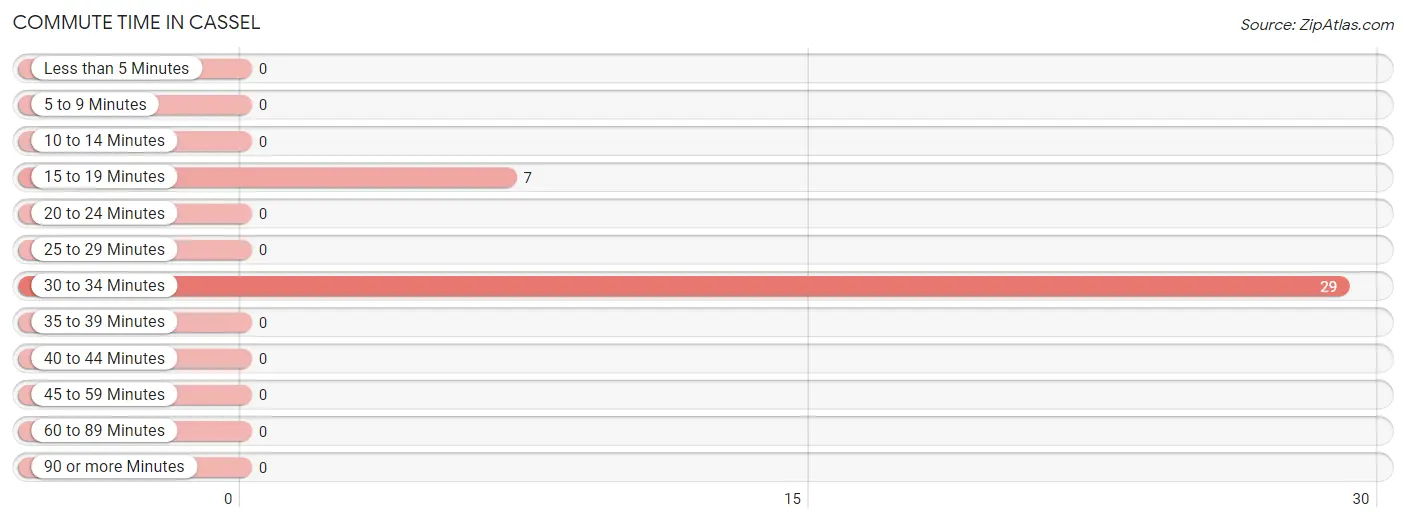
| Commute Time | # Commuters | % Commuters |
| Less than 5 Minutes | 0 | 0.0% |
| 5 to 9 Minutes | 0 | 0.0% |
| 10 to 14 Minutes | 0 | 0.0% |
| 15 to 19 Minutes | 7 | 19.4% |
| 20 to 24 Minutes | 0 | 0.0% |
| 25 to 29 Minutes | 0 | 0.0% |
| 30 to 34 Minutes | 29 | 80.6% |
| 35 to 39 Minutes | 0 | 0.0% |
| 40 to 44 Minutes | 0 | 0.0% |
| 45 to 59 Minutes | 0 | 0.0% |
| 60 to 89 Minutes | 0 | 0.0% |
| 90 or more Minutes | 0 | 0.0% |
Commute Time by Sex in Cassel
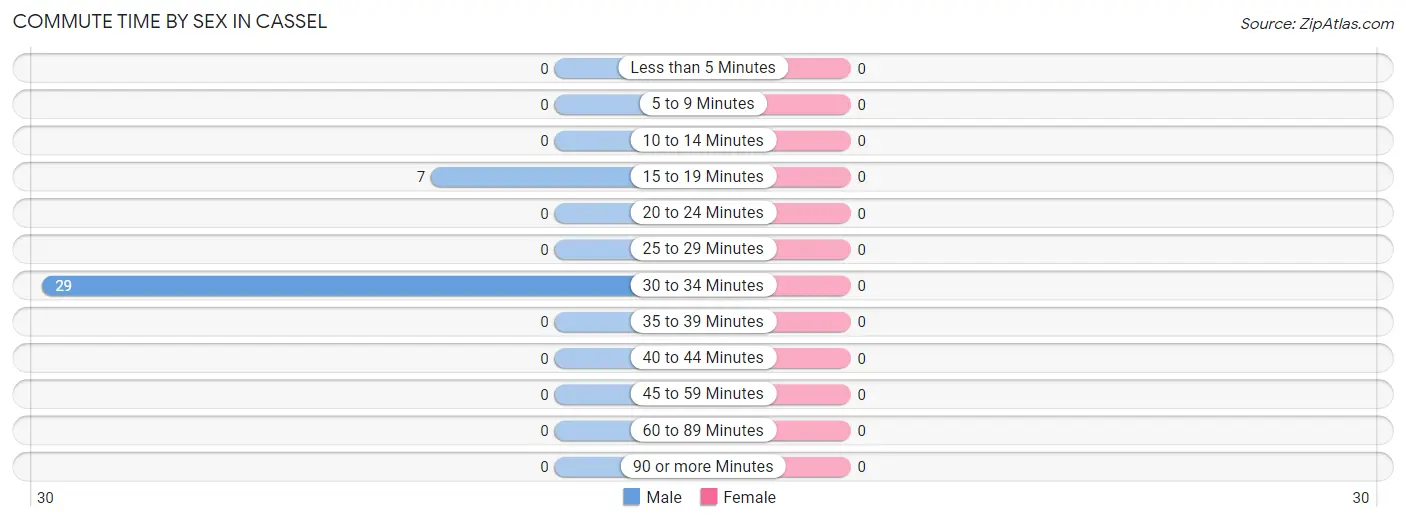
| Commute Time | Male | Female |
| Less than 5 Minutes | 0 (0.0%) | 0 (0.0%) |
| 5 to 9 Minutes | 0 (0.0%) | 0 (0.0%) |
| 10 to 14 Minutes | 0 (0.0%) | 0 (0.0%) |
| 15 to 19 Minutes | 7 (19.4%) | 0 (0.0%) |
| 20 to 24 Minutes | 0 (0.0%) | 0 (0.0%) |
| 25 to 29 Minutes | 0 (0.0%) | 0 (0.0%) |
| 30 to 34 Minutes | 29 (80.6%) | 0 (0.0%) |
| 35 to 39 Minutes | 0 (0.0%) | 0 (0.0%) |
| 40 to 44 Minutes | 0 (0.0%) | 0 (0.0%) |
| 45 to 59 Minutes | 0 (0.0%) | 0 (0.0%) |
| 60 to 89 Minutes | 0 (0.0%) | 0 (0.0%) |
| 90 or more Minutes | 0 (0.0%) | 0 (0.0%) |
Time of Departure to Work by Sex in Cassel
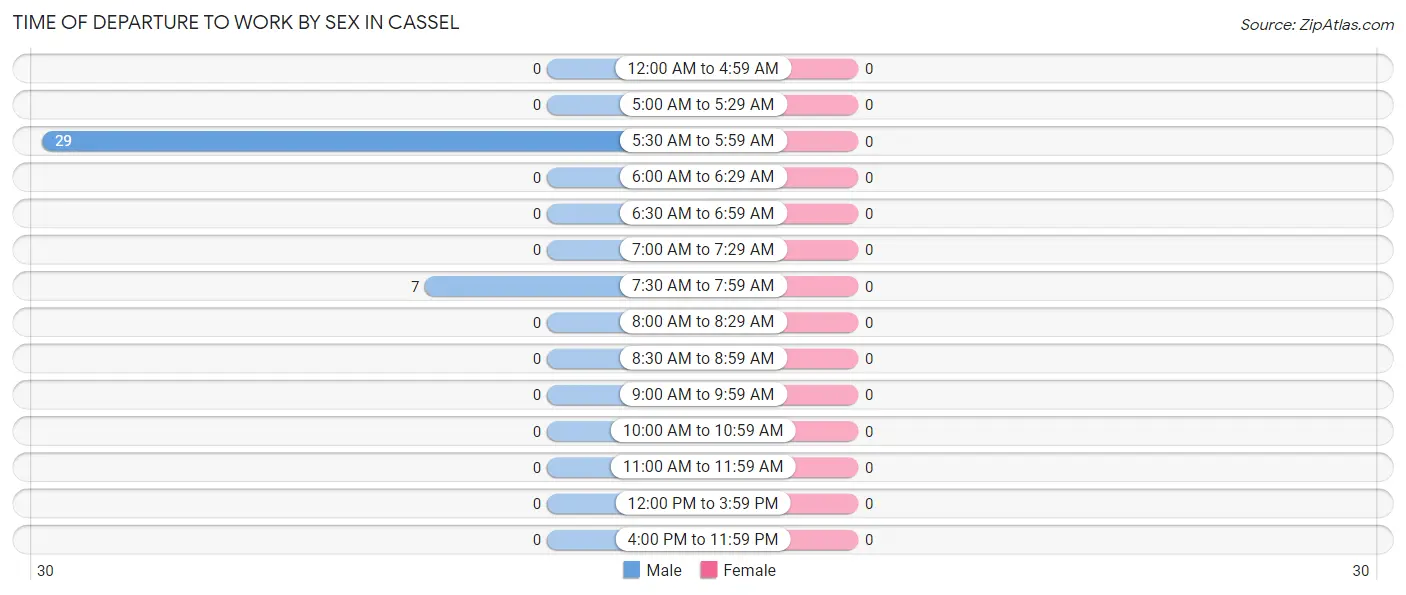
| Time of Departure | Male | Female |
| 12:00 AM to 4:59 AM | 0 (0.0%) | 0 (0.0%) |
| 5:00 AM to 5:29 AM | 0 (0.0%) | 0 (0.0%) |
| 5:30 AM to 5:59 AM | 29 (80.6%) | 0 (0.0%) |
| 6:00 AM to 6:29 AM | 0 (0.0%) | 0 (0.0%) |
| 6:30 AM to 6:59 AM | 0 (0.0%) | 0 (0.0%) |
| 7:00 AM to 7:29 AM | 0 (0.0%) | 0 (0.0%) |
| 7:30 AM to 7:59 AM | 7 (19.4%) | 0 (0.0%) |
| 8:00 AM to 8:29 AM | 0 (0.0%) | 0 (0.0%) |
| 8:30 AM to 8:59 AM | 0 (0.0%) | 0 (0.0%) |
| 9:00 AM to 9:59 AM | 0 (0.0%) | 0 (0.0%) |
| 10:00 AM to 10:59 AM | 0 (0.0%) | 0 (0.0%) |
| 11:00 AM to 11:59 AM | 0 (0.0%) | 0 (0.0%) |
| 12:00 PM to 3:59 PM | 0 (0.0%) | 0 (0.0%) |
| 4:00 PM to 11:59 PM | 0 (0.0%) | 0 (0.0%) |
| Total | 36 (100.0%) | 0 (0.0%) |
Housing Occupancy in Cassel
Occupancy by Ownership in Cassel
Of the total 97 dwellings in Cassel, owner-occupied units account for 68 (70.1%), while renter-occupied units make up 29 (29.9%).
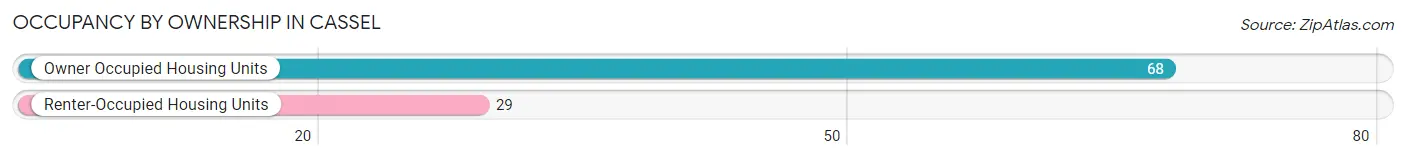
| Occupancy | # Housing Units | % Housing Units |
| Owner Occupied Housing Units | 68 | 70.1% |
| Renter-Occupied Housing Units | 29 | 29.9% |
| Total Occupied Housing Units | 97 | 100.0% |
Occupancy by Household Size in Cassel
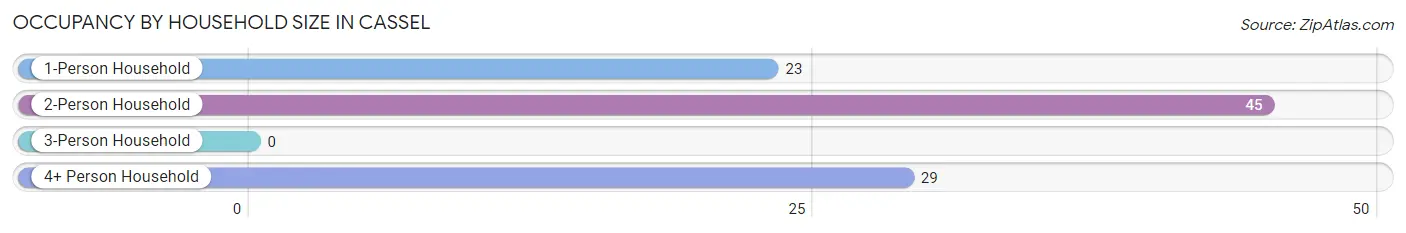
| Household Size | # Housing Units | % Housing Units |
| 1-Person Household | 23 | 23.7% |
| 2-Person Household | 45 | 46.4% |
| 3-Person Household | 0 | 0.0% |
| 4+ Person Household | 29 | 29.9% |
| Total Housing Units | 97 | 100.0% |
Occupancy by Ownership by Household Size in Cassel
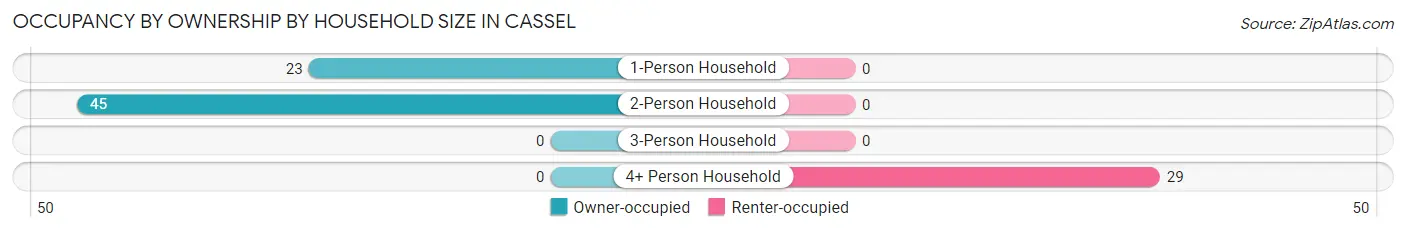
| Household Size | Owner-occupied | Renter-occupied |
| 1-Person Household | 23 (100.0%) | 0 (0.0%) |
| 2-Person Household | 45 (100.0%) | 0 (0.0%) |
| 3-Person Household | 0 (0.0%) | 0 (0.0%) |
| 4+ Person Household | 0 (0.0%) | 29 (100.0%) |
| Total Housing Units | 68 (70.1%) | 29 (29.9%) |
Occupancy by Educational Attainment in Cassel
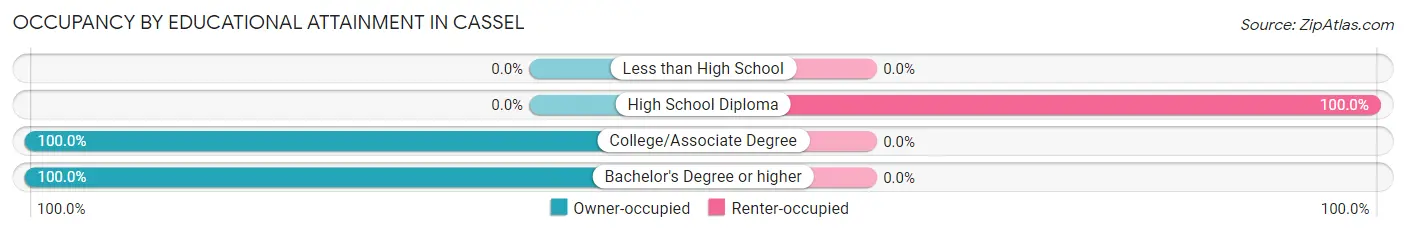
| Household Size | Owner-occupied | Renter-occupied |
| Less than High School | 0 (0.0%) | 0 (0.0%) |
| High School Diploma | 0 (0.0%) | 29 (100.0%) |
| College/Associate Degree | 38 (100.0%) | 0 (0.0%) |
| Bachelor's Degree or higher | 30 (100.0%) | 0 (0.0%) |
Occupancy by Age of Householder in Cassel
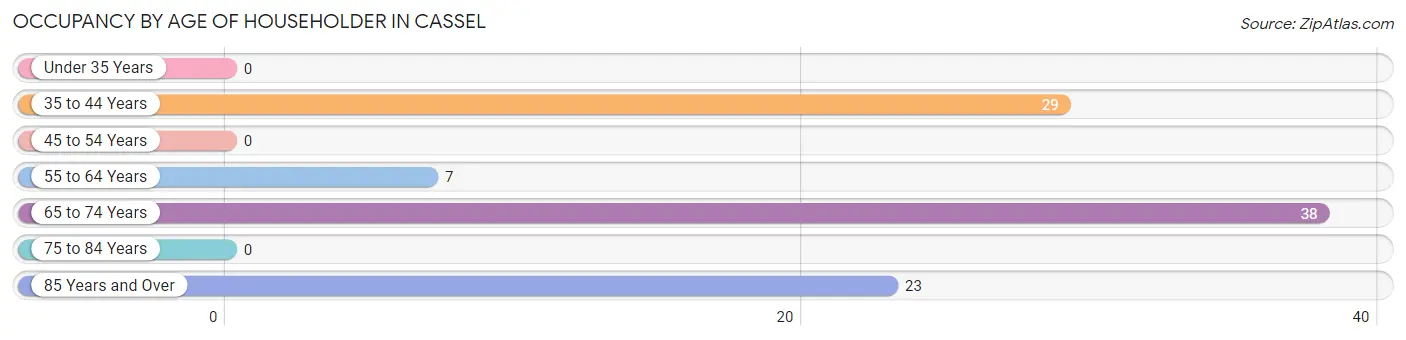
| Age Bracket | # Households | % Households |
| Under 35 Years | 0 | 0.0% |
| 35 to 44 Years | 29 | 29.9% |
| 45 to 54 Years | 0 | 0.0% |
| 55 to 64 Years | 7 | 7.2% |
| 65 to 74 Years | 38 | 39.2% |
| 75 to 84 Years | 0 | 0.0% |
| 85 Years and Over | 23 | 23.7% |
| Total | 97 | 100.0% |
Housing Finances in Cassel
Median Income by Occupancy in Cassel
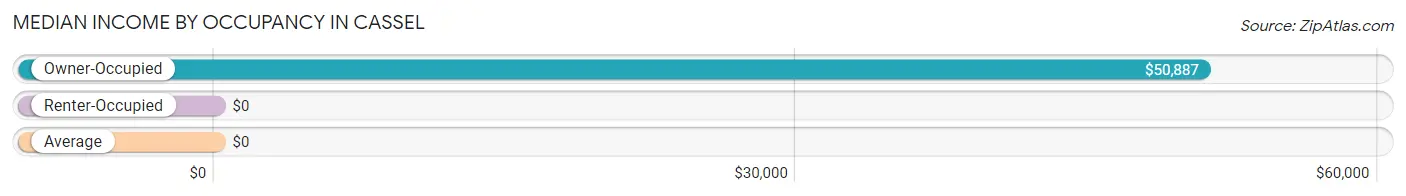
| Occupancy Type | # Households | Median Income |
| Owner-Occupied | 68 (70.1%) | $50,887 |
| Renter-Occupied | 29 (29.9%) | $0 |
| Average | 97 (100.0%) | $0 |
Occupancy by Householder Income Bracket in Cassel
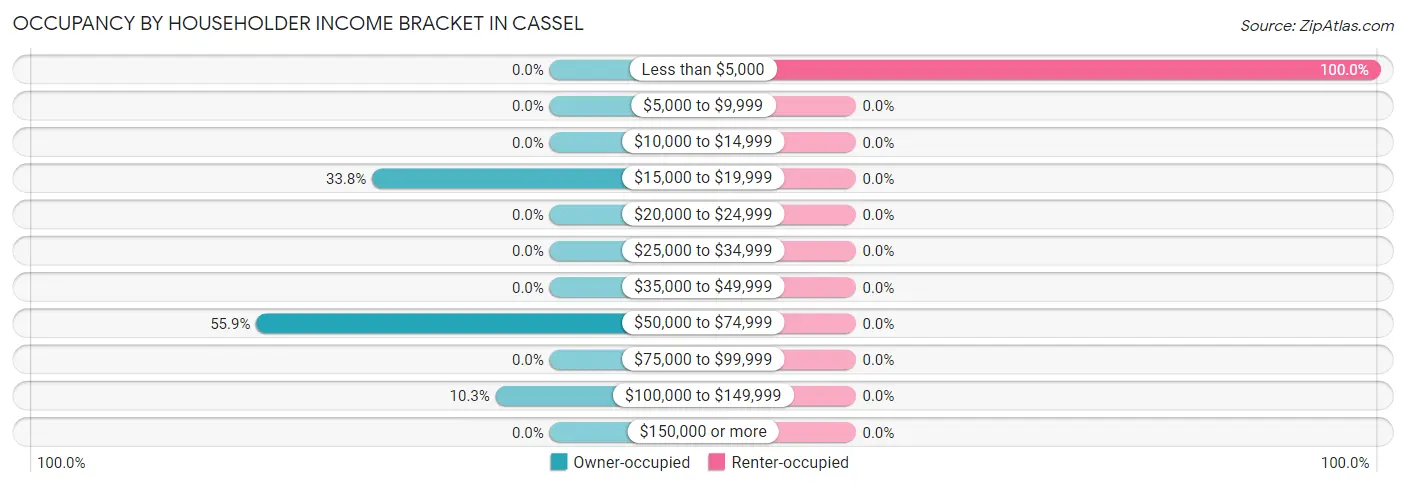
| Income Bracket | Owner-occupied | Renter-occupied |
| Less than $5,000 | 0 (0.0%) | 29 (100.0%) |
| $5,000 to $9,999 | 0 (0.0%) | 0 (0.0%) |
| $10,000 to $14,999 | 0 (0.0%) | 0 (0.0%) |
| $15,000 to $19,999 | 23 (33.8%) | 0 (0.0%) |
| $20,000 to $24,999 | 0 (0.0%) | 0 (0.0%) |
| $25,000 to $34,999 | 0 (0.0%) | 0 (0.0%) |
| $35,000 to $49,999 | 0 (0.0%) | 0 (0.0%) |
| $50,000 to $74,999 | 38 (55.9%) | 0 (0.0%) |
| $75,000 to $99,999 | 0 (0.0%) | 0 (0.0%) |
| $100,000 to $149,999 | 7 (10.3%) | 0 (0.0%) |
| $150,000 or more | 0 (0.0%) | 0 (0.0%) |
| Total | 68 (100.0%) | 29 (100.0%) |
Monthly Housing Cost Tiers in Cassel
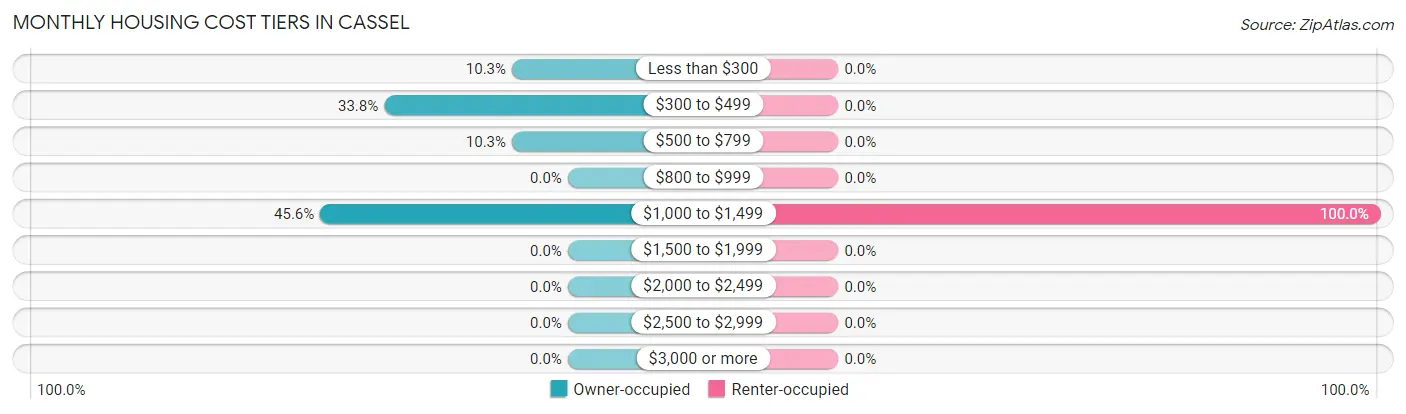
| Monthly Cost | Owner-occupied | Renter-occupied |
| Less than $300 | 7 (10.3%) | 0 (0.0%) |
| $300 to $499 | 23 (33.8%) | 0 (0.0%) |
| $500 to $799 | 7 (10.3%) | 0 (0.0%) |
| $800 to $999 | 0 (0.0%) | 0 (0.0%) |
| $1,000 to $1,499 | 31 (45.6%) | 29 (100.0%) |
| $1,500 to $1,999 | 0 (0.0%) | 0 (0.0%) |
| $2,000 to $2,499 | 0 (0.0%) | 0 (0.0%) |
| $2,500 to $2,999 | 0 (0.0%) | 0 (0.0%) |
| $3,000 or more | 0 (0.0%) | 0 (0.0%) |
| Total | 68 (100.0%) | 29 (100.0%) |
Physical Housing Characteristics in Cassel
Housing Structures in Cassel
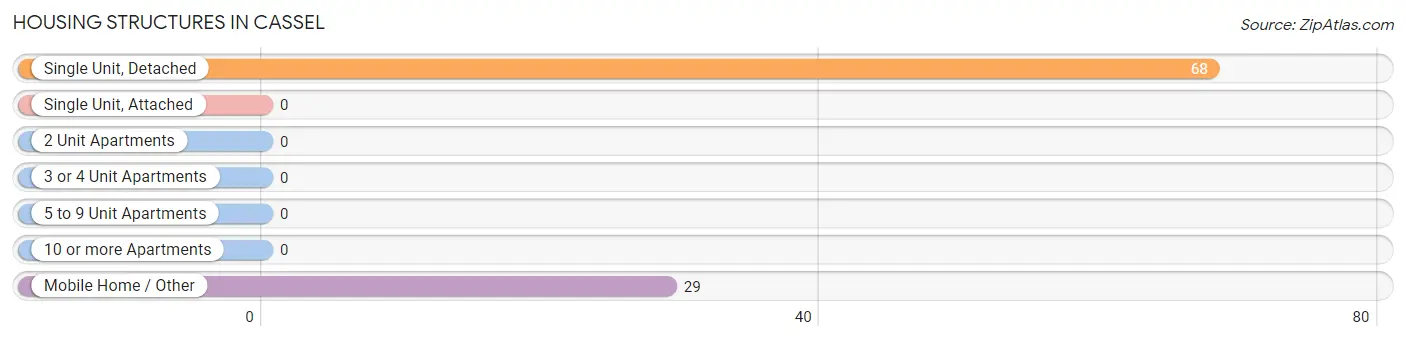
| Structure Type | # Housing Units | % Housing Units |
| Single Unit, Detached | 68 | 70.1% |
| Single Unit, Attached | 0 | 0.0% |
| 2 Unit Apartments | 0 | 0.0% |
| 3 or 4 Unit Apartments | 0 | 0.0% |
| 5 to 9 Unit Apartments | 0 | 0.0% |
| 10 or more Apartments | 0 | 0.0% |
| Mobile Home / Other | 29 | 29.9% |
| Total | 97 | 100.0% |
Housing Structures by Occupancy in Cassel
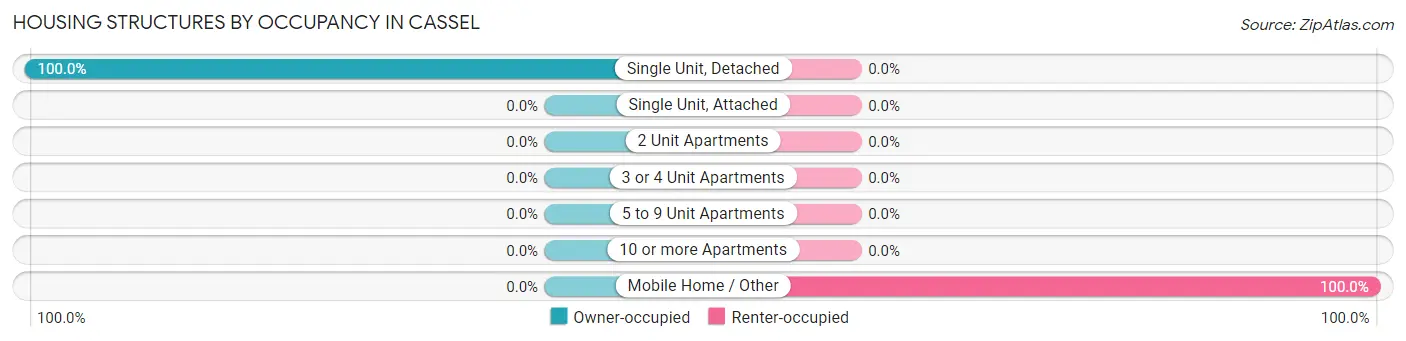
| Structure Type | Owner-occupied | Renter-occupied |
| Single Unit, Detached | 68 (100.0%) | 0 (0.0%) |
| Single Unit, Attached | 0 (0.0%) | 0 (0.0%) |
| 2 Unit Apartments | 0 (0.0%) | 0 (0.0%) |
| 3 or 4 Unit Apartments | 0 (0.0%) | 0 (0.0%) |
| 5 to 9 Unit Apartments | 0 (0.0%) | 0 (0.0%) |
| 10 or more Apartments | 0 (0.0%) | 0 (0.0%) |
| Mobile Home / Other | 0 (0.0%) | 29 (100.0%) |
| Total | 68 (70.1%) | 29 (29.9%) |
Housing Structures by Number of Rooms in Cassel
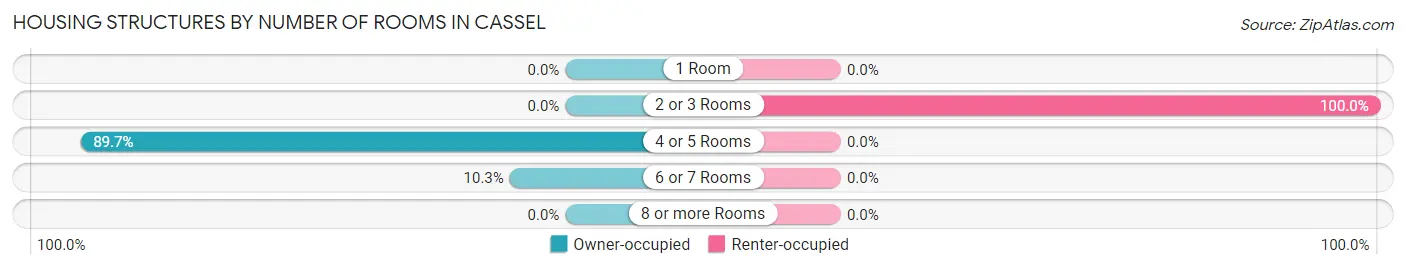
| Number of Rooms | Owner-occupied | Renter-occupied |
| 1 Room | 0 (0.0%) | 0 (0.0%) |
| 2 or 3 Rooms | 0 (0.0%) | 29 (100.0%) |
| 4 or 5 Rooms | 61 (89.7%) | 0 (0.0%) |
| 6 or 7 Rooms | 7 (10.3%) | 0 (0.0%) |
| 8 or more Rooms | 0 (0.0%) | 0 (0.0%) |
| Total | 68 (100.0%) | 29 (100.0%) |
Housing Structure by Heating Type in Cassel
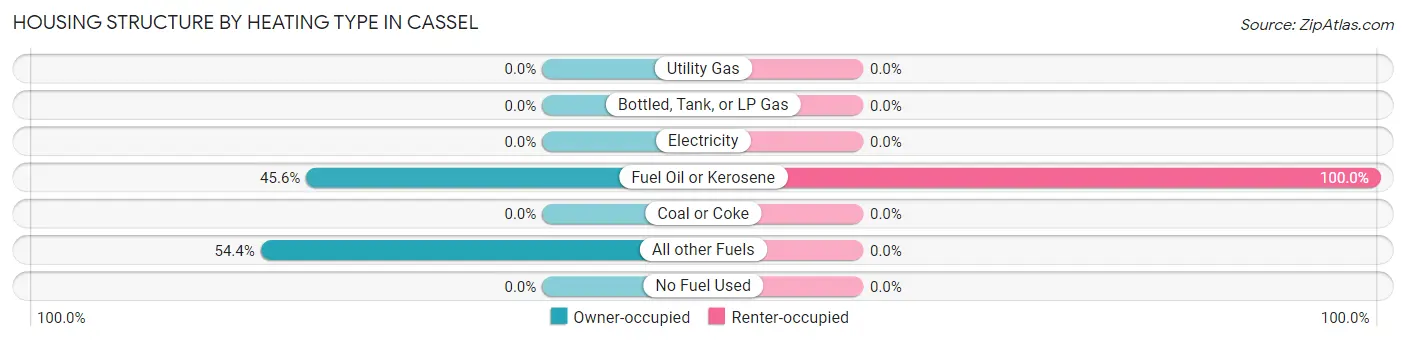
| Heating Type | Owner-occupied | Renter-occupied |
| Utility Gas | 0 (0.0%) | 0 (0.0%) |
| Bottled, Tank, or LP Gas | 0 (0.0%) | 0 (0.0%) |
| Electricity | 0 (0.0%) | 0 (0.0%) |
| Fuel Oil or Kerosene | 31 (45.6%) | 29 (100.0%) |
| Coal or Coke | 0 (0.0%) | 0 (0.0%) |
| All other Fuels | 37 (54.4%) | 0 (0.0%) |
| No Fuel Used | 0 (0.0%) | 0 (0.0%) |
| Total | 68 (100.0%) | 29 (100.0%) |
Household Vehicle Usage in Cassel
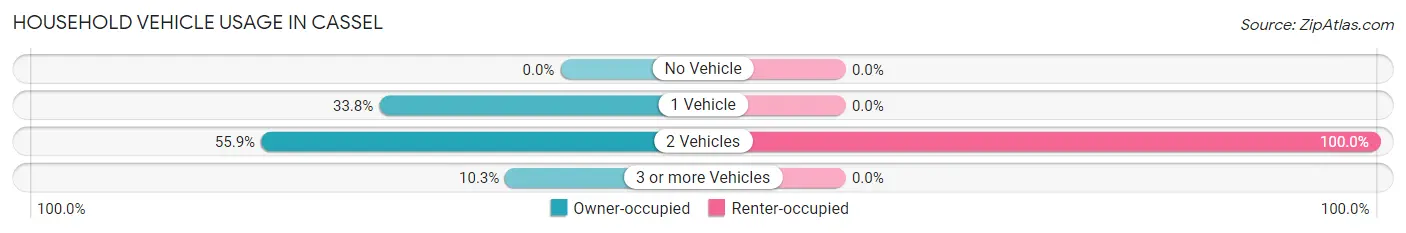
| Vehicles per Household | Owner-occupied | Renter-occupied |
| No Vehicle | 0 (0.0%) | 0 (0.0%) |
| 1 Vehicle | 23 (33.8%) | 0 (0.0%) |
| 2 Vehicles | 38 (55.9%) | 29 (100.0%) |
| 3 or more Vehicles | 7 (10.3%) | 0 (0.0%) |
| Total | 68 (100.0%) | 29 (100.0%) |
Real Estate & Mortgages in Cassel
Real Estate and Mortgage Overview in Cassel
| Characteristic | Without Mortgage | With Mortgage |
| Housing Units | 30 | 38 |
| Median Property Value | - | - |
| Median Household Income | - | - |
| Monthly Housing Costs | - | - |
| Real Estate Taxes | - | - |
Property Value by Mortgage Status in Cassel
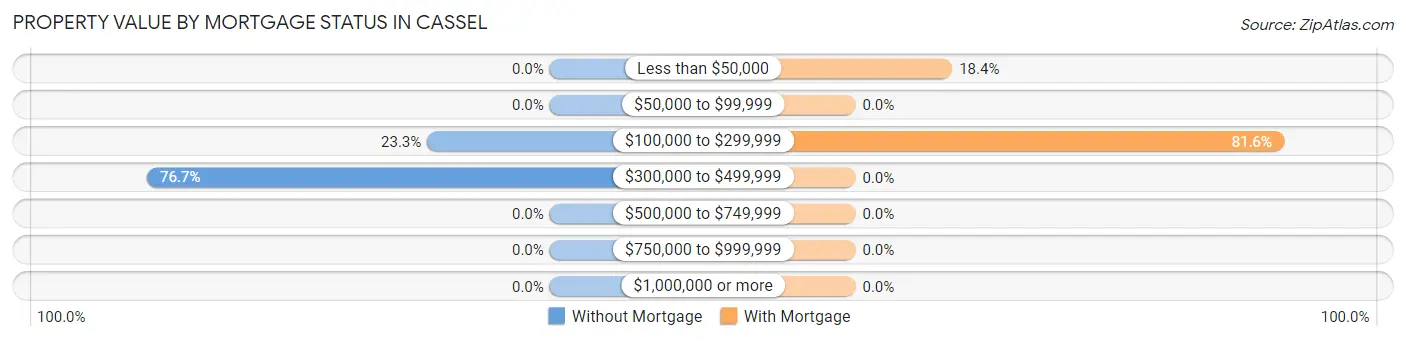
| Property Value | Without Mortgage | With Mortgage |
| Less than $50,000 | 0 (0.0%) | 7 (18.4%) |
| $50,000 to $99,999 | 0 (0.0%) | 0 (0.0%) |
| $100,000 to $299,999 | 7 (23.3%) | 31 (81.6%) |
| $300,000 to $499,999 | 23 (76.7%) | 0 (0.0%) |
| $500,000 to $749,999 | 0 (0.0%) | 0 (0.0%) |
| $750,000 to $999,999 | 0 (0.0%) | 0 (0.0%) |
| $1,000,000 or more | 0 (0.0%) | 0 (0.0%) |
| Total | 30 (100.0%) | 38 (100.0%) |
Household Income by Mortgage Status in Cassel
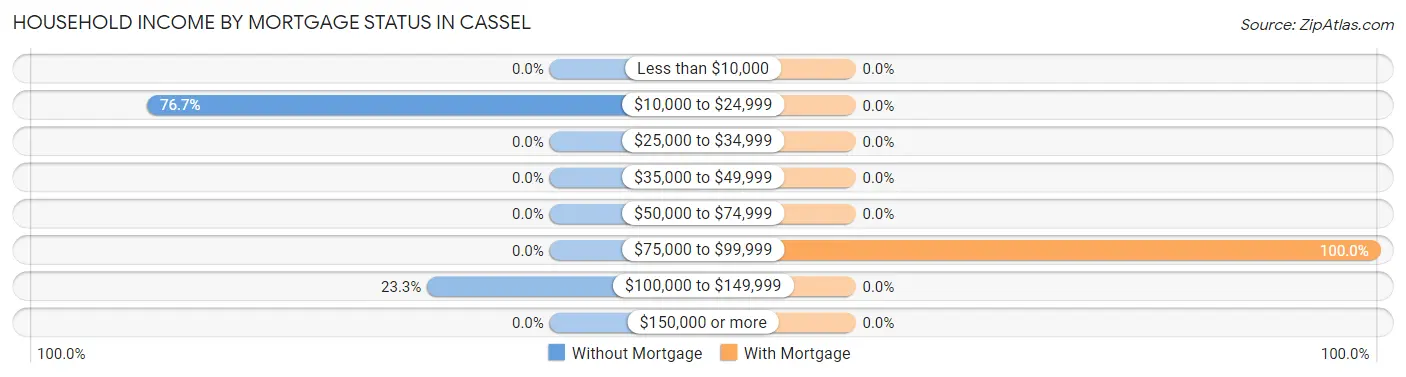
| Household Income | Without Mortgage | With Mortgage |
| Less than $10,000 | 0 (0.0%) | 0 (0.0%) |
| $10,000 to $24,999 | 23 (76.7%) | 0 (0.0%) |
| $25,000 to $34,999 | 0 (0.0%) | 0 (0.0%) |
| $35,000 to $49,999 | 0 (0.0%) | 0 (0.0%) |
| $50,000 to $74,999 | 0 (0.0%) | 0 (0.0%) |
| $75,000 to $99,999 | 0 (0.0%) | 38 (100.0%) |
| $100,000 to $149,999 | 7 (23.3%) | 0 (0.0%) |
| $150,000 or more | 0 (0.0%) | 0 (0.0%) |
| Total | 30 (100.0%) | 38 (100.0%) |
Property Value to Household Income Ratio in Cassel
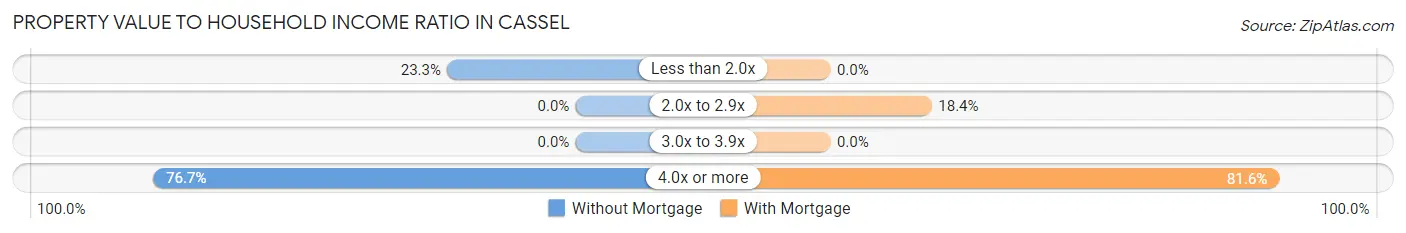
| Value-to-Income Ratio | Without Mortgage | With Mortgage |
| Less than 2.0x | 7 (23.3%) | 0 (0.0%) |
| 2.0x to 2.9x | 0 (0.0%) | 7 (18.4%) |
| 3.0x to 3.9x | 0 (0.0%) | 0 (0.0%) |
| 4.0x or more | 23 (76.7%) | 31 (81.6%) |
| Total | 30 (100.0%) | 38 (100.0%) |
Real Estate Taxes by Mortgage Status in Cassel
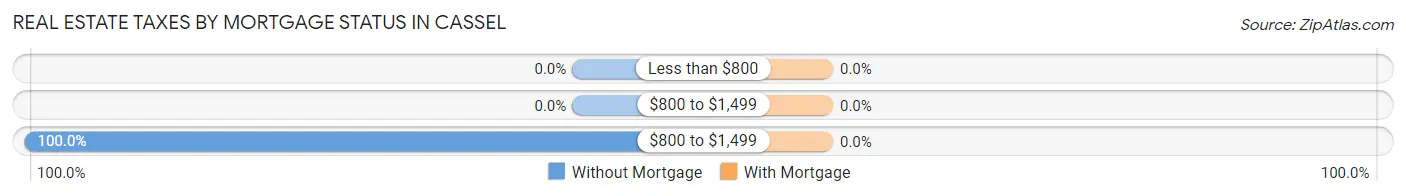
| Property Taxes | Without Mortgage | With Mortgage |
| Less than $800 | 0 (0.0%) | 0 (0.0%) |
| $800 to $1,499 | 0 (0.0%) | 0 (0.0%) |
| $800 to $1,499 | 30 (100.0%) | 0 (0.0%) |
| Total | 30 (100.0%) | 38 (100.0%) |
Health & Disability in Cassel
Health Insurance Coverage by Age in Cassel
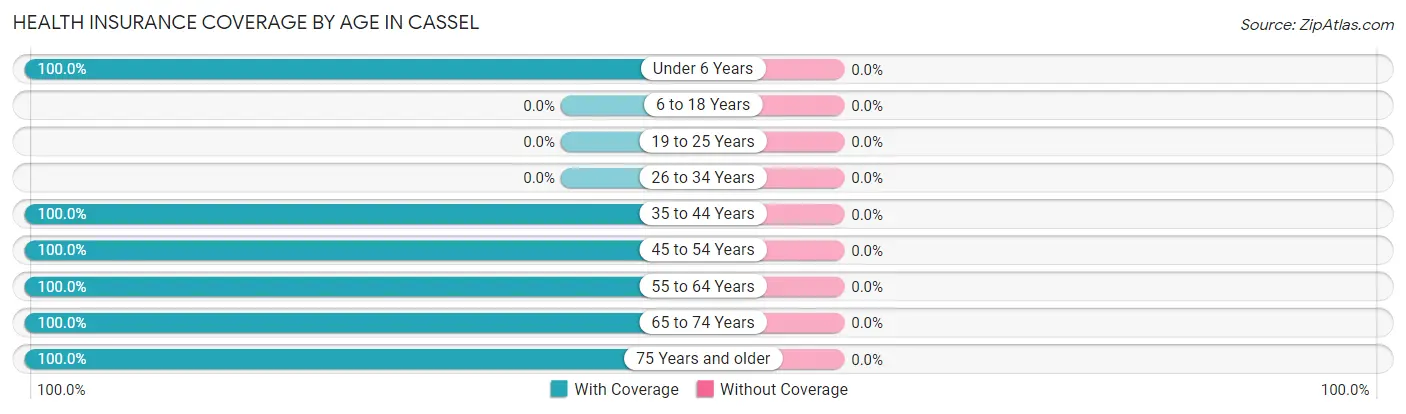
| Age Bracket | With Coverage | Without Coverage |
| Under 6 Years | 57 (100.0%) | 0 (0.0%) |
| 6 to 18 Years | 0 (0.0%) | 0 (0.0%) |
| 19 to 25 Years | 0 (0.0%) | 0 (0.0%) |
| 26 to 34 Years | 0 (0.0%) | 0 (0.0%) |
| 35 to 44 Years | 58 (100.0%) | 0 (0.0%) |
| 45 to 54 Years | 7 (100.0%) | 0 (0.0%) |
| 55 to 64 Years | 7 (100.0%) | 0 (0.0%) |
| 65 to 74 Years | 76 (100.0%) | 0 (0.0%) |
| 75 Years and older | 23 (100.0%) | 0 (0.0%) |
| Total | 228 (100.0%) | 0 (0.0%) |
Health Insurance Coverage by Citizenship Status in Cassel
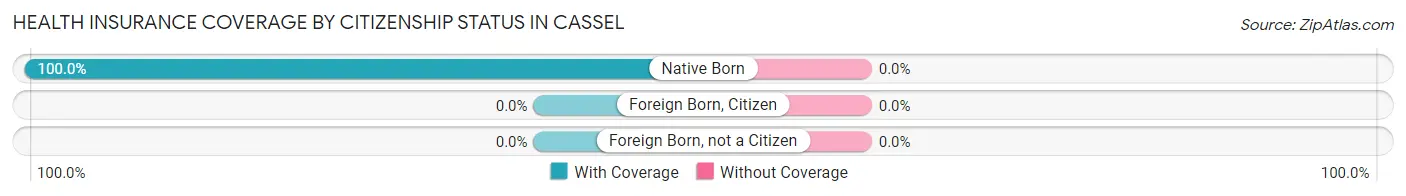
| Citizenship Status | With Coverage | Without Coverage |
| Native Born | 57 (100.0%) | 0 (0.0%) |
| Foreign Born, Citizen | 0 (0.0%) | 0 (0.0%) |
| Foreign Born, not a Citizen | 0 (0.0%) | 0 (0.0%) |
Health Insurance Coverage by Household Income in Cassel
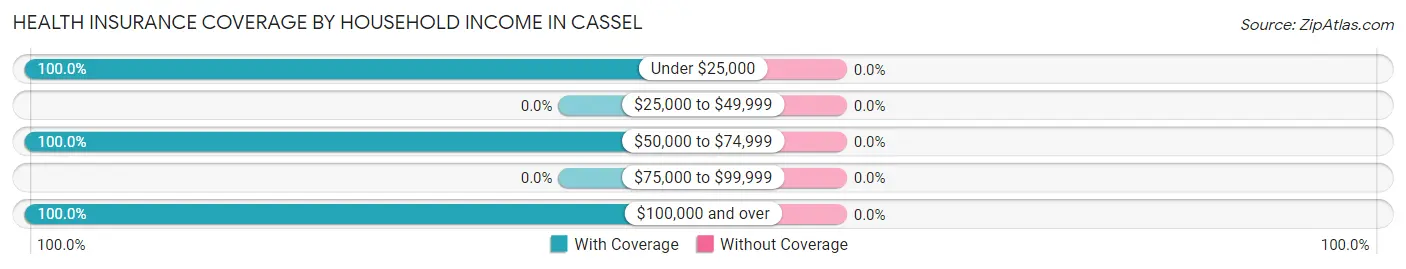
| Household Income | With Coverage | Without Coverage |
| Under $25,000 | 138 (100.0%) | 0 (0.0%) |
| $25,000 to $49,999 | 0 (0.0%) | 0 (0.0%) |
| $50,000 to $74,999 | 76 (100.0%) | 0 (0.0%) |
| $75,000 to $99,999 | 0 (0.0%) | 0 (0.0%) |
| $100,000 and over | 14 (100.0%) | 0 (0.0%) |
Public vs Private Health Insurance Coverage by Age in Cassel
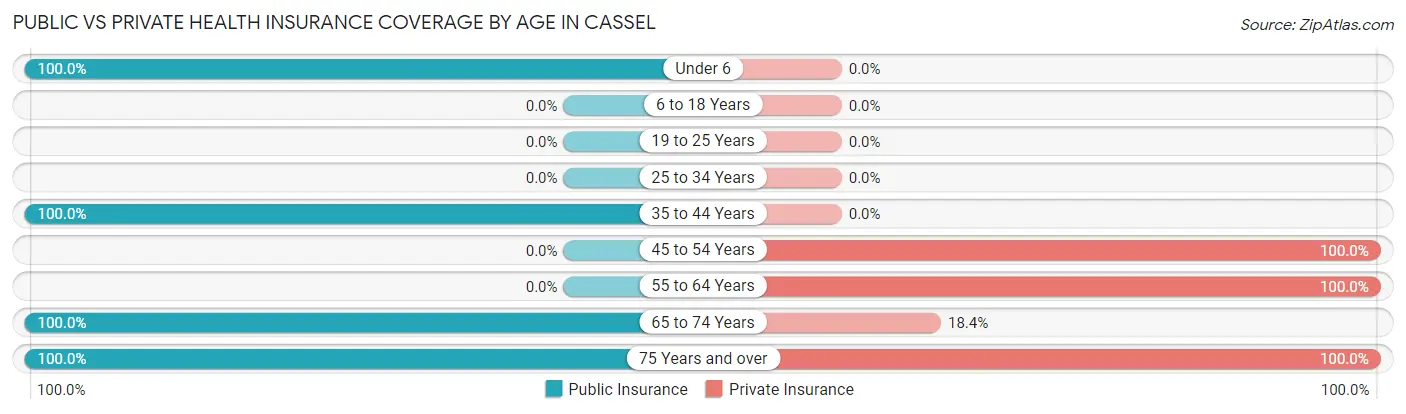
| Age Bracket | Public Insurance | Private Insurance |
| Under 6 | 57 (100.0%) | 0 (0.0%) |
| 6 to 18 Years | 0 (0.0%) | 0 (0.0%) |
| 19 to 25 Years | 0 (0.0%) | 0 (0.0%) |
| 25 to 34 Years | 0 (0.0%) | 0 (0.0%) |
| 35 to 44 Years | 58 (100.0%) | 0 (0.0%) |
| 45 to 54 Years | 0 (0.0%) | 7 (100.0%) |
| 55 to 64 Years | 0 (0.0%) | 7 (100.0%) |
| 65 to 74 Years | 76 (100.0%) | 14 (18.4%) |
| 75 Years and over | 23 (100.0%) | 23 (100.0%) |
| Total | 214 (93.9%) | 51 (22.4%) |
Disability Status by Sex by Age in Cassel
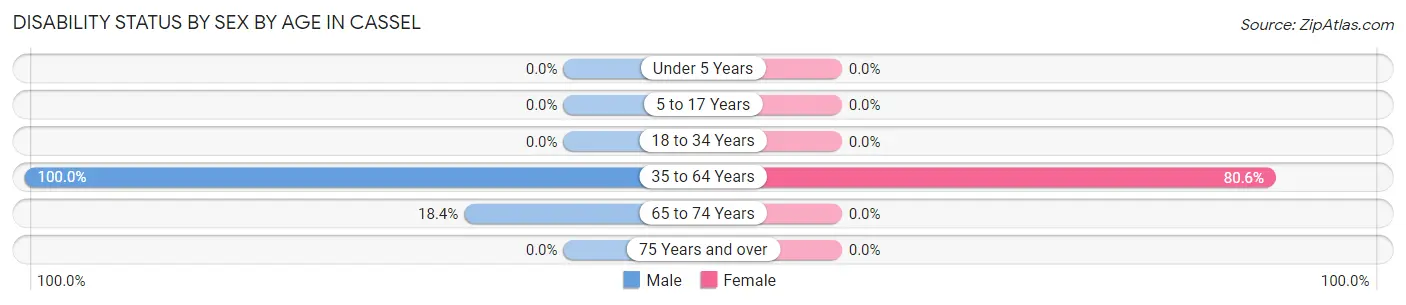
| Age Bracket | Male | Female |
| Under 5 Years | 0 (0.0%) | 0 (0.0%) |
| 5 to 17 Years | 0 (0.0%) | 0 (0.0%) |
| 18 to 34 Years | 0 (0.0%) | 0 (0.0%) |
| 35 to 64 Years | 36 (100.0%) | 29 (80.6%) |
| 65 to 74 Years | 7 (18.4%) | 0 (0.0%) |
| 75 Years and over | 0 (0.0%) | 0 (0.0%) |
Disability Class by Sex by Age in Cassel
Disability Class: Hearing Difficulty
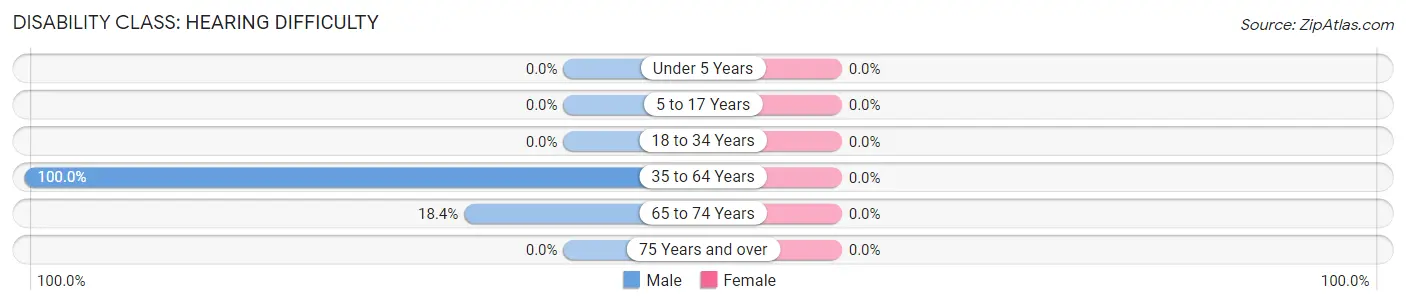
| Age Bracket | Male | Female |
| Under 5 Years | 0 (0.0%) | 0 (0.0%) |
| 5 to 17 Years | 0 (0.0%) | 0 (0.0%) |
| 18 to 34 Years | 0 (0.0%) | 0 (0.0%) |
| 35 to 64 Years | 36 (100.0%) | 0 (0.0%) |
| 65 to 74 Years | 7 (18.4%) | 0 (0.0%) |
| 75 Years and over | 0 (0.0%) | 0 (0.0%) |
Disability Class: Vision Difficulty
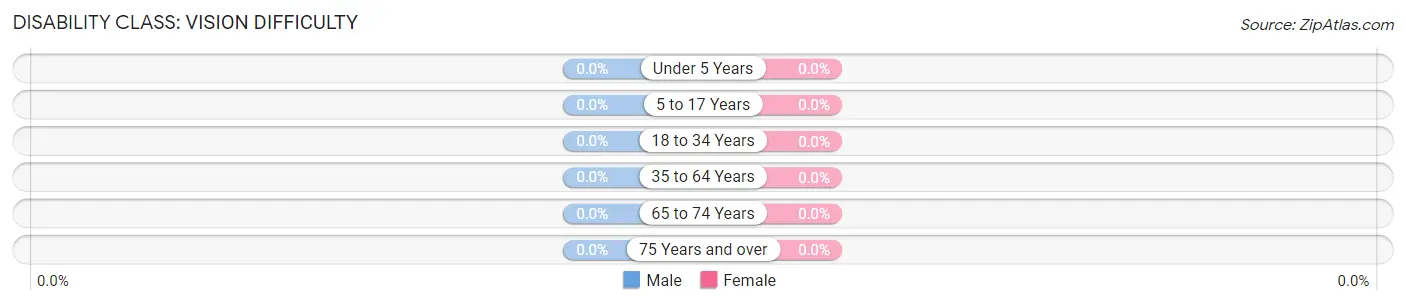
| Age Bracket | Male | Female |
| Under 5 Years | 0 (0.0%) | 0 (0.0%) |
| 5 to 17 Years | 0 (0.0%) | 0 (0.0%) |
| 18 to 34 Years | 0 (0.0%) | 0 (0.0%) |
| 35 to 64 Years | 0 (0.0%) | 0 (0.0%) |
| 65 to 74 Years | 0 (0.0%) | 0 (0.0%) |
| 75 Years and over | 0 (0.0%) | 0 (0.0%) |
Disability Class: Cognitive Difficulty
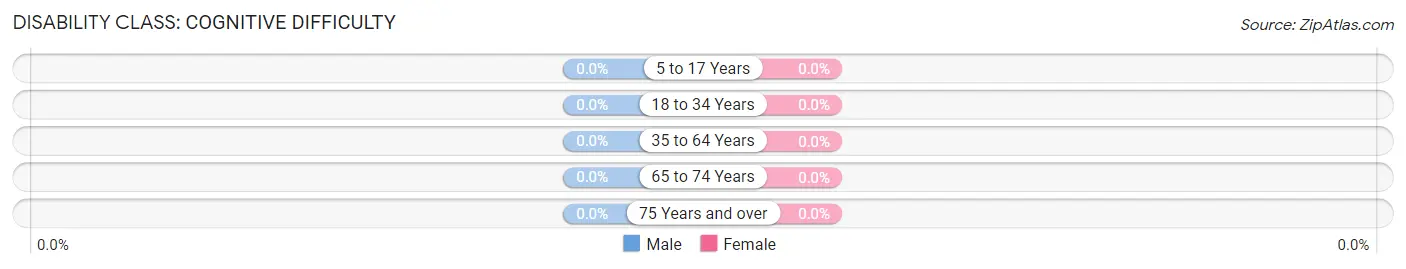
| Age Bracket | Male | Female |
| 5 to 17 Years | 0 (0.0%) | 0 (0.0%) |
| 18 to 34 Years | 0 (0.0%) | 0 (0.0%) |
| 35 to 64 Years | 0 (0.0%) | 0 (0.0%) |
| 65 to 74 Years | 0 (0.0%) | 0 (0.0%) |
| 75 Years and over | 0 (0.0%) | 0 (0.0%) |
Disability Class: Ambulatory Difficulty
| Age Bracket | Male | Female |
| 5 to 17 Years | 0 (0.0%) | 0 (0.0%) |
| 18 to 34 Years | 0 (0.0%) | 0 (0.0%) |
| 35 to 64 Years | 0 (0.0%) | 0 (0.0%) |
| 65 to 74 Years | 0 (0.0%) | 0 (0.0%) |
| 75 Years and over | 0 (0.0%) | 0 (0.0%) |
Disability Class: Self-Care Difficulty
| Age Bracket | Male | Female |
| 5 to 17 Years | 0 (0.0%) | 0 (0.0%) |
| 18 to 34 Years | 0 (0.0%) | 0 (0.0%) |
| 35 to 64 Years | 0 (0.0%) | 0 (0.0%) |
| 65 to 74 Years | 0 (0.0%) | 0 (0.0%) |
| 75 Years and over | 0 (0.0%) | 0 (0.0%) |
Technology Access in Cassel
Computing Device Access in Cassel
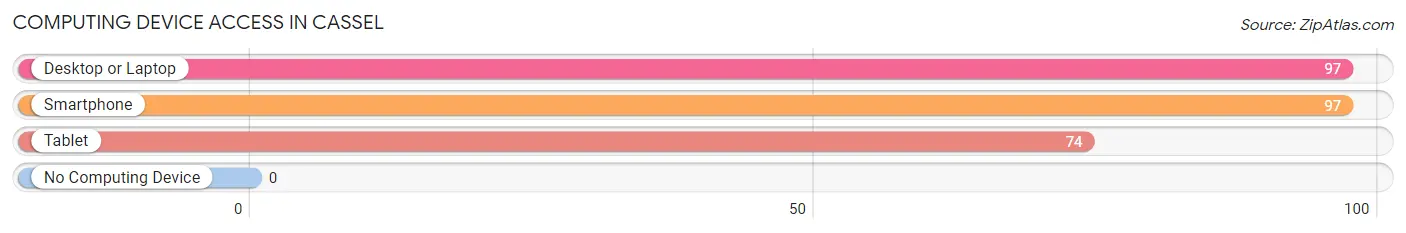
| Device Type | # Households | % Households |
| Desktop or Laptop | 97 | 100.0% |
| Smartphone | 97 | 100.0% |
| Tablet | 74 | 76.3% |
| No Computing Device | 0 | 0.0% |
| Total | 97 | 100.0% |
Internet Access in Cassel
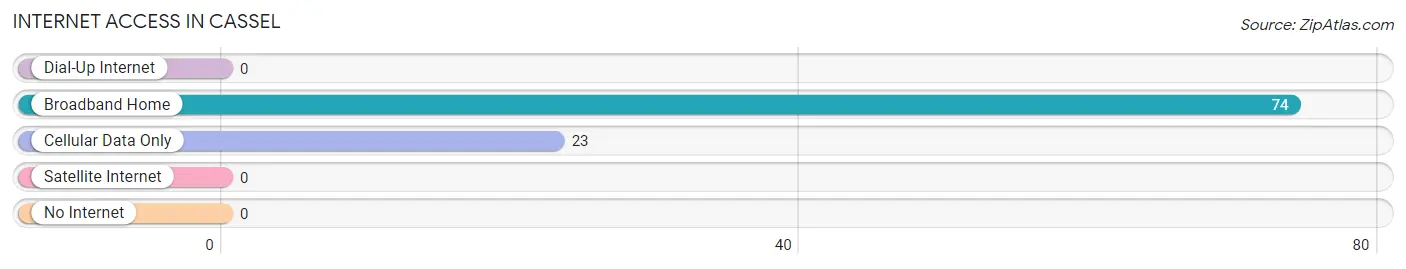
| Internet Type | # Households | % Households |
| Dial-Up Internet | 0 | 0.0% |
| Broadband Home | 74 | 76.3% |
| Cellular Data Only | 23 | 23.7% |
| Satellite Internet | 0 | 0.0% |
| No Internet | 0 | 0.0% |
| Total | 97 | 100.0% |
Cassel Summary
Cassel is a small unincorporated community located in Shasta County, California. It is situated in the Cascade Range, approximately 8 miles east of the city of Redding. The population of Cassel was estimated to be around 200 people in 2020.
History
Cassel was first settled in the late 1800s by miners and loggers who were attracted to the area by the abundance of timber and gold. The town was named after a local miner, John Cassel, who discovered gold in the area in 1852. The town was officially established in 1854 and quickly grew to become a bustling mining and logging community.
In the early 1900s, Cassel was a popular destination for tourists who wanted to experience the beauty of the Cascade Range. The town was home to several hotels, restaurants, and stores. In the 1920s, Cassel was also home to a movie theater, which was the first in the area.
In the 1950s, Cassel began to decline as the mining and logging industries moved away from the area. The town was eventually abandoned in the 1970s. In the 1980s, the town was revitalized by a group of local residents who wanted to preserve the town’s history and culture.
Geography
Cassel is located in the Cascade Range, approximately 8 miles east of the city of Redding. The town is situated at an elevation of 2,400 feet and is surrounded by the Shasta-Trinity National Forest. The town is located in a valley surrounded by mountains, including Mount Shasta, which is the second highest peak in the Cascade Range.
The climate in Cassel is mild and temperate, with hot summers and cold winters. The average annual temperature is around 50 degrees Fahrenheit. The town receives an average of 20 inches of precipitation per year, mostly in the form of snow in the winter months.
Economy
The economy of Cassel is largely based on tourism. The town is a popular destination for outdoor enthusiasts who come to enjoy the beauty of the Cascade Range. The town is also home to several small businesses, including restaurants, stores, and a movie theater.
Demographics
The population of Cassel was estimated to be around 200 people in 2020. The town is predominantly white, with a small Hispanic population. The median household income in Cassel is around $50,000, which is slightly lower than the national average. The town has a low unemployment rate and a high rate of homeownership.
Common Questions
What is Per Capita Income in Cassel?
Per Capita income in Cassel is $14,801.
What is Inequality or Gini Index in Cassel?
Inequality or Gini Index in Cassel is 0.47.
What is the Total Population of Cassel?
Total Population of Cassel is 228.
What is the Total Male Population of Cassel?
Total Male Population of Cassel is 131.
What is the Total Female Population of Cassel?
Total Female Population of Cassel is 97.
What is the Ratio of Males per 100 Females in Cassel?
There are 135.05 Males per 100 Females in Cassel.
What is the Ratio of Females per 100 Males in Cassel?
There are 74.05 Females per 100 Males in Cassel.
What is the Median Population Age in Cassel?
Median Population Age in Cassel is 41.0 Years.
What is the Average Family Size in Cassel
Average Family Size in Cassel is 2.4 People.
What is the Average Household Size in Cassel
Average Household Size in Cassel is 2.4 People.
How Large is the Labor Force in Cassel?
There are 43 People in the Labor Forcein in Cassel.
What is the Percentage of People in the Labor Force in Cassel?
25.1% of People are in the Labor Force in Cassel.