Woodville, CA Map & Demographics
Woodville Map
Woodville Overview
$14,039
PER CAPITA INCOME
$39,406
AVG FAMILY INCOME
$38,750
AVG HOUSEHOLD INCOME
49.8%
WAGE / INCOME GAP [ % ]
50.2¢/ $1
WAGE / INCOME GAP [ $ ]
0.42
INEQUALITY / GINI INDEX
1,830
TOTAL POPULATION
872
MALE POPULATION
958
FEMALE POPULATION
91.02
MALES / 100 FEMALES
109.86
FEMALES / 100 MALES
26.7
MEDIAN AGE
4.5
AVG FAMILY SIZE
4.2
AVG HOUSEHOLD SIZE
789
LABOR FORCE [ PEOPLE ]
59.2%
PERCENT IN LABOR FORCE
11.3%
UNEMPLOYMENT RATE
Woodville Area Codes
Income in Woodville
Income Overview in Woodville
Per Capita Income in Woodville is $14,039, while median incomes of families and households are $39,406 and $38,750 respectively.
| Characteristic | Number | Measure |
| Per Capita Income | 1,830 | $14,039 |
| Median Family Income | 377 | $39,406 |
| Mean Family Income | 377 | $54,957 |
| Median Household Income | 438 | $38,750 |
| Mean Household Income | 438 | $53,626 |
| Income Deficit | 377 | $0 |
| Wage / Income Gap (%) | 1,830 | 49.75% |
| Wage / Income Gap ($) | 1,830 | 50.25¢ per $1 |
| Gini / Inequality Index | 1,830 | 0.42 |
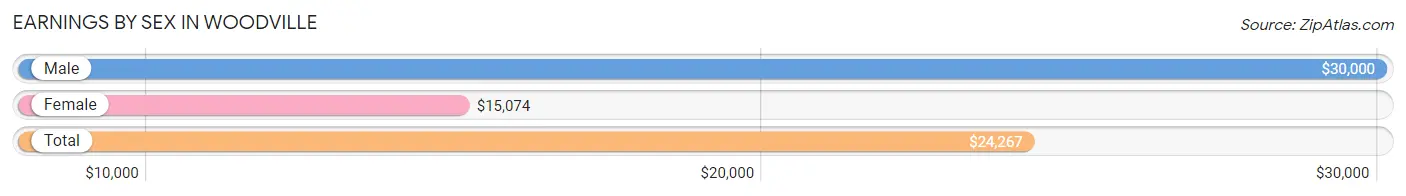
Earnings by Sex in Woodville
Average Earnings in Woodville are $24,267, $30,000 for men and $15,074 for women, a difference of 49.7%.
| Sex | Number | Average Earnings |
| Male | 514 (66.3%) | $30,000 |
| Female | 261 (33.7%) | $15,074 |
| Total | 775 (100.0%) | $24,267 |
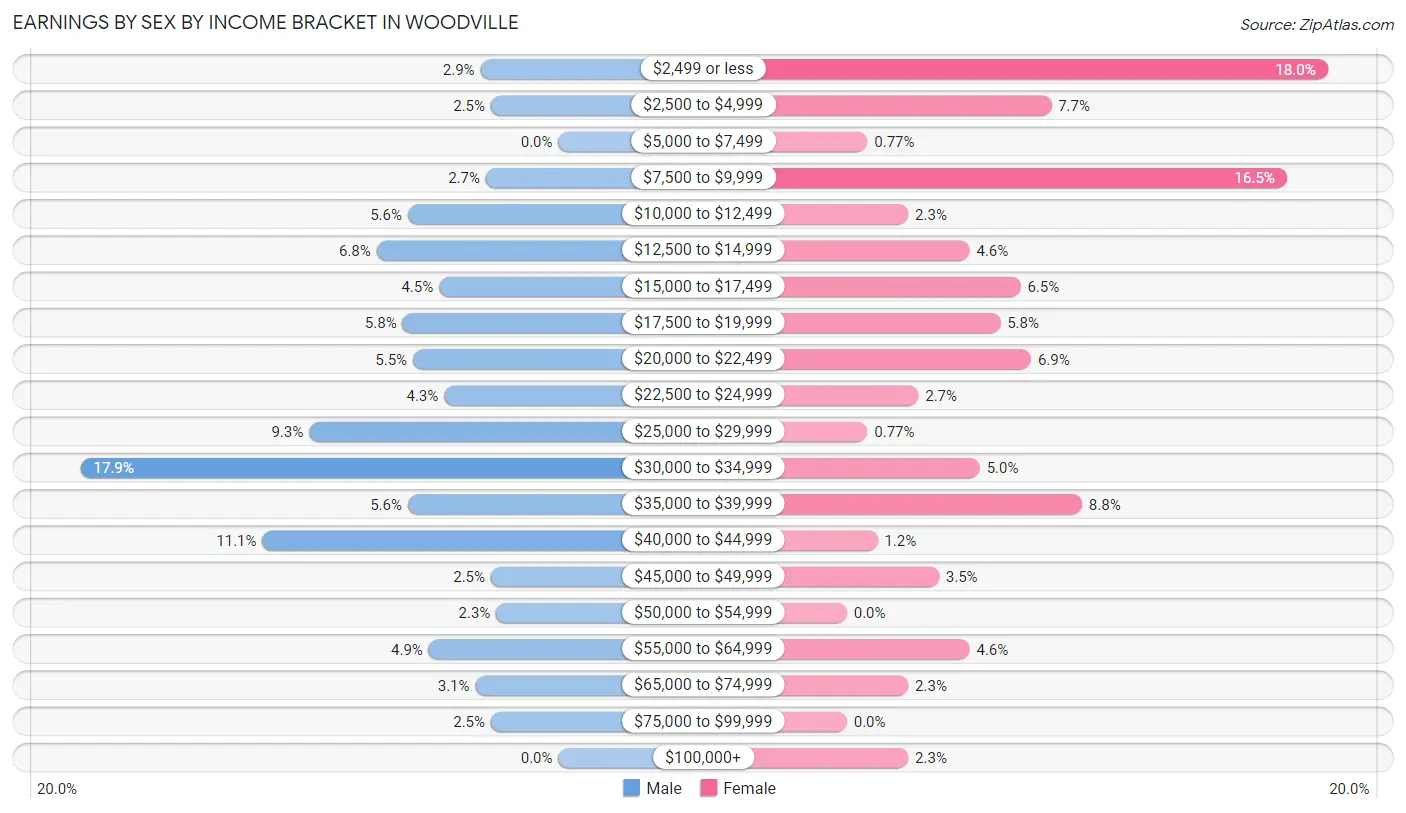
Earnings by Sex by Income Bracket in Woodville
The most common earnings brackets in Woodville are $30,000 to $34,999 for men (92 | 17.9%) and $2,499 or less for women (47 | 18.0%).
| Income | Male | Female |
| $2,499 or less | 15 (2.9%) | 47 (18.0%) |
| $2,500 to $4,999 | 13 (2.5%) | 20 (7.7%) |
| $5,000 to $7,499 | 0 (0.0%) | 2 (0.8%) |
| $7,500 to $9,999 | 14 (2.7%) | 43 (16.5%) |
| $10,000 to $12,499 | 29 (5.6%) | 6 (2.3%) |
| $12,500 to $14,999 | 35 (6.8%) | 12 (4.6%) |
| $15,000 to $17,499 | 23 (4.5%) | 17 (6.5%) |
| $17,500 to $19,999 | 30 (5.8%) | 15 (5.8%) |
| $20,000 to $22,499 | 28 (5.4%) | 18 (6.9%) |
| $22,500 to $24,999 | 22 (4.3%) | 7 (2.7%) |
| $25,000 to $29,999 | 48 (9.3%) | 2 (0.8%) |
| $30,000 to $34,999 | 92 (17.9%) | 13 (5.0%) |
| $35,000 to $39,999 | 29 (5.6%) | 23 (8.8%) |
| $40,000 to $44,999 | 57 (11.1%) | 3 (1.1%) |
| $45,000 to $49,999 | 13 (2.5%) | 9 (3.5%) |
| $50,000 to $54,999 | 12 (2.3%) | 0 (0.0%) |
| $55,000 to $64,999 | 25 (4.9%) | 12 (4.6%) |
| $65,000 to $74,999 | 16 (3.1%) | 6 (2.3%) |
| $75,000 to $99,999 | 13 (2.5%) | 0 (0.0%) |
| $100,000+ | 0 (0.0%) | 6 (2.3%) |
| Total | 514 (100.0%) | 261 (100.0%) |
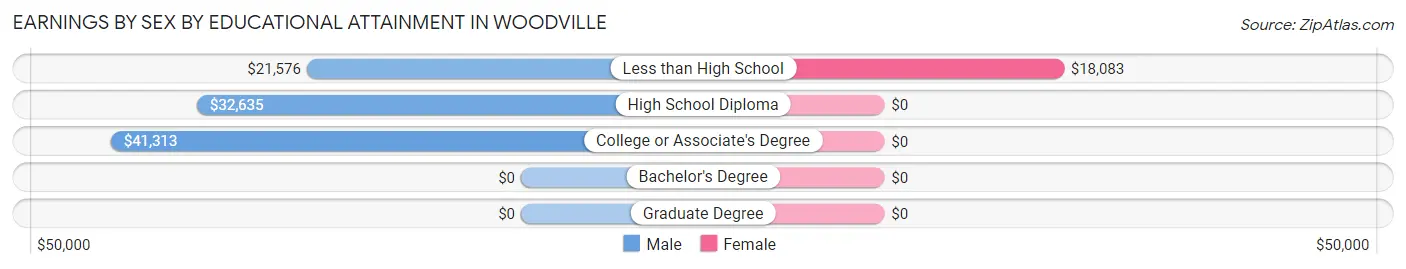
Earnings by Sex by Educational Attainment in Woodville
Average earnings in Woodville are $30,744 for men and $16,912 for women, a difference of 45.0%. Men with an educational attainment of college or associate's degree enjoy the highest average annual earnings of $41,313, while those with less than high school education earn the least with $21,576. Women with an educational attainment of less than high school earn the most with the average annual earnings of $18,083, while those with less than high school education have the smallest earnings of $18,083.
| Educational Attainment | Male Income | Female Income |
| Less than High School | $21,576 | $18,083 |
| High School Diploma | $32,635 | $0 |
| College or Associate's Degree | $41,313 | $0 |
| Bachelor's Degree | - | - |
| Graduate Degree | - | - |
| Total | $30,744 | $16,912 |
Family Income in Woodville
Family Income Brackets in Woodville
According to the Woodville family income data, there are 90 families falling into the $35,000 to $49,999 income range, which is the most common income bracket and makes up 23.9% of all families.
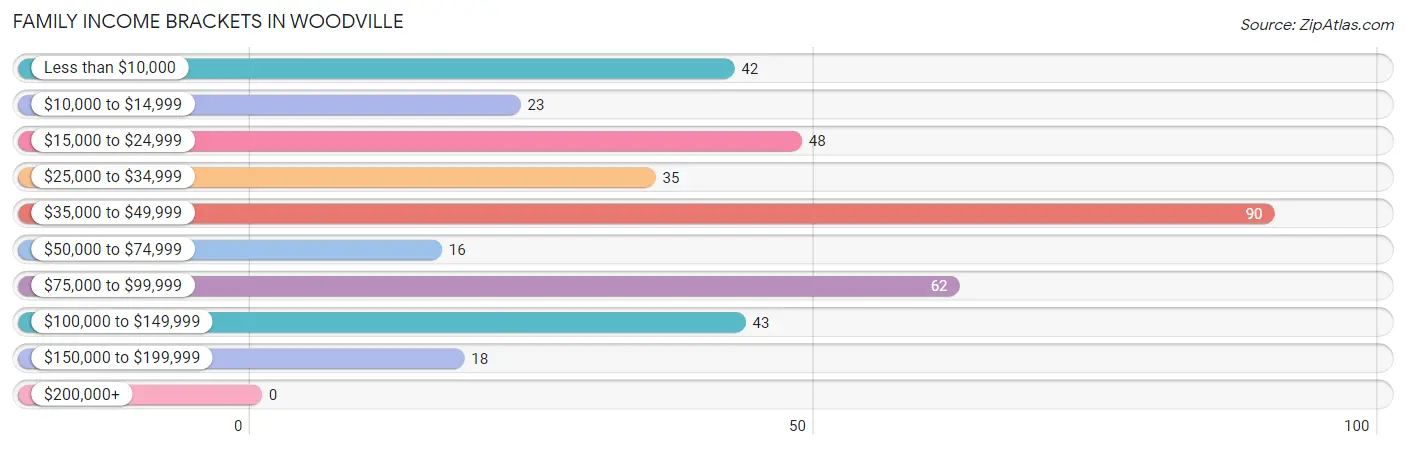
| Income Bracket | # Families | % Families |
| Less than $10,000 | 42 | 11.1% |
| $10,000 to $14,999 | 23 | 6.1% |
| $15,000 to $24,999 | 48 | 12.7% |
| $25,000 to $34,999 | 35 | 9.3% |
| $35,000 to $49,999 | 90 | 23.9% |
| $50,000 to $74,999 | 16 | 4.2% |
| $75,000 to $99,999 | 62 | 16.4% |
| $100,000 to $149,999 | 43 | 11.4% |
| $150,000 to $199,999 | 18 | 4.8% |
| $200,000+ | 0 | 0.0% |
Family Income by Famaliy Size in Woodville
4-person families (101 | 26.8%) account for the highest median family income in Woodville with $53,750 per family, while 3-person families (48 | 12.7%) have the highest median income of $16,042 per family member.
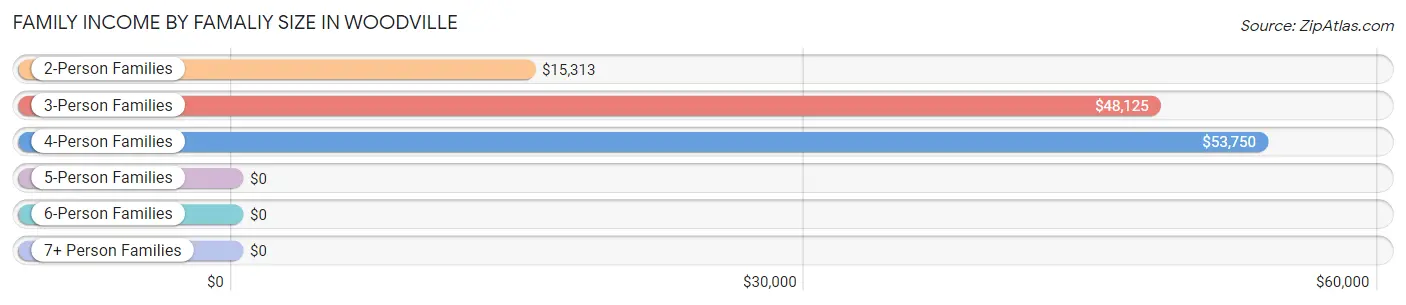
| Income Bracket | # Families | Median Income |
| 2-Person Families | 83 (22.0%) | $15,313 |
| 3-Person Families | 48 (12.7%) | $48,125 |
| 4-Person Families | 101 (26.8%) | $53,750 |
| 5-Person Families | 65 (17.2%) | $0 |
| 6-Person Families | 58 (15.4%) | $0 |
| 7+ Person Families | 22 (5.8%) | $0 |
| Total | 377 (100.0%) | $39,406 |
Family Income by Number of Earners in Woodville
The median family income in Woodville is $39,406, with families comprising 3+ earners (65) having the highest median family income of $113,750, while families with no earners (44) have the lowest median family income of $18,269, accounting for 17.2% and 11.7% of families, respectively.
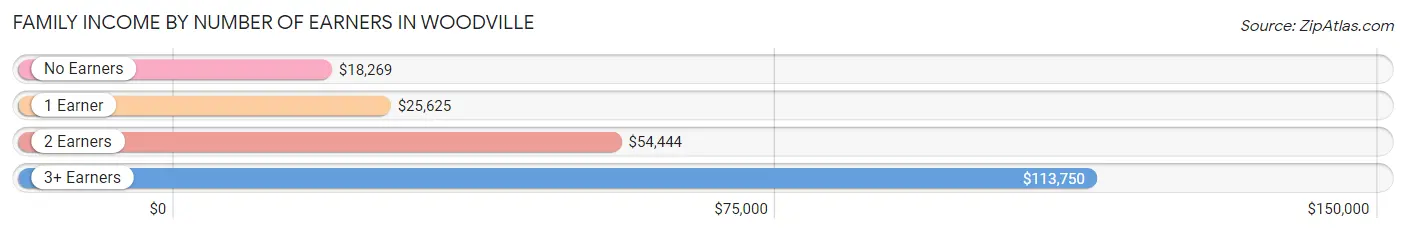
| Number of Earners | # Families | Median Income |
| No Earners | 44 (11.7%) | $18,269 |
| 1 Earner | 160 (42.4%) | $25,625 |
| 2 Earners | 108 (28.6%) | $54,444 |
| 3+ Earners | 65 (17.2%) | $113,750 |
| Total | 377 (100.0%) | $39,406 |
Household Income in Woodville
Household Income Brackets in Woodville
With 99 households falling in the category, the $35,000 to $49,999 income range is the most frequent in Woodville, accounting for 22.6% of all households.
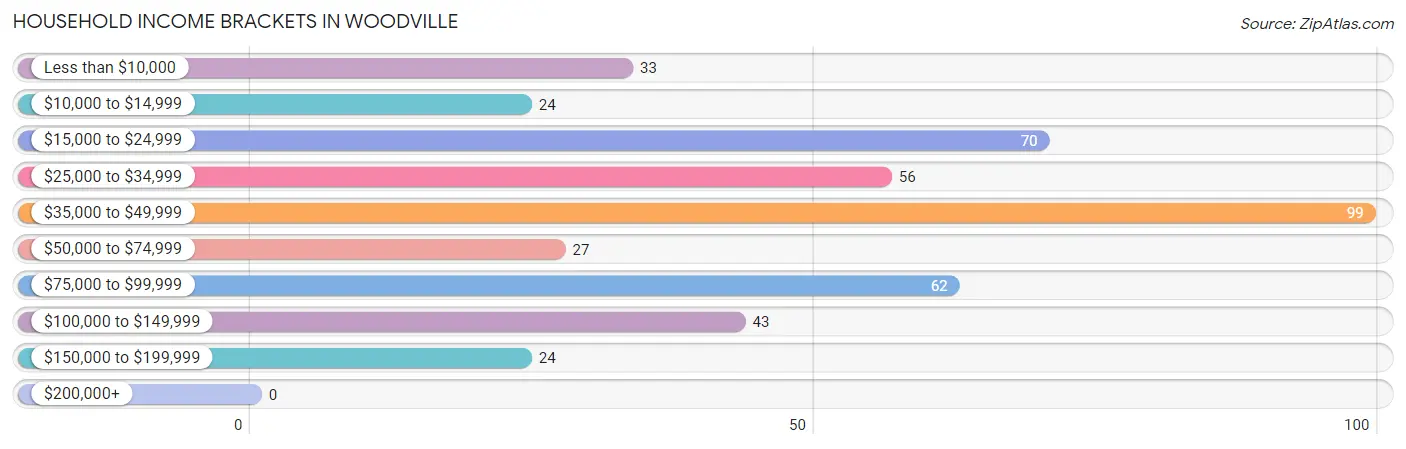
| Income Bracket | # Households | % Households |
| Less than $10,000 | 33 | 7.5% |
| $10,000 to $14,999 | 24 | 5.5% |
| $15,000 to $24,999 | 70 | 16.0% |
| $25,000 to $34,999 | 56 | 12.8% |
| $35,000 to $49,999 | 99 | 22.6% |
| $50,000 to $74,999 | 27 | 6.2% |
| $75,000 to $99,999 | 62 | 14.2% |
| $100,000 to $149,999 | 43 | 9.8% |
| $150,000 to $199,999 | 24 | 5.5% |
| $200,000+ | 0 | 0.0% |
Household Income by Householder Age in Woodville
The median household income in Woodville is $38,750, with the highest median household income of $49,375 found in the 65+ years age bracket for the primary householder. A total of 58 households (13.2%) fall into this category. Meanwhile, the 15 to 24 years age bracket for the primary householder has the lowest median household income of $24,821, with 39 households (8.9%) in this group.
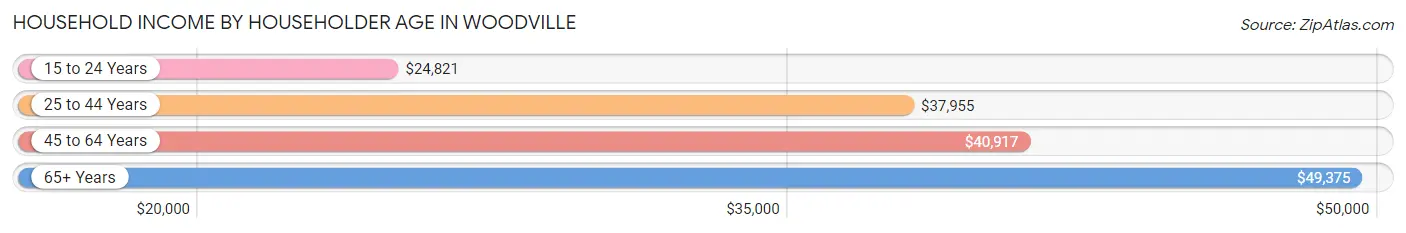
| Income Bracket | # Households | Median Income |
| 15 to 24 Years | 39 (8.9%) | $24,821 |
| 25 to 44 Years | 144 (32.9%) | $37,955 |
| 45 to 64 Years | 197 (45.0%) | $40,917 |
| 65+ Years | 58 (13.2%) | $49,375 |
| Total | 438 (100.0%) | $38,750 |
Poverty in Woodville
Income Below Poverty by Sex and Age in Woodville
With 22.8% poverty level for males and 36.5% for females among the residents of Woodville, under 5 year old males and 15 year old females are the most vulnerable to poverty, with 31 males (53.4%) and 3 females (100.0%) in their respective age groups living below the poverty level.
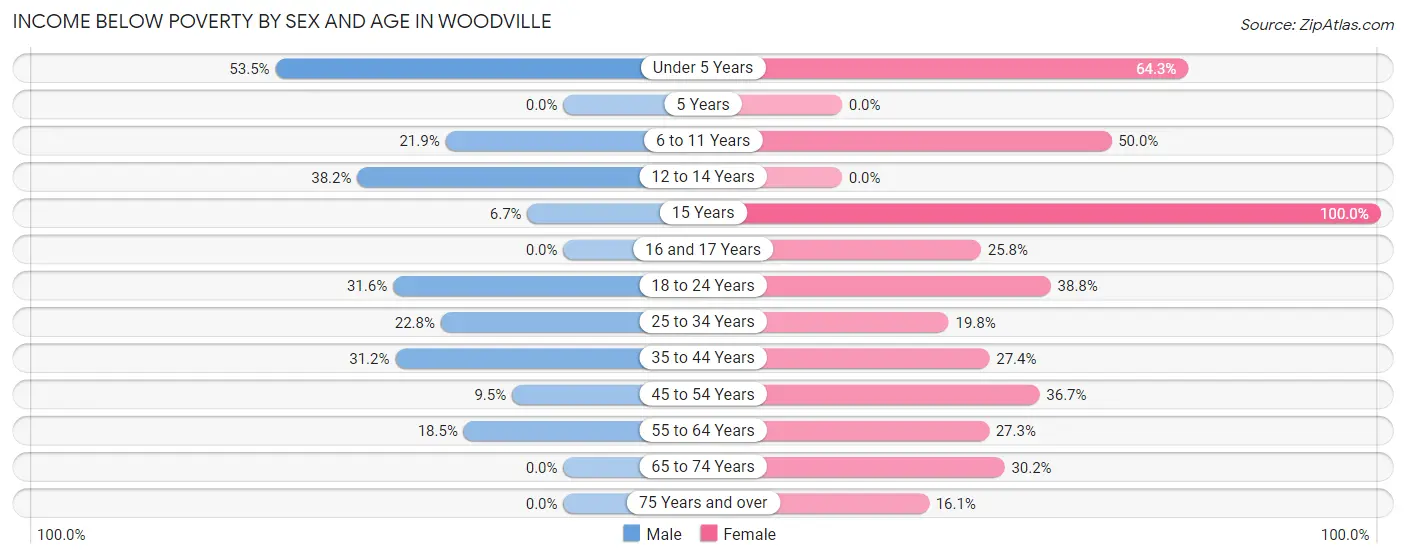
| Age Bracket | Male | Female |
| Under 5 Years | 31 (53.4%) | 81 (64.3%) |
| 5 Years | 0 (0.0%) | 0 (0.0%) |
| 6 to 11 Years | 14 (21.9%) | 71 (50.0%) |
| 12 to 14 Years | 13 (38.2%) | 0 (0.0%) |
| 15 Years | 2 (6.7%) | 3 (100.0%) |
| 16 and 17 Years | 0 (0.0%) | 8 (25.8%) |
| 18 to 24 Years | 37 (31.6%) | 69 (38.8%) |
| 25 to 34 Years | 38 (22.8%) | 22 (19.8%) |
| 35 to 44 Years | 34 (31.2%) | 23 (27.4%) |
| 45 to 54 Years | 8 (9.5%) | 22 (36.7%) |
| 55 to 64 Years | 22 (18.5%) | 30 (27.3%) |
| 65 to 74 Years | 0 (0.0%) | 16 (30.2%) |
| 75 Years and over | 0 (0.0%) | 5 (16.1%) |
| Total | 199 (22.8%) | 350 (36.5%) |
Income Above Poverty by Sex and Age in Woodville
According to the poverty statistics in Woodville, males aged 5 years and females aged 5 years are the age groups that are most secure financially, with 100.0% of males and 100.0% of females in these age groups living above the poverty line.
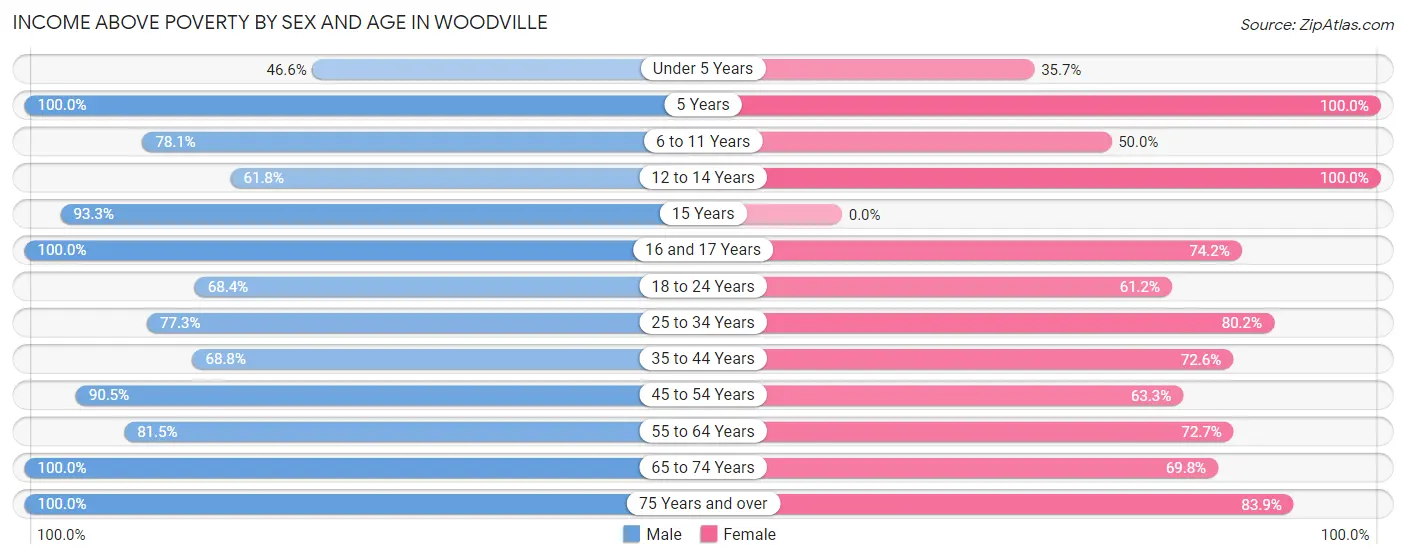
| Age Bracket | Male | Female |
| Under 5 Years | 27 (46.6%) | 45 (35.7%) |
| 5 Years | 12 (100.0%) | 12 (100.0%) |
| 6 to 11 Years | 50 (78.1%) | 71 (50.0%) |
| 12 to 14 Years | 21 (61.8%) | 17 (100.0%) |
| 15 Years | 28 (93.3%) | 0 (0.0%) |
| 16 and 17 Years | 29 (100.0%) | 23 (74.2%) |
| 18 to 24 Years | 80 (68.4%) | 109 (61.2%) |
| 25 to 34 Years | 129 (77.2%) | 89 (80.2%) |
| 35 to 44 Years | 75 (68.8%) | 61 (72.6%) |
| 45 to 54 Years | 76 (90.5%) | 38 (63.3%) |
| 55 to 64 Years | 97 (81.5%) | 80 (72.7%) |
| 65 to 74 Years | 27 (100.0%) | 37 (69.8%) |
| 75 Years and over | 22 (100.0%) | 26 (83.9%) |
| Total | 673 (77.2%) | 608 (63.5%) |
Income Below Poverty Among Married-Couple Families in Woodville
The poverty statistics for married-couple families in Woodville show that 24.6% or 62 of the total 252 families live below the poverty line. Families with 5 or more children have the highest poverty rate of 100.0%, comprising of 10 families. On the other hand, families with 1 or 2 children have the lowest poverty rate of 12.4%, which includes 11 families.
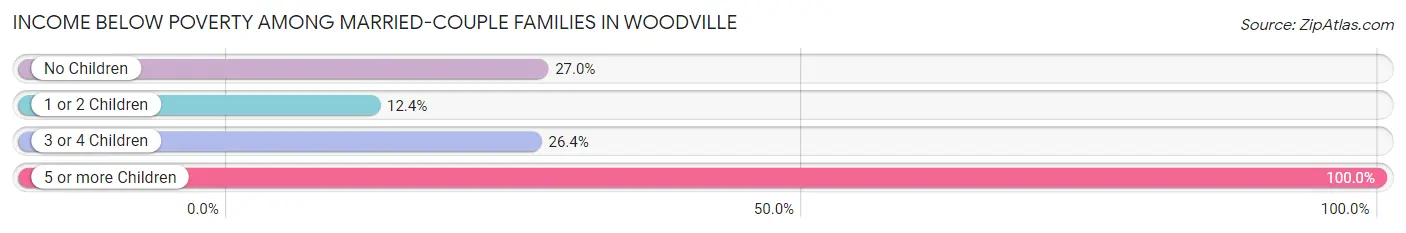
| Children | Above Poverty | Below Poverty |
| No Children | 73 (73.0%) | 27 (27.0%) |
| 1 or 2 Children | 78 (87.6%) | 11 (12.4%) |
| 3 or 4 Children | 39 (73.6%) | 14 (26.4%) |
| 5 or more Children | 0 (0.0%) | 10 (100.0%) |
| Total | 190 (75.4%) | 62 (24.6%) |
Income Below Poverty Among Single-Parent Households in Woodville
According to the poverty data in Woodville, 36.4% or 20 single-father households and 51.4% or 36 single-mother households are living below the poverty line. Among single-father households, those with 1 or 2 children have the highest poverty rate, with 7 households (53.8%) experiencing poverty. Likewise, among single-mother households, those with 3 or 4 children have the highest poverty rate, with 14 households (77.8%) falling below the poverty line.
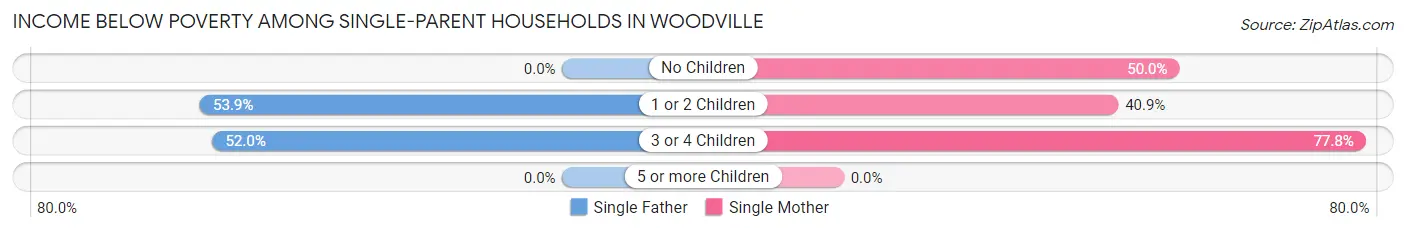
| Children | Single Father | Single Mother |
| No Children | 0 (0.0%) | 4 (50.0%) |
| 1 or 2 Children | 7 (53.8%) | 18 (40.9%) |
| 3 or 4 Children | 13 (52.0%) | 14 (77.8%) |
| 5 or more Children | 0 (0.0%) | 0 (0.0%) |
| Total | 20 (36.4%) | 36 (51.4%) |
Income Below Poverty Among Married-Couple vs Single-Parent Households in Woodville
The poverty data for Woodville shows that 62 of the married-couple family households (24.6%) and 56 of the single-parent households (44.8%) are living below the poverty level. Within the married-couple family households, those with 5 or more children have the highest poverty rate, with 10 households (100.0%) falling below the poverty line. Among the single-parent households, those with 3 or 4 children have the highest poverty rate, with 27 household (62.8%) living below poverty.
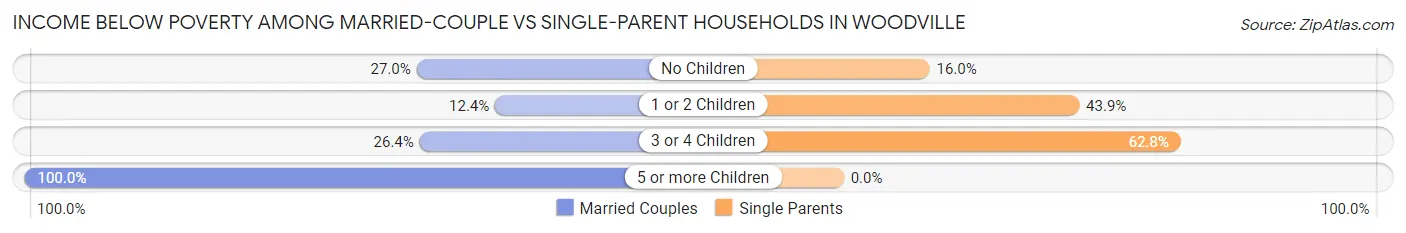
| Children | Married-Couple Families | Single-Parent Households |
| No Children | 27 (27.0%) | 4 (16.0%) |
| 1 or 2 Children | 11 (12.4%) | 25 (43.9%) |
| 3 or 4 Children | 14 (26.4%) | 27 (62.8%) |
| 5 or more Children | 10 (100.0%) | 0 (0.0%) |
| Total | 62 (24.6%) | 56 (44.8%) |
Race in Woodville
The most populous races in Woodville are Hispanic or Latino (1,716 | 93.8%), White / Caucasian (808 | 44.2%), and Some other Race (578 | 31.6%).
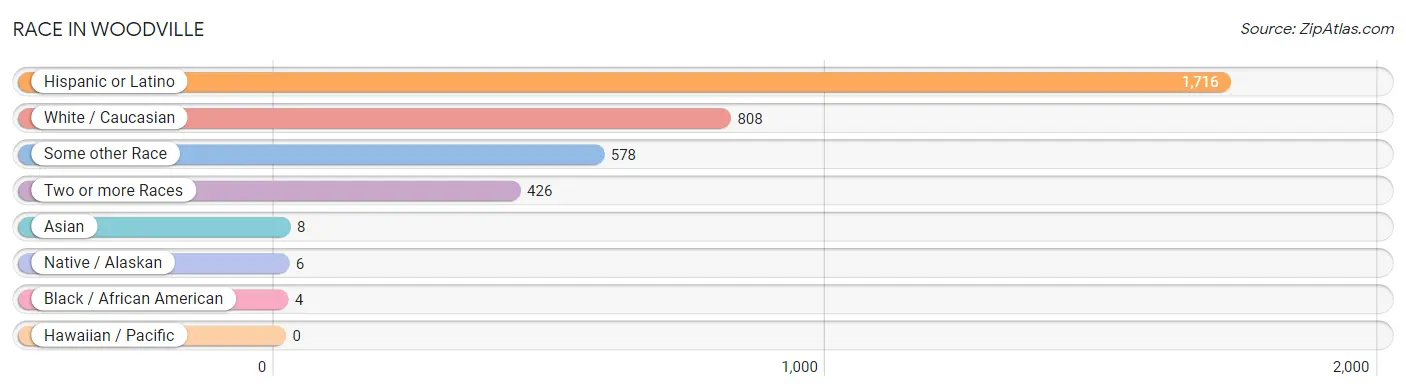
| Race | # Population | % Population |
| Asian | 8 | 0.4% |
| Black / African American | 4 | 0.2% |
| Hawaiian / Pacific | 0 | 0.0% |
| Hispanic or Latino | 1,716 | 93.8% |
| Native / Alaskan | 6 | 0.3% |
| White / Caucasian | 808 | 44.2% |
| Two or more Races | 426 | 23.3% |
| Some other Race | 578 | 31.6% |
| Total | 1,830 | 100.0% |
Ancestry in Woodville
The most populous ancestries reported in Woodville are Mexican (1,629 | 89.0%), Central American (87 | 4.8%), Arab (61 | 3.3%), Honduran (47 | 2.6%), and Salvadoran (40 | 2.2%), together accounting for 101.9% of all Woodville residents.
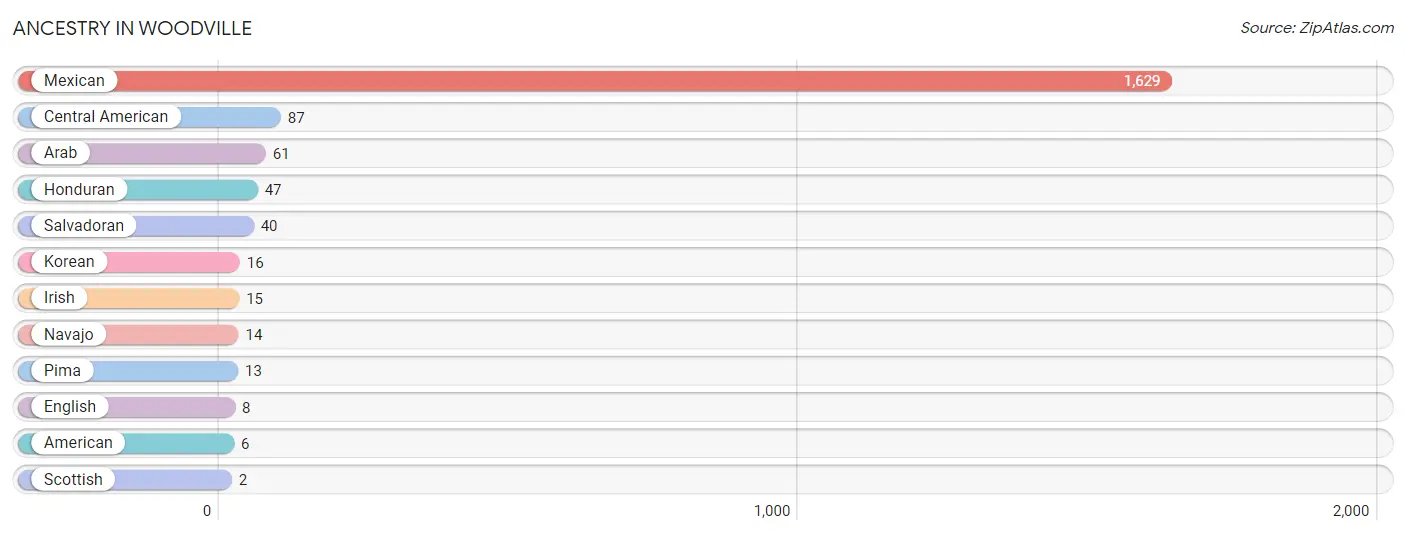
| Ancestry | # Population | % Population |
| American | 6 | 0.3% |
| Arab | 61 | 3.3% |
| Central American | 87 | 4.8% |
| English | 8 | 0.4% |
| Honduran | 47 | 2.6% |
| Irish | 15 | 0.8% |
| Korean | 16 | 0.9% |
| Mexican | 1,629 | 89.0% |
| Navajo | 14 | 0.8% |
| Pima | 13 | 0.7% |
| Salvadoran | 40 | 2.2% |
| Scottish | 2 | 0.1% | View All 12 Rows |
Immigrants in Woodville
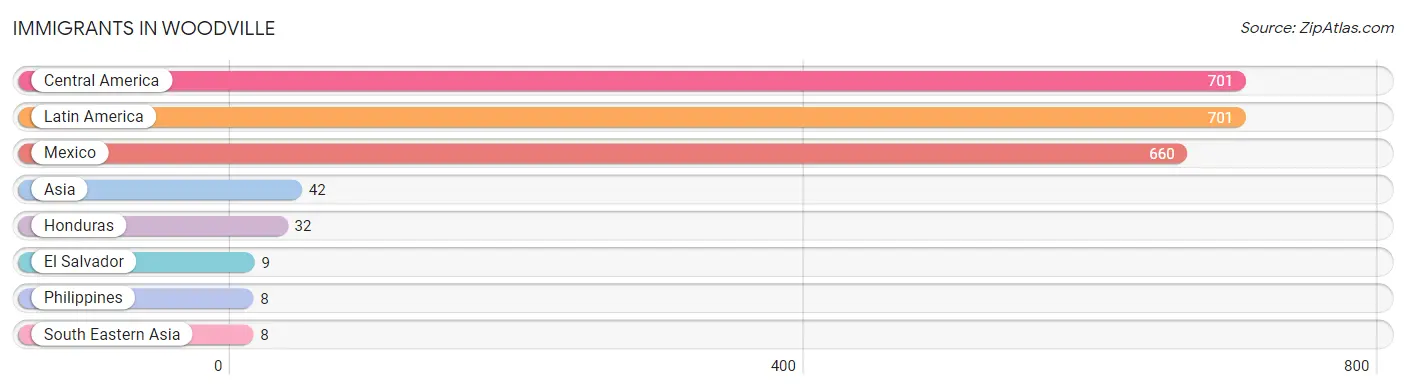
The most numerous immigrant groups reported in Woodville came from Central America (701 | 38.3%), Latin America (701 | 38.3%), Mexico (660 | 36.1%), Asia (42 | 2.3%), and Honduras (32 | 1.8%), together accounting for 116.7% of all Woodville residents.
| Immigration Origin | # Population | % Population |
| Asia | 42 | 2.3% |
| Central America | 701 | 38.3% |
| El Salvador | 9 | 0.5% |
| Honduras | 32 | 1.8% |
| Latin America | 701 | 38.3% |
| Mexico | 660 | 36.1% |
| Philippines | 8 | 0.4% |
| South Eastern Asia | 8 | 0.4% | View All 8 Rows |
Sex and Age in Woodville
Sex and Age in Woodville
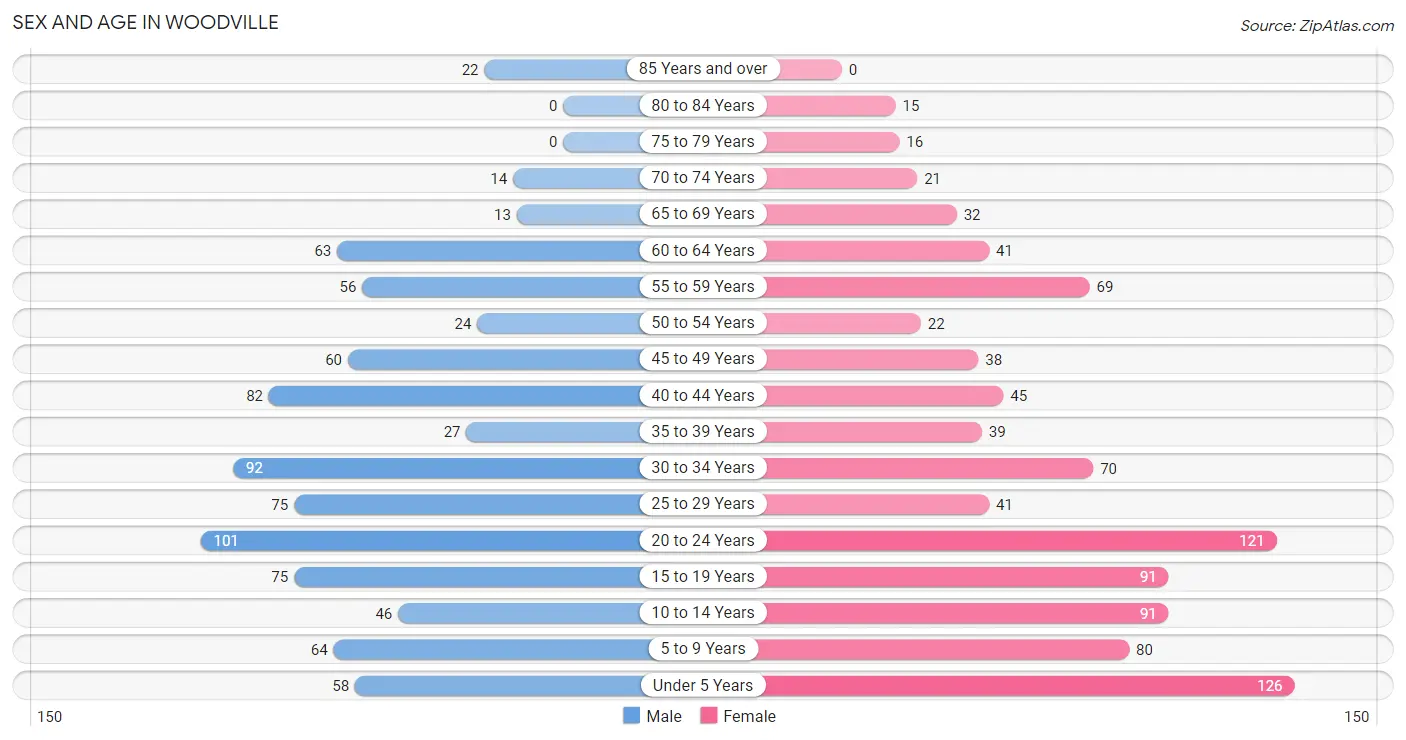
The most populous age groups in Woodville are 20 to 24 Years (101 | 11.6%) for men and Under 5 Years (126 | 13.2%) for women.
| Age Bracket | Male | Female |
| Under 5 Years | 58 (6.7%) | 126 (13.2%) |
| 5 to 9 Years | 64 (7.3%) | 80 (8.4%) |
| 10 to 14 Years | 46 (5.3%) | 91 (9.5%) |
| 15 to 19 Years | 75 (8.6%) | 91 (9.5%) |
| 20 to 24 Years | 101 (11.6%) | 121 (12.6%) |
| 25 to 29 Years | 75 (8.6%) | 41 (4.3%) |
| 30 to 34 Years | 92 (10.5%) | 70 (7.3%) |
| 35 to 39 Years | 27 (3.1%) | 39 (4.1%) |
| 40 to 44 Years | 82 (9.4%) | 45 (4.7%) |
| 45 to 49 Years | 60 (6.9%) | 38 (4.0%) |
| 50 to 54 Years | 24 (2.8%) | 22 (2.3%) |
| 55 to 59 Years | 56 (6.4%) | 69 (7.2%) |
| 60 to 64 Years | 63 (7.2%) | 41 (4.3%) |
| 65 to 69 Years | 13 (1.5%) | 32 (3.3%) |
| 70 to 74 Years | 14 (1.6%) | 21 (2.2%) |
| 75 to 79 Years | 0 (0.0%) | 16 (1.7%) |
| 80 to 84 Years | 0 (0.0%) | 15 (1.6%) |
| 85 Years and over | 22 (2.5%) | 0 (0.0%) |
| Total | 872 (100.0%) | 958 (100.0%) |
Families and Households in Woodville
Median Family Size in Woodville
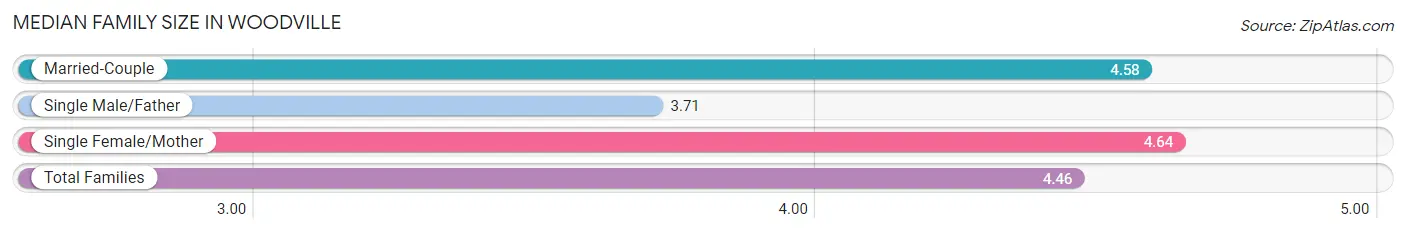
The median family size in Woodville is 4.46 persons per family, with single female/mother families (70 | 18.6%) accounting for the largest median family size of 4.64 persons per family. On the other hand, single male/father families (55 | 14.6%) represent the smallest median family size with 3.71 persons per family.
| Family Type | # Families | Family Size |
| Married-Couple | 252 (66.8%) | 4.58 |
| Single Male/Father | 55 (14.6%) | 3.71 |
| Single Female/Mother | 70 (18.6%) | 4.64 |
| Total Families | 377 (100.0%) | 4.46 |
Median Household Size in Woodville
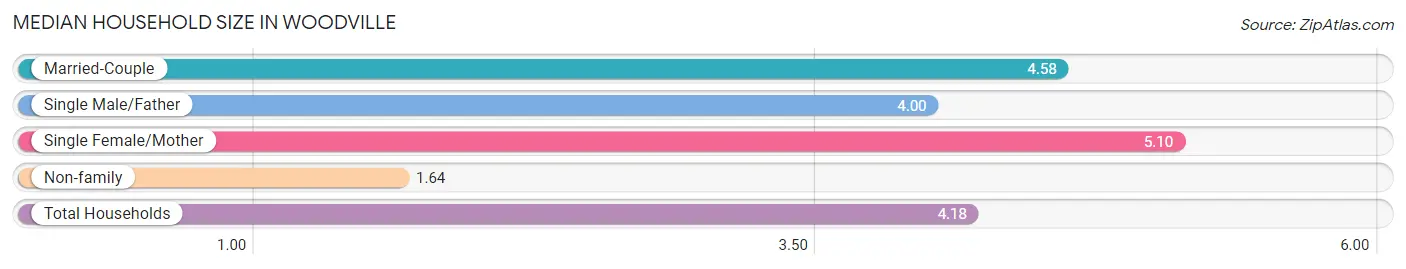
The median household size in Woodville is 4.18 persons per household, with single female/mother households (70 | 16.0%) accounting for the largest median household size of 5.1 persons per household. non-family households (61 | 13.9%) represent the smallest median household size with 1.64 persons per household.
| Household Type | # Households | Household Size |
| Married-Couple | 252 (57.5%) | 4.58 |
| Single Male/Father | 55 (12.6%) | 4.00 |
| Single Female/Mother | 70 (16.0%) | 5.10 |
| Non-family | 61 (13.9%) | 1.64 |
| Total Households | 438 (100.0%) | 4.18 |
Household Size by Marriage Status in Woodville
Out of a total of 438 households in Woodville, 377 (86.1%) are family households, while 61 (13.9%) are nonfamily households. The most numerous type of family households are 4-person households, comprising 107, and the most common type of nonfamily households are 1-person households, comprising 36.
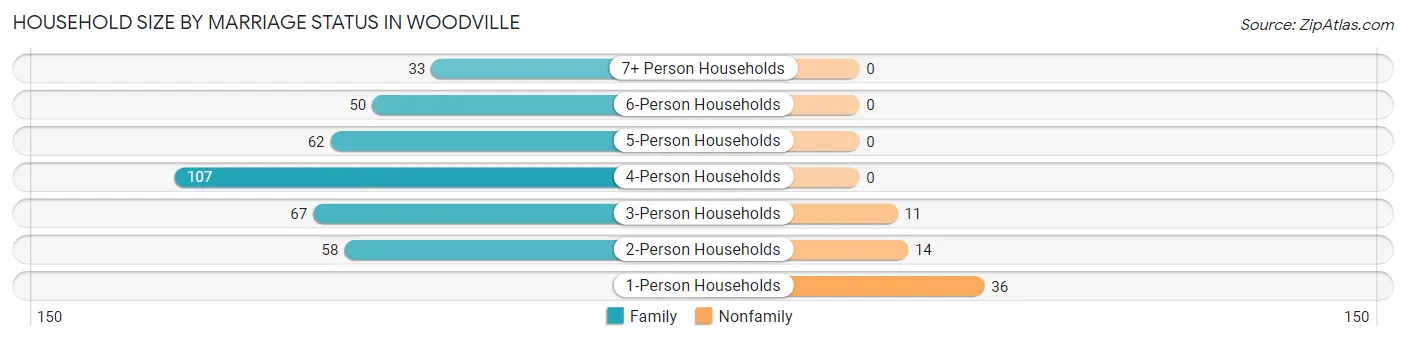
| Household Size | Family Households | Nonfamily Households |
| 1-Person Households | - | 36 (8.2%) |
| 2-Person Households | 58 (13.2%) | 14 (3.2%) |
| 3-Person Households | 67 (15.3%) | 11 (2.5%) |
| 4-Person Households | 107 (24.4%) | 0 (0.0%) |
| 5-Person Households | 62 (14.2%) | 0 (0.0%) |
| 6-Person Households | 50 (11.4%) | 0 (0.0%) |
| 7+ Person Households | 33 (7.5%) | 0 (0.0%) |
| Total | 377 (86.1%) | 61 (13.9%) |
Female Fertility in Woodville
Fertility by Age in Woodville
Average fertility rate in Woodville is 81.0 births per 1,000 women. Women in the age bracket of 20 to 34 years have the highest fertility rate with 134.0 births per 1,000 women. Women in the age bracket of 20 to 34 years acount for 86.1% of all women with births.
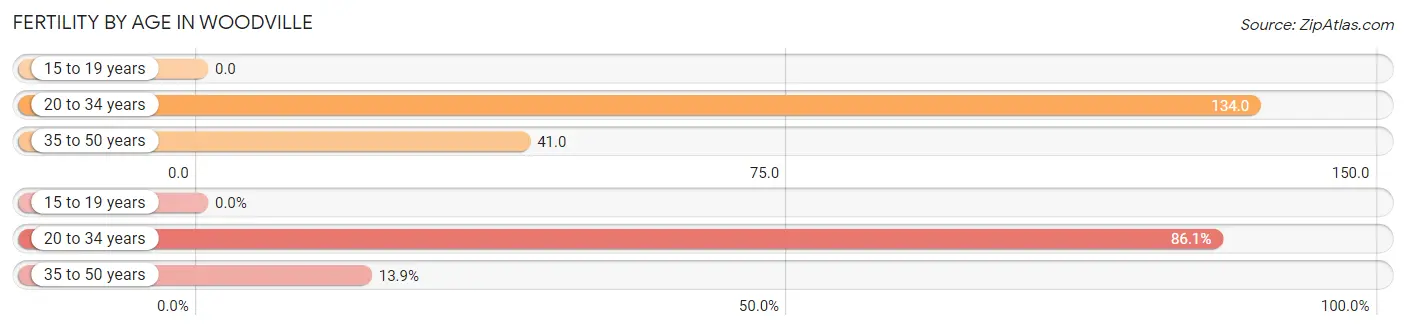
| Age Bracket | Women with Births | Births / 1,000 Women |
| 15 to 19 years | 0 (0.0%) | 0.0 |
| 20 to 34 years | 31 (86.1%) | 134.0 |
| 35 to 50 years | 5 (13.9%) | 41.0 |
| Total | 36 (100.0%) | 81.0 |
Fertility by Age by Marriage Status in Woodville
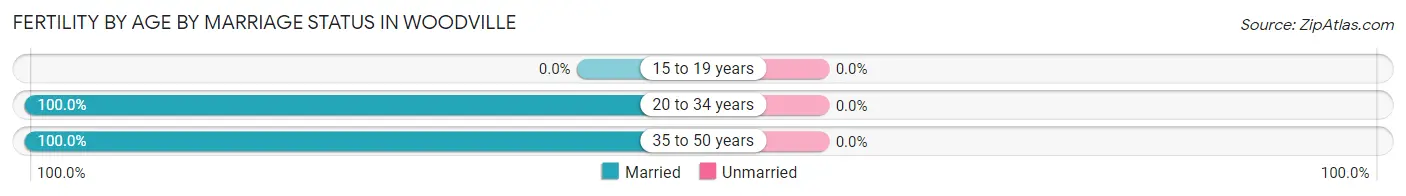
| Age Bracket | Married | Unmarried |
| 15 to 19 years | 0 (0.0%) | 0 (0.0%) |
| 20 to 34 years | 31 (100.0%) | 0 (0.0%) |
| 35 to 50 years | 5 (100.0%) | 0 (0.0%) |
| Total | 36 (100.0%) | 0 (0.0%) |
Fertility by Education in Woodville
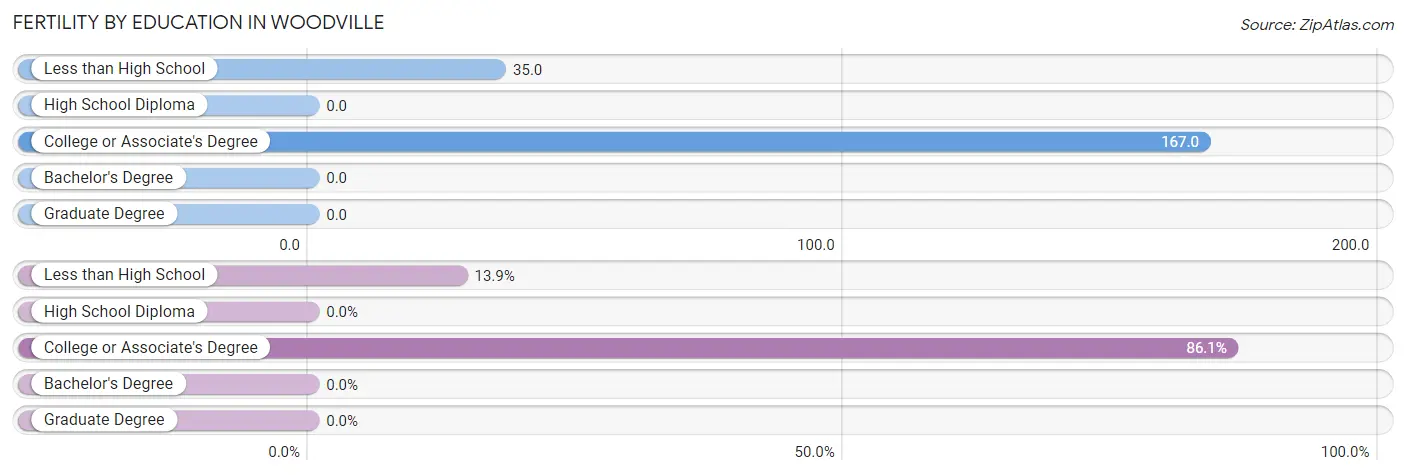
| Educational Attainment | Women with Births | Births / 1,000 Women |
| Less than High School | 5 (13.9%) | 35.0 |
| High School Diploma | 0 (0.0%) | 0.0 |
| College or Associate's Degree | 31 (86.1%) | 167.0 |
| Bachelor's Degree | 0 (0.0%) | 0.0 |
| Graduate Degree | 0 (0.0%) | 0.0 |
| Total | 36 (100.0%) | 81.0 |
Fertility by Education by Marriage Status in Woodville
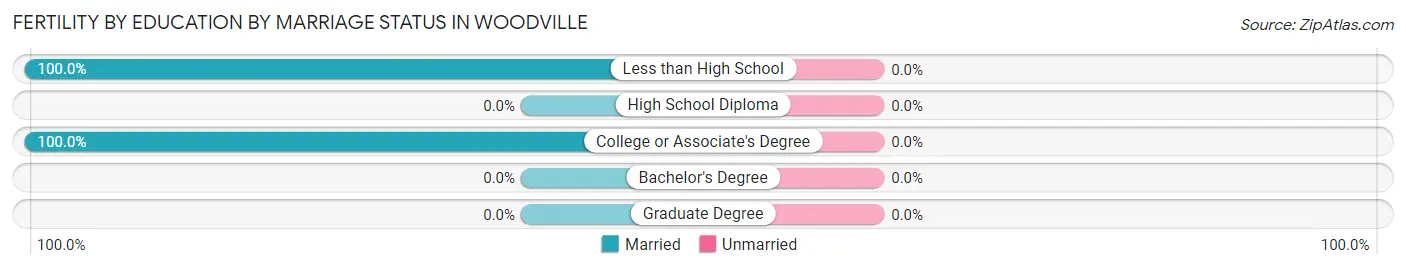
| Educational Attainment | Married | Unmarried |
| Less than High School | 5 (100.0%) | 0 (0.0%) |
| High School Diploma | 0 (0.0%) | 0 (0.0%) |
| College or Associate's Degree | 31 (100.0%) | 0 (0.0%) |
| Bachelor's Degree | 0 (0.0%) | 0 (0.0%) |
| Graduate Degree | 0 (0.0%) | 0 (0.0%) |
| Total | 36 (100.0%) | 0 (0.0%) |
Employment Characteristics in Woodville
Employment by Class of Employer in Woodville
Among the 682 employed individuals in Woodville, private company employees (587 | 86.1%), self-employed (not incorporated) (35 | 5.1%), and not-for-profit organizations (30 | 4.4%) make up the most common classes of employment.
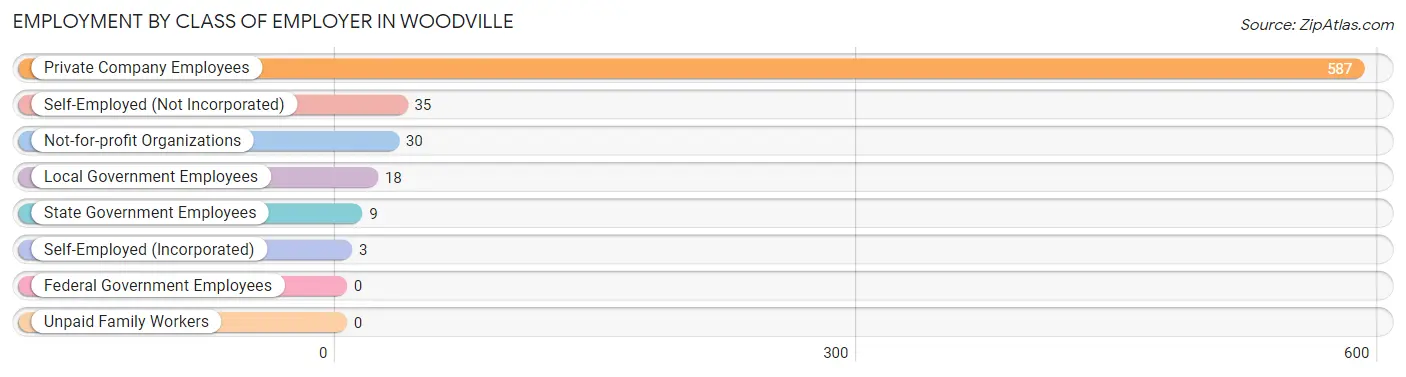
| Employer Class | # Employees | % Employees |
| Private Company Employees | 587 | 86.1% |
| Self-Employed (Incorporated) | 3 | 0.4% |
| Self-Employed (Not Incorporated) | 35 | 5.1% |
| Not-for-profit Organizations | 30 | 4.4% |
| Local Government Employees | 18 | 2.6% |
| State Government Employees | 9 | 1.3% |
| Federal Government Employees | 0 | 0.0% |
| Unpaid Family Workers | 0 | 0.0% |
| Total | 682 | 100.0% |
Employment Status by Age in Woodville
According to the labor force statistics for Woodville, out of the total population over 16 years of age (1,332), 59.2% or 789 individuals are in the labor force, with 11.3% or 89 of them unemployed. The age group with the highest labor force participation rate is 30 to 34 years, with 87.7% or 142 individuals in the labor force. Within the labor force, the 20 to 24 years age range has the highest percentage of unemployed individuals, with 24.7% or 43 of them being unemployed.
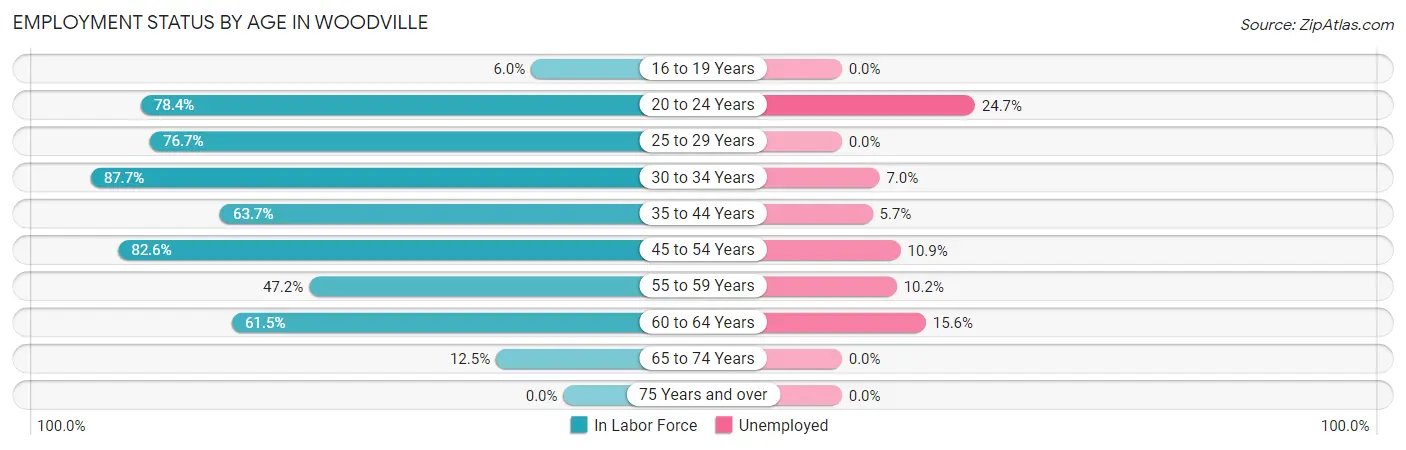
| Age Bracket | In Labor Force | Unemployed |
| 16 to 19 Years | 8 (6.0%) | 0 (0.0%) |
| 20 to 24 Years | 174 (78.4%) | 43 (24.7%) |
| 25 to 29 Years | 89 (76.7%) | 0 (0.0%) |
| 30 to 34 Years | 142 (87.7%) | 10 (7.0%) |
| 35 to 44 Years | 123 (63.7%) | 7 (5.7%) |
| 45 to 54 Years | 119 (82.6%) | 13 (10.9%) |
| 55 to 59 Years | 59 (47.2%) | 6 (10.2%) |
| 60 to 64 Years | 64 (61.5%) | 10 (15.6%) |
| 65 to 74 Years | 10 (12.5%) | 0 (0.0%) |
| 75 Years and over | 0 (0.0%) | 0 (0.0%) |
| Total | 789 (59.2%) | 89 (11.3%) |
Employment Status by Educational Attainment in Woodville
According to labor force statistics for Woodville, 70.6% of individuals (596) out of the total population between 25 and 64 years of age (844) are in the labor force, with 7.7% or 46 of them being unemployed. The group with the highest labor force participation rate are those with the educational attainment of bachelor's degree or higher, with 100.0% or 13 individuals in the labor force. Within the labor force, individuals with bachelor's degree or higher education have the highest percentage of unemployment, with 100.0% or 13 of them being unemployed.
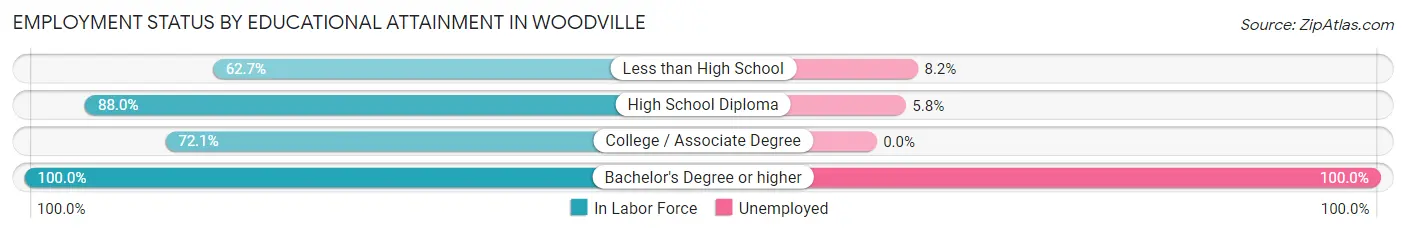
| Educational Attainment | In Labor Force | Unemployed |
| Less than High School | 292 (62.7%) | 38 (8.2%) |
| High School Diploma | 154 (88.0%) | 10 (5.8%) |
| College / Associate Degree | 137 (72.1%) | 0 (0.0%) |
| Bachelor's Degree or higher | 13 (100.0%) | 13 (100.0%) |
| Total | 596 (70.6%) | 65 (7.7%) |
Employment Occupations by Sex in Woodville
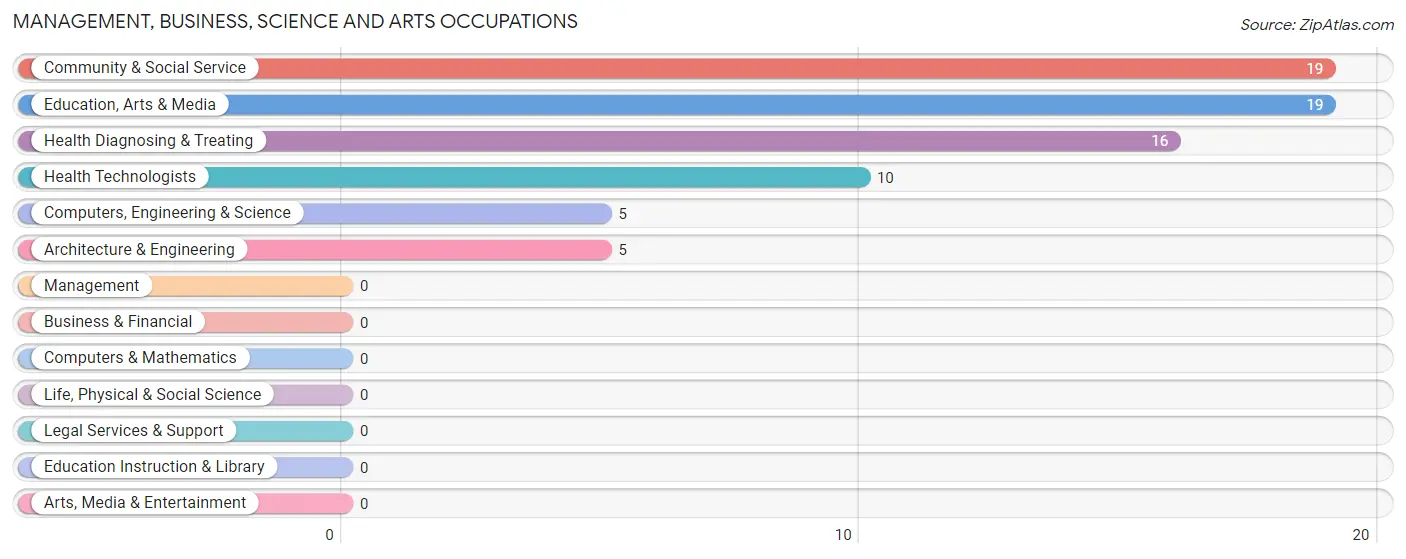
Management, Business, Science and Arts Occupations
The most common Management, Business, Science and Arts occupations in Woodville are Community & Social Service (19 | 2.7%), Education, Arts & Media (19 | 2.7%), Health Diagnosing & Treating (16 | 2.3%), Health Technologists (10 | 1.4%), and Computers, Engineering & Science (5 | 0.7%).
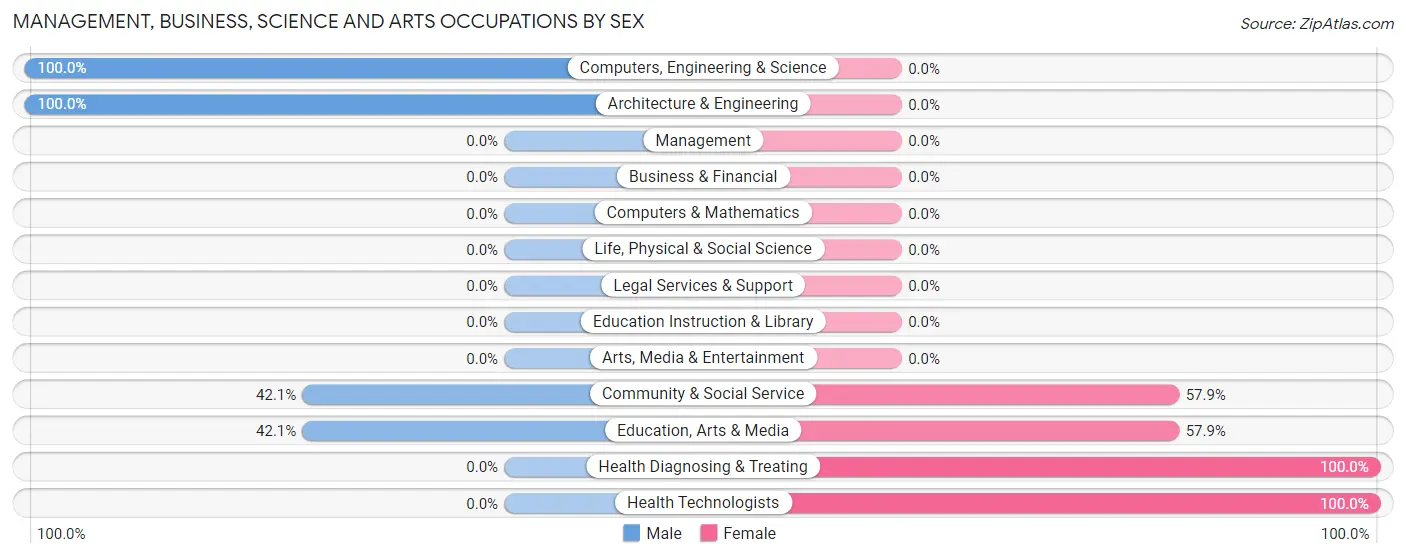
Management, Business, Science and Arts Occupations by Sex
Within the Management, Business, Science and Arts occupations in Woodville, the most male-oriented occupations are Computers, Engineering & Science (100.0%), Architecture & Engineering (100.0%), and Community & Social Service (42.1%), while the most female-oriented occupations are Health Diagnosing & Treating (100.0%), Health Technologists (100.0%), and Community & Social Service (57.9%).
| Occupation | Male | Female |
| Management | 0 (0.0%) | 0 (0.0%) |
| Business & Financial | 0 (0.0%) | 0 (0.0%) |
| Computers, Engineering & Science | 5 (100.0%) | 0 (0.0%) |
| Computers & Mathematics | 0 (0.0%) | 0 (0.0%) |
| Architecture & Engineering | 5 (100.0%) | 0 (0.0%) |
| Life, Physical & Social Science | 0 (0.0%) | 0 (0.0%) |
| Community & Social Service | 8 (42.1%) | 11 (57.9%) |
| Education, Arts & Media | 8 (42.1%) | 11 (57.9%) |
| Legal Services & Support | 0 (0.0%) | 0 (0.0%) |
| Education Instruction & Library | 0 (0.0%) | 0 (0.0%) |
| Arts, Media & Entertainment | 0 (0.0%) | 0 (0.0%) |
| Health Diagnosing & Treating | 0 (0.0%) | 16 (100.0%) |
| Health Technologists | 0 (0.0%) | 10 (100.0%) |
| Total (Category) | 13 (32.5%) | 27 (67.5%) |
| Total (Overall) | 481 (68.8%) | 218 (31.2%) |
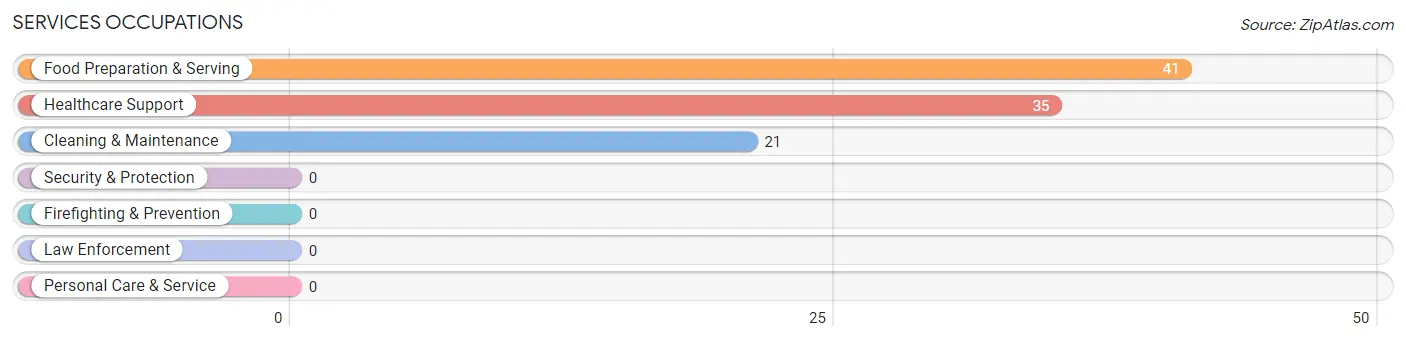
Services Occupations
The most common Services occupations in Woodville are Food Preparation & Serving (41 | 5.9%), Healthcare Support (35 | 5.0%), and Cleaning & Maintenance (21 | 3.0%).
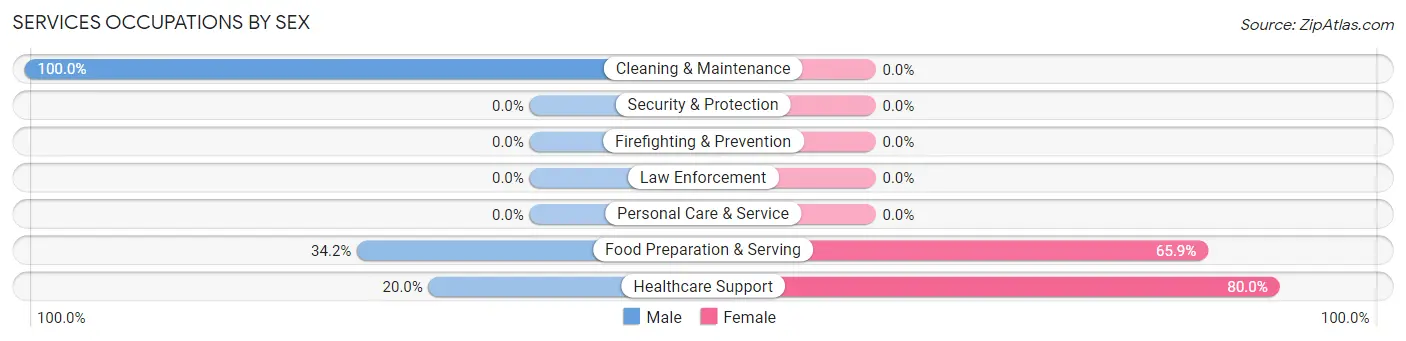
Services Occupations by Sex
Within the Services occupations in Woodville, the most male-oriented occupations are Cleaning & Maintenance (100.0%), Food Preparation & Serving (34.2%), and Healthcare Support (20.0%), while the most female-oriented occupations are Healthcare Support (80.0%), and Food Preparation & Serving (65.8%).
| Occupation | Male | Female |
| Healthcare Support | 7 (20.0%) | 28 (80.0%) |
| Security & Protection | 0 (0.0%) | 0 (0.0%) |
| Firefighting & Prevention | 0 (0.0%) | 0 (0.0%) |
| Law Enforcement | 0 (0.0%) | 0 (0.0%) |
| Food Preparation & Serving | 14 (34.2%) | 27 (65.8%) |
| Cleaning & Maintenance | 21 (100.0%) | 0 (0.0%) |
| Personal Care & Service | 0 (0.0%) | 0 (0.0%) |
| Total (Category) | 42 (43.3%) | 55 (56.7%) |
| Total (Overall) | 481 (68.8%) | 218 (31.2%) |
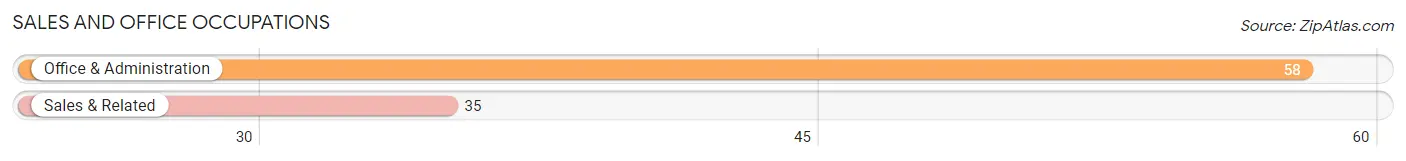
Sales and Office Occupations
The most common Sales and Office occupations in Woodville are Office & Administration (58 | 8.3%), and Sales & Related (35 | 5.0%).
Sales and Office Occupations by Sex
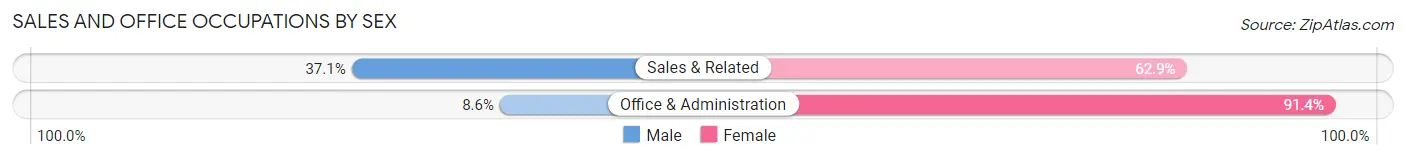
| Occupation | Male | Female |
| Sales & Related | 13 (37.1%) | 22 (62.9%) |
| Office & Administration | 5 (8.6%) | 53 (91.4%) |
| Total (Category) | 18 (19.4%) | 75 (80.6%) |
| Total (Overall) | 481 (68.8%) | 218 (31.2%) |
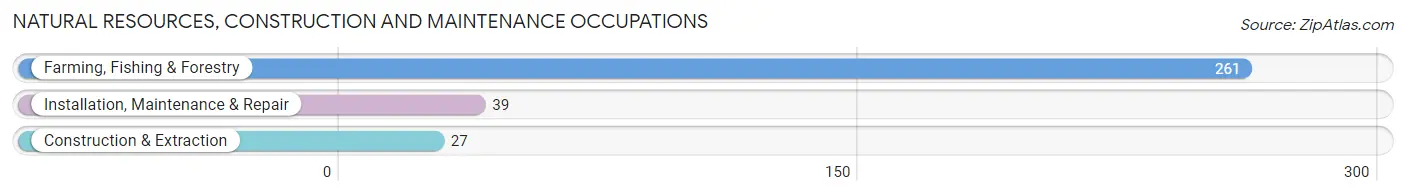
Natural Resources, Construction and Maintenance Occupations
The most common Natural Resources, Construction and Maintenance occupations in Woodville are Farming, Fishing & Forestry (261 | 37.3%), Installation, Maintenance & Repair (39 | 5.6%), and Construction & Extraction (27 | 3.9%).
Natural Resources, Construction and Maintenance Occupations by Sex
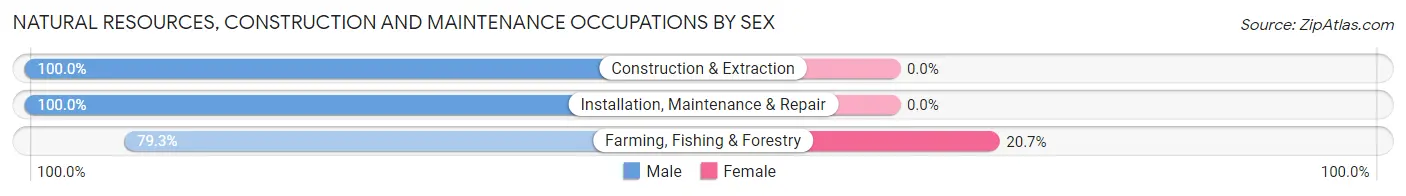
| Occupation | Male | Female |
| Farming, Fishing & Forestry | 207 (79.3%) | 54 (20.7%) |
| Construction & Extraction | 27 (100.0%) | 0 (0.0%) |
| Installation, Maintenance & Repair | 39 (100.0%) | 0 (0.0%) |
| Total (Category) | 273 (83.5%) | 54 (16.5%) |
| Total (Overall) | 481 (68.8%) | 218 (31.2%) |
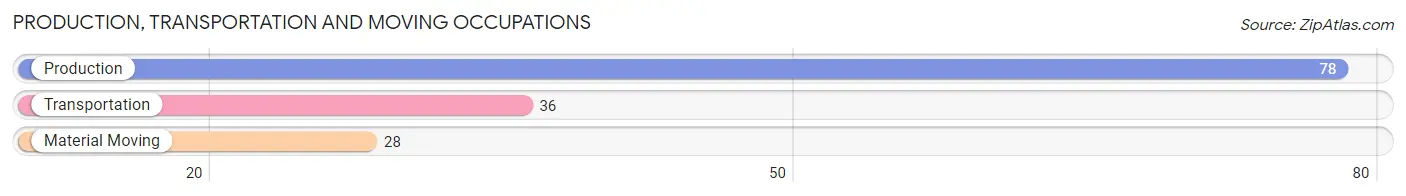
Production, Transportation and Moving Occupations
The most common Production, Transportation and Moving occupations in Woodville are Production (78 | 11.2%), Transportation (36 | 5.1%), and Material Moving (28 | 4.0%).
Production, Transportation and Moving Occupations by Sex
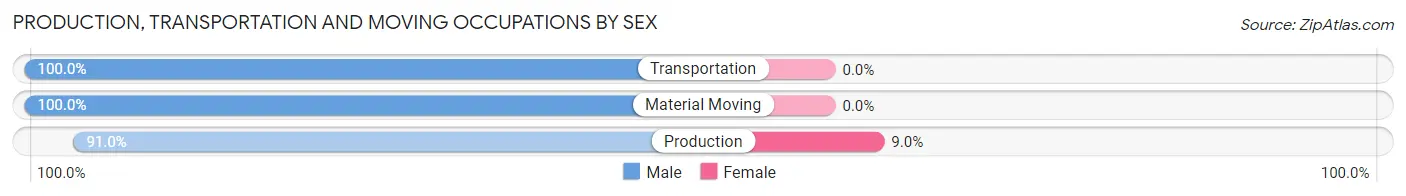
| Occupation | Male | Female |
| Production | 71 (91.0%) | 7 (9.0%) |
| Transportation | 36 (100.0%) | 0 (0.0%) |
| Material Moving | 28 (100.0%) | 0 (0.0%) |
| Total (Category) | 135 (95.1%) | 7 (4.9%) |
| Total (Overall) | 481 (68.8%) | 218 (31.2%) |
Employment Industries by Sex in Woodville
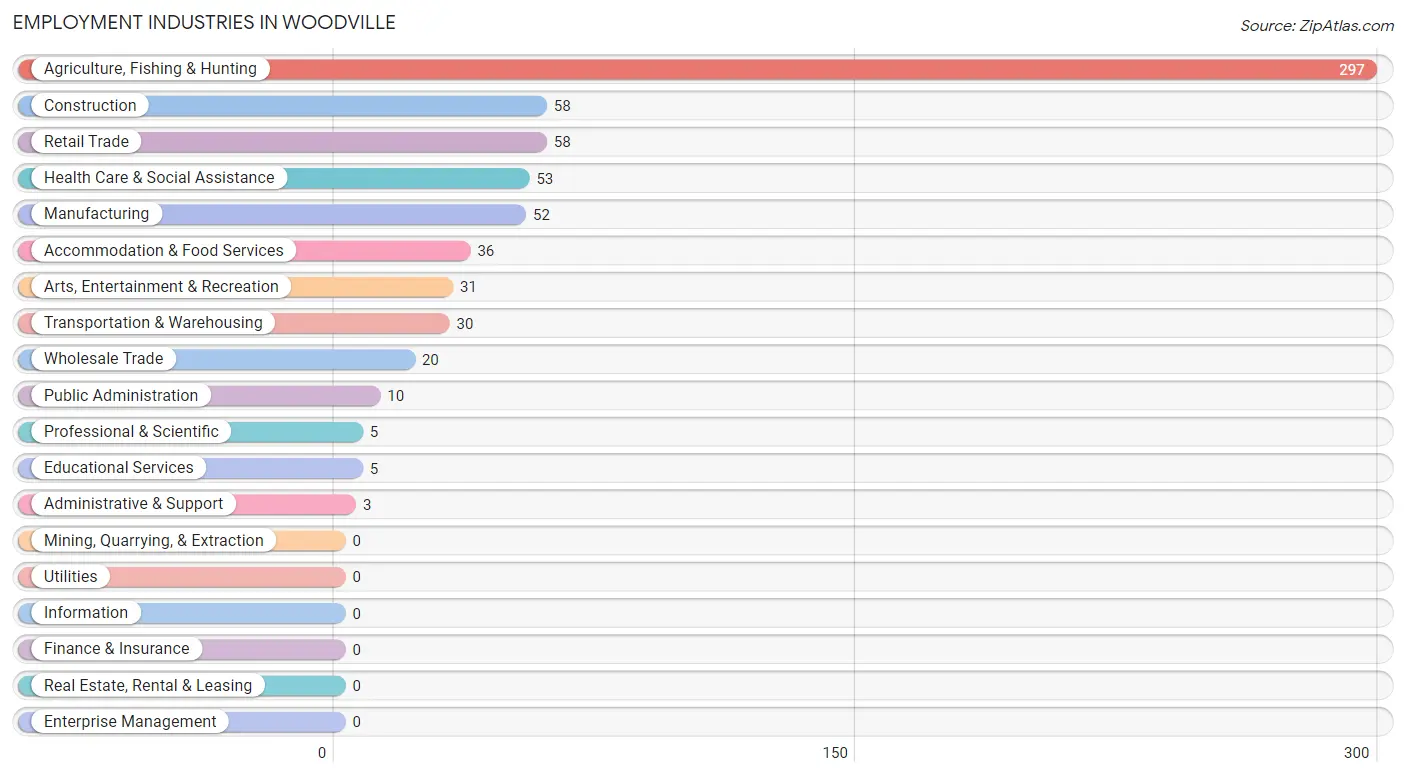
Employment Industries in Woodville
The major employment industries in Woodville include Agriculture, Fishing & Hunting (297 | 42.5%), Construction (58 | 8.3%), Retail Trade (58 | 8.3%), Health Care & Social Assistance (53 | 7.6%), and Manufacturing (52 | 7.4%).
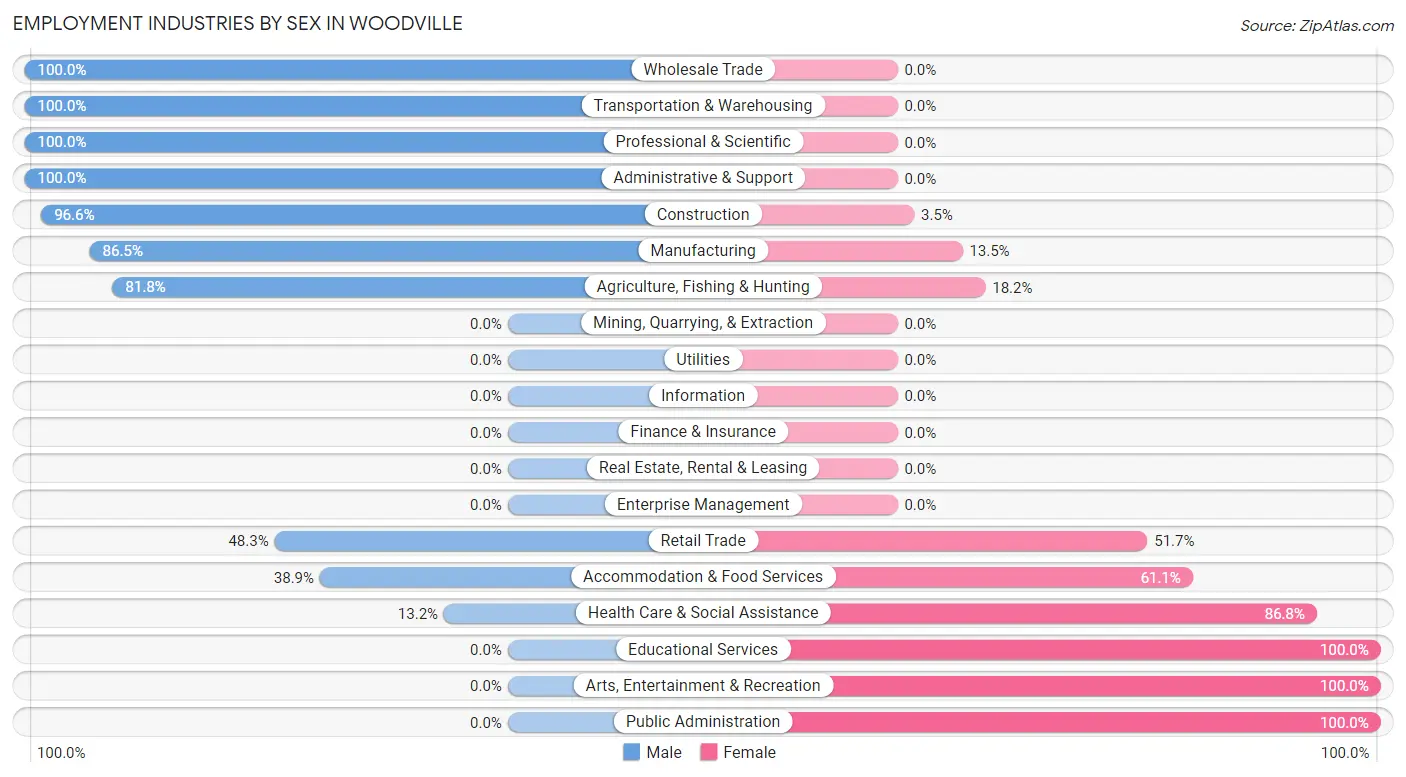
Employment Industries by Sex in Woodville
The Woodville industries that see more men than women are Wholesale Trade (100.0%), Transportation & Warehousing (100.0%), and Professional & Scientific (100.0%), whereas the industries that tend to have a higher number of women are Educational Services (100.0%), Arts, Entertainment & Recreation (100.0%), and Public Administration (100.0%).
| Industry | Male | Female |
| Agriculture, Fishing & Hunting | 243 (81.8%) | 54 (18.2%) |
| Mining, Quarrying, & Extraction | 0 (0.0%) | 0 (0.0%) |
| Construction | 56 (96.6%) | 2 (3.5%) |
| Manufacturing | 45 (86.5%) | 7 (13.5%) |
| Wholesale Trade | 20 (100.0%) | 0 (0.0%) |
| Retail Trade | 28 (48.3%) | 30 (51.7%) |
| Transportation & Warehousing | 30 (100.0%) | 0 (0.0%) |
| Utilities | 0 (0.0%) | 0 (0.0%) |
| Information | 0 (0.0%) | 0 (0.0%) |
| Finance & Insurance | 0 (0.0%) | 0 (0.0%) |
| Real Estate, Rental & Leasing | 0 (0.0%) | 0 (0.0%) |
| Professional & Scientific | 5 (100.0%) | 0 (0.0%) |
| Enterprise Management | 0 (0.0%) | 0 (0.0%) |
| Administrative & Support | 3 (100.0%) | 0 (0.0%) |
| Educational Services | 0 (0.0%) | 5 (100.0%) |
| Health Care & Social Assistance | 7 (13.2%) | 46 (86.8%) |
| Arts, Entertainment & Recreation | 0 (0.0%) | 31 (100.0%) |
| Accommodation & Food Services | 14 (38.9%) | 22 (61.1%) |
| Public Administration | 0 (0.0%) | 10 (100.0%) |
| Total | 481 (68.8%) | 218 (31.2%) |
Education in Woodville
School Enrollment in Woodville
The most common levels of schooling among the 500 students in Woodville are elementary school (145 | 29.0%), college / undergraduate (128 | 25.6%), and high school (115 | 23.0%).
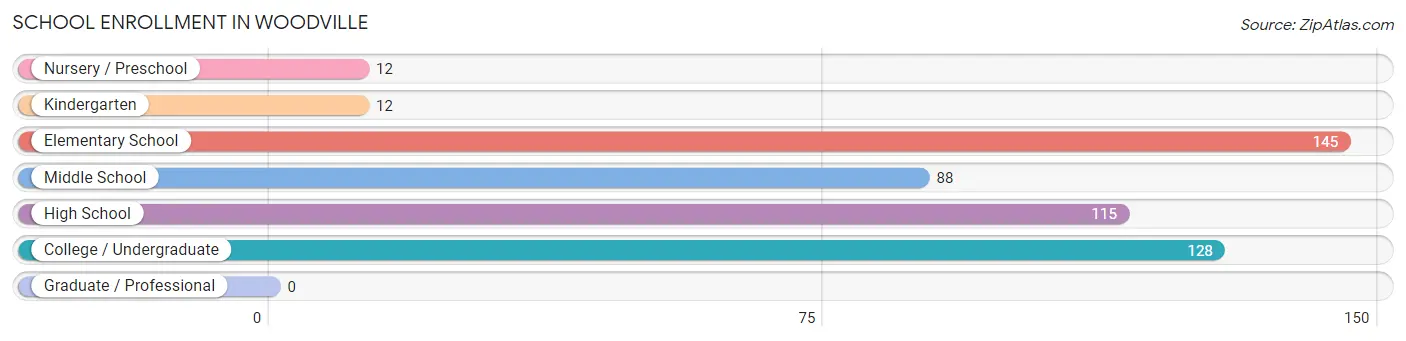
| School Level | # Students | % Students |
| Nursery / Preschool | 12 | 2.4% |
| Kindergarten | 12 | 2.4% |
| Elementary School | 145 | 29.0% |
| Middle School | 88 | 17.6% |
| High School | 115 | 23.0% |
| College / Undergraduate | 128 | 25.6% |
| Graduate / Professional | 0 | 0.0% |
| Total | 500 | 100.0% |
School Enrollment by Age by Funding Source in Woodville
Out of a total of 500 students who are enrolled in schools in Woodville, 43 (8.6%) attend a private institution, while the remaining 457 (91.4%) are enrolled in public schools. The age group of 20 to 24 year olds has the highest likelihood of being enrolled in private schools, with 14 (24.1% in the age bracket) enrolled. Conversely, the age group of 5 to 9 year old has the lowest likelihood of being enrolled in a private school, with 144 (100.0% in the age bracket) attending a public institution.
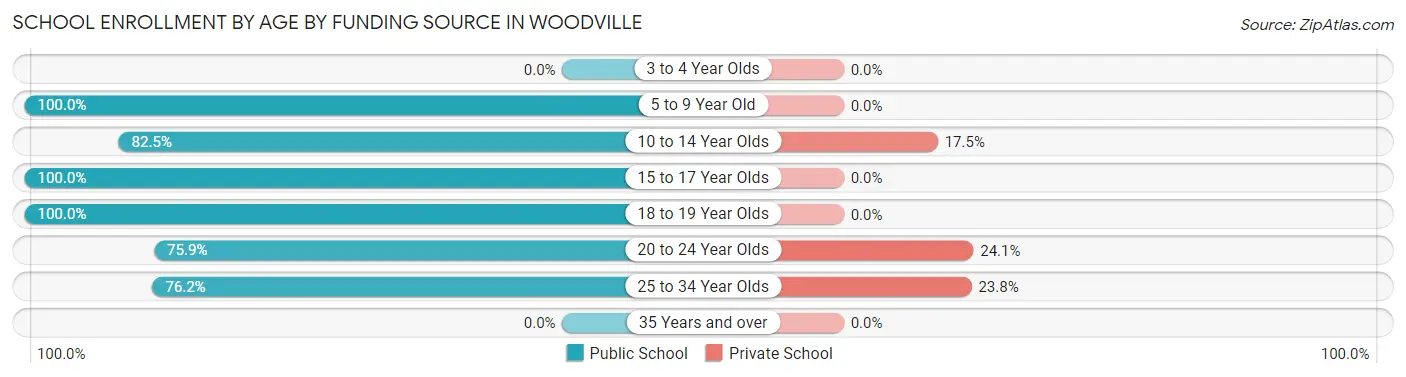
| Age Bracket | Public School | Private School |
| 3 to 4 Year Olds | 0 (0.0%) | 0 (0.0%) |
| 5 to 9 Year Old | 144 (100.0%) | 0 (0.0%) |
| 10 to 14 Year Olds | 113 (82.5%) | 24 (17.5%) |
| 15 to 17 Year Olds | 78 (100.0%) | 0 (0.0%) |
| 18 to 19 Year Olds | 62 (100.0%) | 0 (0.0%) |
| 20 to 24 Year Olds | 44 (75.9%) | 14 (24.1%) |
| 25 to 34 Year Olds | 16 (76.2%) | 5 (23.8%) |
| 35 Years and over | 0 (0.0%) | 0 (0.0%) |
| Total | 457 (91.4%) | 43 (8.6%) |
Educational Attainment by Field of Study in Woodville
Psychology (11 | 84.6%), and education (2 | 15.4%) are the most common fields of study among 13 individuals in Woodville who have obtained a bachelor's degree or higher.
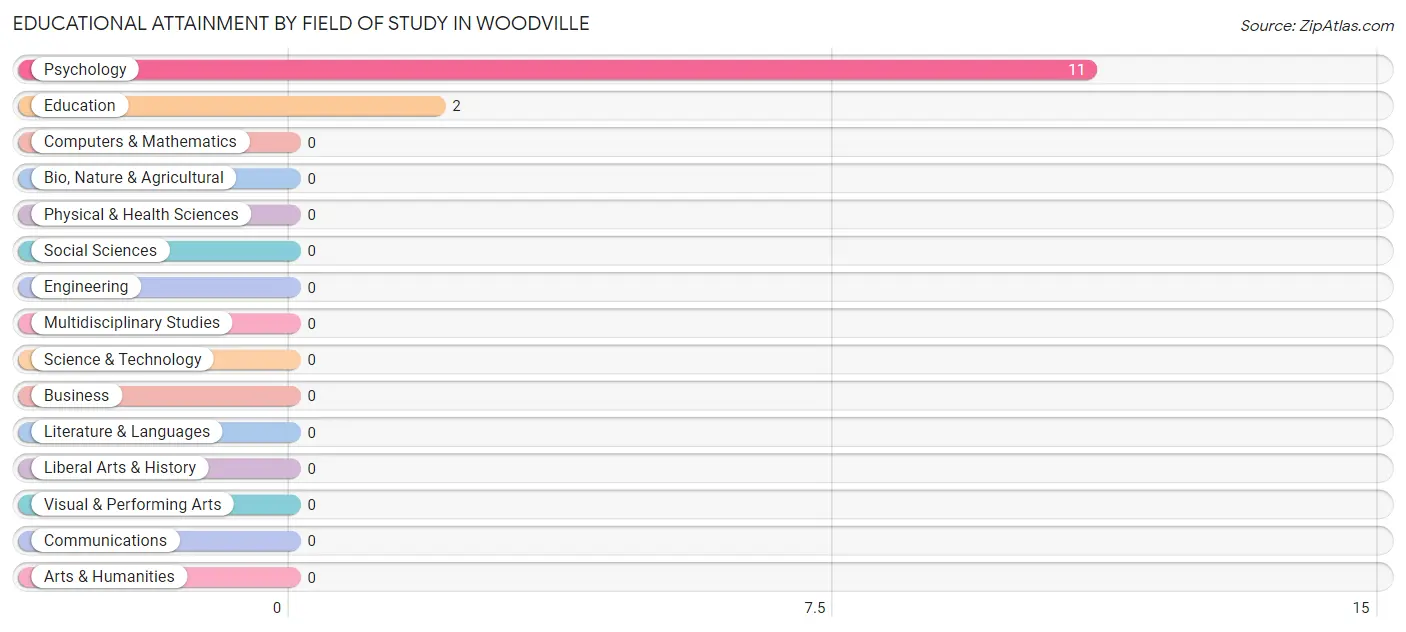
| Field of Study | # Graduates | % Graduates |
| Computers & Mathematics | 0 | 0.0% |
| Bio, Nature & Agricultural | 0 | 0.0% |
| Physical & Health Sciences | 0 | 0.0% |
| Psychology | 11 | 84.6% |
| Social Sciences | 0 | 0.0% |
| Engineering | 0 | 0.0% |
| Multidisciplinary Studies | 0 | 0.0% |
| Science & Technology | 0 | 0.0% |
| Business | 0 | 0.0% |
| Education | 2 | 15.4% |
| Literature & Languages | 0 | 0.0% |
| Liberal Arts & History | 0 | 0.0% |
| Visual & Performing Arts | 0 | 0.0% |
| Communications | 0 | 0.0% |
| Arts & Humanities | 0 | 0.0% |
| Total | 13 | 100.0% |
Transportation & Commute in Woodville
Vehicle Availability by Sex in Woodville
The most prevalent vehicle ownership categories in Woodville are males with 3 vehicles (152, accounting for 32.4%) and females with 3 vehicles (61, making up 71.4%).
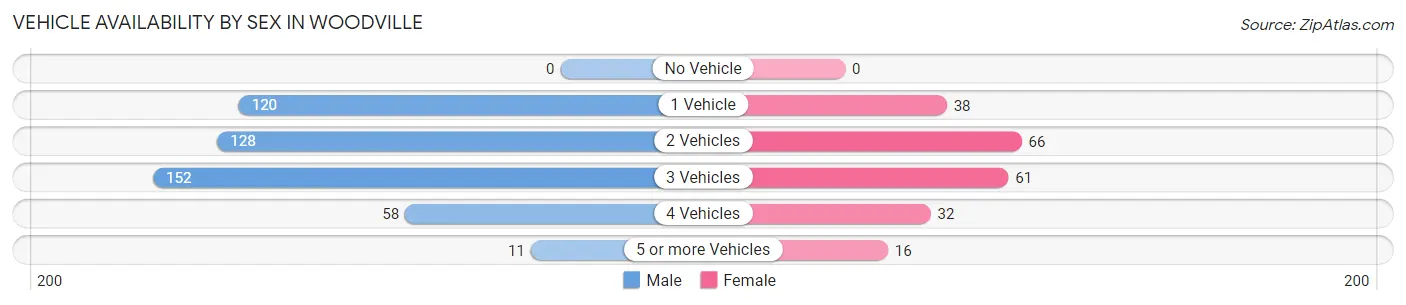
| Vehicles Available | Male | Female |
| No Vehicle | 0 (0.0%) | 0 (0.0%) |
| 1 Vehicle | 120 (25.6%) | 38 (17.8%) |
| 2 Vehicles | 128 (27.3%) | 66 (31.0%) |
| 3 Vehicles | 152 (32.4%) | 61 (28.6%) |
| 4 Vehicles | 58 (12.4%) | 32 (15.0%) |
| 5 or more Vehicles | 11 (2.4%) | 16 (7.5%) |
| Total | 469 (100.0%) | 213 (100.0%) |
Commute Time in Woodville
The most frequently occuring commute durations in Woodville are 20 to 24 minutes (119 commuters, 17.7%), 15 to 19 minutes (107 commuters, 16.0%), and 60 to 89 minutes (90 commuters, 13.4%).
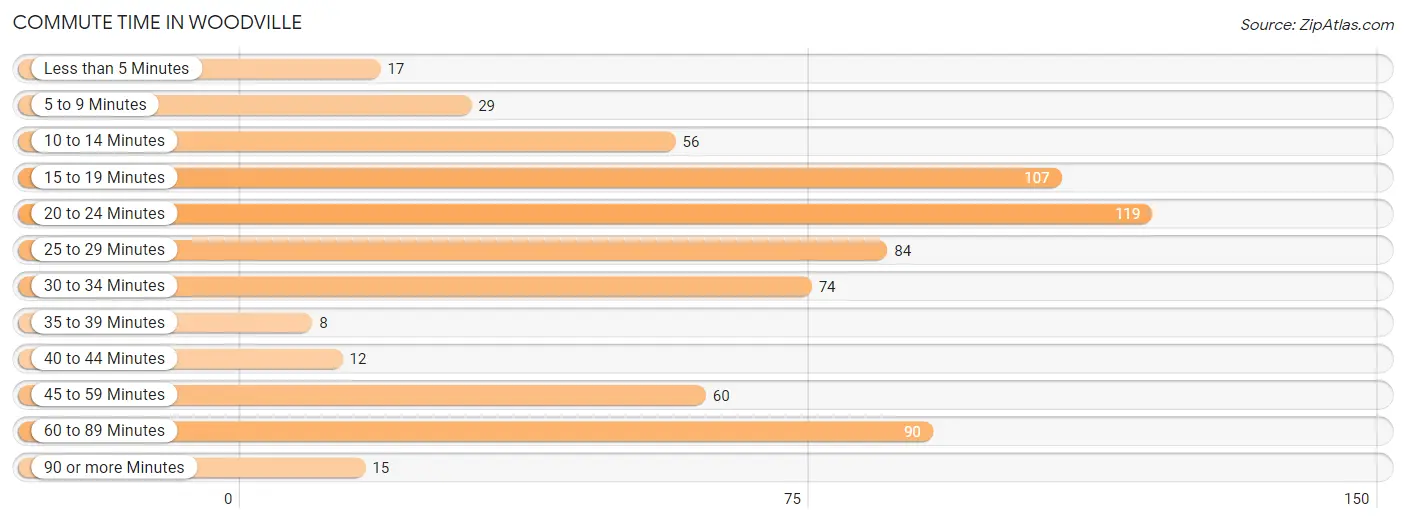
| Commute Time | # Commuters | % Commuters |
| Less than 5 Minutes | 17 | 2.5% |
| 5 to 9 Minutes | 29 | 4.3% |
| 10 to 14 Minutes | 56 | 8.4% |
| 15 to 19 Minutes | 107 | 16.0% |
| 20 to 24 Minutes | 119 | 17.7% |
| 25 to 29 Minutes | 84 | 12.5% |
| 30 to 34 Minutes | 74 | 11.0% |
| 35 to 39 Minutes | 8 | 1.2% |
| 40 to 44 Minutes | 12 | 1.8% |
| 45 to 59 Minutes | 60 | 8.9% |
| 60 to 89 Minutes | 90 | 13.4% |
| 90 or more Minutes | 15 | 2.2% |
Commute Time by Sex in Woodville
The most common commute times in Woodville are 15 to 19 minutes (93 commuters, 20.0%) for males and 25 to 29 minutes (71 commuters, 34.6%) for females.
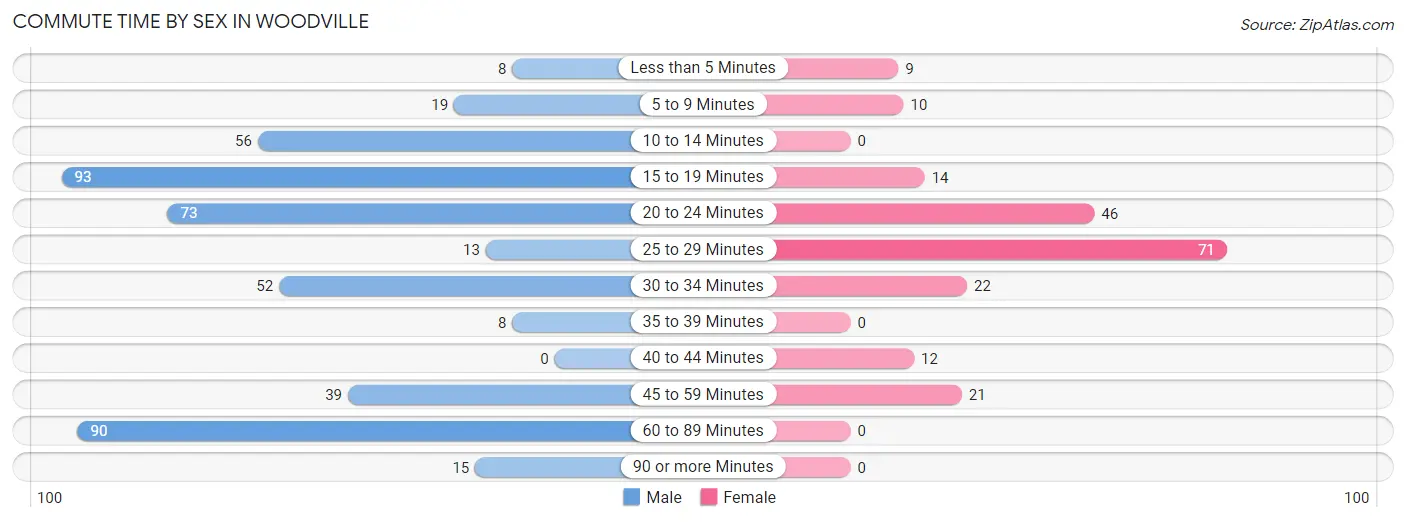
| Commute Time | Male | Female |
| Less than 5 Minutes | 8 (1.7%) | 9 (4.4%) |
| 5 to 9 Minutes | 19 (4.1%) | 10 (4.9%) |
| 10 to 14 Minutes | 56 (12.0%) | 0 (0.0%) |
| 15 to 19 Minutes | 93 (20.0%) | 14 (6.8%) |
| 20 to 24 Minutes | 73 (15.7%) | 46 (22.4%) |
| 25 to 29 Minutes | 13 (2.8%) | 71 (34.6%) |
| 30 to 34 Minutes | 52 (11.2%) | 22 (10.7%) |
| 35 to 39 Minutes | 8 (1.7%) | 0 (0.0%) |
| 40 to 44 Minutes | 0 (0.0%) | 12 (5.9%) |
| 45 to 59 Minutes | 39 (8.4%) | 21 (10.2%) |
| 60 to 89 Minutes | 90 (19.3%) | 0 (0.0%) |
| 90 or more Minutes | 15 (3.2%) | 0 (0.0%) |
Time of Departure to Work by Sex in Woodville
The most frequent times of departure to work in Woodville are 12:00 AM to 4:59 AM (98, 21.0%) for males and 8:00 AM to 8:29 AM (77, 37.6%) for females.
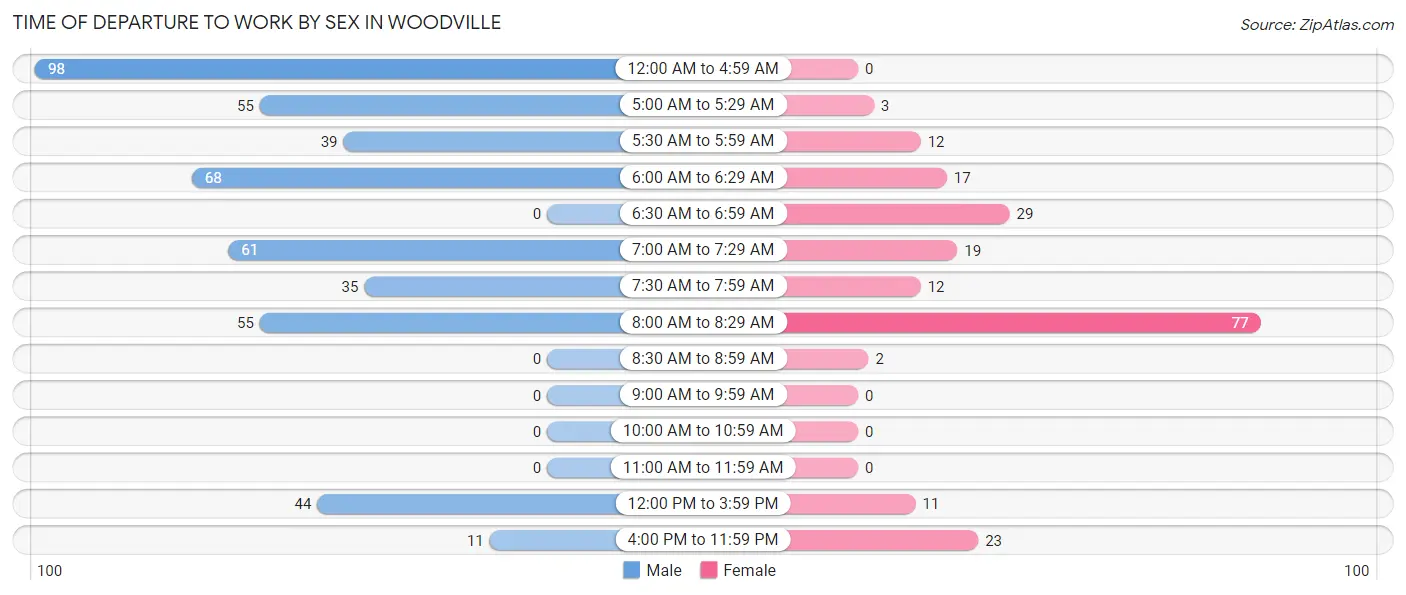
| Time of Departure | Male | Female |
| 12:00 AM to 4:59 AM | 98 (21.0%) | 0 (0.0%) |
| 5:00 AM to 5:29 AM | 55 (11.8%) | 3 (1.5%) |
| 5:30 AM to 5:59 AM | 39 (8.4%) | 12 (5.9%) |
| 6:00 AM to 6:29 AM | 68 (14.6%) | 17 (8.3%) |
| 6:30 AM to 6:59 AM | 0 (0.0%) | 29 (14.1%) |
| 7:00 AM to 7:29 AM | 61 (13.1%) | 19 (9.3%) |
| 7:30 AM to 7:59 AM | 35 (7.5%) | 12 (5.9%) |
| 8:00 AM to 8:29 AM | 55 (11.8%) | 77 (37.6%) |
| 8:30 AM to 8:59 AM | 0 (0.0%) | 2 (1.0%) |
| 9:00 AM to 9:59 AM | 0 (0.0%) | 0 (0.0%) |
| 10:00 AM to 10:59 AM | 0 (0.0%) | 0 (0.0%) |
| 11:00 AM to 11:59 AM | 0 (0.0%) | 0 (0.0%) |
| 12:00 PM to 3:59 PM | 44 (9.4%) | 11 (5.4%) |
| 4:00 PM to 11:59 PM | 11 (2.4%) | 23 (11.2%) |
| Total | 466 (100.0%) | 205 (100.0%) |
Housing Occupancy in Woodville
Occupancy by Ownership in Woodville
Of the total 438 dwellings in Woodville, owner-occupied units account for 256 (58.5%), while renter-occupied units make up 182 (41.5%).
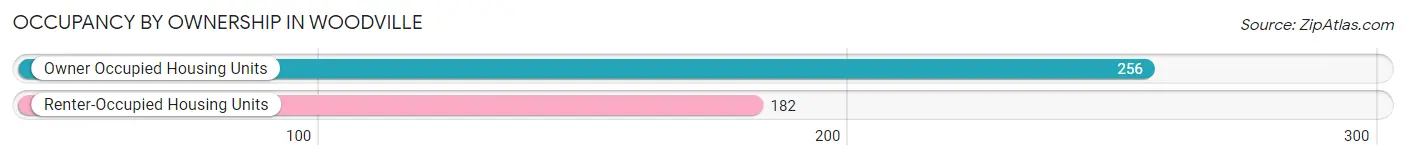
| Occupancy | # Housing Units | % Housing Units |
| Owner Occupied Housing Units | 256 | 58.5% |
| Renter-Occupied Housing Units | 182 | 41.5% |
| Total Occupied Housing Units | 438 | 100.0% |
Occupancy by Household Size in Woodville
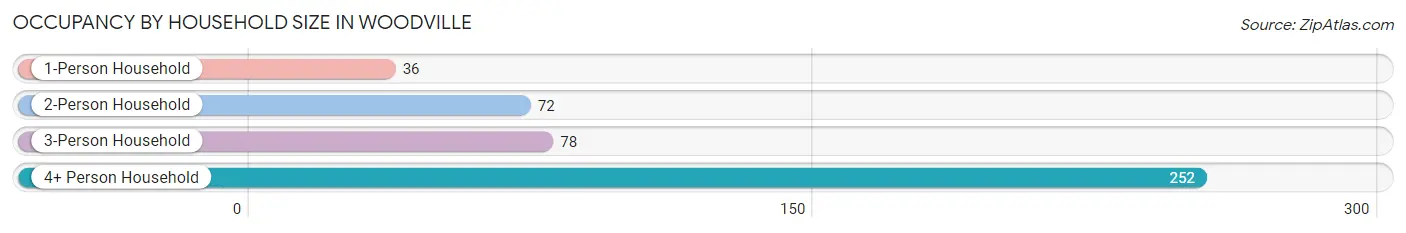
| Household Size | # Housing Units | % Housing Units |
| 1-Person Household | 36 | 8.2% |
| 2-Person Household | 72 | 16.4% |
| 3-Person Household | 78 | 17.8% |
| 4+ Person Household | 252 | 57.5% |
| Total Housing Units | 438 | 100.0% |
Occupancy by Ownership by Household Size in Woodville
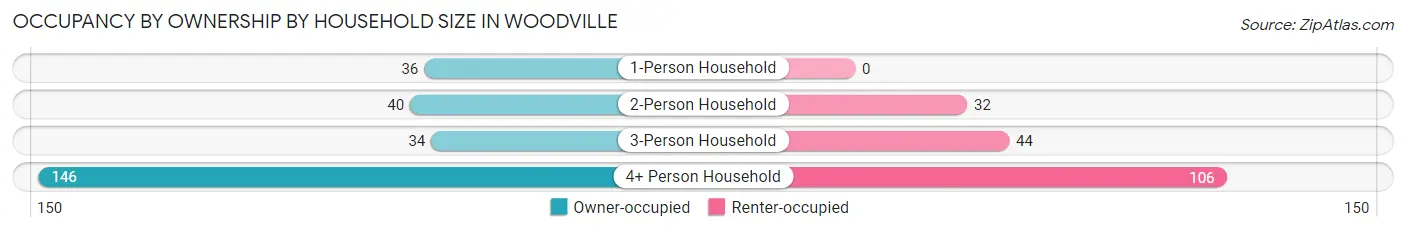
| Household Size | Owner-occupied | Renter-occupied |
| 1-Person Household | 36 (100.0%) | 0 (0.0%) |
| 2-Person Household | 40 (55.6%) | 32 (44.4%) |
| 3-Person Household | 34 (43.6%) | 44 (56.4%) |
| 4+ Person Household | 146 (57.9%) | 106 (42.1%) |
| Total Housing Units | 256 (58.5%) | 182 (41.5%) |
Occupancy by Educational Attainment in Woodville
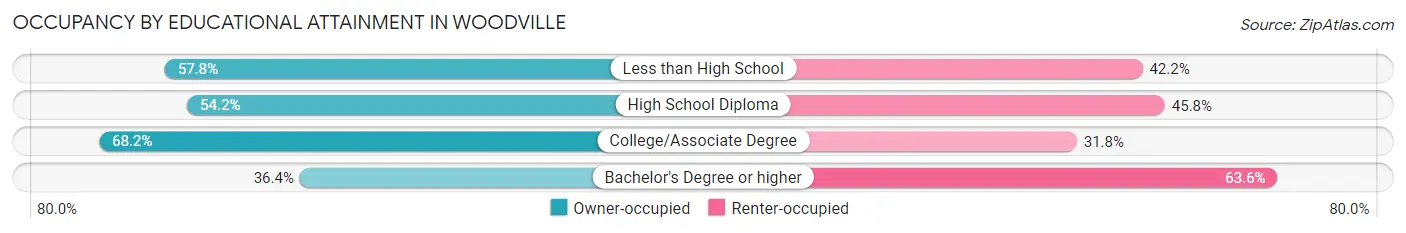
| Household Size | Owner-occupied | Renter-occupied |
| Less than High School | 134 (57.8%) | 98 (42.2%) |
| High School Diploma | 58 (54.2%) | 49 (45.8%) |
| College/Associate Degree | 60 (68.2%) | 28 (31.8%) |
| Bachelor's Degree or higher | 4 (36.4%) | 7 (63.6%) |
Occupancy by Age of Householder in Woodville
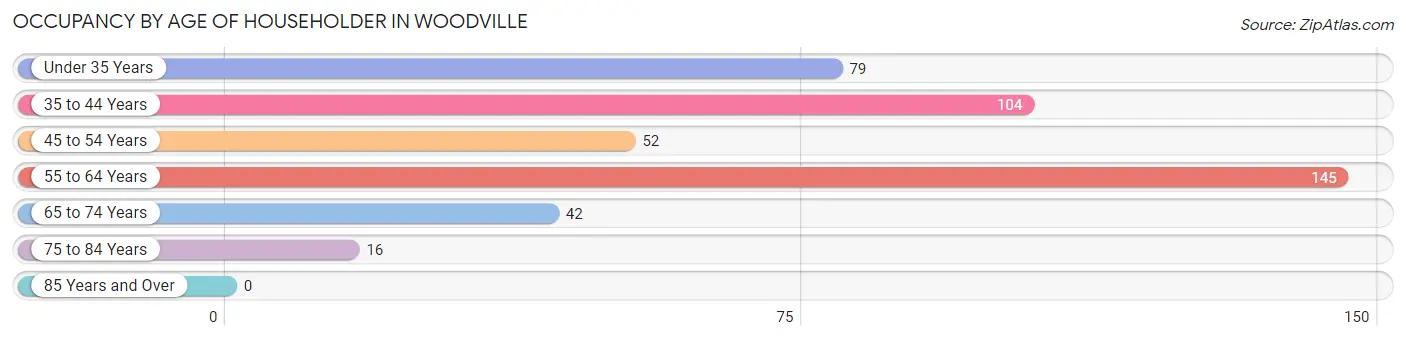
| Age Bracket | # Households | % Households |
| Under 35 Years | 79 | 18.0% |
| 35 to 44 Years | 104 | 23.7% |
| 45 to 54 Years | 52 | 11.9% |
| 55 to 64 Years | 145 | 33.1% |
| 65 to 74 Years | 42 | 9.6% |
| 75 to 84 Years | 16 | 3.6% |
| 85 Years and Over | 0 | 0.0% |
| Total | 438 | 100.0% |
Housing Finances in Woodville
Median Income by Occupancy in Woodville
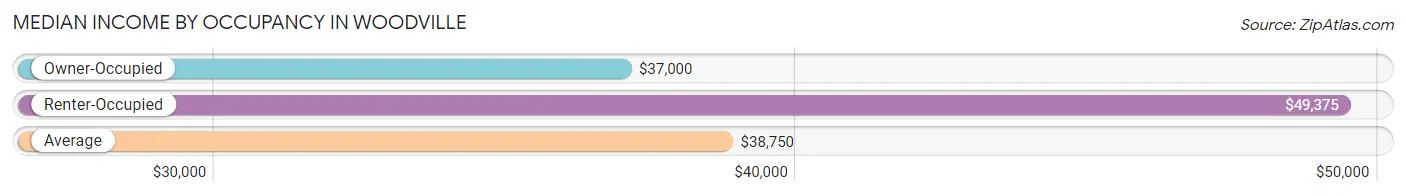
| Occupancy Type | # Households | Median Income |
| Owner-Occupied | 256 (58.5%) | $37,000 |
| Renter-Occupied | 182 (41.5%) | $49,375 |
| Average | 438 (100.0%) | $38,750 |
Occupancy by Householder Income Bracket in Woodville
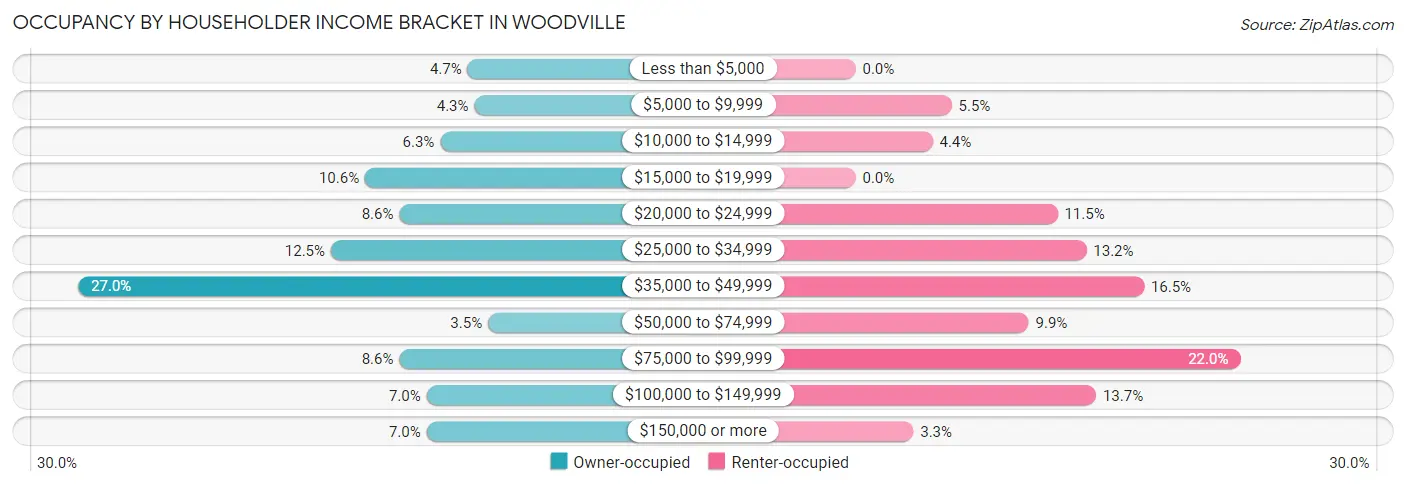
| Income Bracket | Owner-occupied | Renter-occupied |
| Less than $5,000 | 12 (4.7%) | 0 (0.0%) |
| $5,000 to $9,999 | 11 (4.3%) | 10 (5.5%) |
| $10,000 to $14,999 | 16 (6.2%) | 8 (4.4%) |
| $15,000 to $19,999 | 27 (10.5%) | 0 (0.0%) |
| $20,000 to $24,999 | 22 (8.6%) | 21 (11.5%) |
| $25,000 to $34,999 | 32 (12.5%) | 24 (13.2%) |
| $35,000 to $49,999 | 69 (27.0%) | 30 (16.5%) |
| $50,000 to $74,999 | 9 (3.5%) | 18 (9.9%) |
| $75,000 to $99,999 | 22 (8.6%) | 40 (22.0%) |
| $100,000 to $149,999 | 18 (7.0%) | 25 (13.7%) |
| $150,000 or more | 18 (7.0%) | 6 (3.3%) |
| Total | 256 (100.0%) | 182 (100.0%) |
Monthly Housing Cost Tiers in Woodville
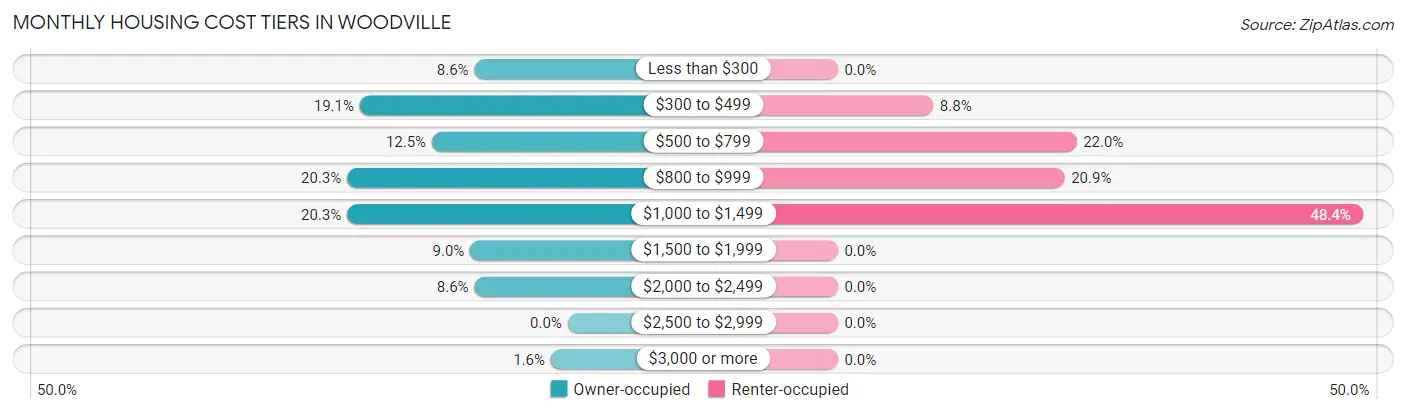
| Monthly Cost | Owner-occupied | Renter-occupied |
| Less than $300 | 22 (8.6%) | 0 (0.0%) |
| $300 to $499 | 49 (19.1%) | 16 (8.8%) |
| $500 to $799 | 32 (12.5%) | 40 (22.0%) |
| $800 to $999 | 52 (20.3%) | 38 (20.9%) |
| $1,000 to $1,499 | 52 (20.3%) | 88 (48.3%) |
| $1,500 to $1,999 | 23 (9.0%) | 0 (0.0%) |
| $2,000 to $2,499 | 22 (8.6%) | 0 (0.0%) |
| $2,500 to $2,999 | 0 (0.0%) | 0 (0.0%) |
| $3,000 or more | 4 (1.6%) | 0 (0.0%) |
| Total | 256 (100.0%) | 182 (100.0%) |
Physical Housing Characteristics in Woodville
Housing Structures in Woodville
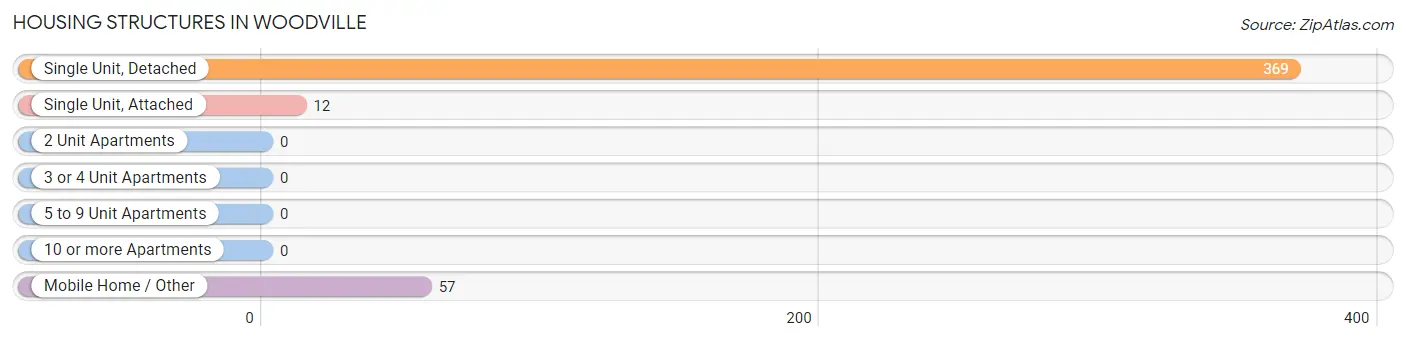
| Structure Type | # Housing Units | % Housing Units |
| Single Unit, Detached | 369 | 84.3% |
| Single Unit, Attached | 12 | 2.7% |
| 2 Unit Apartments | 0 | 0.0% |
| 3 or 4 Unit Apartments | 0 | 0.0% |
| 5 to 9 Unit Apartments | 0 | 0.0% |
| 10 or more Apartments | 0 | 0.0% |
| Mobile Home / Other | 57 | 13.0% |
| Total | 438 | 100.0% |
Housing Structures by Occupancy in Woodville
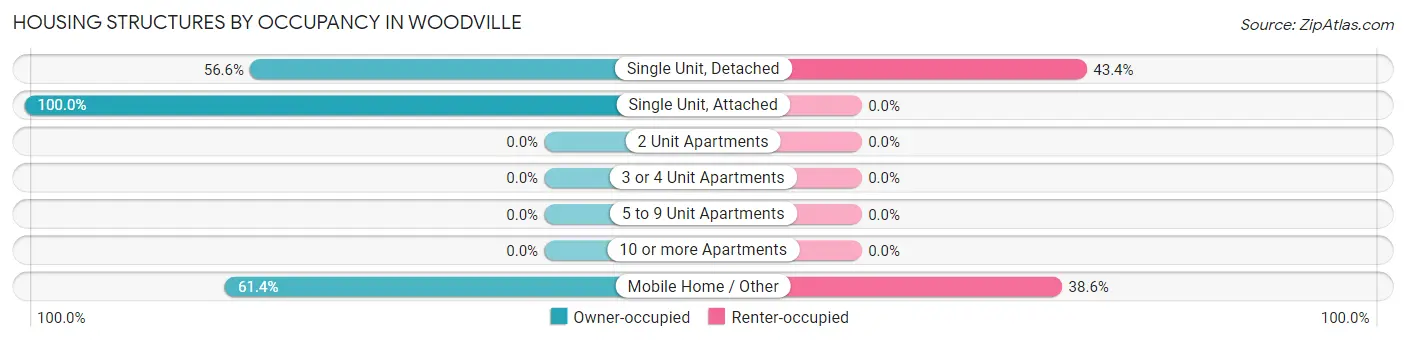
| Structure Type | Owner-occupied | Renter-occupied |
| Single Unit, Detached | 209 (56.6%) | 160 (43.4%) |
| Single Unit, Attached | 12 (100.0%) | 0 (0.0%) |
| 2 Unit Apartments | 0 (0.0%) | 0 (0.0%) |
| 3 or 4 Unit Apartments | 0 (0.0%) | 0 (0.0%) |
| 5 to 9 Unit Apartments | 0 (0.0%) | 0 (0.0%) |
| 10 or more Apartments | 0 (0.0%) | 0 (0.0%) |
| Mobile Home / Other | 35 (61.4%) | 22 (38.6%) |
| Total | 256 (58.5%) | 182 (41.5%) |
Housing Structures by Number of Rooms in Woodville
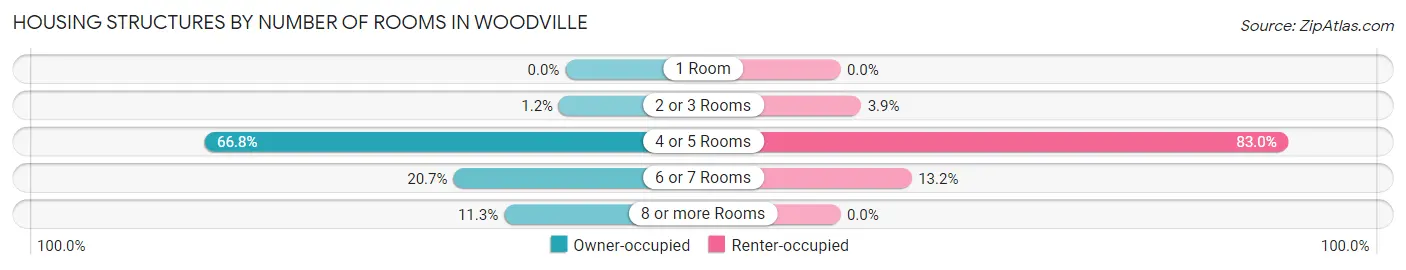
| Number of Rooms | Owner-occupied | Renter-occupied |
| 1 Room | 0 (0.0%) | 0 (0.0%) |
| 2 or 3 Rooms | 3 (1.2%) | 7 (3.8%) |
| 4 or 5 Rooms | 171 (66.8%) | 151 (83.0%) |
| 6 or 7 Rooms | 53 (20.7%) | 24 (13.2%) |
| 8 or more Rooms | 29 (11.3%) | 0 (0.0%) |
| Total | 256 (100.0%) | 182 (100.0%) |
Housing Structure by Heating Type in Woodville
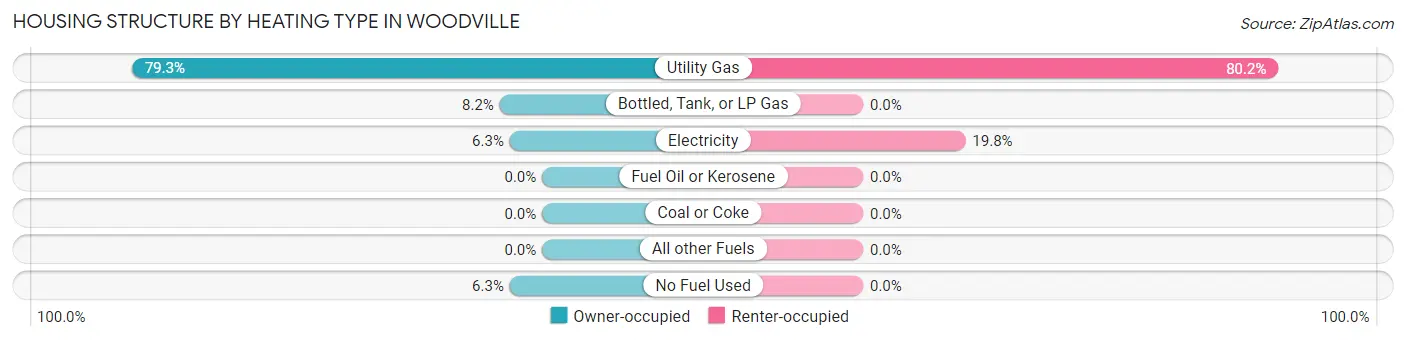
| Heating Type | Owner-occupied | Renter-occupied |
| Utility Gas | 203 (79.3%) | 146 (80.2%) |
| Bottled, Tank, or LP Gas | 21 (8.2%) | 0 (0.0%) |
| Electricity | 16 (6.2%) | 36 (19.8%) |
| Fuel Oil or Kerosene | 0 (0.0%) | 0 (0.0%) |
| Coal or Coke | 0 (0.0%) | 0 (0.0%) |
| All other Fuels | 0 (0.0%) | 0 (0.0%) |
| No Fuel Used | 16 (6.2%) | 0 (0.0%) |
| Total | 256 (100.0%) | 182 (100.0%) |
Household Vehicle Usage in Woodville
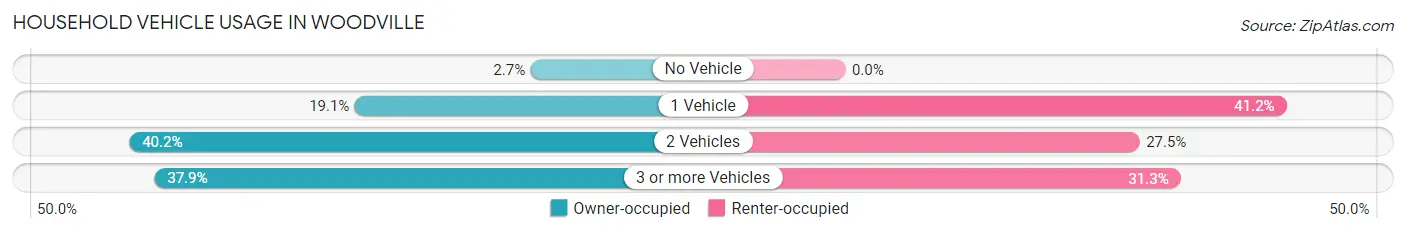
| Vehicles per Household | Owner-occupied | Renter-occupied |
| No Vehicle | 7 (2.7%) | 0 (0.0%) |
| 1 Vehicle | 49 (19.1%) | 75 (41.2%) |
| 2 Vehicles | 103 (40.2%) | 50 (27.5%) |
| 3 or more Vehicles | 97 (37.9%) | 57 (31.3%) |
| Total | 256 (100.0%) | 182 (100.0%) |
Real Estate & Mortgages in Woodville
Real Estate and Mortgage Overview in Woodville
| Characteristic | Without Mortgage | With Mortgage |
| Housing Units | 110 | 146 |
| Median Property Value | $191,700 | $161,900 |
| Median Household Income | $30,500 | $10 |
| Monthly Housing Costs | $385 | $4 |
| Real Estate Taxes | $1,154 | $13 |
Property Value by Mortgage Status in Woodville
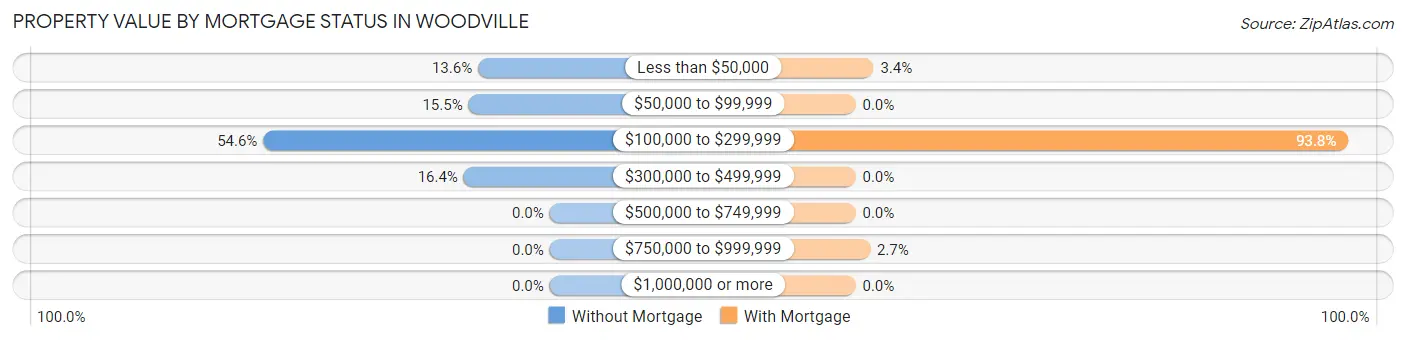
| Property Value | Without Mortgage | With Mortgage |
| Less than $50,000 | 15 (13.6%) | 5 (3.4%) |
| $50,000 to $99,999 | 17 (15.4%) | 0 (0.0%) |
| $100,000 to $299,999 | 60 (54.5%) | 137 (93.8%) |
| $300,000 to $499,999 | 18 (16.4%) | 0 (0.0%) |
| $500,000 to $749,999 | 0 (0.0%) | 0 (0.0%) |
| $750,000 to $999,999 | 0 (0.0%) | 4 (2.7%) |
| $1,000,000 or more | 0 (0.0%) | 0 (0.0%) |
| Total | 110 (100.0%) | 146 (100.0%) |
Household Income by Mortgage Status in Woodville
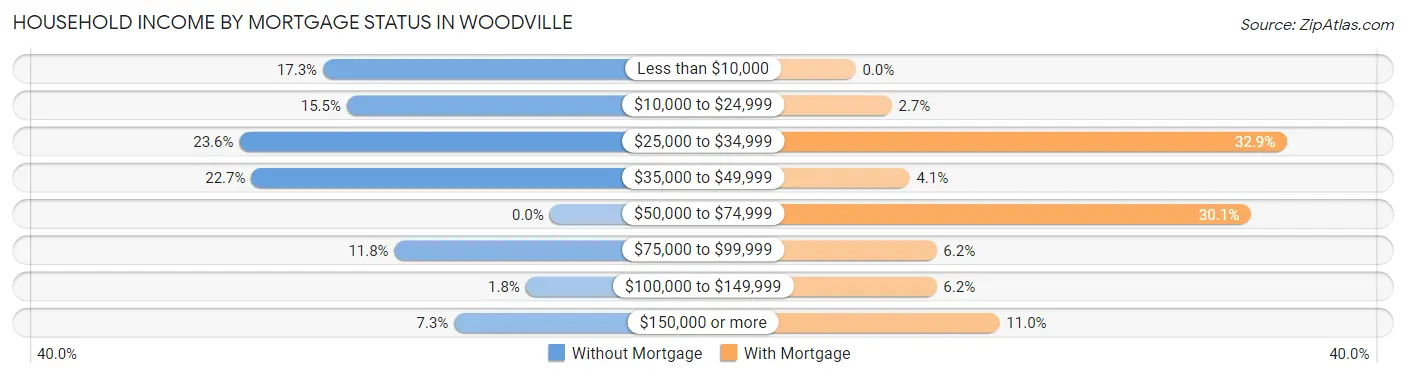
| Household Income | Without Mortgage | With Mortgage |
| Less than $10,000 | 19 (17.3%) | 0 (0.0%) |
| $10,000 to $24,999 | 17 (15.4%) | 4 (2.7%) |
| $25,000 to $34,999 | 26 (23.6%) | 48 (32.9%) |
| $35,000 to $49,999 | 25 (22.7%) | 6 (4.1%) |
| $50,000 to $74,999 | 0 (0.0%) | 44 (30.1%) |
| $75,000 to $99,999 | 13 (11.8%) | 9 (6.2%) |
| $100,000 to $149,999 | 2 (1.8%) | 9 (6.2%) |
| $150,000 or more | 8 (7.3%) | 16 (11.0%) |
| Total | 110 (100.0%) | 146 (100.0%) |
Property Value to Household Income Ratio in Woodville
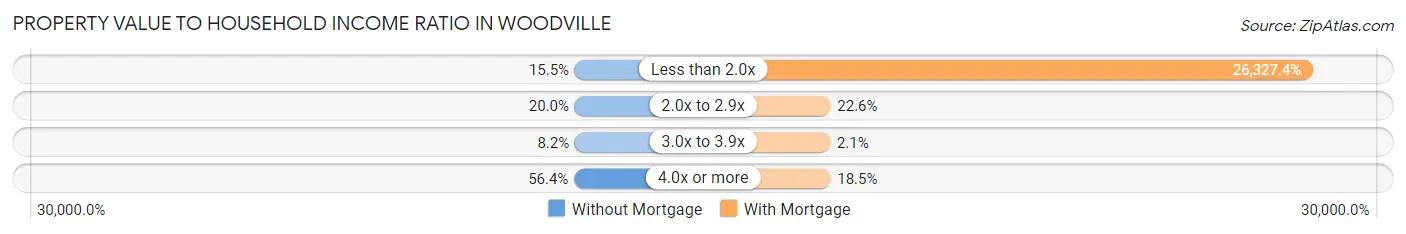
| Value-to-Income Ratio | Without Mortgage | With Mortgage |
| Less than 2.0x | 17 (15.4%) | 38,438 (26,327.4%) |
| 2.0x to 2.9x | 22 (20.0%) | 33 (22.6%) |
| 3.0x to 3.9x | 9 (8.2%) | 3 (2.1%) |
| 4.0x or more | 62 (56.4%) | 27 (18.5%) |
| Total | 110 (100.0%) | 146 (100.0%) |
Real Estate Taxes by Mortgage Status in Woodville
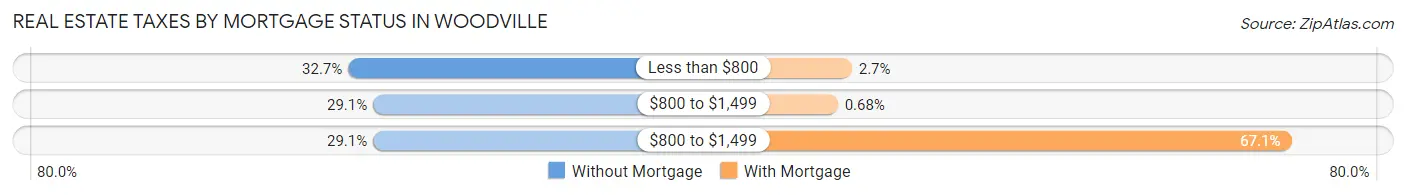
| Property Taxes | Without Mortgage | With Mortgage |
| Less than $800 | 36 (32.7%) | 4 (2.7%) |
| $800 to $1,499 | 32 (29.1%) | 1 (0.7%) |
| $800 to $1,499 | 32 (29.1%) | 98 (67.1%) |
| Total | 110 (100.0%) | 146 (100.0%) |
Health & Disability in Woodville
Health Insurance Coverage by Age in Woodville
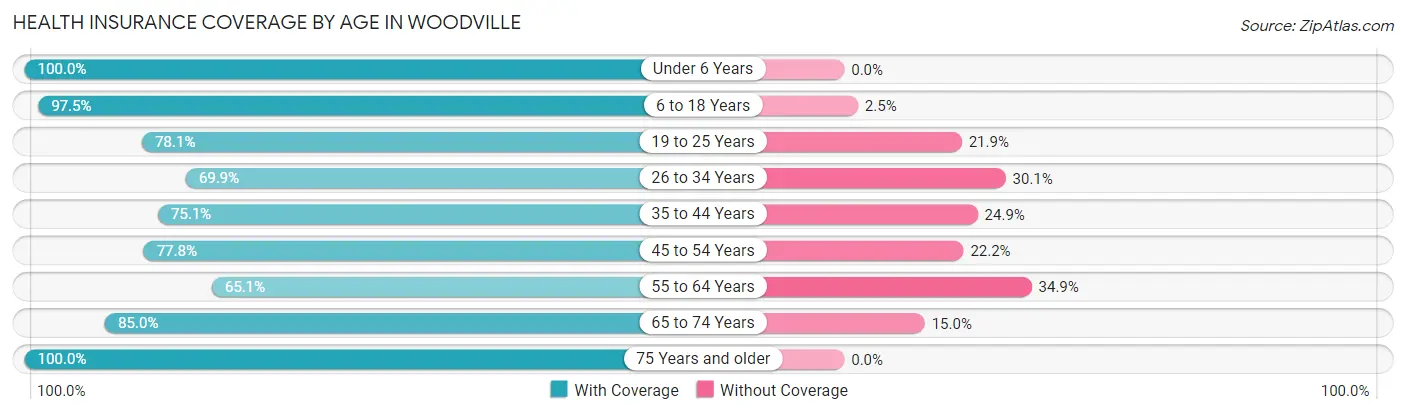
| Age Bracket | With Coverage | Without Coverage |
| Under 6 Years | 208 (100.0%) | 0 (0.0%) |
| 6 to 18 Years | 383 (97.5%) | 10 (2.5%) |
| 19 to 25 Years | 214 (78.1%) | 60 (21.9%) |
| 26 to 34 Years | 179 (69.9%) | 77 (30.1%) |
| 35 to 44 Years | 145 (75.1%) | 48 (24.9%) |
| 45 to 54 Years | 112 (77.8%) | 32 (22.2%) |
| 55 to 64 Years | 149 (65.1%) | 80 (34.9%) |
| 65 to 74 Years | 68 (85.0%) | 12 (15.0%) |
| 75 Years and older | 53 (100.0%) | 0 (0.0%) |
| Total | 1,511 (82.6%) | 319 (17.4%) |
Health Insurance Coverage by Citizenship Status in Woodville
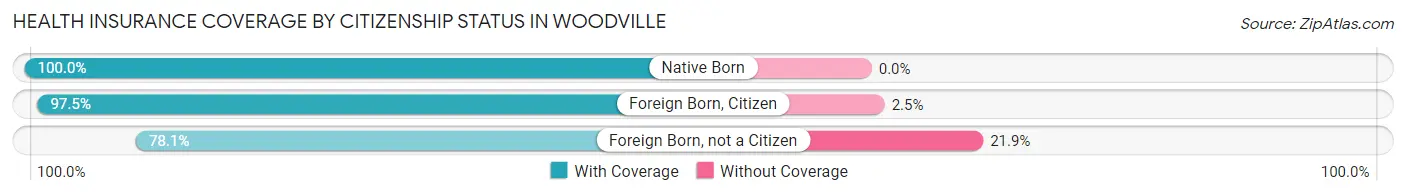
| Citizenship Status | With Coverage | Without Coverage |
| Native Born | 208 (100.0%) | 0 (0.0%) |
| Foreign Born, Citizen | 383 (97.5%) | 10 (2.5%) |
| Foreign Born, not a Citizen | 214 (78.1%) | 60 (21.9%) |
Health Insurance Coverage by Household Income in Woodville
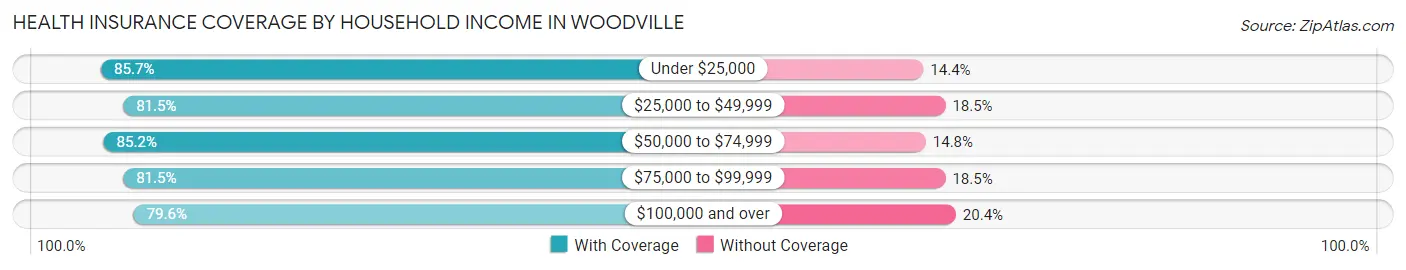
| Household Income | With Coverage | Without Coverage |
| Under $25,000 | 364 (85.7%) | 61 (14.3%) |
| $25,000 to $49,999 | 472 (81.5%) | 107 (18.5%) |
| $50,000 to $74,999 | 184 (85.2%) | 32 (14.8%) |
| $75,000 to $99,999 | 238 (81.5%) | 54 (18.5%) |
| $100,000 and over | 253 (79.6%) | 65 (20.4%) |
Public vs Private Health Insurance Coverage by Age in Woodville
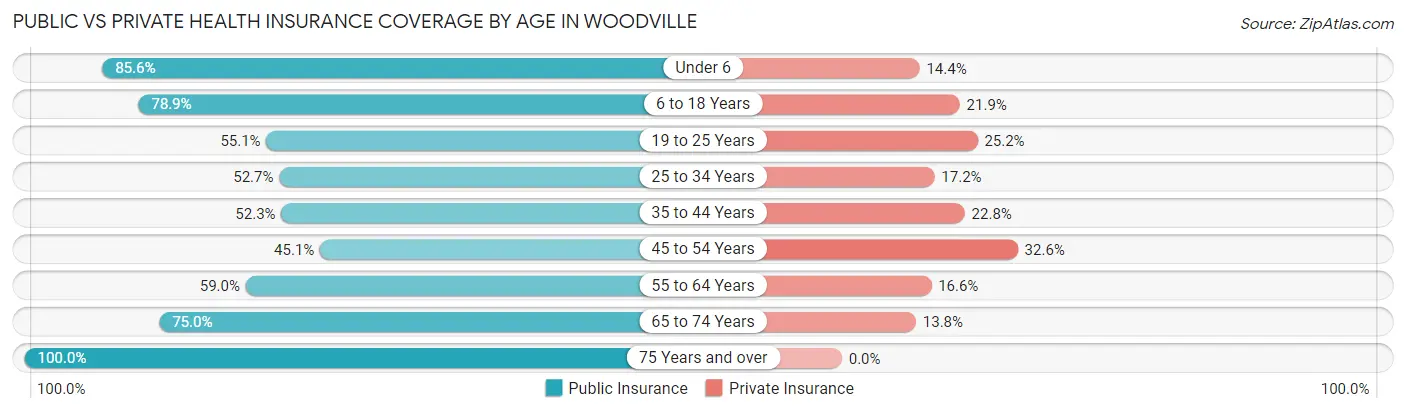
| Age Bracket | Public Insurance | Private Insurance |
| Under 6 | 178 (85.6%) | 30 (14.4%) |
| 6 to 18 Years | 310 (78.9%) | 86 (21.9%) |
| 19 to 25 Years | 151 (55.1%) | 69 (25.2%) |
| 25 to 34 Years | 135 (52.7%) | 44 (17.2%) |
| 35 to 44 Years | 101 (52.3%) | 44 (22.8%) |
| 45 to 54 Years | 65 (45.1%) | 47 (32.6%) |
| 55 to 64 Years | 135 (59.0%) | 38 (16.6%) |
| 65 to 74 Years | 60 (75.0%) | 11 (13.8%) |
| 75 Years and over | 53 (100.0%) | 0 (0.0%) |
| Total | 1,188 (64.9%) | 369 (20.2%) |
Disability Status by Sex by Age in Woodville
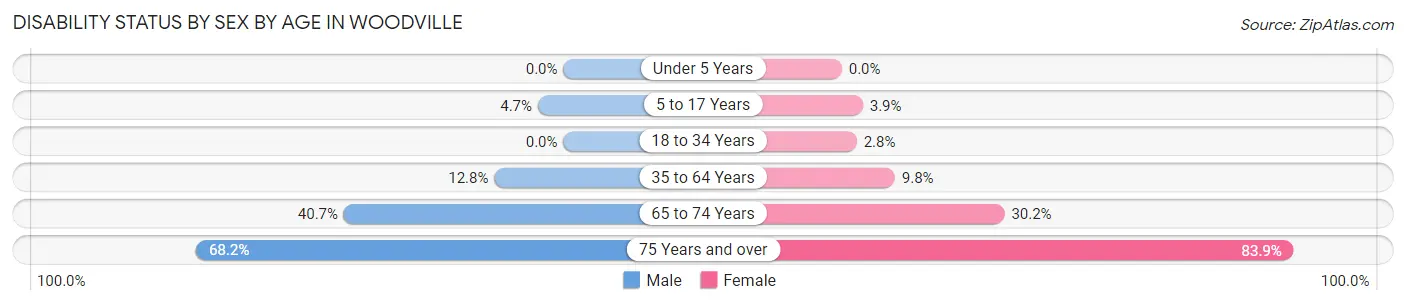
| Age Bracket | Male | Female |
| Under 5 Years | 0 (0.0%) | 0 (0.0%) |
| 5 to 17 Years | 8 (4.7%) | 8 (3.9%) |
| 18 to 34 Years | 0 (0.0%) | 8 (2.8%) |
| 35 to 64 Years | 40 (12.8%) | 25 (9.8%) |
| 65 to 74 Years | 11 (40.7%) | 16 (30.2%) |
| 75 Years and over | 15 (68.2%) | 26 (83.9%) |
Disability Class by Sex by Age in Woodville
Disability Class: Hearing Difficulty
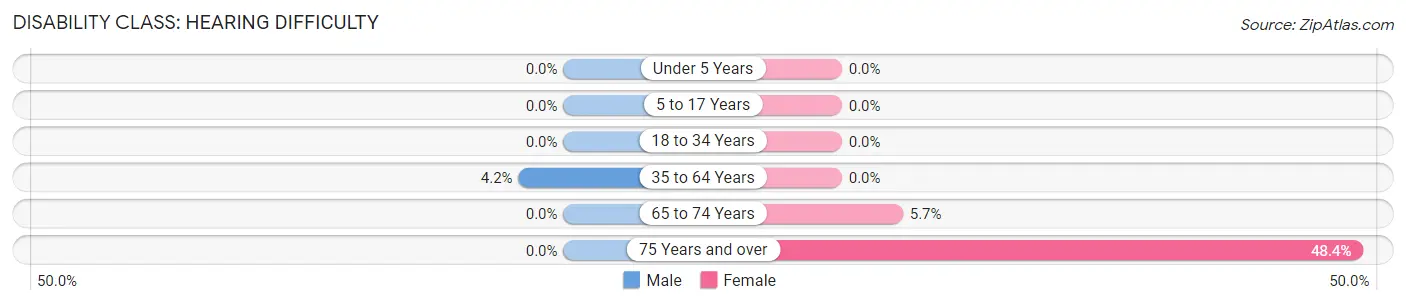
| Age Bracket | Male | Female |
| Under 5 Years | 0 (0.0%) | 0 (0.0%) |
| 5 to 17 Years | 0 (0.0%) | 0 (0.0%) |
| 18 to 34 Years | 0 (0.0%) | 0 (0.0%) |
| 35 to 64 Years | 13 (4.2%) | 0 (0.0%) |
| 65 to 74 Years | 0 (0.0%) | 3 (5.7%) |
| 75 Years and over | 0 (0.0%) | 15 (48.4%) |
Disability Class: Vision Difficulty
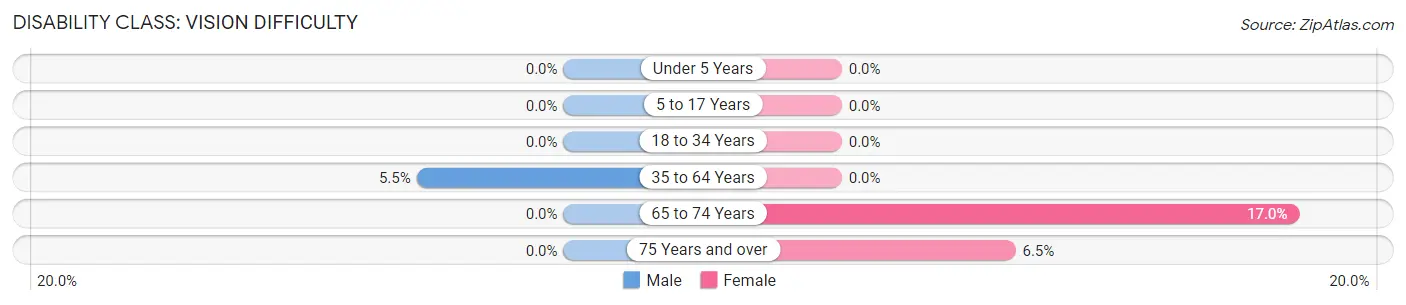
| Age Bracket | Male | Female |
| Under 5 Years | 0 (0.0%) | 0 (0.0%) |
| 5 to 17 Years | 0 (0.0%) | 0 (0.0%) |
| 18 to 34 Years | 0 (0.0%) | 0 (0.0%) |
| 35 to 64 Years | 17 (5.4%) | 0 (0.0%) |
| 65 to 74 Years | 0 (0.0%) | 9 (17.0%) |
| 75 Years and over | 0 (0.0%) | 2 (6.5%) |
Disability Class: Cognitive Difficulty
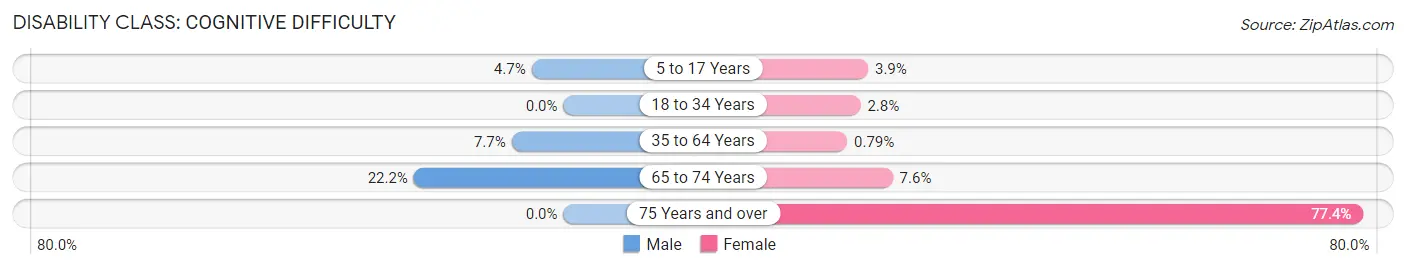
| Age Bracket | Male | Female |
| 5 to 17 Years | 8 (4.7%) | 8 (3.9%) |
| 18 to 34 Years | 0 (0.0%) | 8 (2.8%) |
| 35 to 64 Years | 24 (7.7%) | 2 (0.8%) |
| 65 to 74 Years | 6 (22.2%) | 4 (7.5%) |
| 75 Years and over | 0 (0.0%) | 24 (77.4%) |
Disability Class: Ambulatory Difficulty
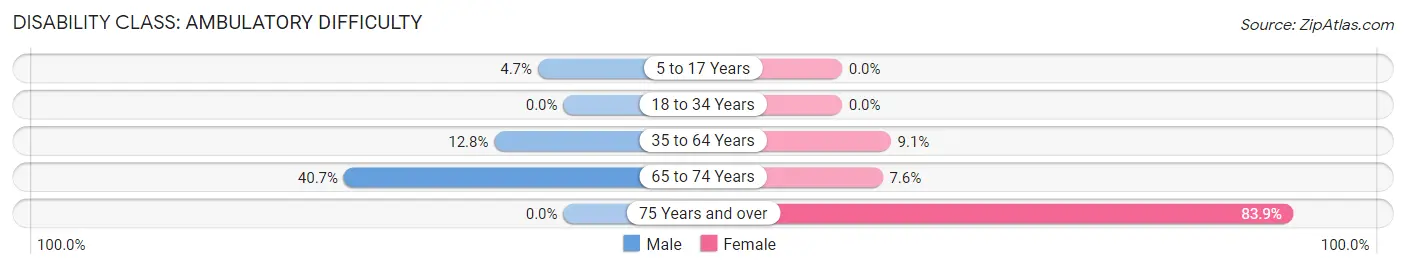
| Age Bracket | Male | Female |
| 5 to 17 Years | 8 (4.7%) | 0 (0.0%) |
| 18 to 34 Years | 0 (0.0%) | 0 (0.0%) |
| 35 to 64 Years | 40 (12.8%) | 23 (9.1%) |
| 65 to 74 Years | 11 (40.7%) | 4 (7.5%) |
| 75 Years and over | 0 (0.0%) | 26 (83.9%) |
Disability Class: Self-Care Difficulty
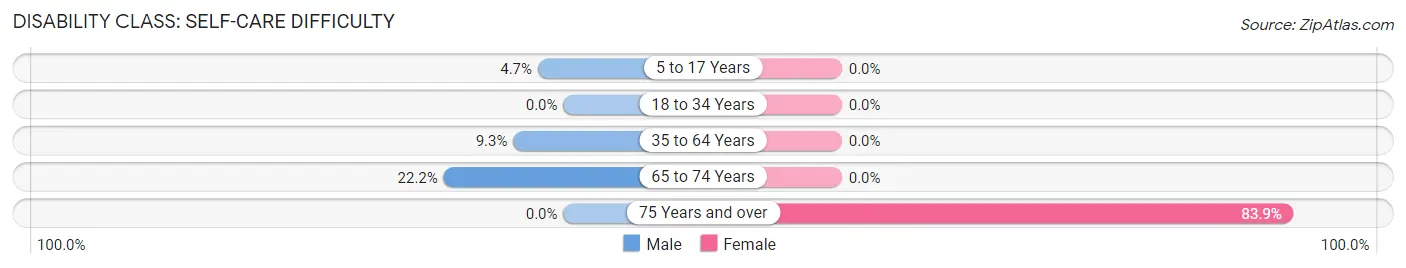
| Age Bracket | Male | Female |
| 5 to 17 Years | 8 (4.7%) | 0 (0.0%) |
| 18 to 34 Years | 0 (0.0%) | 0 (0.0%) |
| 35 to 64 Years | 29 (9.3%) | 0 (0.0%) |
| 65 to 74 Years | 6 (22.2%) | 0 (0.0%) |
| 75 Years and over | 0 (0.0%) | 26 (83.9%) |
Technology Access in Woodville
Computing Device Access in Woodville
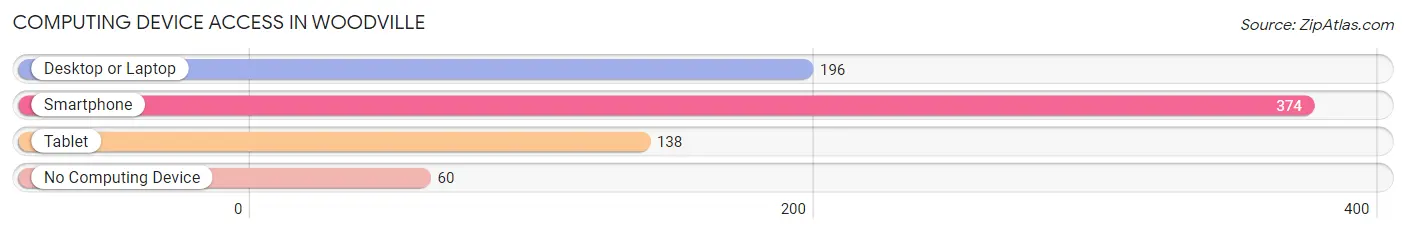
| Device Type | # Households | % Households |
| Desktop or Laptop | 196 | 44.8% |
| Smartphone | 374 | 85.4% |
| Tablet | 138 | 31.5% |
| No Computing Device | 60 | 13.7% |
| Total | 438 | 100.0% |
Internet Access in Woodville
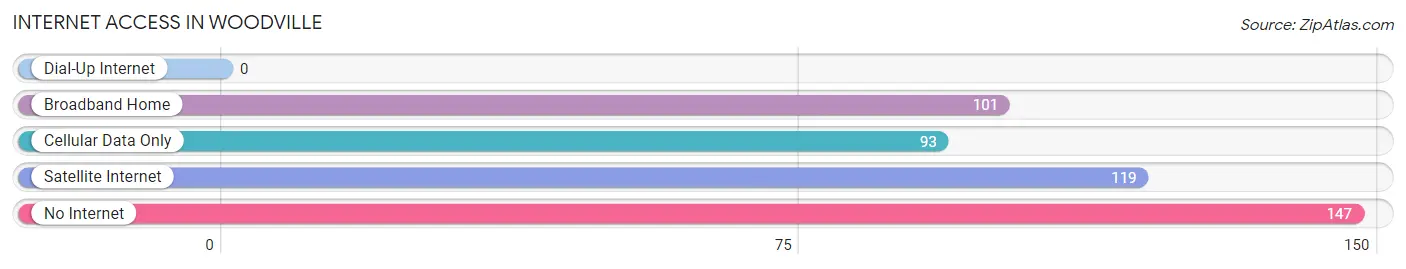
| Internet Type | # Households | % Households |
| Dial-Up Internet | 0 | 0.0% |
| Broadband Home | 101 | 23.1% |
| Cellular Data Only | 93 | 21.2% |
| Satellite Internet | 119 | 27.2% |
| No Internet | 147 | 33.6% |
| Total | 438 | 100.0% |
Woodville Summary
Woodville is a small unincorporated community located in the Sierra Nevada foothills of California, in El Dorado County. It is situated in the western part of the county, about 10 miles east of Placerville. The population of Woodville is estimated to be around 500 people.
History
Woodville was founded in 1849 by a group of miners who were searching for gold in the area. The town was named after a local miner, William Wood, who was one of the first to discover gold in the area. The town quickly grew as more miners arrived and began to build homes and businesses. By the late 1850s, Woodville had become a bustling mining town with a population of over 1,000 people.
The town was home to several businesses, including a hotel, saloon, general store, and blacksmith shop. It also had a post office, which opened in 1851. The town was also home to a school, which opened in 1854.
In the late 1800s, the population of Woodville began to decline as the gold rush ended and miners moved away. By the early 1900s, the population had dropped to around 500 people.
Geography
Woodville is located in the Sierra Nevada foothills of California, in El Dorado County. It is situated in the western part of the county, about 10 miles east of Placerville. The town is surrounded by rolling hills and is located at an elevation of 2,400 feet.
The climate in Woodville is mild and temperate, with hot summers and cool winters. The average annual temperature is around 60 degrees Fahrenheit. The average annual precipitation is around 25 inches.
Economy
The economy of Woodville is largely based on tourism and agriculture. The town is home to several wineries and vineyards, which attract visitors from all over the world. The town is also home to several small businesses, including restaurants, shops, and galleries.
The town is also home to several farms, which produce a variety of fruits and vegetables. The town is also home to several ranches, which raise cattle and horses.
Demographics
The population of Woodville is estimated to be around 500 people. The town is predominantly white, with a small Hispanic population. The median household income is around $50,000. The median age is around 40 years old.
Conclusion
Woodville is a small unincorporated community located in the Sierra Nevada foothills of California, in El Dorado County. It is situated in the western part of the county, about 10 miles east of Placerville. The population of Woodville is estimated to be around 500 people. The town was founded in 1849 by a group of miners who were searching for gold in the area. The economy of Woodville is largely based on tourism and agriculture. The town is predominantly white, with a small Hispanic population. The median household income is around $50,000. The median age is around 40 years old.
Common Questions
What is Per Capita Income in Woodville?
Per Capita income in Woodville is $14,039.
What is the Median Family Income in Woodville?
Median Family Income in Woodville is $39,406.
What is the Median Household income in Woodville?
Median Household Income in Woodville is $38,750.
What is Income or Wage Gap in Woodville?
Income or Wage Gap in Woodville is 49.8%.
Women in Woodville earn 50.2 cents for every dollar earned by a man.
What is Inequality or Gini Index in Woodville?
Inequality or Gini Index in Woodville is 0.42.
What is the Total Population of Woodville?
Total Population of Woodville is 1,830.
What is the Total Male Population of Woodville?
Total Male Population of Woodville is 872.
What is the Total Female Population of Woodville?
Total Female Population of Woodville is 958.
What is the Ratio of Males per 100 Females in Woodville?
There are 91.02 Males per 100 Females in Woodville.
What is the Ratio of Females per 100 Males in Woodville?
There are 109.86 Females per 100 Males in Woodville.
What is the Median Population Age in Woodville?
Median Population Age in Woodville is 26.7 Years.
What is the Average Family Size in Woodville
Average Family Size in Woodville is 4.5 People.
What is the Average Household Size in Woodville
Average Household Size in Woodville is 4.2 People.
How Large is the Labor Force in Woodville?
There are 789 People in the Labor Forcein in Woodville.
What is the Percentage of People in the Labor Force in Woodville?
59.2% of People are in the Labor Force in Woodville.
What is the Unemployment Rate in Woodville?
Unemployment Rate in Woodville is 11.3%.