Cities with the Highest Poverty Level Among Children Under the Age of 5 in Tennessee
RELATED REPORTS & OPTIONS
Highest Poverty | Child 0-5
Tennessee
Compare Cities
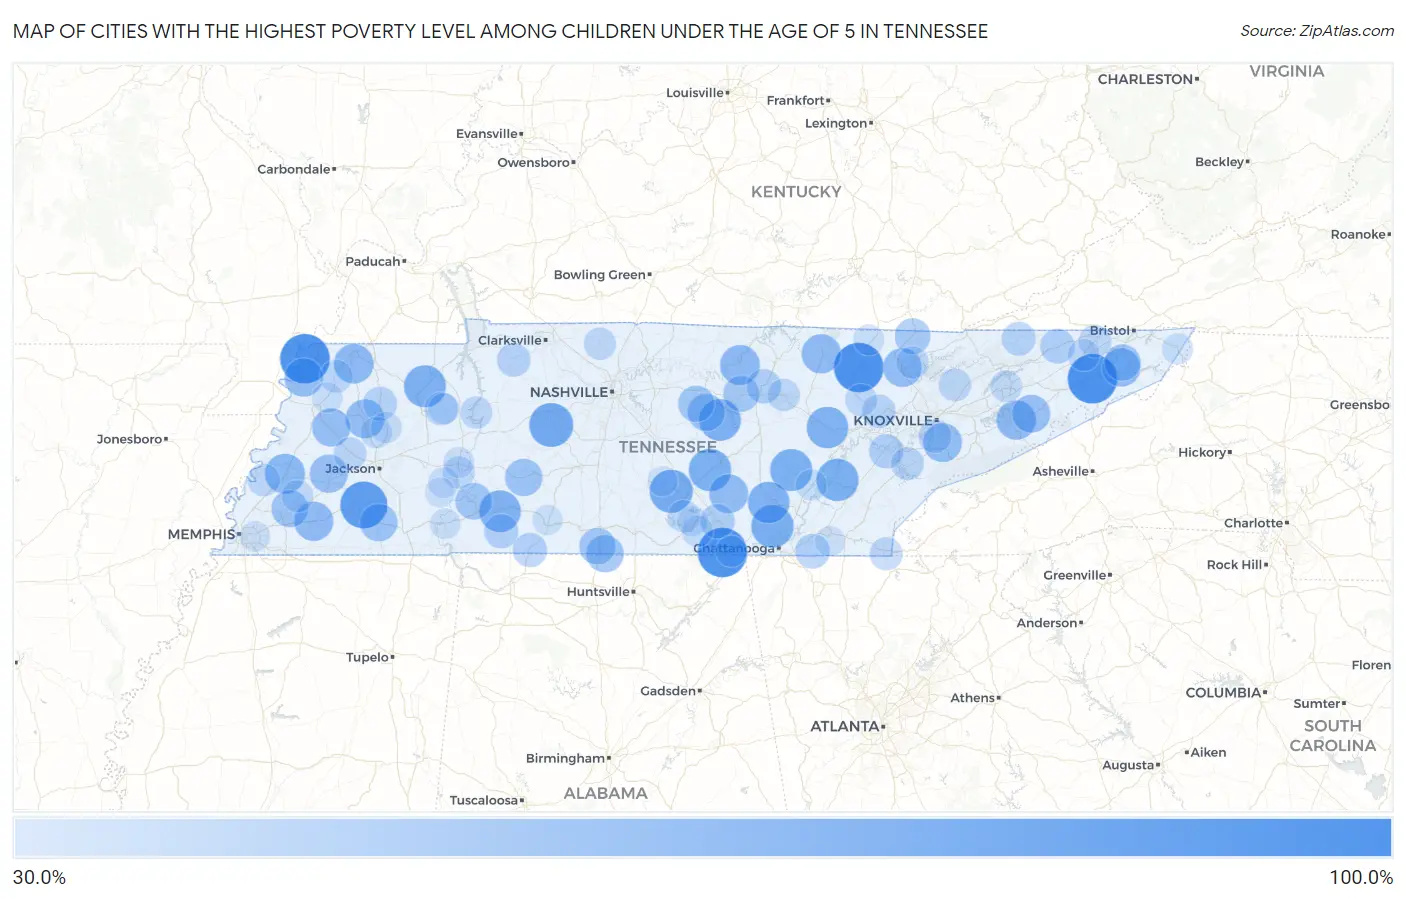
Map of Cities with the Highest Poverty Level Among Children Under the Age of 5 in Tennessee
0.0%
100.0%
Cities with the Highest Poverty Level Among Children Under the Age of 5 in Tennessee
| City | Child Poverty | vs State | vs National | |
| 1. | Tiptonville | 100.0% | 21.4%(+78.6)#1 | 18.1%(+81.9)#11 |
| 2. | Telford | 100.0% | 21.4%(+78.6)#2 | 18.1%(+81.9)#172 |
| 3. | John Sevier | 100.0% | 21.4%(+78.6)#3 | 18.1%(+81.9)#203 |
| 4. | Cosby | 100.0% | 21.4%(+78.6)#4 | 18.1%(+81.9)#267 |
| 5. | Sequatchie | 100.0% | 21.4%(+78.6)#5 | 18.1%(+81.9)#321 |
| 6. | Briceville | 100.0% | 21.4%(+78.6)#6 | 18.1%(+81.9)#423 |
| 7. | Randolph | 100.0% | 21.4%(+78.6)#7 | 18.1%(+81.9)#595 |
| 8. | Elgin | 100.0% | 21.4%(+78.6)#8 | 18.1%(+81.9)#645 |
| 9. | Farner | 100.0% | 21.4%(+78.6)#9 | 18.1%(+81.9)#723 |
| 10. | Dukedom | 100.0% | 21.4%(+78.6)#10 | 18.1%(+81.9)#731 |
| 11. | Orme | 100.0% | 21.4%(+78.6)#11 | 18.1%(+81.9)#879 |
| 12. | Toone | 91.4% | 21.4%(+70.0)#12 | 18.1%(+73.4)#998 |
| 13. | Bon Aqua Junction | 82.5% | 21.4%(+61.1)#13 | 18.1%(+64.4)#1,250 |
| 14. | Normandy | 80.0% | 21.4%(+58.6)#14 | 18.1%(+61.9)#1,356 |
| 15. | Lone Oak | 77.8% | 21.4%(+56.4)#15 | 18.1%(+59.7)#1,408 |
| 16. | Morrison | 77.3% | 21.4%(+55.9)#16 | 18.1%(+59.2)#1,432 |
| 17. | Decatur | 76.7% | 21.4%(+55.4)#17 | 18.1%(+58.7)#1,460 |
| 18. | Pikeville | 76.5% | 21.4%(+55.1)#18 | 18.1%(+58.5)#1,465 |
| 19. | Henry | 76.3% | 21.4%(+54.9)#19 | 18.1%(+58.2)#1,476 |
| 20. | Smithville | 75.6% | 21.4%(+54.2)#20 | 18.1%(+57.5)#1,497 |
| 21. | Waynesboro | 75.2% | 21.4%(+53.8)#21 | 18.1%(+57.1)#1,507 |
| 22. | Crab Orchard | 75.0% | 21.4%(+53.6)#22 | 18.1%(+56.9)#1,515 |
| 23. | Dunlap | 74.9% | 21.4%(+53.5)#23 | 18.1%(+56.8)#1,560 |
| 24. | Covington | 69.9% | 21.4%(+48.5)#24 | 18.1%(+51.9)#1,791 |
| 25. | Gainesboro | 69.4% | 21.4%(+48.1)#25 | 18.1%(+51.4)#1,815 |
| 26. | Rives | 68.8% | 21.4%(+47.4)#26 | 18.1%(+50.7)#1,860 |
| 27. | Newport | 68.1% | 21.4%(+46.7)#27 | 18.1%(+50.0)#1,891 |
| 28. | Jamestown | 67.6% | 21.4%(+46.2)#28 | 18.1%(+49.5)#1,924 |
| 29. | Somerville | 67.6% | 21.4%(+46.2)#29 | 18.1%(+49.5)#1,927 |
| 30. | Wildwood | 66.7% | 21.4%(+45.3)#30 | 18.1%(+48.6)#1,972 |
| 31. | Altamont | 66.7% | 21.4%(+45.3)#31 | 18.1%(+48.6)#1,976 |
| 32. | Caryville | 66.3% | 21.4%(+44.9)#32 | 18.1%(+48.2)#2,045 |
| 33. | Trenton | 66.2% | 21.4%(+44.9)#33 | 18.1%(+48.2)#2,046 |
| 34. | Central | 65.5% | 21.4%(+44.1)#34 | 18.1%(+47.5)#2,076 |
| 35. | Ridgely | 65.5% | 21.4%(+44.1)#35 | 18.1%(+47.4)#2,080 |
| 36. | Friendship | 64.5% | 21.4%(+43.1)#36 | 18.1%(+46.5)#2,153 |
| 37. | Brownsville | 64.0% | 21.4%(+42.6)#37 | 18.1%(+45.9)#2,186 |
| 38. | Parrottsville | 63.6% | 21.4%(+42.2)#38 | 18.1%(+45.6)#2,212 |
| 39. | Hornsby | 62.5% | 21.4%(+41.1)#39 | 18.1%(+44.4)#2,305 |
| 40. | Ardmore | 61.9% | 21.4%(+40.5)#40 | 18.1%(+43.8)#2,346 |
| 41. | Hohenwald | 61.8% | 21.4%(+40.4)#41 | 18.1%(+43.7)#2,355 |
| 42. | Dowelltown | 61.5% | 21.4%(+40.1)#42 | 18.1%(+43.5)#2,384 |
| 43. | Gallaway | 60.9% | 21.4%(+39.5)#43 | 18.1%(+42.8)#2,441 |
| 44. | Clifton | 60.0% | 21.4%(+38.6)#44 | 18.1%(+41.9)#2,490 |
| 45. | Elkton | 59.2% | 21.4%(+37.8)#45 | 18.1%(+41.1)#2,591 |
| 46. | Watauga | 58.8% | 21.4%(+37.4)#46 | 18.1%(+40.8)#2,616 |
| 47. | Alexandria | 58.7% | 21.4%(+37.3)#47 | 18.1%(+40.6)#2,633 |
| 48. | Baxter | 58.2% | 21.4%(+36.8)#48 | 18.1%(+40.1)#2,682 |
| 49. | Jellico | 57.1% | 21.4%(+35.8)#49 | 18.1%(+39.1)#2,748 |
| 50. | Rocky Top | 55.8% | 21.4%(+34.4)#50 | 18.1%(+37.7)#2,884 |
| 51. | Surgoinsville | 53.5% | 21.4%(+32.1)#51 | 18.1%(+35.4)#3,084 |
| 52. | Monteagle | 53.5% | 21.4%(+32.1)#52 | 18.1%(+35.4)#3,085 |
| 53. | Apison | 53.2% | 21.4%(+31.8)#53 | 18.1%(+35.2)#3,119 |
| 54. | Algood | 52.9% | 21.4%(+31.5)#54 | 18.1%(+34.8)#3,156 |
| 55. | Loudon | 52.6% | 21.4%(+31.2)#55 | 18.1%(+34.5)#3,182 |
| 56. | Collinwood | 52.3% | 21.4%(+30.9)#56 | 18.1%(+34.2)#3,210 |
| 57. | St Joseph | 52.0% | 21.4%(+30.6)#57 | 18.1%(+33.9)#3,232 |
| 58. | Valley Forge | 52.0% | 21.4%(+30.6)#58 | 18.1%(+33.9)#3,236 |
| 59. | Bradford | 51.4% | 21.4%(+30.0)#59 | 18.1%(+33.3)#3,296 |
| 60. | Sneedville | 50.8% | 21.4%(+29.5)#60 | 18.1%(+32.8)#3,340 |
| 61. | Cumberland City | 50.0% | 21.4%(+28.6)#61 | 18.1%(+31.9)#3,483 |
| 62. | Coalfield | 49.7% | 21.4%(+28.3)#62 | 18.1%(+31.7)#3,587 |
| 63. | Hollow Rock | 49.4% | 21.4%(+28.0)#63 | 18.1%(+31.4)#3,611 |
| 64. | Rockford | 48.9% | 21.4%(+27.5)#64 | 18.1%(+30.9)#3,649 |
| 65. | Greenback | 48.8% | 21.4%(+27.4)#65 | 18.1%(+30.7)#3,668 |
| 66. | Bells | 48.5% | 21.4%(+27.1)#66 | 18.1%(+30.4)#3,700 |
| 67. | Copperhill | 48.0% | 21.4%(+26.6)#67 | 18.1%(+29.9)#3,754 |
| 68. | Kingsport | 47.4% | 21.4%(+26.1)#68 | 18.1%(+29.4)#3,812 |
| 69. | Luttrell | 47.3% | 21.4%(+25.9)#69 | 18.1%(+29.2)#3,832 |
| 70. | Obion | 47.3% | 21.4%(+25.9)#70 | 18.1%(+29.2)#3,835 |
| 71. | Gilt Edge | 47.1% | 21.4%(+25.7)#71 | 18.1%(+29.0)#3,869 |
| 72. | Monterey | 46.8% | 21.4%(+25.4)#72 | 18.1%(+28.7)#3,902 |
| 73. | Griffith Creek | 46.4% | 21.4%(+25.0)#73 | 18.1%(+28.4)#3,954 |
| 74. | La Follette | 46.3% | 21.4%(+24.9)#74 | 18.1%(+28.2)#3,965 |
| 75. | Springfield | 46.2% | 21.4%(+24.8)#75 | 18.1%(+28.1)#3,983 |
| 76. | Decaturville | 46.0% | 21.4%(+24.6)#76 | 18.1%(+27.9)#4,024 |
| 77. | Estill Springs | 45.9% | 21.4%(+24.5)#77 | 18.1%(+27.8)#4,035 |
| 78. | Wartburg | 45.8% | 21.4%(+24.4)#78 | 18.1%(+27.8)#4,042 |
| 79. | Fall Branch | 45.8% | 21.4%(+24.4)#79 | 18.1%(+27.8)#4,043 |
| 80. | New Johnsonville | 45.8% | 21.4%(+24.4)#80 | 18.1%(+27.7)#4,054 |
| 81. | Mason | 45.5% | 21.4%(+24.1)#81 | 18.1%(+27.4)#4,078 |
| 82. | Morristown | 44.9% | 21.4%(+23.5)#82 | 18.1%(+26.8)#4,164 |
| 83. | Gibson | 44.4% | 21.4%(+23.1)#83 | 18.1%(+26.4)#4,218 |
| 84. | Cowan | 44.1% | 21.4%(+22.7)#84 | 18.1%(+26.0)#4,282 |
| 85. | South Pittsburg | 43.2% | 21.4%(+21.8)#85 | 18.1%(+25.1)#4,401 |
| 86. | Milan | 43.2% | 21.4%(+21.8)#86 | 18.1%(+25.1)#4,405 |
| 87. | Dayton | 43.0% | 21.4%(+21.6)#87 | 18.1%(+24.9)#4,430 |
| 88. | Bruceton | 42.9% | 21.4%(+21.5)#88 | 18.1%(+24.8)#4,444 |
| 89. | Mountain City | 42.5% | 21.4%(+21.1)#89 | 18.1%(+24.5)#4,513 |
| 90. | Scotts Hill | 42.3% | 21.4%(+20.9)#90 | 18.1%(+24.2)#4,541 |
| 91. | Oneida | 42.2% | 21.4%(+20.8)#91 | 18.1%(+24.1)#4,559 |
| 92. | Parsons | 41.9% | 21.4%(+20.5)#92 | 18.1%(+23.8)#4,599 |
| 93. | Newbern | 41.9% | 21.4%(+20.5)#93 | 18.1%(+23.8)#4,601 |
| 94. | Savannah | 41.7% | 21.4%(+20.3)#94 | 18.1%(+23.6)#4,622 |
| 95. | Decherd | 40.7% | 21.4%(+19.3)#95 | 18.1%(+22.6)#4,767 |
| 96. | Lawrenceburg | 40.6% | 21.4%(+19.2)#96 | 18.1%(+22.5)#4,785 |
| 97. | Memphis | 40.5% | 21.4%(+19.1)#97 | 18.1%(+22.5)#4,791 |
| 98. | Wildwood Lake | 40.5% | 21.4%(+19.1)#98 | 18.1%(+22.4)#4,794 |
| 99. | Wartrace | 40.3% | 21.4%(+18.9)#99 | 18.1%(+22.3)#4,817 |
| 100. | Sardis | 40.0% | 21.4%(+18.6)#100 | 18.1%(+21.9)#4,882 |
Common Questions
What are the Top 10 Cities with the Highest Poverty Level Among Children Under the Age of 5 in Tennessee?
Top 10 Cities with the Highest Poverty Level Among Children Under the Age of 5 in Tennessee are:
#1
100.0%
#2
100.0%
#3
100.0%
#4
100.0%
#5
91.4%
#6
82.5%
#7
80.0%
#8
77.8%
#9
77.3%
#10
76.7%
What city has the Highest Poverty Level Among Children Under the Age of 5 in Tennessee?
Tiptonville has the Highest Poverty Level Among Children Under the Age of 5 in Tennessee with 100.0%.
What is the Poverty Level Among Children Under the Age of 5 in the State of Tennessee?
Poverty Level Among Children Under the Age of 5 in Tennessee is 21.4%.
What is the Poverty Level Among Children Under the Age of 5 in the United States?
Poverty Level Among Children Under the Age of 5 in the United States is 18.1%.