Cities with the Highest Poverty Level Among Children Under the Age of 5 in New Mexico
RELATED REPORTS & OPTIONS
Highest Poverty | Child 0-5
New Mexico
Compare Cities
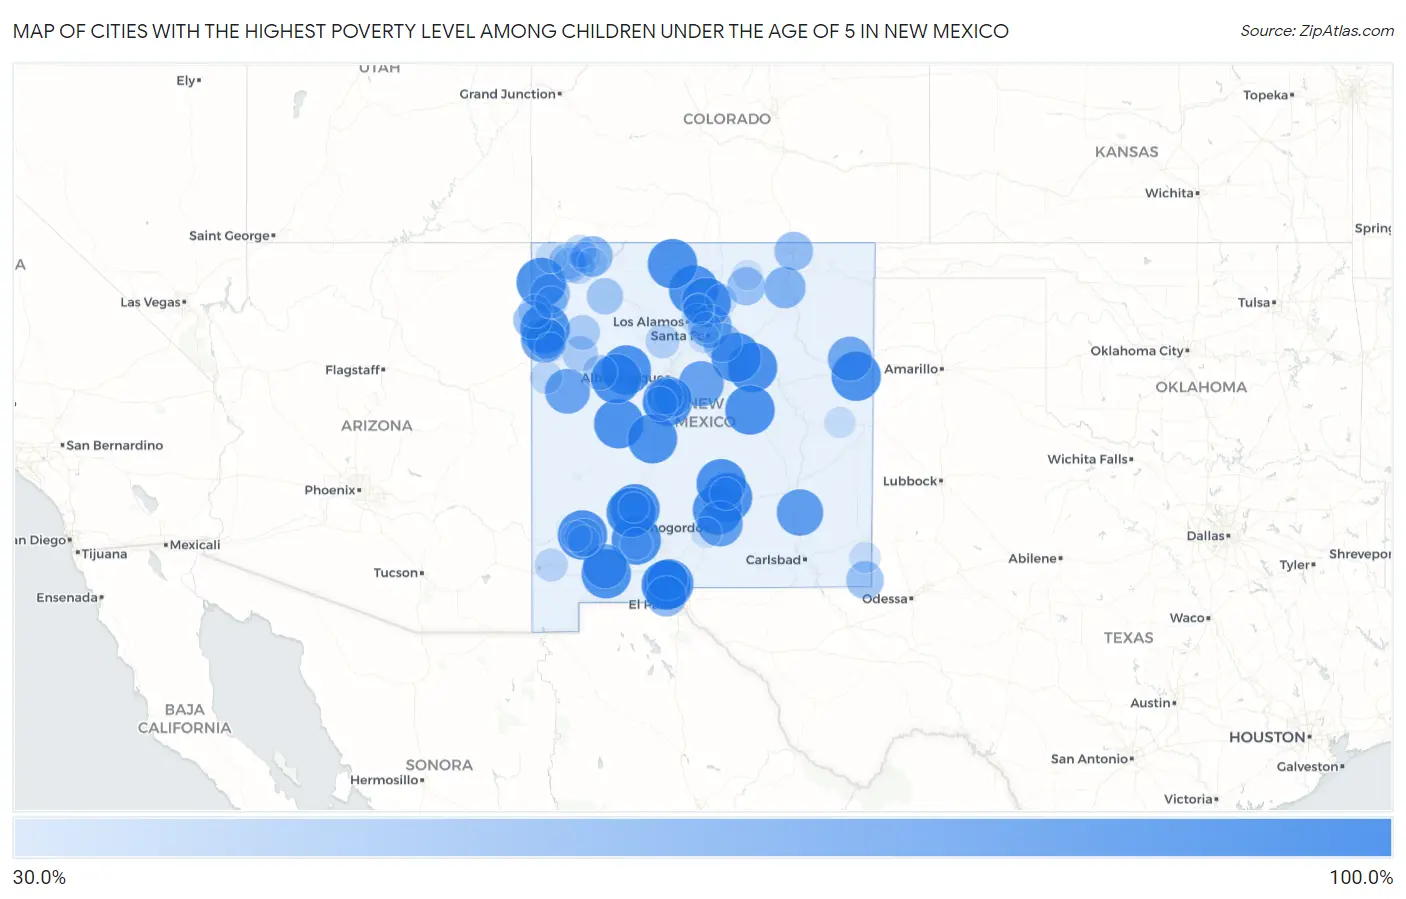
Map of Cities with the Highest Poverty Level Among Children Under the Age of 5 in New Mexico
0.0%
100.0%
Cities with the Highest Poverty Level Among Children Under the Age of 5 in New Mexico
| City | Child Poverty | vs State | vs National | |
| 1. | Ruidoso Downs | 100.0% | 27.4%(+72.6)#1 | 18.1%(+81.9)#36 |
| 2. | Santa Clara | 100.0% | 27.4%(+72.6)#2 | 18.1%(+81.9)#70 |
| 3. | Elephant Butte | 100.0% | 27.4%(+72.6)#3 | 18.1%(+81.9)#85 |
| 4. | Berino | 100.0% | 27.4%(+72.6)#4 | 18.1%(+81.9)#124 |
| 5. | Alamo | 100.0% | 27.4%(+72.6)#5 | 18.1%(+81.9)#152 |
| 6. | El Rito | 100.0% | 27.4%(+72.6)#6 | 18.1%(+81.9)#174 |
| 7. | Mescalero | 100.0% | 27.4%(+72.6)#7 | 18.1%(+81.9)#193 |
| 8. | Salem | 100.0% | 27.4%(+72.6)#8 | 18.1%(+81.9)#200 |
| 9. | Williamsburg | 100.0% | 27.4%(+72.6)#9 | 18.1%(+81.9)#209 |
| 10. | Chamberino | 100.0% | 27.4%(+72.6)#10 | 18.1%(+81.9)#234 |
| 11. | La Hacienda | 100.0% | 27.4%(+72.6)#11 | 18.1%(+81.9)#256 |
| 12. | Monterey Park | 100.0% | 27.4%(+72.6)#12 | 18.1%(+81.9)#281 |
| 13. | Polvadera | 100.0% | 27.4%(+72.6)#13 | 18.1%(+81.9)#287 |
| 14. | Seboyeta | 100.0% | 27.4%(+72.6)#14 | 18.1%(+81.9)#307 |
| 15. | Placitas Cdp Dona Ana County | 100.0% | 27.4%(+72.6)#15 | 18.1%(+81.9)#308 |
| 16. | Tecolotito | 100.0% | 27.4%(+72.6)#17 | 18.1%(+81.9)#318 |
| 17. | Vaughn | 100.0% | 27.4%(+72.6)#18 | 18.1%(+81.9)#319 |
| 18. | Totah Vista | 100.0% | 27.4%(+72.6)#19 | 18.1%(+81.9)#335 |
| 19. | Tierra Amarilla | 100.0% | 27.4%(+72.6)#20 | 18.1%(+81.9)#365 |
| 20. | Homer C Jones | 100.0% | 27.4%(+72.6)#21 | 18.1%(+81.9)#403 |
| 21. | Ribera | 100.0% | 27.4%(+72.6)#22 | 18.1%(+81.9)#421 |
| 22. | Velarde | 100.0% | 27.4%(+72.6)#23 | 18.1%(+81.9)#466 |
| 23. | Sanostee | 100.0% | 27.4%(+72.6)#24 | 18.1%(+81.9)#478 |
| 24. | Becenti | 100.0% | 27.4%(+72.6)#25 | 18.1%(+81.9)#479 |
| 25. | Jamestown | 100.0% | 27.4%(+72.6)#26 | 18.1%(+81.9)#532 |
| 26. | North Acomita Village | 100.0% | 27.4%(+72.6)#27 | 18.1%(+81.9)#533 |
| 27. | Nakaibito | 100.0% | 27.4%(+72.6)#28 | 18.1%(+81.9)#552 |
| 28. | San Jon | 100.0% | 27.4%(+72.6)#29 | 18.1%(+81.9)#597 |
| 29. | Haystack | 100.0% | 27.4%(+72.6)#30 | 18.1%(+81.9)#615 |
| 30. | Borrego Pass | 100.0% | 27.4%(+72.6)#31 | 18.1%(+81.9)#741 |
| 31. | Nogal | 100.0% | 27.4%(+72.6)#32 | 18.1%(+81.9)#752 |
| 32. | Manuelito | 100.0% | 27.4%(+72.6)#33 | 18.1%(+81.9)#881 |
| 33. | Ojo Encino | 95.5% | 27.4%(+68.1)#34 | 18.1%(+77.4)#929 |
| 34. | Hagerman | 90.6% | 27.4%(+63.2)#35 | 18.1%(+72.5)#1,014 |
| 35. | Cloudcroft | 87.7% | 27.4%(+60.3)#36 | 18.1%(+69.7)#1,070 |
| 36. | Rock Springs | 87.1% | 27.4%(+59.7)#37 | 18.1%(+69.0)#1,097 |
| 37. | Moriarty | 86.5% | 27.4%(+59.2)#38 | 18.1%(+68.5)#1,114 |
| 38. | Pinehill | 85.7% | 27.4%(+58.3)#39 | 18.1%(+67.7)#1,138 |
| 39. | Logan | 83.3% | 27.4%(+56.0)#40 | 18.1%(+65.3)#1,209 |
| 40. | Keeler Farm | 83.3% | 27.4%(+55.9)#41 | 18.1%(+65.2)#1,237 |
| 41. | Pinedale | 82.2% | 27.4%(+54.8)#42 | 18.1%(+64.2)#1,257 |
| 42. | Prewitt | 80.0% | 27.4%(+52.6)#43 | 18.1%(+61.9)#1,326 |
| 43. | Chupadero | 80.0% | 27.4%(+52.6)#44 | 18.1%(+61.9)#1,341 |
| 44. | Springer | 74.0% | 27.4%(+46.6)#45 | 18.1%(+55.9)#1,584 |
| 45. | Sundance | 73.7% | 27.4%(+46.3)#46 | 18.1%(+55.6)#1,604 |
| 46. | Vado | 72.8% | 27.4%(+45.4)#47 | 18.1%(+54.7)#1,643 |
| 47. | El Cerro Mission | 72.4% | 27.4%(+45.0)#48 | 18.1%(+54.3)#1,658 |
| 48. | Gamerco | 71.6% | 27.4%(+44.2)#49 | 18.1%(+53.5)#1,688 |
| 49. | Santa Teresa | 71.4% | 27.4%(+44.0)#50 | 18.1%(+53.3)#1,717 |
| 50. | Aztec | 71.3% | 27.4%(+43.9)#51 | 18.1%(+53.2)#1,720 |
| 51. | Yah Ta Hey | 70.6% | 27.4%(+43.2)#52 | 18.1%(+52.5)#1,748 |
| 52. | Newcomb | 69.2% | 27.4%(+41.9)#53 | 18.1%(+51.2)#1,831 |
| 53. | Angustura | 68.2% | 27.4%(+40.8)#54 | 18.1%(+50.1)#1,886 |
| 54. | Pecos | 66.7% | 27.4%(+39.3)#55 | 18.1%(+48.6)#1,978 |
| 55. | Raton | 65.5% | 27.4%(+38.2)#56 | 18.1%(+47.5)#2,075 |
| 56. | Navajo | 64.6% | 27.4%(+37.2)#57 | 18.1%(+46.5)#2,149 |
| 57. | Angel Fire | 64.0% | 27.4%(+36.6)#58 | 18.1%(+45.9)#2,184 |
| 58. | Meadow Lake | 63.7% | 27.4%(+36.3)#59 | 18.1%(+45.6)#2,198 |
| 59. | Pena Blanca | 63.6% | 27.4%(+36.3)#60 | 18.1%(+45.6)#2,204 |
| 60. | Bayard | 63.4% | 27.4%(+36.1)#61 | 18.1%(+45.4)#2,228 |
| 61. | Jal | 62.3% | 27.4%(+34.9)#62 | 18.1%(+44.2)#2,325 |
| 62. | Nageezi | 58.8% | 27.4%(+31.4)#63 | 18.1%(+40.8)#2,619 |
| 63. | Valencia | 58.6% | 27.4%(+31.2)#64 | 18.1%(+40.5)#2,642 |
| 64. | Nenahnezad | 58.3% | 27.4%(+31.0)#65 | 18.1%(+40.3)#2,669 |
| 65. | Tortugas | 57.5% | 27.4%(+30.1)#66 | 18.1%(+39.4)#2,731 |
| 66. | Thoreau | 56.1% | 27.4%(+28.7)#67 | 18.1%(+38.0)#2,857 |
| 67. | Penasco | 55.6% | 27.4%(+28.2)#68 | 18.1%(+37.5)#2,906 |
| 68. | Ojo Amarillo | 55.2% | 27.4%(+27.8)#69 | 18.1%(+37.1)#2,960 |
| 69. | Grants | 54.3% | 27.4%(+27.0)#70 | 18.1%(+36.3)#3,017 |
| 70. | Crownpoint | 54.2% | 27.4%(+26.9)#71 | 18.1%(+36.2)#3,020 |
| 71. | Belen | 53.2% | 27.4%(+25.8)#72 | 18.1%(+35.1)#3,125 |
| 72. | Jemez Pueblo | 51.3% | 27.4%(+23.9)#73 | 18.1%(+33.3)#3,302 |
| 73. | Torreon Cdp Sandoval County | 50.0% | 27.4%(+22.6)#74 | 18.1%(+31.9)#3,460 |
| 74. | Crystal | 50.0% | 27.4%(+22.6)#75 | 18.1%(+31.9)#3,500 |
| 75. | Lordsburg | 48.8% | 27.4%(+21.4)#76 | 18.1%(+30.7)#3,663 |
| 76. | Crouch Mesa | 48.5% | 27.4%(+21.1)#77 | 18.1%(+30.4)#3,701 |
| 77. | Napi Headquarters | 48.0% | 27.4%(+20.6)#78 | 18.1%(+29.9)#3,752 |
| 78. | La Plata | 47.8% | 27.4%(+20.4)#79 | 18.1%(+29.8)#3,774 |
| 79. | Ruidoso | 47.3% | 27.4%(+19.9)#80 | 18.1%(+29.2)#3,837 |
| 80. | Black Rock | 47.1% | 27.4%(+19.8)#81 | 18.1%(+29.1)#3,853 |
| 81. | San Ildefonso Pueblo | 47.1% | 27.4%(+19.7)#82 | 18.1%(+29.0)#3,862 |
| 82. | Sheep Springs | 46.4% | 27.4%(+19.0)#83 | 18.1%(+28.4)#3,955 |
| 83. | Hatch | 45.3% | 27.4%(+18.0)#84 | 18.1%(+27.3)#4,107 |
| 84. | Hurley | 45.3% | 27.4%(+17.9)#85 | 18.1%(+27.2)#4,109 |
| 85. | Rio Lucio | 44.4% | 27.4%(+17.1)#86 | 18.1%(+26.4)#4,217 |
| 86. | Shiprock | 43.3% | 27.4%(+15.9)#87 | 18.1%(+25.2)#4,392 |
| 87. | Eunice | 43.3% | 27.4%(+15.9)#88 | 18.1%(+25.2)#4,395 |
| 88. | Hernandez | 43.1% | 27.4%(+15.7)#89 | 18.1%(+25.0)#4,415 |
| 89. | Tesuque Pueblo | 42.9% | 27.4%(+15.5)#90 | 18.1%(+24.8)#4,457 |
| 90. | Melrose | 42.9% | 27.4%(+15.5)#91 | 18.1%(+24.8)#4,459 |
| 91. | Flora Vista | 42.6% | 27.4%(+15.3)#92 | 18.1%(+24.6)#4,496 |
| 92. | Agua Fria | 42.1% | 27.4%(+14.7)#93 | 18.1%(+24.0)#4,568 |
| 93. | Boles Acres | 41.3% | 27.4%(+13.9)#94 | 18.1%(+23.2)#4,678 |
| 94. | Chamita | 41.3% | 27.4%(+13.9)#95 | 18.1%(+23.2)#4,680 |
| 95. | Truth Or Consequences | 41.1% | 27.4%(+13.7)#96 | 18.1%(+23.0)#4,715 |
| 96. | Kirtland Afb | 41.0% | 27.4%(+13.6)#97 | 18.1%(+22.9)#4,728 |
| 97. | Eagle Nest | 40.9% | 27.4%(+13.5)#98 | 18.1%(+22.8)#4,740 |
| 98. | Silver City | 40.6% | 27.4%(+13.2)#99 | 18.1%(+22.5)#4,780 |
| 99. | Gallup | 40.2% | 27.4%(+12.8)#100 | 18.1%(+22.1)#4,833 |
| 100. | Bloomfield | 39.6% | 27.4%(+12.2)#101 | 18.1%(+21.5)#4,970 |
Common Questions
What are the Top 10 Cities with the Highest Poverty Level Among Children Under the Age of 5 in New Mexico?
Top 10 Cities with the Highest Poverty Level Among Children Under the Age of 5 in New Mexico are:
#1
100.0%
#2
100.0%
#3
100.0%
#4
100.0%
#5
100.0%
#6
100.0%
#7
100.0%
#8
100.0%
#9
100.0%
#10
100.0%
What city has the Highest Poverty Level Among Children Under the Age of 5 in New Mexico?
Ruidoso Downs has the Highest Poverty Level Among Children Under the Age of 5 in New Mexico with 100.0%.
What is the Poverty Level Among Children Under the Age of 5 in the State of New Mexico?
Poverty Level Among Children Under the Age of 5 in New Mexico is 27.4%.
What is the Poverty Level Among Children Under the Age of 5 in the United States?
Poverty Level Among Children Under the Age of 5 in the United States is 18.1%.