Cities with the Highest Poverty Level Among Children Under the Age of 5 in Connecticut
RELATED REPORTS & OPTIONS
Highest Poverty | Child 0-5
Connecticut
Compare Cities
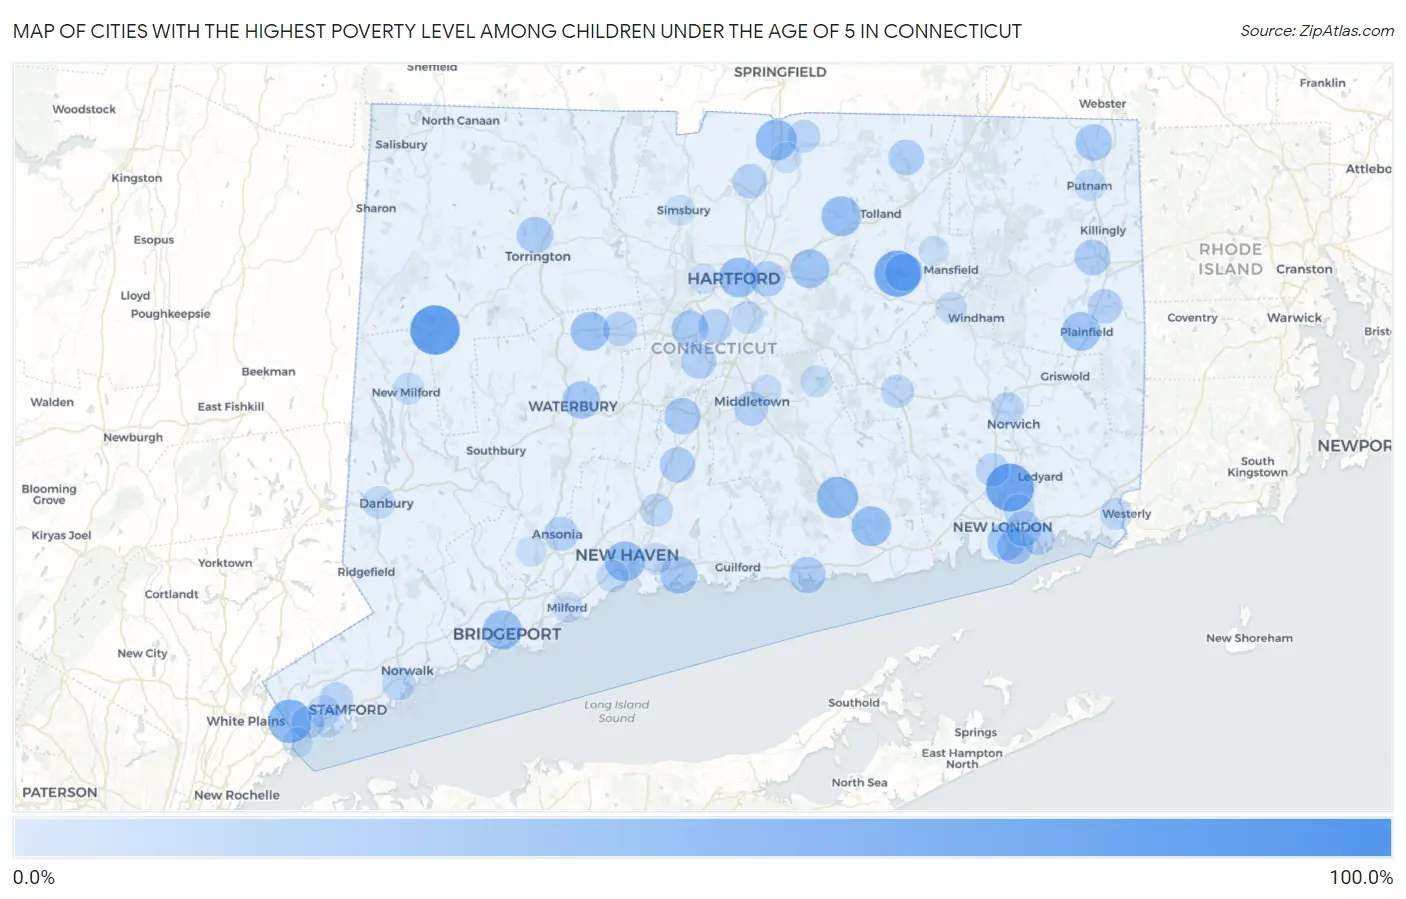
Map of Cities with the Highest Poverty Level Among Children Under the Age of 5 in Connecticut
0.0%
100.0%
Cities with the Highest Poverty Level Among Children Under the Age of 5 in Connecticut
| City | Child Poverty | vs State | vs National | |
| 1. | Pleasant Valley | 100.0% | 14.1%(+85.9)#1 | 18.1%(+81.9)#445 |
| 2. | New Preston | 79.8% | 14.1%(+65.7)#2 | 18.1%(+61.8)#1,360 |
| 3. | Gales Ferry | 72.9% | 14.1%(+58.8)#3 | 18.1%(+54.9)#1,638 |
| 4. | Coventry Lake | 66.0% | 14.1%(+51.9)#4 | 18.1%(+47.9)#2,053 |
| 5. | Stepney | 58.3% | 14.1%(+44.3)#5 | 18.1%(+40.3)#2,661 |
| 6. | Glenville | 54.8% | 14.1%(+40.7)#6 | 18.1%(+36.7)#2,985 |
| 7. | Chester Center | 46.3% | 14.1%(+32.2)#7 | 18.1%(+28.2)#3,976 |
| 8. | Thompsonville | 43.5% | 14.1%(+29.4)#8 | 18.1%(+25.4)#4,367 |
| 9. | New Haven | 40.1% | 14.1%(+26.0)#9 | 18.1%(+22.0)#4,842 |
| 10. | Essex Village | 39.9% | 14.1%(+25.8)#10 | 18.1%(+21.8)#4,932 |
| 11. | Rockville | 39.6% | 14.1%(+25.5)#11 | 18.1%(+21.5)#4,968 |
| 12. | Hartford | 38.7% | 14.1%(+24.6)#12 | 18.1%(+20.6)#5,119 |
| 13. | Bridgeport | 36.3% | 14.1%(+22.2)#13 | 18.1%(+18.2)#5,529 |
| 14. | Terryville | 35.4% | 14.1%(+21.3)#14 | 18.1%(+17.3)#5,707 |
| 15. | Manchester | 34.4% | 14.1%(+20.4)#15 | 18.1%(+16.4)#5,877 |
| 16. | Plainfield Village | 34.3% | 14.1%(+20.3)#16 | 18.1%(+16.3)#5,893 |
| 17. | South Coventry | 31.0% | 14.1%(+17.0)#17 | 18.1%(+13.0)#6,579 |
| 18. | Waterbury | 30.1% | 14.1%(+16.1)#18 | 18.1%(+12.1)#6,773 |
| 19. | New London | 29.8% | 14.1%(+15.7)#19 | 18.1%(+11.7)#6,869 |
| 20. | Branford Center | 29.8% | 14.1%(+15.7)#20 | 18.1%(+11.7)#6,873 |
| 21. | New Britain | 27.1% | 14.1%(+13.0)#21 | 18.1%(+9.04)#7,544 |
| 22. | North Grosvenor Dale | 25.9% | 14.1%(+11.8)#22 | 18.1%(+7.81)#7,833 |
| 23. | Meriden | 25.6% | 14.1%(+11.6)#23 | 18.1%(+7.58)#7,880 |
| 24. | Torrington | 25.4% | 14.1%(+11.3)#24 | 18.1%(+7.30)#7,954 |
| 25. | Clinton | 25.0% | 14.1%(+10.9)#25 | 18.1%(+6.94)#8,005 |
| 26. | Groton | 24.3% | 14.1%(+10.2)#26 | 18.1%(+6.24)#8,266 |
| 27. | East Brooklyn | 23.2% | 14.1%(+9.10)#27 | 18.1%(+5.12)#8,572 |
| 28. | Long Hill | 23.1% | 14.1%(+9.00)#28 | 18.1%(+5.01)#8,598 |
| 29. | Stafford Springs | 22.4% | 14.1%(+8.34)#29 | 18.1%(+4.35)#8,797 |
| 30. | Wallingford Center | 22.4% | 14.1%(+8.28)#30 | 18.1%(+4.30)#8,819 |
| 31. | East Hartford | 21.1% | 14.1%(+7.06)#31 | 18.1%(+3.07)#9,225 |
| 32. | Kensington | 20.4% | 14.1%(+6.27)#32 | 18.1%(+2.29)#9,458 |
| 33. | Windsor Locks | 18.0% | 14.1%(+3.95)#33 | 18.1%(-0.039)#10,207 |
| 34. | Moosup | 17.9% | 14.1%(+3.78)#34 | 18.1%(-0.206)#10,255 |
| 35. | Tashua | 16.8% | 14.1%(+2.69)#35 | 18.1%(-1.30)#10,609 |
| 36. | Newington | 16.6% | 14.1%(+2.50)#36 | 18.1%(-1.49)#10,719 |
| 37. | Bristol | 16.5% | 14.1%(+2.42)#37 | 18.1%(-1.56)#10,737 |
| 38. | Middletown | 16.2% | 14.1%(+2.10)#38 | 18.1%(-1.88)#10,837 |
| 39. | Ansonia | 16.2% | 14.1%(+2.10)#39 | 18.1%(-1.89)#10,841 |
| 40. | Sandy Hook | 14.8% | 14.1%(+0.748)#40 | 18.1%(-3.24)#11,302 |
| 41. | Danielson Borough | 14.8% | 14.1%(+0.705)#41 | 18.1%(-3.28)#11,324 |
| 42. | Stamford | 13.7% | 14.1%(-0.417)#42 | 18.1%(-4.40)#11,741 |
| 43. | Litchfield Borough | 13.6% | 14.1%(-0.441)#43 | 18.1%(-4.43)#11,757 |
| 44. | Oxoboxo River | 13.5% | 14.1%(-0.564)#44 | 18.1%(-4.55)#11,802 |
| 45. | Norwalk | 13.1% | 14.1%(-1.00)#45 | 18.1%(-4.99)#11,967 |
| 46. | Norwich | 12.9% | 14.1%(-1.21)#46 | 18.1%(-5.19)#12,046 |
| 47. | Colchester | 12.6% | 14.1%(-1.51)#47 | 18.1%(-5.49)#12,146 |
| 48. | Hazardville | 12.1% | 14.1%(-2.01)#48 | 18.1%(-6.00)#12,349 |
| 49. | North Haven | 12.0% | 14.1%(-2.11)#49 | 18.1%(-6.09)#12,392 |
| 50. | Poquonock Bridge | 11.7% | 14.1%(-2.39)#50 | 18.1%(-6.37)#12,496 |
| 51. | Greenwich | 11.0% | 14.1%(-3.04)#51 | 18.1%(-7.02)#12,778 |
| 52. | Cos Cob | 10.6% | 14.1%(-3.47)#52 | 18.1%(-7.45)#12,917 |
| 53. | Wethersfield | 10.5% | 14.1%(-3.55)#53 | 18.1%(-7.53)#12,943 |
| 54. | Danbury | 10.3% | 14.1%(-3.76)#54 | 18.1%(-7.74)#13,048 |
| 55. | Compo | 10.2% | 14.1%(-3.92)#55 | 18.1%(-7.90)#13,108 |
| 56. | Pawcatuck | 9.4% | 14.1%(-4.69)#56 | 18.1%(-8.68)#13,408 |
| 57. | West Haven | 8.9% | 14.1%(-5.21)#57 | 18.1%(-9.19)#13,636 |
| 58. | Noroton Heights | 8.4% | 14.1%(-5.69)#58 | 18.1%(-9.68)#13,831 |
| 59. | Putnam | 8.1% | 14.1%(-5.96)#59 | 18.1%(-9.94)#13,952 |
| 60. | Ball Pond | 7.9% | 14.1%(-6.22)#60 | 18.1%(-10.2)#14,047 |
| 61. | Noroton | 7.2% | 14.1%(-6.90)#61 | 18.1%(-10.9)#14,325 |
| 62. | New Milford | 7.2% | 14.1%(-6.92)#62 | 18.1%(-10.9)#14,329 |
| 63. | Lake Pocotopaug | 7.0% | 14.1%(-7.13)#63 | 18.1%(-11.1)#14,429 |
| 64. | East Haven | 6.7% | 14.1%(-7.39)#64 | 18.1%(-11.4)#14,549 |
| 65. | Southwood Acres | 5.0% | 14.1%(-9.12)#65 | 18.1%(-13.1)#15,279 |
| 66. | Conning Towers Nautilus Park | 4.8% | 14.1%(-9.32)#66 | 18.1%(-13.3)#15,392 |
| 67. | Willimantic | 4.7% | 14.1%(-9.40)#67 | 18.1%(-13.4)#15,416 |
| 68. | Naugatuck Borough | 4.6% | 14.1%(-9.47)#68 | 18.1%(-13.5)#15,445 |
| 69. | Milford City Balance | 3.2% | 14.1%(-10.9)#69 | 18.1%(-14.9)#16,057 |
| 70. | Portland | 3.0% | 14.1%(-11.0)#70 | 18.1%(-15.0)#16,105 |
| 71. | West Hartford | 2.7% | 14.1%(-11.4)#71 | 18.1%(-15.4)#16,260 |
| 72. | Riverside | 2.5% | 14.1%(-11.6)#72 | 18.1%(-15.5)#16,320 |
| 73. | Byram | 2.4% | 14.1%(-11.6)#73 | 18.1%(-15.6)#16,341 |
| 74. | Simsbury Center | 2.4% | 14.1%(-11.7)#74 | 18.1%(-15.6)#16,349 |
| 75. | Storrs | 2.0% | 14.1%(-12.1)#75 | 18.1%(-16.1)#16,489 |
| 76. | Shelton | 1.8% | 14.1%(-12.3)#76 | 18.1%(-16.3)#16,540 |
1
2Common Questions
What are the Top 10 Cities with the Highest Poverty Level Among Children Under the Age of 5 in Connecticut?
Top 10 Cities with the Highest Poverty Level Among Children Under the Age of 5 in Connecticut are:
#1
79.8%
#2
72.9%
#3
66.0%
#4
54.8%
#5
46.3%
#6
43.5%
#7
40.1%
#8
39.9%
#9
39.6%
#10
38.7%
What city has the Highest Poverty Level Among Children Under the Age of 5 in Connecticut?
New Preston has the Highest Poverty Level Among Children Under the Age of 5 in Connecticut with 79.8%.
What is the Poverty Level Among Children Under the Age of 5 in the State of Connecticut?
Poverty Level Among Children Under the Age of 5 in Connecticut is 14.1%.
What is the Poverty Level Among Children Under the Age of 5 in the United States?
Poverty Level Among Children Under the Age of 5 in the United States is 18.1%.