Cities with the Highest Poverty Level Among Children Under the Age of 5 in Oregon
RELATED REPORTS & OPTIONS
Highest Poverty | Child 0-5
Oregon
Compare Cities
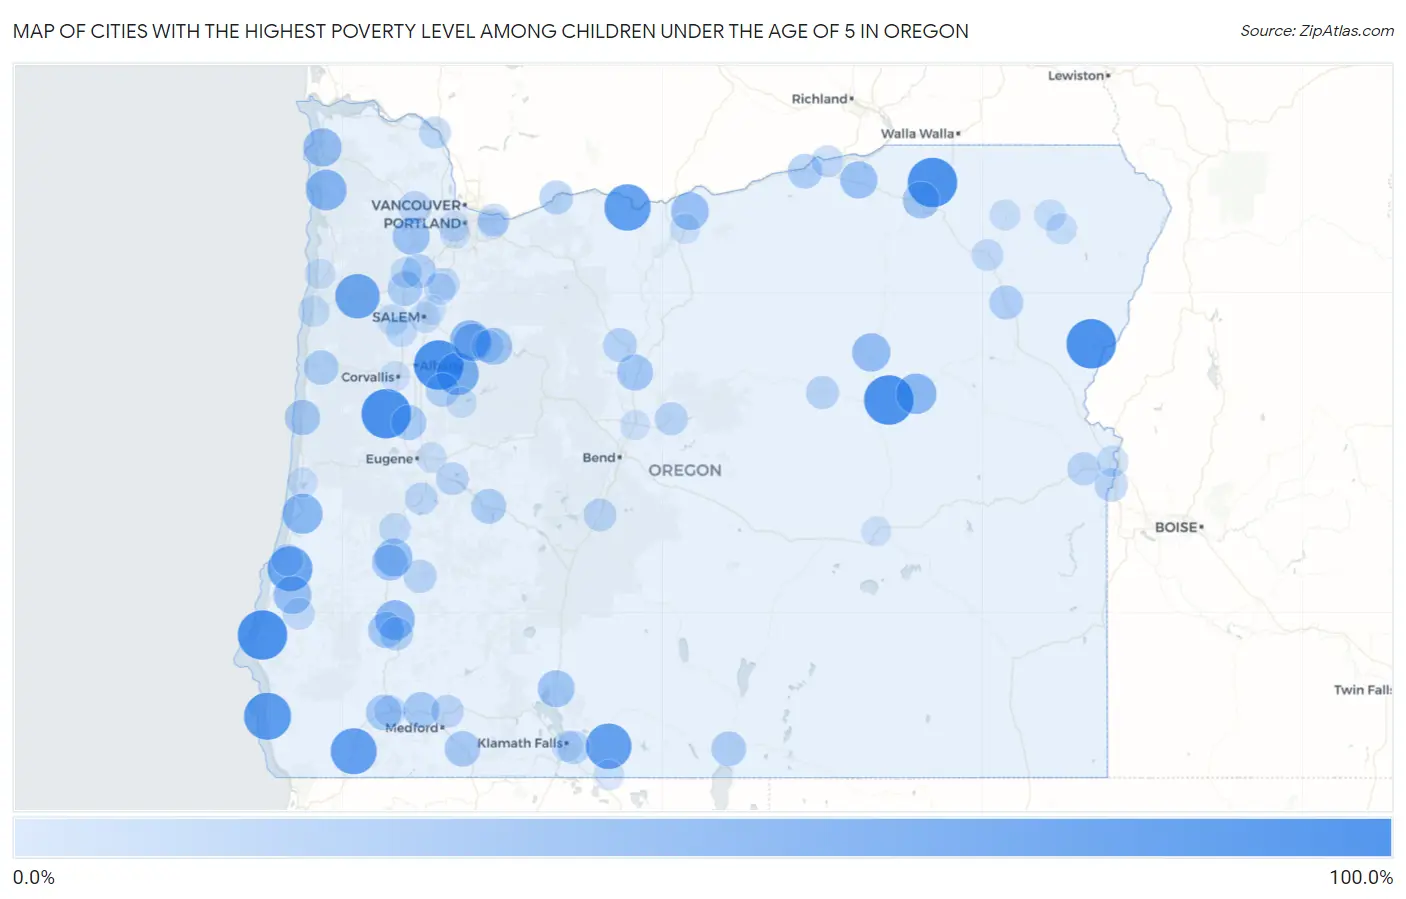
Map of Cities with the Highest Poverty Level Among Children Under the Age of 5 in Oregon
0.0%
100.0%
Cities with the Highest Poverty Level Among Children Under the Age of 5 in Oregon
| City | Child Poverty | vs State | vs National | |
| 1. | John Day | 100.0% | 14.6%(+85.4)#1 | 18.1%(+81.9)#86 |
| 2. | Crabtree | 100.0% | 14.6%(+85.4)#2 | 18.1%(+81.9)#319 |
| 3. | Adams | 100.0% | 14.6%(+85.4)#3 | 18.1%(+81.9)#322 |
| 4. | Rocky Point | 100.0% | 14.6%(+85.4)#4 | 18.1%(+81.9)#444 |
| 5. | Langlois | 100.0% | 14.6%(+85.4)#5 | 18.1%(+81.9)#451 |
| 6. | Alpine | 100.0% | 14.6%(+85.4)#6 | 18.1%(+81.9)#509 |
| 7. | River Point | 100.0% | 14.6%(+85.4)#7 | 18.1%(+81.9)#522 |
| 8. | Richland | 100.0% | 14.6%(+85.4)#8 | 18.1%(+81.9)#579 |
| 9. | Beaver Marsh | 100.0% | 14.6%(+85.4)#9 | 18.1%(+81.9)#722 |
| 10. | Gold Beach | 89.5% | 14.6%(+74.9)#10 | 18.1%(+71.4)#1,037 |
| 11. | Mapleton | 86.7% | 14.6%(+72.1)#11 | 18.1%(+68.6)#1,109 |
| 12. | Chenoweth | 86.2% | 14.6%(+71.6)#12 | 18.1%(+68.1)#1,122 |
| 13. | Cave Junction | 84.8% | 14.6%(+70.2)#13 | 18.1%(+66.8)#1,161 |
| 14. | Bonanza | 83.3% | 14.6%(+68.8)#14 | 18.1%(+65.3)#1,212 |
| 15. | Bunker Hill | 80.0% | 14.6%(+65.4)#15 | 18.1%(+61.9)#1,315 |
| 16. | Grand Ronde | 78.3% | 14.6%(+63.7)#16 | 18.1%(+60.2)#1,397 |
| 17. | Lacomb | 69.6% | 14.6%(+55.0)#17 | 18.1%(+51.5)#1,807 |
| 18. | Nehalem | 62.5% | 14.6%(+47.9)#18 | 18.1%(+44.4)#2,308 |
| 19. | Prairie City | 61.4% | 14.6%(+46.8)#19 | 18.1%(+43.3)#2,395 |
| 20. | Reedsport | 59.7% | 14.6%(+45.1)#20 | 18.1%(+41.6)#2,562 |
| 21. | Myrtle Creek | 57.9% | 14.6%(+43.3)#21 | 18.1%(+39.8)#2,697 |
| 22. | Mehama | 57.1% | 14.6%(+42.6)#22 | 18.1%(+39.1)#2,760 |
| 23. | Long Creek | 52.6% | 14.6%(+38.1)#23 | 18.1%(+34.6)#3,180 |
| 24. | Seaside | 52.0% | 14.6%(+37.5)#24 | 18.1%(+34.0)#3,230 |
| 25. | Lyons | 50.7% | 14.6%(+36.2)#25 | 18.1%(+32.7)#3,346 |
| 26. | Coquille | 50.6% | 14.6%(+36.1)#26 | 18.1%(+32.6)#3,353 |
| 27. | Wasco | 50.0% | 14.6%(+35.4)#27 | 18.1%(+31.9)#3,462 |
| 28. | Oakland | 49.2% | 14.6%(+34.6)#28 | 18.1%(+31.1)#3,627 |
| 29. | Stanfield | 48.1% | 14.6%(+33.5)#29 | 18.1%(+30.0)#3,744 |
| 30. | Gaston | 47.1% | 14.6%(+32.5)#30 | 18.1%(+29.0)#3,865 |
| 31. | Gates | 46.7% | 14.6%(+32.1)#31 | 18.1%(+28.6)#3,924 |
| 32. | Chiloquin | 46.4% | 14.6%(+31.9)#32 | 18.1%(+28.4)#3,953 |
| 33. | Mission | 46.1% | 14.6%(+31.5)#33 | 18.1%(+28.0)#4,014 |
| 34. | Svensen | 45.8% | 14.6%(+31.3)#34 | 18.1%(+27.8)#4,045 |
| 35. | Sutherlin | 43.2% | 14.6%(+28.6)#35 | 18.1%(+25.1)#4,400 |
| 36. | Riddle | 42.9% | 14.6%(+28.3)#36 | 18.1%(+24.8)#4,446 |
| 37. | Metolius | 42.9% | 14.6%(+28.3)#37 | 18.1%(+24.8)#4,448 |
| 38. | Gold Hill | 41.9% | 14.6%(+27.3)#38 | 18.1%(+23.8)#4,605 |
| 39. | Ashland | 40.8% | 14.6%(+26.2)#39 | 18.1%(+22.7)#4,755 |
| 40. | Redwood | 40.6% | 14.6%(+26.0)#40 | 18.1%(+22.5)#4,779 |
| 41. | Yachats | 40.0% | 14.6%(+25.4)#41 | 18.1%(+21.9)#4,863 |
| 42. | Harrisburg | 39.1% | 14.6%(+24.5)#42 | 18.1%(+21.1)#5,057 |
| 43. | Oakridge | 37.8% | 14.6%(+23.3)#43 | 18.1%(+19.8)#5,246 |
| 44. | Lakeview | 37.4% | 14.6%(+22.8)#44 | 18.1%(+19.3)#5,339 |
| 45. | Amity | 37.1% | 14.6%(+22.6)#45 | 18.1%(+19.1)#5,373 |
| 46. | Boardman | 36.7% | 14.6%(+22.2)#46 | 18.1%(+18.7)#5,449 |
| 47. | Toledo | 36.5% | 14.6%(+22.0)#47 | 18.1%(+18.5)#5,468 |
| 48. | Dayton | 34.4% | 14.6%(+19.8)#48 | 18.1%(+16.3)#5,882 |
| 49. | North Powder | 34.3% | 14.6%(+19.7)#49 | 18.1%(+16.2)#5,906 |
| 50. | Warm Springs | 33.3% | 14.6%(+18.8)#50 | 18.1%(+15.3)#6,045 |
| 51. | Cascade Locks | 33.3% | 14.6%(+18.8)#51 | 18.1%(+15.3)#6,059 |
| 52. | Sodaville | 33.3% | 14.6%(+18.8)#52 | 18.1%(+15.3)#6,124 |
| 53. | Canyonville | 32.4% | 14.6%(+17.8)#53 | 18.1%(+14.3)#6,320 |
| 54. | Glide | 31.3% | 14.6%(+16.8)#54 | 18.1%(+13.3)#6,517 |
| 55. | Prineville | 31.3% | 14.6%(+16.7)#55 | 18.1%(+13.2)#6,524 |
| 56. | Nyssa | 31.3% | 14.6%(+16.7)#56 | 18.1%(+13.2)#6,525 |
| 57. | Altamont | 30.9% | 14.6%(+16.3)#57 | 18.1%(+12.8)#6,606 |
| 58. | Dayville | 30.8% | 14.6%(+16.2)#58 | 18.1%(+12.7)#6,640 |
| 59. | Banks | 30.2% | 14.6%(+15.6)#59 | 18.1%(+12.1)#6,767 |
| 60. | Vale | 29.9% | 14.6%(+15.4)#60 | 18.1%(+11.9)#6,840 |
| 61. | La Pine | 29.5% | 14.6%(+14.9)#61 | 18.1%(+11.4)#6,943 |
| 62. | White City | 29.2% | 14.6%(+14.6)#62 | 18.1%(+11.1)#7,010 |
| 63. | Lowell | 28.9% | 14.6%(+14.4)#63 | 18.1%(+10.9)#7,055 |
| 64. | Mill City | 28.5% | 14.6%(+13.9)#64 | 18.1%(+10.4)#7,212 |
| 65. | Cottage Grove | 27.7% | 14.6%(+13.1)#65 | 18.1%(+9.65)#7,384 |
| 66. | Wood Village | 27.4% | 14.6%(+12.8)#66 | 18.1%(+9.31)#7,463 |
| 67. | North Bend | 26.4% | 14.6%(+11.9)#67 | 18.1%(+8.36)#7,704 |
| 68. | Irrigon | 26.4% | 14.6%(+11.8)#68 | 18.1%(+8.29)#7,717 |
| 69. | Rainier | 26.2% | 14.6%(+11.6)#69 | 18.1%(+8.11)#7,760 |
| 70. | Santa Clara | 26.0% | 14.6%(+11.4)#70 | 18.1%(+7.91)#7,808 |
| 71. | La Grande | 25.9% | 14.6%(+11.3)#71 | 18.1%(+7.84)#7,826 |
| 72. | Woodburn | 25.9% | 14.6%(+11.3)#72 | 18.1%(+7.82)#7,830 |
| 73. | Grants Pass | 25.7% | 14.6%(+11.1)#73 | 18.1%(+7.65)#7,866 |
| 74. | Myrtle Point | 25.3% | 14.6%(+10.7)#74 | 18.1%(+7.20)#7,974 |
| 75. | Gervais | 25.2% | 14.6%(+10.7)#75 | 18.1%(+7.16)#7,982 |
| 76. | Yoncalla | 25.0% | 14.6%(+10.4)#76 | 18.1%(+6.94)#8,029 |
| 77. | Dallas | 24.7% | 14.6%(+10.1)#77 | 18.1%(+6.65)#8,170 |
| 78. | Ontario | 24.4% | 14.6%(+9.87)#78 | 18.1%(+6.38)#8,239 |
| 79. | Lincoln City | 24.2% | 14.6%(+9.62)#79 | 18.1%(+6.13)#8,289 |
| 80. | Monmouth | 24.1% | 14.6%(+9.49)#80 | 18.1%(+6.00)#8,331 |
| 81. | Mcminnville | 23.7% | 14.6%(+9.16)#81 | 18.1%(+5.67)#8,419 |
| 82. | Wallowa | 23.3% | 14.6%(+8.76)#82 | 18.1%(+5.27)#8,532 |
| 83. | Salem | 23.1% | 14.6%(+8.49)#83 | 18.1%(+5.00)#8,635 |
| 84. | Klamath Falls | 23.0% | 14.6%(+8.39)#84 | 18.1%(+4.90)#8,651 |
| 85. | Lostine | 22.5% | 14.6%(+7.93)#85 | 18.1%(+4.44)#8,780 |
| 86. | Marlene | 21.9% | 14.6%(+7.36)#86 | 18.1%(+3.87)#8,946 |
| 87. | Elgin | 21.9% | 14.6%(+7.33)#87 | 18.1%(+3.84)#8,960 |
| 88. | West Slope | 21.6% | 14.6%(+6.98)#88 | 18.1%(+3.49)#9,079 |
| 89. | Malin | 20.8% | 14.6%(+6.26)#89 | 18.1%(+2.77)#9,309 |
| 90. | Sweet Home | 20.7% | 14.6%(+6.14)#90 | 18.1%(+2.65)#9,341 |
| 91. | Pacific City | 20.7% | 14.6%(+6.12)#91 | 18.1%(+2.63)#9,347 |
| 92. | Springfield | 20.5% | 14.6%(+5.88)#92 | 18.1%(+2.39)#9,424 |
| 93. | Dunes City | 20.0% | 14.6%(+5.43)#93 | 18.1%(+1.94)#9,535 |
| 94. | Moro | 20.0% | 14.6%(+5.43)#94 | 18.1%(+1.94)#9,574 |
| 95. | Gresham | 20.0% | 14.6%(+5.41)#95 | 18.1%(+1.92)#9,611 |
| 96. | Corvallis | 19.6% | 14.6%(+5.01)#96 | 18.1%(+1.52)#9,701 |
| 97. | Hayesville | 19.2% | 14.6%(+4.59)#97 | 18.1%(+1.10)#9,838 |
| 98. | Redmond | 19.0% | 14.6%(+4.43)#98 | 18.1%(+0.938)#9,896 |
| 99. | Burns | 18.8% | 14.6%(+4.18)#99 | 18.1%(+0.687)#9,951 |
| 100. | Metzger | 18.7% | 14.6%(+4.11)#100 | 18.1%(+0.622)#9,988 |
Common Questions
What are the Top 10 Cities with the Highest Poverty Level Among Children Under the Age of 5 in Oregon?
Top 10 Cities with the Highest Poverty Level Among Children Under the Age of 5 in Oregon are:
#1
100.0%
#2
100.0%
#3
100.0%
#4
100.0%
#5
100.0%
#6
100.0%
#7
89.5%
#8
86.2%
#9
84.8%
#10
83.3%
What city has the Highest Poverty Level Among Children Under the Age of 5 in Oregon?
John Day has the Highest Poverty Level Among Children Under the Age of 5 in Oregon with 100.0%.
What is the Poverty Level Among Children Under the Age of 5 in the State of Oregon?
Poverty Level Among Children Under the Age of 5 in Oregon is 14.6%.
What is the Poverty Level Among Children Under the Age of 5 in the United States?
Poverty Level Among Children Under the Age of 5 in the United States is 18.1%.