Mayfair, CA Map & Demographics
Mayfair Map
Mayfair Overview
$21,560
PER CAPITA INCOME
$66,447
AVG FAMILY INCOME
$57,326
AVG HOUSEHOLD INCOME
10.9%
WAGE / INCOME GAP [ % ]
89.1¢/ $1
WAGE / INCOME GAP [ $ ]
0.39
INEQUALITY / GINI INDEX
4,937
TOTAL POPULATION
2,486
MALE POPULATION
2,451
FEMALE POPULATION
101.43
MALES / 100 FEMALES
98.59
FEMALES / 100 MALES
31.5
MEDIAN AGE
3.9
AVG FAMILY SIZE
3.0
AVG HOUSEHOLD SIZE
2,244
LABOR FORCE [ PEOPLE ]
62.9%
PERCENT IN LABOR FORCE
8.7%
UNEMPLOYMENT RATE
Income in Mayfair
Income Overview in Mayfair
Per Capita Income in Mayfair is $21,560, while median incomes of families and households are $66,447 and $57,326 respectively.
| Characteristic | Number | Measure |
| Per Capita Income | 4,937 | $21,560 |
| Median Family Income | 1,050 | $66,447 |
| Mean Family Income | 1,050 | $70,490 |
| Median Household Income | 1,640 | $57,326 |
| Mean Household Income | 1,640 | $62,956 |
| Income Deficit | 1,050 | $0 |
| Wage / Income Gap (%) | 4,937 | 10.88% |
| Wage / Income Gap ($) | 4,937 | 89.12¢ per $1 |
| Gini / Inequality Index | 4,937 | 0.39 |
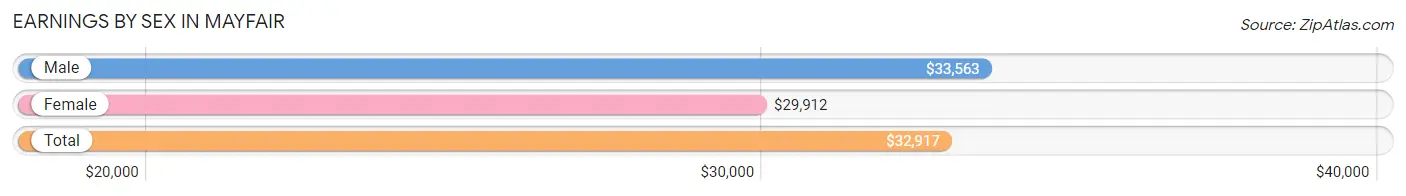
Earnings by Sex in Mayfair
Average Earnings in Mayfair are $32,917, $33,563 for men and $29,912 for women, a difference of 10.9%.
| Sex | Number | Average Earnings |
| Male | 1,206 (53.3%) | $33,563 |
| Female | 1,055 (46.7%) | $29,912 |
| Total | 2,261 (100.0%) | $32,917 |
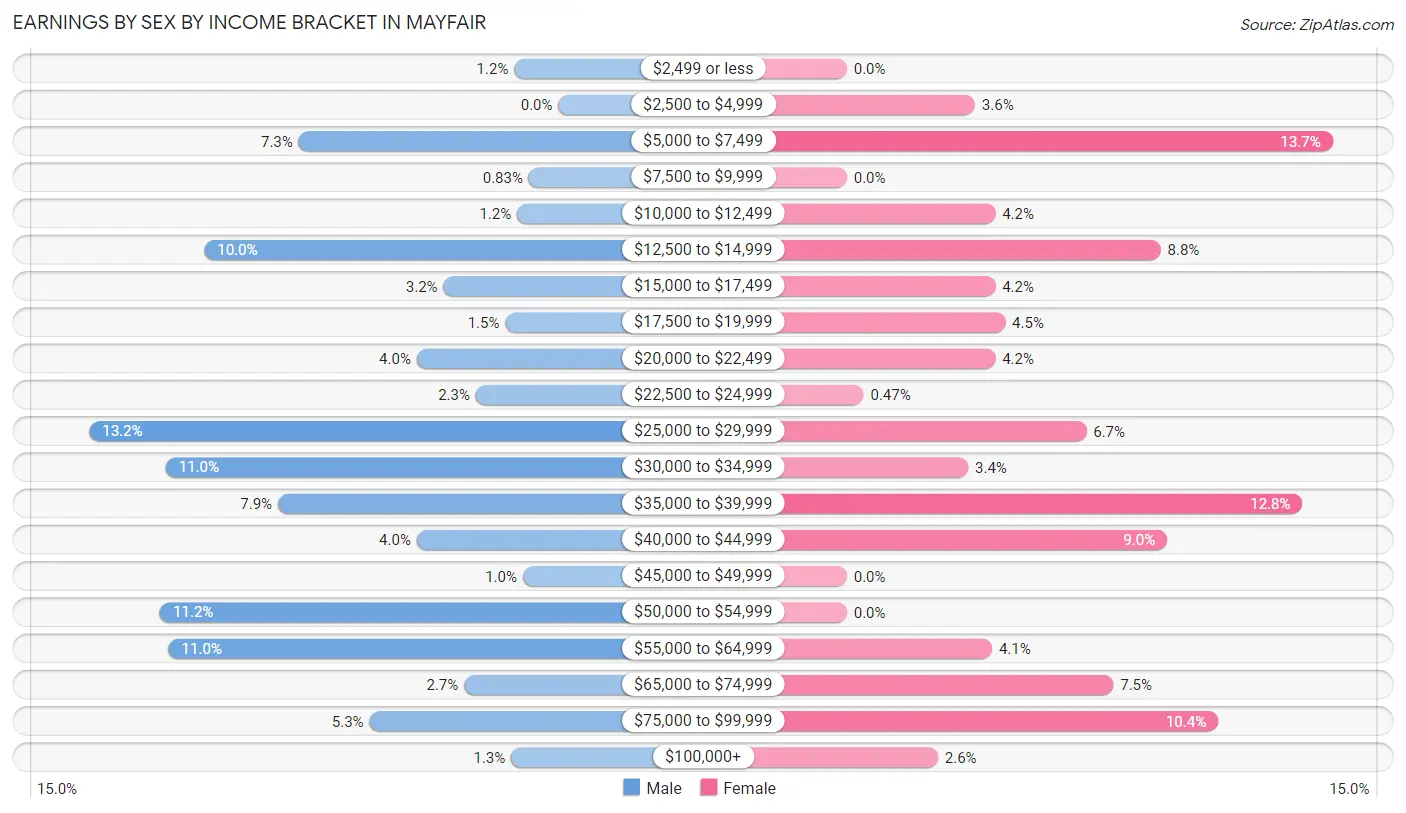
Earnings by Sex by Income Bracket in Mayfair
The most common earnings brackets in Mayfair are $25,000 to $29,999 for men (159 | 13.2%) and $5,000 to $7,499 for women (144 | 13.7%).
| Income | Male | Female |
| $2,499 or less | 15 (1.2%) | 0 (0.0%) |
| $2,500 to $4,999 | 0 (0.0%) | 38 (3.6%) |
| $5,000 to $7,499 | 88 (7.3%) | 144 (13.7%) |
| $7,500 to $9,999 | 10 (0.8%) | 0 (0.0%) |
| $10,000 to $12,499 | 14 (1.2%) | 44 (4.2%) |
| $12,500 to $14,999 | 120 (10.0%) | 93 (8.8%) |
| $15,000 to $17,499 | 39 (3.2%) | 44 (4.2%) |
| $17,500 to $19,999 | 18 (1.5%) | 47 (4.4%) |
| $20,000 to $22,499 | 48 (4.0%) | 44 (4.2%) |
| $22,500 to $24,999 | 28 (2.3%) | 5 (0.5%) |
| $25,000 to $29,999 | 159 (13.2%) | 71 (6.7%) |
| $30,000 to $34,999 | 133 (11.0%) | 36 (3.4%) |
| $35,000 to $39,999 | 95 (7.9%) | 135 (12.8%) |
| $40,000 to $44,999 | 48 (4.0%) | 95 (9.0%) |
| $45,000 to $49,999 | 12 (1.0%) | 0 (0.0%) |
| $50,000 to $54,999 | 135 (11.2%) | 0 (0.0%) |
| $55,000 to $64,999 | 132 (11.0%) | 43 (4.1%) |
| $65,000 to $74,999 | 32 (2.6%) | 79 (7.5%) |
| $75,000 to $99,999 | 64 (5.3%) | 110 (10.4%) |
| $100,000+ | 16 (1.3%) | 27 (2.6%) |
| Total | 1,206 (100.0%) | 1,055 (100.0%) |
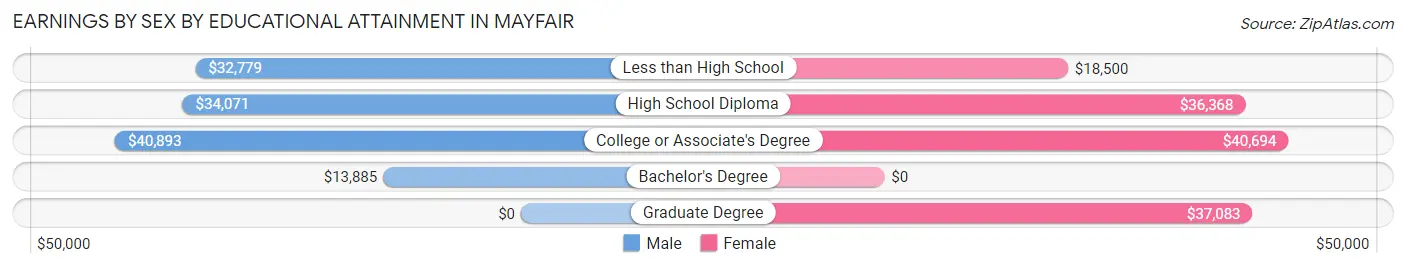
Earnings by Sex by Educational Attainment in Mayfair
Average earnings in Mayfair are $34,240 for men and $35,633 for women, a difference of 3.9%. Men with an educational attainment of college or associate's degree enjoy the highest average annual earnings of $40,893, while those with bachelor's degree education earn the least with $13,885. Women with an educational attainment of college or associate's degree earn the most with the average annual earnings of $40,694, while those with less than high school education have the smallest earnings of $18,500.
| Educational Attainment | Male Income | Female Income |
| Less than High School | $32,779 | $18,500 |
| High School Diploma | $34,071 | $36,368 |
| College or Associate's Degree | $40,893 | $40,694 |
| Bachelor's Degree | $13,885 | $0 |
| Graduate Degree | - | - |
| Total | $34,240 | $35,633 |
Family Income in Mayfair
Family Income Brackets in Mayfair
According to the Mayfair family income data, there are 197 families falling into the $50,000 to $74,999 income range, which is the most common income bracket and makes up 18.8% of all families.
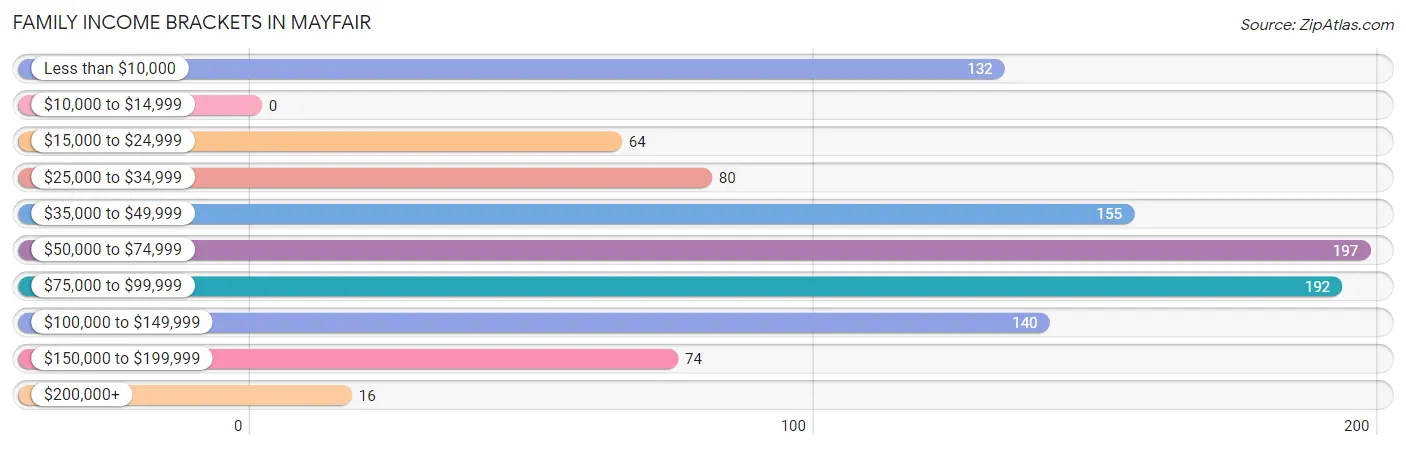
| Income Bracket | # Families | % Families |
| Less than $10,000 | 132 | 12.6% |
| $10,000 to $14,999 | 0 | 0.0% |
| $15,000 to $24,999 | 64 | 6.1% |
| $25,000 to $34,999 | 80 | 7.6% |
| $35,000 to $49,999 | 155 | 14.8% |
| $50,000 to $74,999 | 197 | 18.8% |
| $75,000 to $99,999 | 192 | 18.3% |
| $100,000 to $149,999 | 140 | 13.3% |
| $150,000 to $199,999 | 74 | 7.0% |
| $200,000+ | 16 | 1.5% |
Family Income by Famaliy Size in Mayfair
2-person families (329 | 31.3%) account for the highest median family income in Mayfair with $87,760 per family, while 2-person families (329 | 31.3%) have the highest median income of $43,880 per family member.
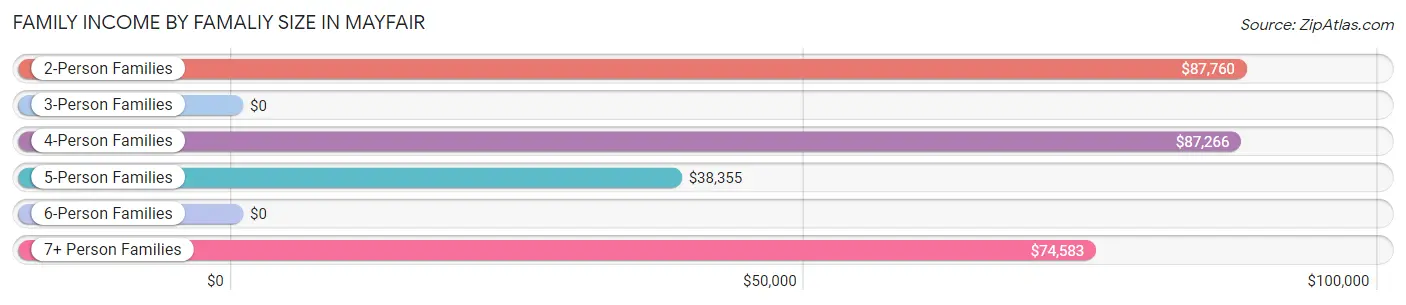
| Income Bracket | # Families | Median Income |
| 2-Person Families | 329 (31.3%) | $87,760 |
| 3-Person Families | 237 (22.6%) | $0 |
| 4-Person Families | 247 (23.5%) | $87,266 |
| 5-Person Families | 119 (11.3%) | $38,355 |
| 6-Person Families | 53 (5.1%) | $0 |
| 7+ Person Families | 65 (6.2%) | $74,583 |
| Total | 1,050 (100.0%) | $66,447 |
Family Income by Number of Earners in Mayfair
The median family income in Mayfair is $66,447, with families comprising 3+ earners (165) having the highest median family income of $89,886, while families with no earners (222) have the lowest median family income of $2,499, accounting for 15.7% and 21.1% of families, respectively.
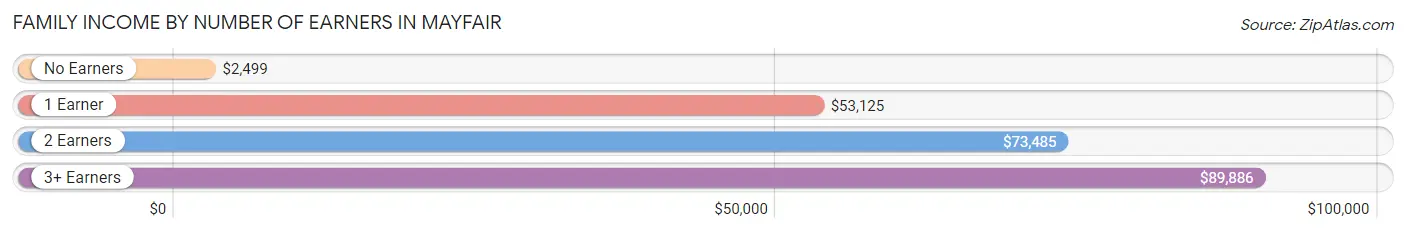
| Number of Earners | # Families | Median Income |
| No Earners | 222 (21.1%) | $2,499 |
| 1 Earner | 345 (32.9%) | $53,125 |
| 2 Earners | 318 (30.3%) | $73,485 |
| 3+ Earners | 165 (15.7%) | $89,886 |
| Total | 1,050 (100.0%) | $66,447 |
Household Income in Mayfair
Household Income Brackets in Mayfair
With 423 households falling in the category, the $50,000 to $74,999 income range is the most frequent in Mayfair, accounting for 25.8% of all households. In contrast, only 16 households (1.0%) fall into the $10,000 to $14,999 income bracket, making it the least populous group.
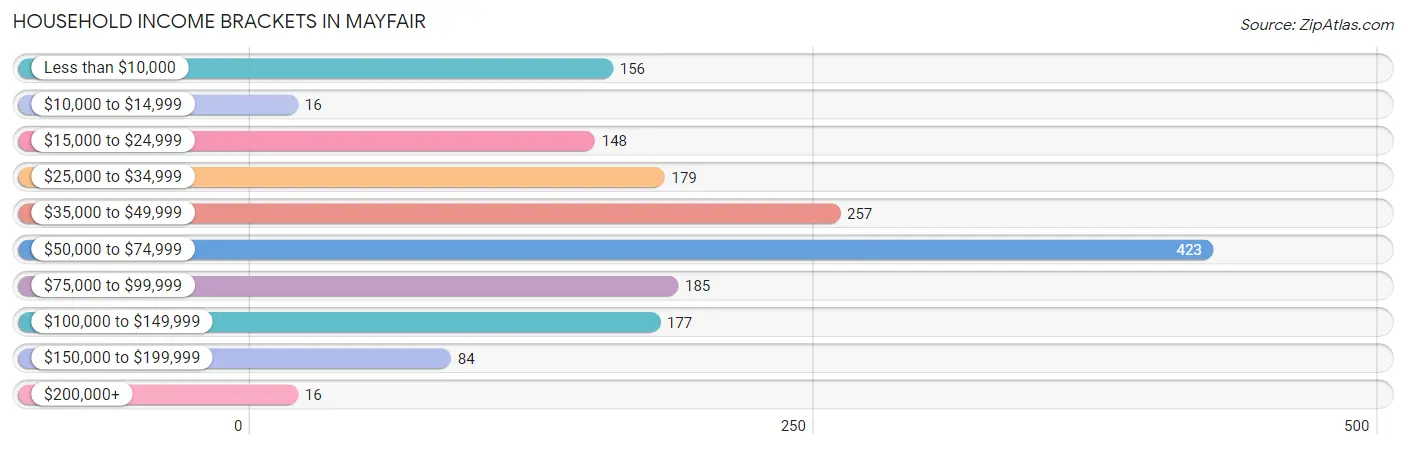
| Income Bracket | # Households | % Households |
| Less than $10,000 | 156 | 9.5% |
| $10,000 to $14,999 | 16 | 1.0% |
| $15,000 to $24,999 | 148 | 9.0% |
| $25,000 to $34,999 | 179 | 10.9% |
| $35,000 to $49,999 | 257 | 15.7% |
| $50,000 to $74,999 | 423 | 25.8% |
| $75,000 to $99,999 | 185 | 11.3% |
| $100,000 to $149,999 | 177 | 10.8% |
| $150,000 to $199,999 | 84 | 5.1% |
| $200,000+ | 16 | 1.0% |
Household Income by Householder Age in Mayfair
The median household income in Mayfair is $57,326, with the highest median household income of $62,083 found in the 45 to 64 years age bracket for the primary householder. A total of 580 households (35.4%) fall into this category. Meanwhile, the 15 to 24 years age bracket for the primary householder has the lowest median household income of $0, with 33 households (2.0%) in this group.
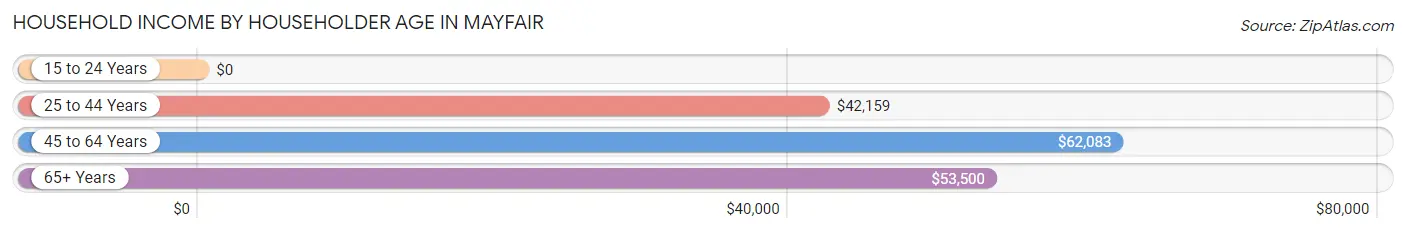
| Income Bracket | # Households | Median Income |
| 15 to 24 Years | 33 (2.0%) | $0 |
| 25 to 44 Years | 733 (44.7%) | $42,159 |
| 45 to 64 Years | 580 (35.4%) | $62,083 |
| 65+ Years | 294 (17.9%) | $53,500 |
| Total | 1,640 (100.0%) | $57,326 |
Poverty in Mayfair
Income Below Poverty by Sex and Age in Mayfair
With 28.3% poverty level for males and 24.4% for females among the residents of Mayfair, 15 year old males and 15 year old females are the most vulnerable to poverty, with 18 males (100.0%) and 15 females (100.0%) in their respective age groups living below the poverty level.
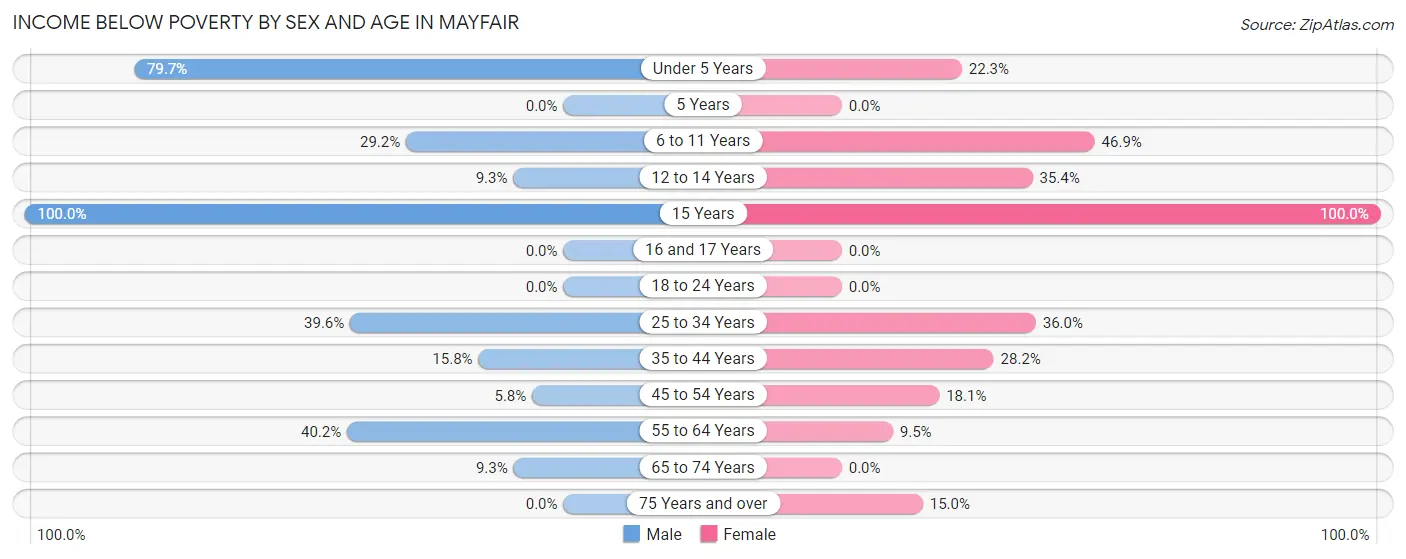
| Age Bracket | Male | Female |
| Under 5 Years | 212 (79.7%) | 37 (22.3%) |
| 5 Years | 0 (0.0%) | 0 (0.0%) |
| 6 to 11 Years | 73 (29.2%) | 145 (46.9%) |
| 12 to 14 Years | 17 (9.3%) | 40 (35.4%) |
| 15 Years | 18 (100.0%) | 15 (100.0%) |
| 16 and 17 Years | 0 (0.0%) | 0 (0.0%) |
| 18 to 24 Years | 0 (0.0%) | 0 (0.0%) |
| 25 to 34 Years | 190 (39.6%) | 206 (36.0%) |
| 35 to 44 Years | 56 (15.8%) | 64 (28.2%) |
| 45 to 54 Years | 16 (5.8%) | 34 (18.1%) |
| 55 to 64 Years | 106 (40.2%) | 27 (9.5%) |
| 65 to 74 Years | 16 (9.2%) | 0 (0.0%) |
| 75 Years and over | 0 (0.0%) | 23 (15.0%) |
| Total | 704 (28.3%) | 591 (24.4%) |
Income Above Poverty by Sex and Age in Mayfair
According to the poverty statistics in Mayfair, males aged 5 years and females aged 5 years are the age groups that are most secure financially, with 100.0% of males and 100.0% of females in these age groups living above the poverty line.
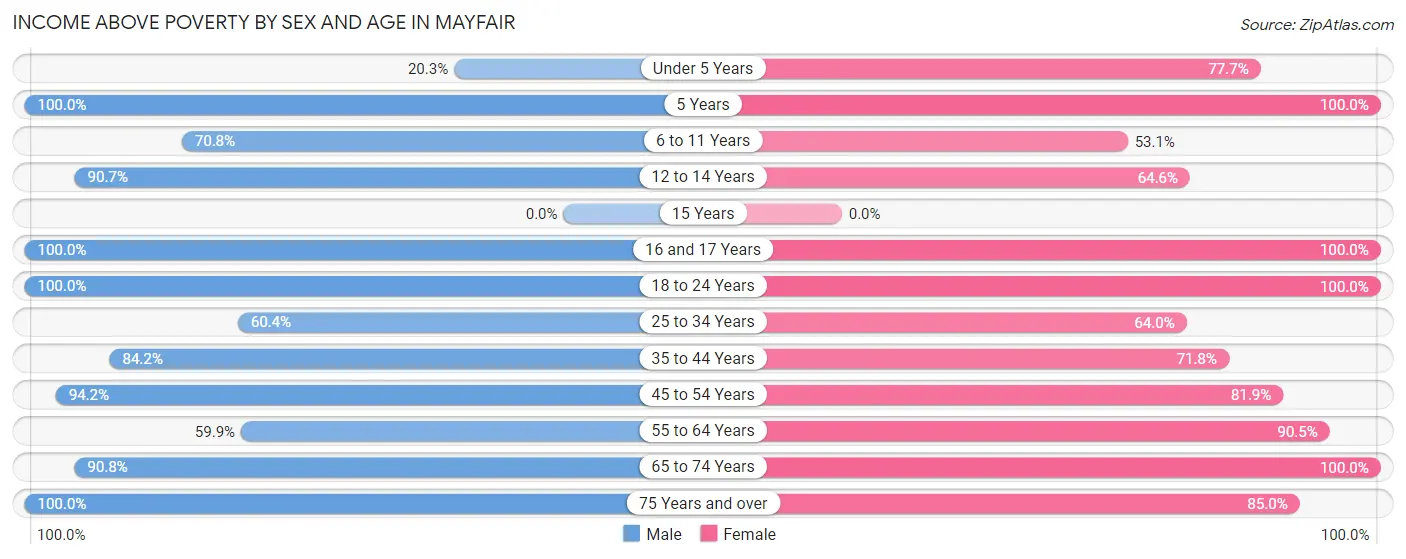
| Age Bracket | Male | Female |
| Under 5 Years | 54 (20.3%) | 129 (77.7%) |
| 5 Years | 12 (100.0%) | 10 (100.0%) |
| 6 to 11 Years | 177 (70.8%) | 164 (53.1%) |
| 12 to 14 Years | 166 (90.7%) | 73 (64.6%) |
| 15 Years | 0 (0.0%) | 0 (0.0%) |
| 16 and 17 Years | 28 (100.0%) | 59 (100.0%) |
| 18 to 24 Years | 175 (100.0%) | 216 (100.0%) |
| 25 to 34 Years | 290 (60.4%) | 366 (64.0%) |
| 35 to 44 Years | 299 (84.2%) | 163 (71.8%) |
| 45 to 54 Years | 260 (94.2%) | 154 (81.9%) |
| 55 to 64 Years | 158 (59.9%) | 258 (90.5%) |
| 65 to 74 Years | 157 (90.7%) | 110 (100.0%) |
| 75 Years and over | 6 (100.0%) | 130 (85.0%) |
| Total | 1,782 (71.7%) | 1,832 (75.6%) |
Income Below Poverty Among Married-Couple Families in Mayfair
The poverty statistics for married-couple families in Mayfair show that 15.2% or 80 of the total 525 families live below the poverty line. Families with 1 or 2 children have the highest poverty rate of 33.5%, comprising of 65 families. On the other hand, families with no children have the lowest poverty rate of 0.0%, which includes 0 families.
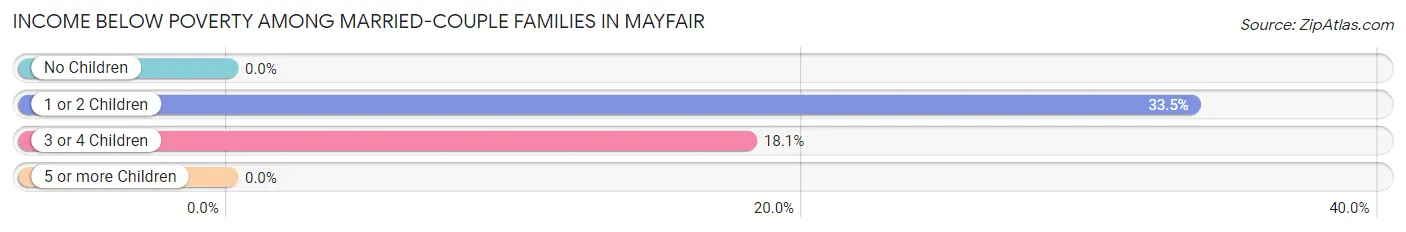
| Children | Above Poverty | Below Poverty |
| No Children | 248 (100.0%) | 0 (0.0%) |
| 1 or 2 Children | 129 (66.5%) | 65 (33.5%) |
| 3 or 4 Children | 68 (81.9%) | 15 (18.1%) |
| 5 or more Children | 0 (0.0%) | 0 (0.0%) |
| Total | 445 (84.8%) | 80 (15.2%) |
Income Below Poverty Among Single-Parent Households in Mayfair
According to the poverty data in Mayfair, 51.8% or 98 single-father households and 24.7% or 83 single-mother households are living below the poverty line. Among single-father households, those with 1 or 2 children have the highest poverty rate, with 60 households (88.2%) experiencing poverty. Likewise, among single-mother households, those with 1 or 2 children have the highest poverty rate, with 51 households (41.5%) falling below the poverty line.
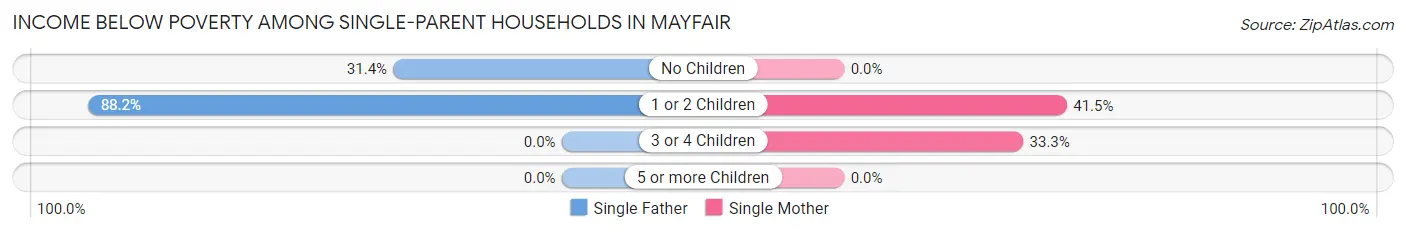
| Children | Single Father | Single Mother |
| No Children | 38 (31.4%) | 0 (0.0%) |
| 1 or 2 Children | 60 (88.2%) | 51 (41.5%) |
| 3 or 4 Children | 0 (0.0%) | 32 (33.3%) |
| 5 or more Children | 0 (0.0%) | 0 (0.0%) |
| Total | 98 (51.8%) | 83 (24.7%) |
Income Below Poverty Among Married-Couple vs Single-Parent Households in Mayfair
The poverty data for Mayfair shows that 80 of the married-couple family households (15.2%) and 181 of the single-parent households (34.5%) are living below the poverty level. Within the married-couple family households, those with 1 or 2 children have the highest poverty rate, with 65 households (33.5%) falling below the poverty line. Among the single-parent households, those with 1 or 2 children have the highest poverty rate, with 111 household (58.1%) living below poverty.
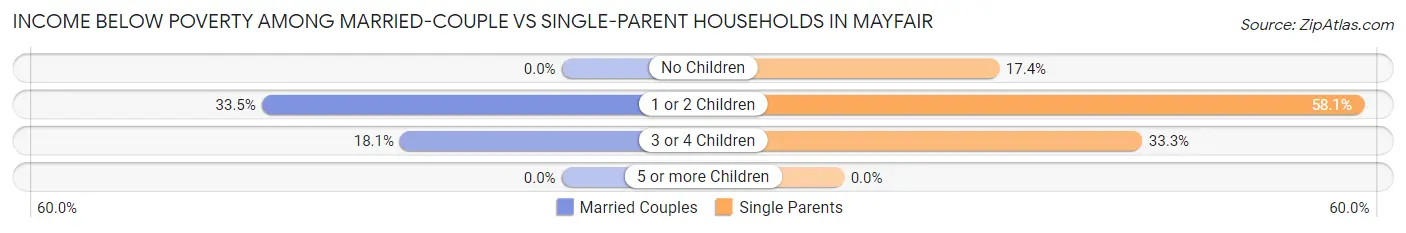
| Children | Married-Couple Families | Single-Parent Households |
| No Children | 0 (0.0%) | 38 (17.3%) |
| 1 or 2 Children | 65 (33.5%) | 111 (58.1%) |
| 3 or 4 Children | 15 (18.1%) | 32 (33.3%) |
| 5 or more Children | 0 (0.0%) | 0 (0.0%) |
| Total | 80 (15.2%) | 181 (34.5%) |
Race in Mayfair
The most populous races in Mayfair are Hispanic or Latino (3,223 | 65.3%), Some other Race (1,734 | 35.1%), and White / Caucasian (1,680 | 34.0%).
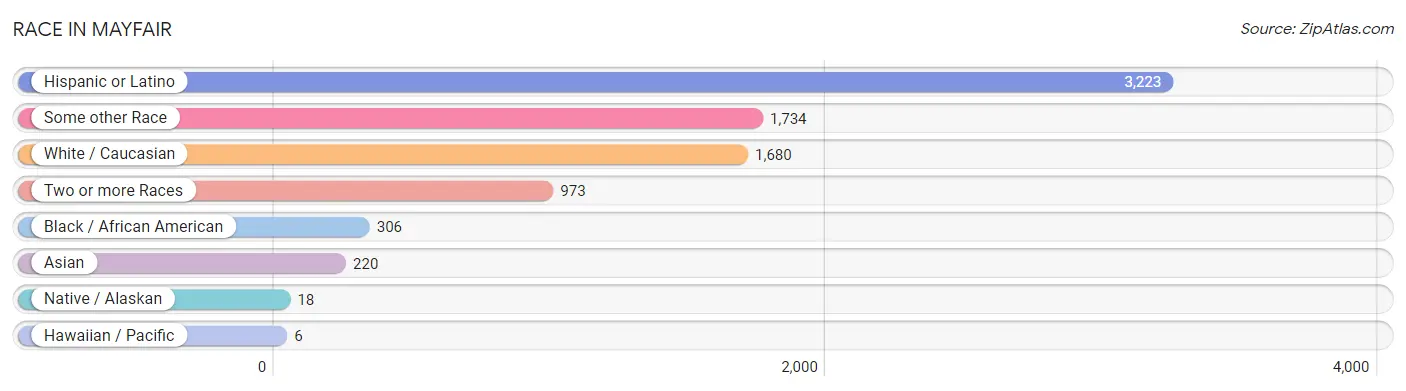
| Race | # Population | % Population |
| Asian | 220 | 4.5% |
| Black / African American | 306 | 6.2% |
| Hawaiian / Pacific | 6 | 0.1% |
| Hispanic or Latino | 3,223 | 65.3% |
| Native / Alaskan | 18 | 0.4% |
| White / Caucasian | 1,680 | 34.0% |
| Two or more Races | 973 | 19.7% |
| Some other Race | 1,734 | 35.1% |
| Total | 4,937 | 100.0% |
Ancestry in Mayfair
The most populous ancestries reported in Mayfair are Mexican (3,134 | 63.5%), Japanese (187 | 3.8%), German (182 | 3.7%), Danish (181 | 3.7%), and English (123 | 2.5%), together accounting for 77.1% of all Mayfair residents.
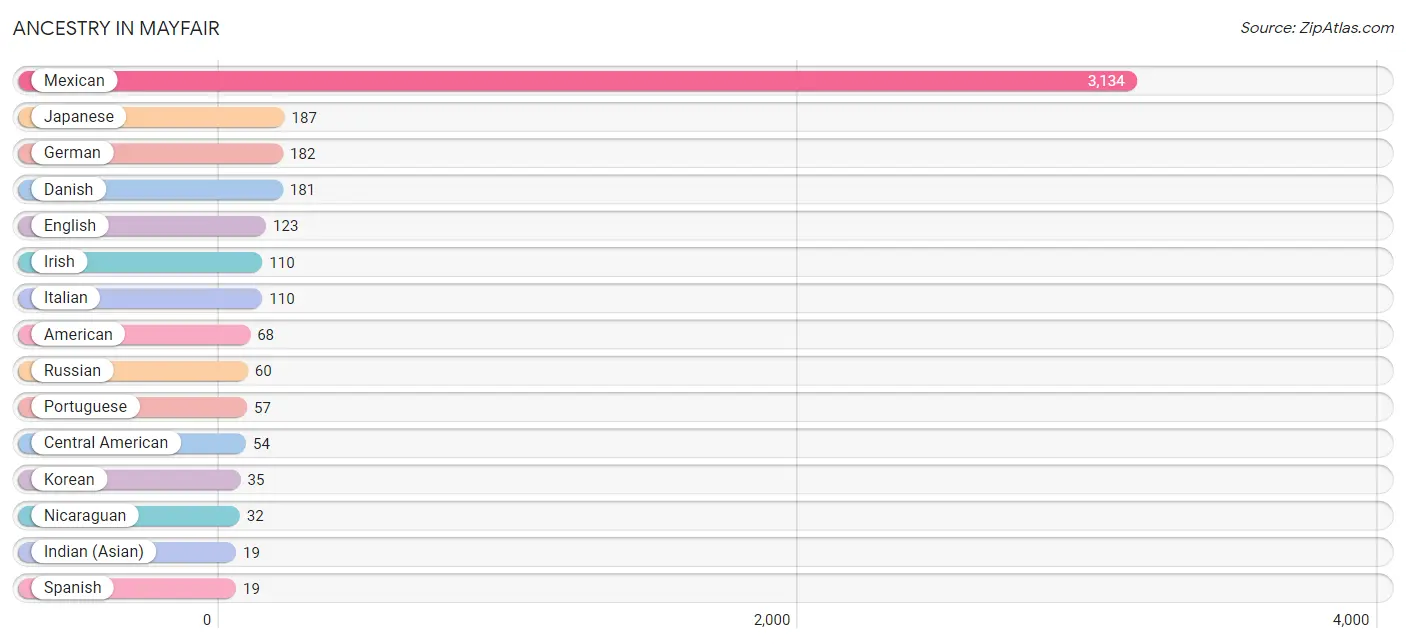
| Ancestry | # Population | % Population |
| African | 10 | 0.2% |
| American | 68 | 1.4% |
| Armenian | 10 | 0.2% |
| Bangladeshi | 14 | 0.3% |
| Blackfeet | 16 | 0.3% |
| Brazilian | 12 | 0.2% |
| British | 10 | 0.2% |
| Central American | 54 | 1.1% |
| Central American Indian | 18 | 0.4% |
| Danish | 181 | 3.7% |
| Dutch | 17 | 0.3% |
| English | 123 | 2.5% |
| European | 18 | 0.4% |
| French | 9 | 0.2% |
| German | 182 | 3.7% |
| Guatemalan | 12 | 0.2% |
| Honduran | 10 | 0.2% |
| Indian (Asian) | 19 | 0.4% |
| Irish | 110 | 2.2% |
| Italian | 110 | 2.2% |
| Japanese | 187 | 3.8% |
| Korean | 35 | 0.7% |
| Latvian | 6 | 0.1% |
| Malaysian | 8 | 0.2% |
| Mexican | 3,134 | 63.5% |
| Mexican American Indian | 18 | 0.4% |
| Nicaraguan | 32 | 0.6% |
| Pakistani | 8 | 0.2% |
| Peruvian | 14 | 0.3% |
| Polish | 18 | 0.4% |
| Portuguese | 57 | 1.1% |
| Puerto Rican | 2 | 0.0% |
| Russian | 60 | 1.2% |
| Samoan | 6 | 0.1% |
| Scottish | 11 | 0.2% |
| South American | 14 | 0.3% |
| Spanish | 19 | 0.4% |
| Subsaharan African | 10 | 0.2% |
| Swiss | 10 | 0.2% | View All 39 Rows |
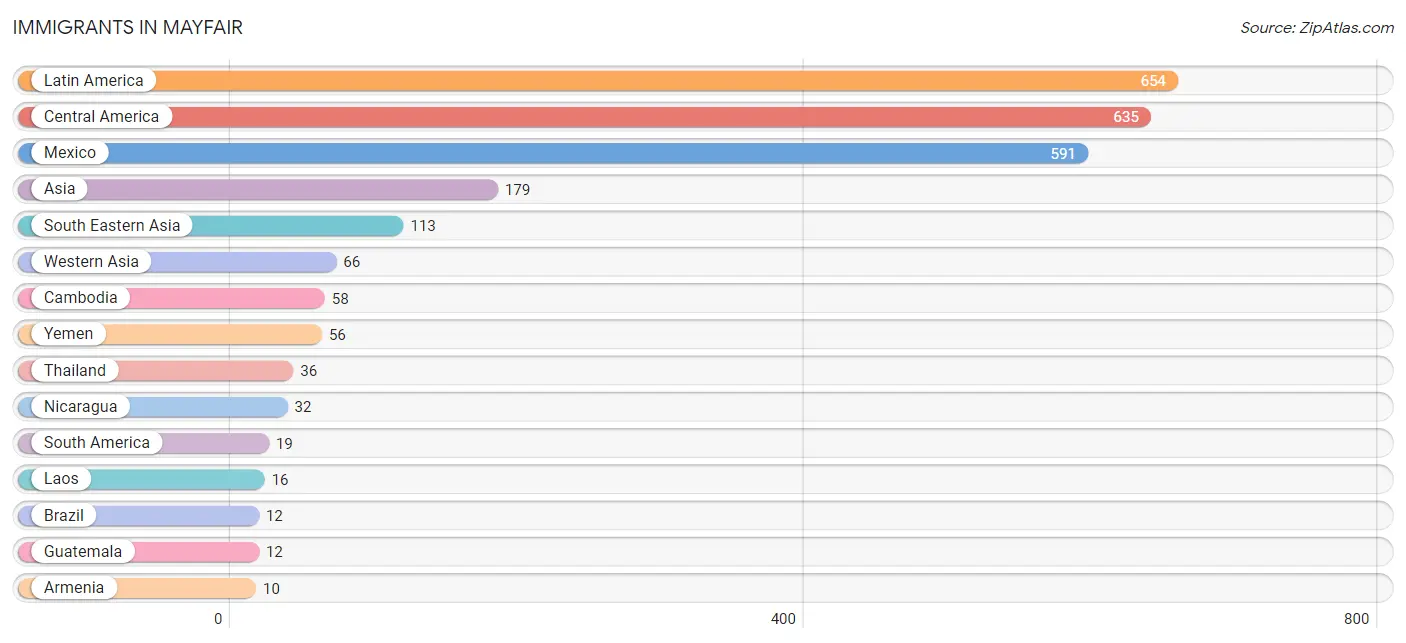
Immigrants in Mayfair
The most numerous immigrant groups reported in Mayfair came from Latin America (654 | 13.3%), Central America (635 | 12.9%), Mexico (591 | 12.0%), Asia (179 | 3.6%), and South Eastern Asia (113 | 2.3%), together accounting for 44.0% of all Mayfair residents.
| Immigration Origin | # Population | % Population |
| Armenia | 10 | 0.2% |
| Asia | 179 | 3.6% |
| Brazil | 12 | 0.2% |
| Cambodia | 58 | 1.2% |
| Central America | 635 | 12.9% |
| Eastern Europe | 6 | 0.1% |
| Europe | 6 | 0.1% |
| Guatemala | 12 | 0.2% |
| Laos | 16 | 0.3% |
| Latin America | 654 | 13.3% |
| Latvia | 6 | 0.1% |
| Mexico | 591 | 12.0% |
| Nicaragua | 32 | 0.6% |
| Peru | 7 | 0.1% |
| Philippines | 3 | 0.1% |
| South America | 19 | 0.4% |
| South Eastern Asia | 113 | 2.3% |
| Thailand | 36 | 0.7% |
| Western Asia | 66 | 1.3% |
| Yemen | 56 | 1.1% | View All 20 Rows |
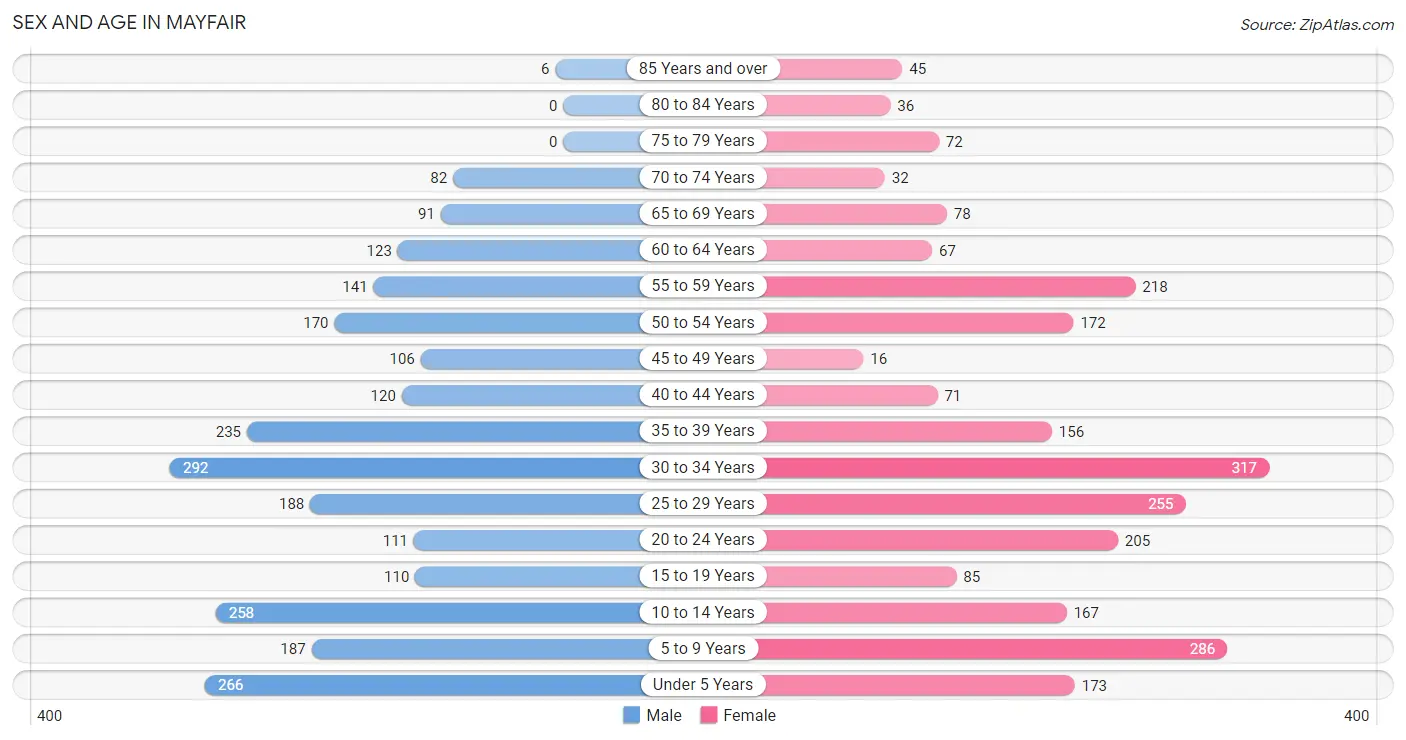
Sex and Age in Mayfair
Sex and Age in Mayfair
The most populous age groups in Mayfair are 30 to 34 Years (292 | 11.7%) for men and 30 to 34 Years (317 | 12.9%) for women.
| Age Bracket | Male | Female |
| Under 5 Years | 266 (10.7%) | 173 (7.1%) |
| 5 to 9 Years | 187 (7.5%) | 286 (11.7%) |
| 10 to 14 Years | 258 (10.4%) | 167 (6.8%) |
| 15 to 19 Years | 110 (4.4%) | 85 (3.5%) |
| 20 to 24 Years | 111 (4.5%) | 205 (8.4%) |
| 25 to 29 Years | 188 (7.6%) | 255 (10.4%) |
| 30 to 34 Years | 292 (11.7%) | 317 (12.9%) |
| 35 to 39 Years | 235 (9.5%) | 156 (6.4%) |
| 40 to 44 Years | 120 (4.8%) | 71 (2.9%) |
| 45 to 49 Years | 106 (4.3%) | 16 (0.6%) |
| 50 to 54 Years | 170 (6.8%) | 172 (7.0%) |
| 55 to 59 Years | 141 (5.7%) | 218 (8.9%) |
| 60 to 64 Years | 123 (5.0%) | 67 (2.7%) |
| 65 to 69 Years | 91 (3.7%) | 78 (3.2%) |
| 70 to 74 Years | 82 (3.3%) | 32 (1.3%) |
| 75 to 79 Years | 0 (0.0%) | 72 (2.9%) |
| 80 to 84 Years | 0 (0.0%) | 36 (1.5%) |
| 85 Years and over | 6 (0.2%) | 45 (1.8%) |
| Total | 2,486 (100.0%) | 2,451 (100.0%) |
Families and Households in Mayfair
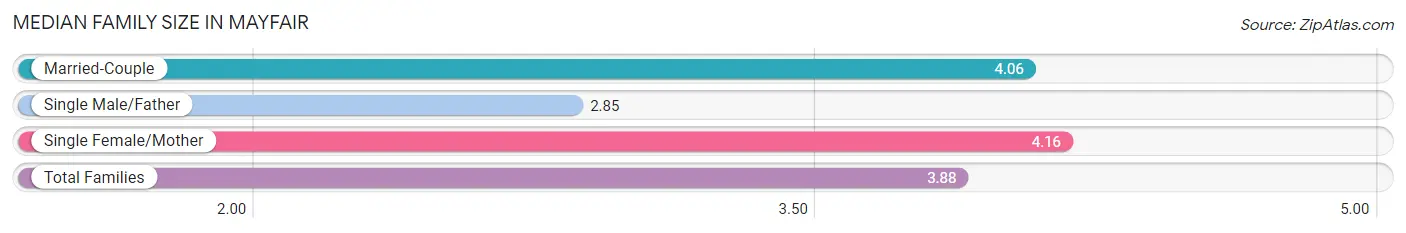
Median Family Size in Mayfair
The median family size in Mayfair is 3.88 persons per family, with single female/mother families (336 | 32.0%) accounting for the largest median family size of 4.16 persons per family. On the other hand, single male/father families (189 | 18.0%) represent the smallest median family size with 2.85 persons per family.
| Family Type | # Families | Family Size |
| Married-Couple | 525 (50.0%) | 4.06 |
| Single Male/Father | 189 (18.0%) | 2.85 |
| Single Female/Mother | 336 (32.0%) | 4.16 |
| Total Families | 1,050 (100.0%) | 3.88 |
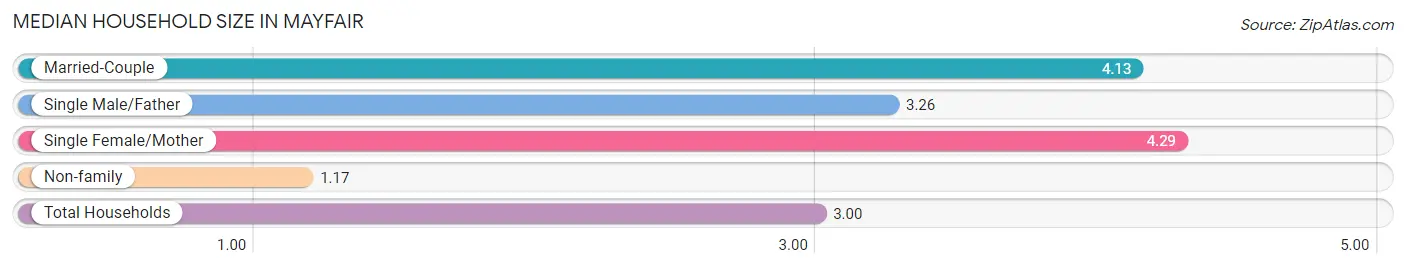
Median Household Size in Mayfair
The median household size in Mayfair is 3.00 persons per household, with single female/mother households (336 | 20.5%) accounting for the largest median household size of 4.29 persons per household. non-family households (590 | 36.0%) represent the smallest median household size with 1.17 persons per household.
| Household Type | # Households | Household Size |
| Married-Couple | 525 (32.0%) | 4.13 |
| Single Male/Father | 189 (11.5%) | 3.26 |
| Single Female/Mother | 336 (20.5%) | 4.29 |
| Non-family | 590 (36.0%) | 1.17 |
| Total Households | 1,640 (100.0%) | 3.00 |
Household Size by Marriage Status in Mayfair
Out of a total of 1,640 households in Mayfair, 1,050 (64.0%) are family households, while 590 (36.0%) are nonfamily households. The most numerous type of family households are 4-person households, comprising 366, and the most common type of nonfamily households are 1-person households, comprising 459.
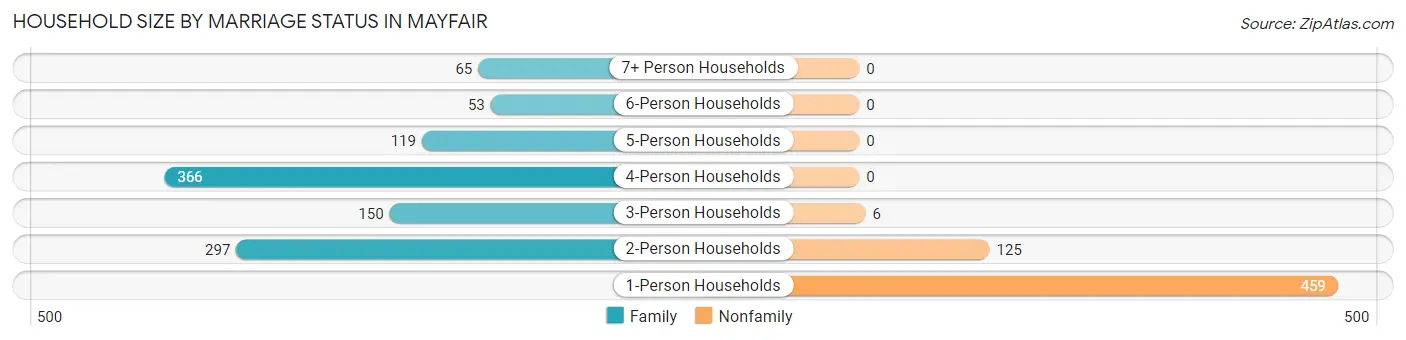
| Household Size | Family Households | Nonfamily Households |
| 1-Person Households | - | 459 (28.0%) |
| 2-Person Households | 297 (18.1%) | 125 (7.6%) |
| 3-Person Households | 150 (9.1%) | 6 (0.4%) |
| 4-Person Households | 366 (22.3%) | 0 (0.0%) |
| 5-Person Households | 119 (7.3%) | 0 (0.0%) |
| 6-Person Households | 53 (3.2%) | 0 (0.0%) |
| 7+ Person Households | 65 (4.0%) | 0 (0.0%) |
| Total | 1,050 (64.0%) | 590 (36.0%) |
Female Fertility in Mayfair
Fertility by Age in Mayfair
Average fertility rate in Mayfair is 29.0 births per 1,000 women. Women in the age bracket of 20 to 34 years have the highest fertility rate with 42.0 births per 1,000 women. Women in the age bracket of 20 to 34 years acount for 100.0% of all women with births.
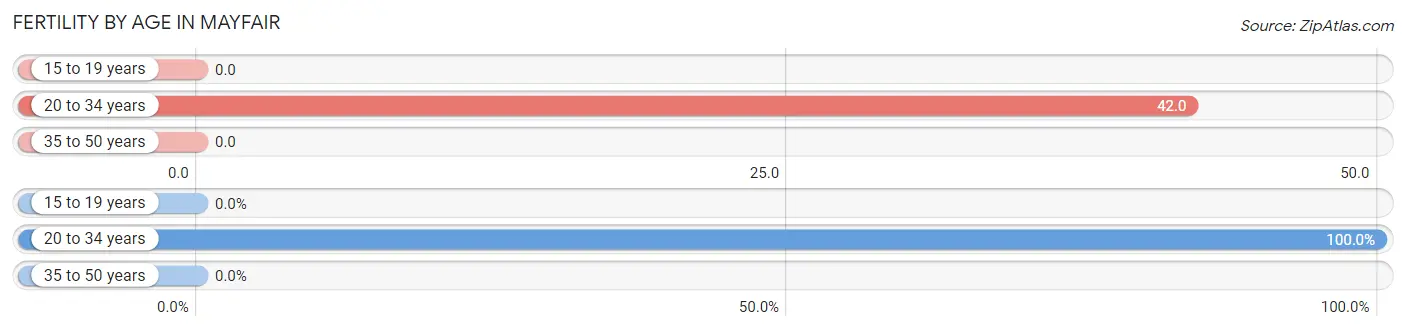
| Age Bracket | Women with Births | Births / 1,000 Women |
| 15 to 19 years | 0 (0.0%) | 0.0 |
| 20 to 34 years | 33 (100.0%) | 42.0 |
| 35 to 50 years | 0 (0.0%) | 0.0 |
| Total | 33 (100.0%) | 29.0 |
Fertility by Age by Marriage Status in Mayfair
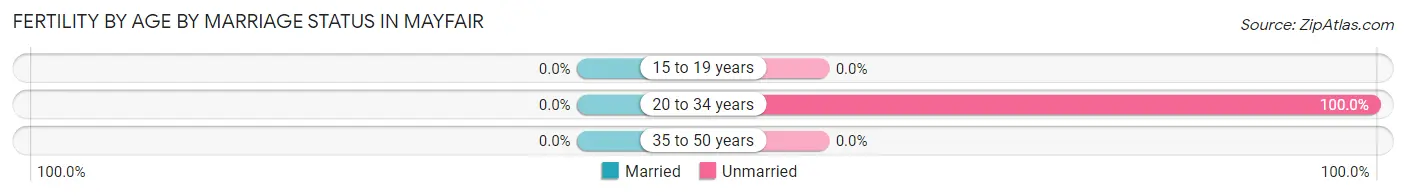
| Age Bracket | Married | Unmarried |
| 15 to 19 years | 0 (0.0%) | 0 (0.0%) |
| 20 to 34 years | 0 (0.0%) | 33 (100.0%) |
| 35 to 50 years | 0 (0.0%) | 0 (0.0%) |
| Total | 0 (0.0%) | 33 (100.0%) |
Fertility by Education in Mayfair
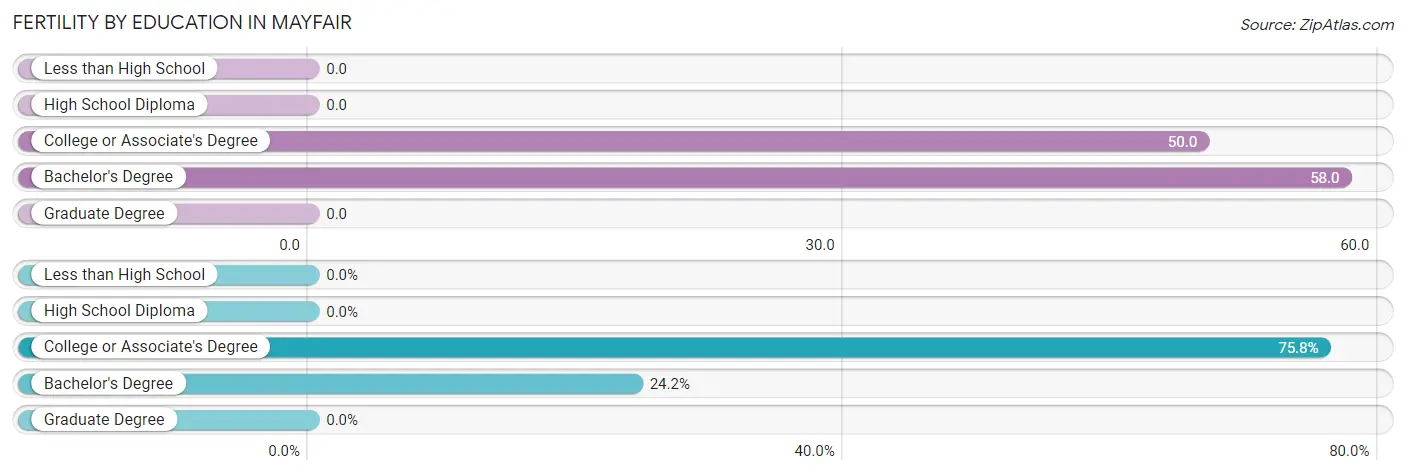
| Educational Attainment | Women with Births | Births / 1,000 Women |
| Less than High School | 0 (0.0%) | 0.0 |
| High School Diploma | 0 (0.0%) | 0.0 |
| College or Associate's Degree | 25 (75.8%) | 50.0 |
| Bachelor's Degree | 8 (24.2%) | 58.0 |
| Graduate Degree | 0 (0.0%) | 0.0 |
| Total | 33 (100.0%) | 29.0 |
Fertility by Education by Marriage Status in Mayfair
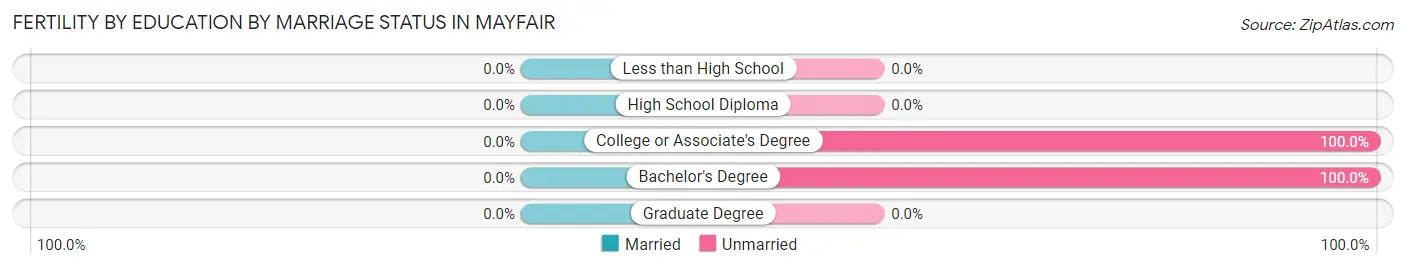
| Educational Attainment | Married | Unmarried |
| Less than High School | 0 (0.0%) | 0 (0.0%) |
| High School Diploma | 0 (0.0%) | 0 (0.0%) |
| College or Associate's Degree | 0 (0.0%) | 25 (100.0%) |
| Bachelor's Degree | 0 (0.0%) | 8 (100.0%) |
| Graduate Degree | 0 (0.0%) | 0 (0.0%) |
| Total | 0 (0.0%) | 33 (100.0%) |
Employment Characteristics in Mayfair
Employment by Class of Employer in Mayfair
Among the 2,020 employed individuals in Mayfair, private company employees (1,385 | 68.6%), local government employees (259 | 12.8%), and self-employed (not incorporated) (137 | 6.8%) make up the most common classes of employment.
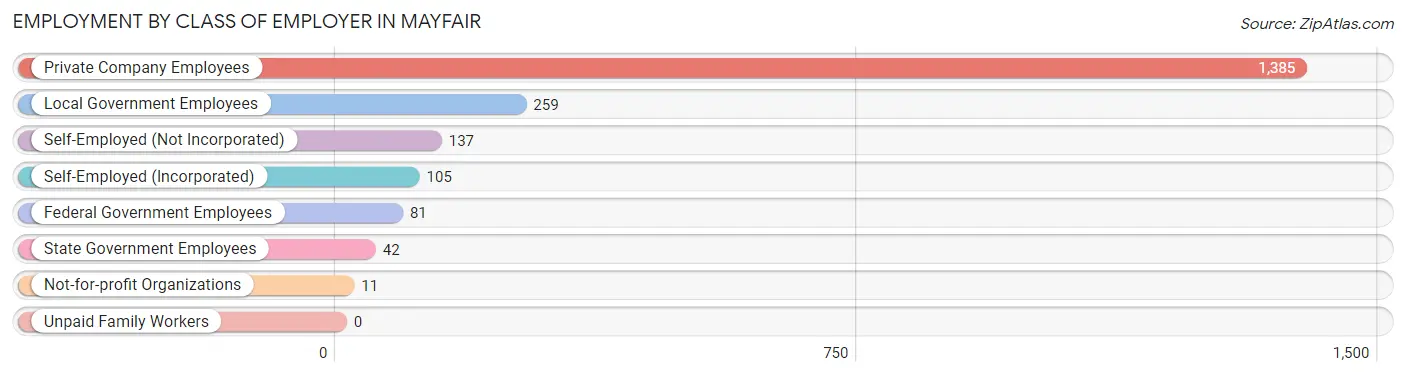
| Employer Class | # Employees | % Employees |
| Private Company Employees | 1,385 | 68.6% |
| Self-Employed (Incorporated) | 105 | 5.2% |
| Self-Employed (Not Incorporated) | 137 | 6.8% |
| Not-for-profit Organizations | 11 | 0.5% |
| Local Government Employees | 259 | 12.8% |
| State Government Employees | 42 | 2.1% |
| Federal Government Employees | 81 | 4.0% |
| Unpaid Family Workers | 0 | 0.0% |
| Total | 2,020 | 100.0% |
Employment Status by Age in Mayfair
According to the labor force statistics for Mayfair, out of the total population over 16 years of age (3,567), 62.9% or 2,244 individuals are in the labor force, with 8.7% or 195 of them unemployed. The age group with the highest labor force participation rate is 20 to 24 years, with 83.5% or 264 individuals in the labor force. Within the labor force, the 30 to 34 years age range has the highest percentage of unemployed individuals, with 22.7% or 90 of them being unemployed.
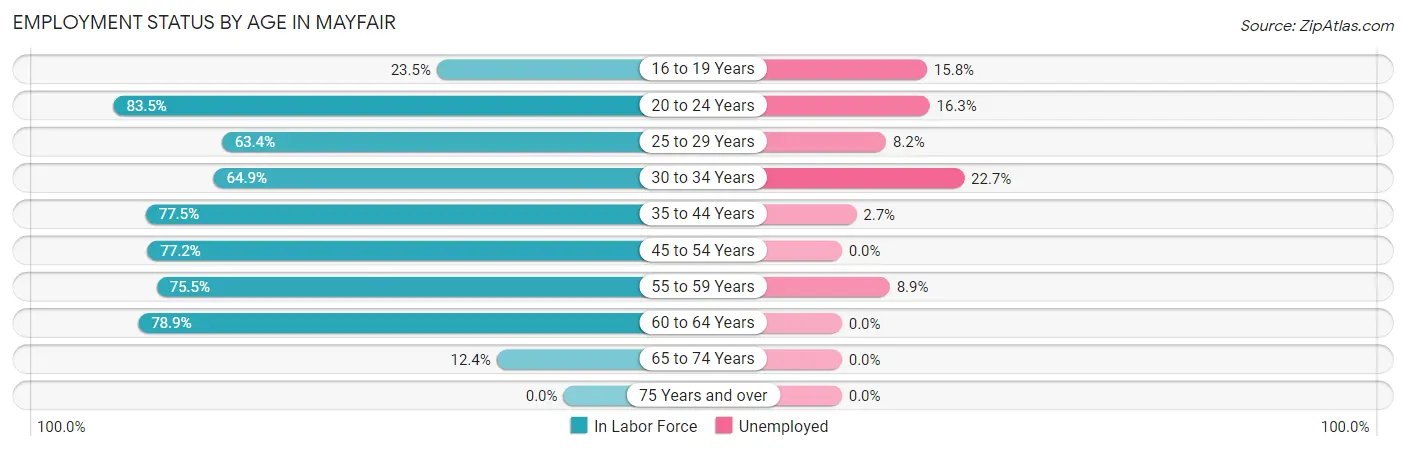
| Age Bracket | In Labor Force | Unemployed |
| 16 to 19 Years | 38 (23.5%) | 6 (15.8%) |
| 20 to 24 Years | 264 (83.5%) | 43 (16.3%) |
| 25 to 29 Years | 281 (63.4%) | 23 (8.2%) |
| 30 to 34 Years | 395 (64.9%) | 90 (22.7%) |
| 35 to 44 Years | 451 (77.5%) | 12 (2.7%) |
| 45 to 54 Years | 358 (77.2%) | 0 (0.0%) |
| 55 to 59 Years | 271 (75.5%) | 24 (8.9%) |
| 60 to 64 Years | 150 (78.9%) | 0 (0.0%) |
| 65 to 74 Years | 35 (12.4%) | 0 (0.0%) |
| 75 Years and over | 0 (0.0%) | 0 (0.0%) |
| Total | 2,244 (62.9%) | 195 (8.7%) |
Employment Status by Educational Attainment in Mayfair
According to labor force statistics for Mayfair, 72.0% of individuals (1,906) out of the total population between 25 and 64 years of age (2,647) are in the labor force, with 7.6% or 145 of them being unemployed. The group with the highest labor force participation rate are those with the educational attainment of bachelor's degree or higher, with 80.8% or 278 individuals in the labor force. Within the labor force, individuals with bachelor's degree or higher education have the highest percentage of unemployment, with 26.3% or 73 of them being unemployed.
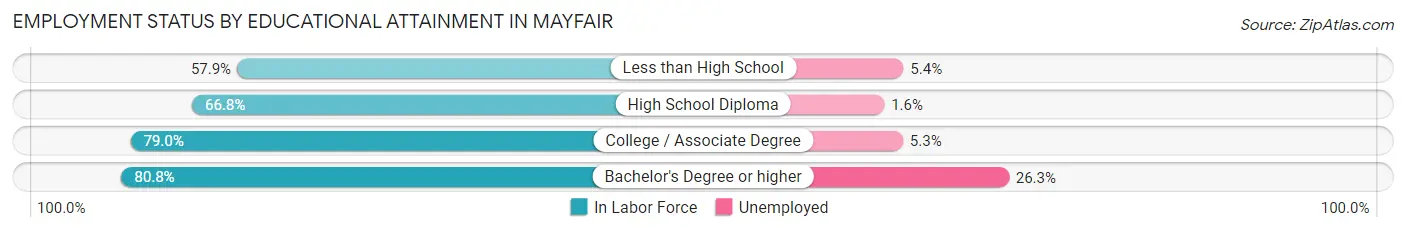
| Educational Attainment | In Labor Force | Unemployed |
| Less than High School | 333 (57.9%) | 31 (5.4%) |
| High School Diploma | 383 (66.8%) | 9 (1.6%) |
| College / Associate Degree | 912 (79.0%) | 61 (5.3%) |
| Bachelor's Degree or higher | 278 (80.8%) | 90 (26.3%) |
| Total | 1,906 (72.0%) | 201 (7.6%) |
Employment Occupations by Sex in Mayfair
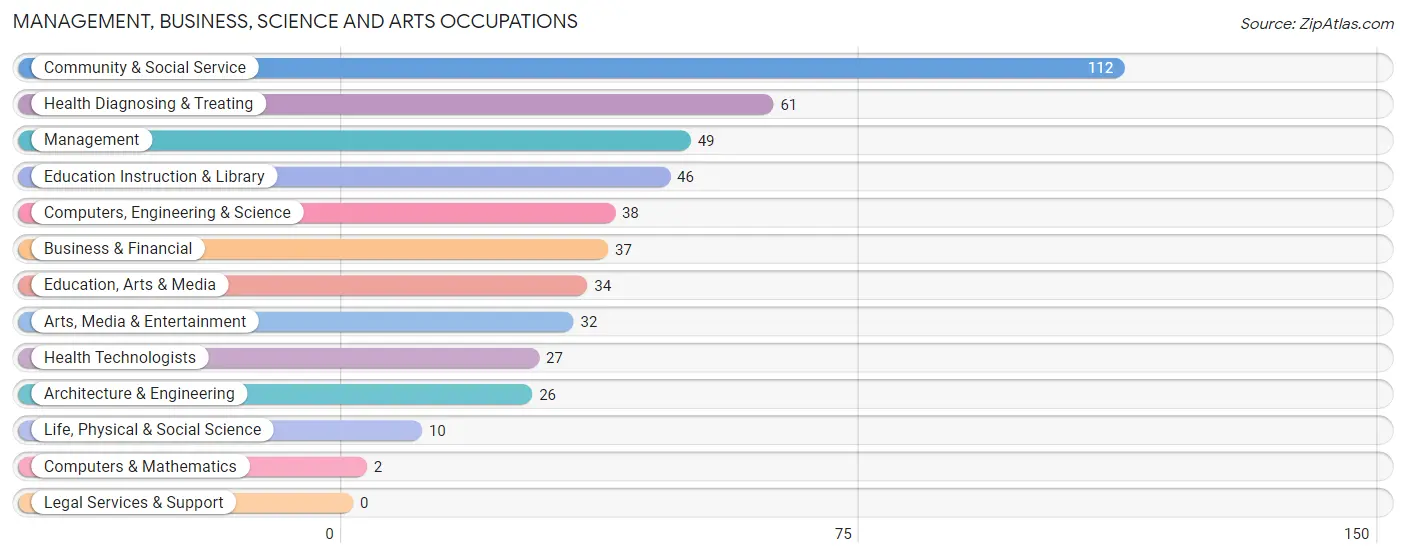
Management, Business, Science and Arts Occupations
The most common Management, Business, Science and Arts occupations in Mayfair are Community & Social Service (112 | 5.5%), Health Diagnosing & Treating (61 | 3.0%), Management (49 | 2.4%), Education Instruction & Library (46 | 2.3%), and Computers, Engineering & Science (38 | 1.9%).
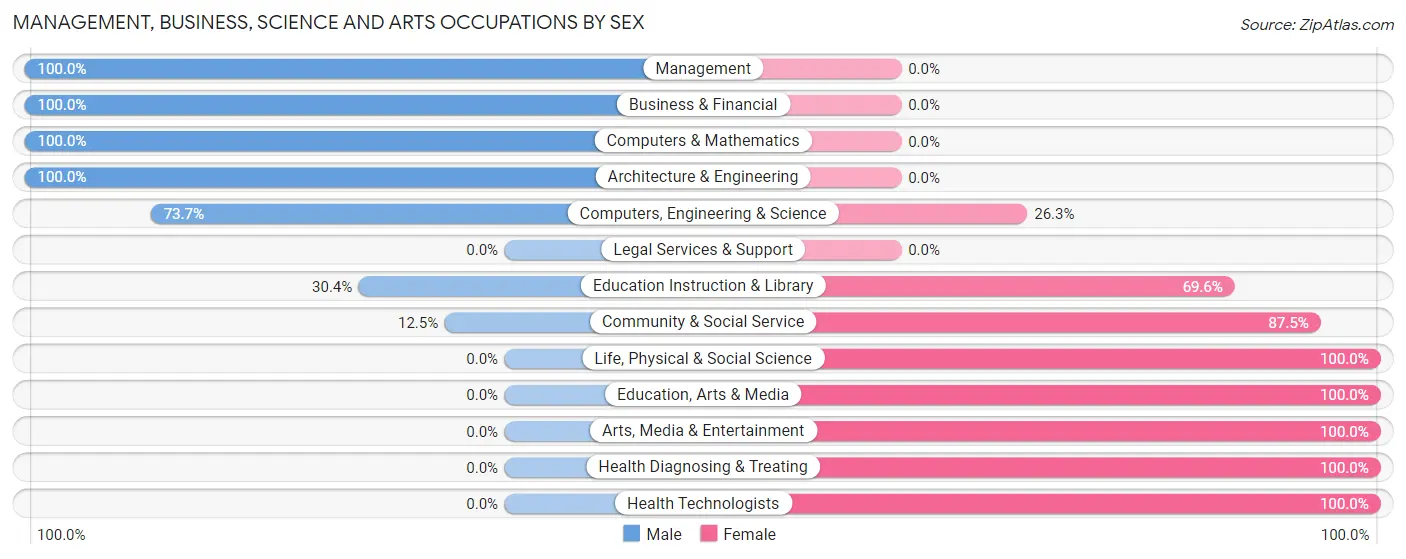
Management, Business, Science and Arts Occupations by Sex
Within the Management, Business, Science and Arts occupations in Mayfair, the most male-oriented occupations are Management (100.0%), Business & Financial (100.0%), and Computers & Mathematics (100.0%), while the most female-oriented occupations are Life, Physical & Social Science (100.0%), Education, Arts & Media (100.0%), and Arts, Media & Entertainment (100.0%).
| Occupation | Male | Female |
| Management | 49 (100.0%) | 0 (0.0%) |
| Business & Financial | 37 (100.0%) | 0 (0.0%) |
| Computers, Engineering & Science | 28 (73.7%) | 10 (26.3%) |
| Computers & Mathematics | 2 (100.0%) | 0 (0.0%) |
| Architecture & Engineering | 26 (100.0%) | 0 (0.0%) |
| Life, Physical & Social Science | 0 (0.0%) | 10 (100.0%) |
| Community & Social Service | 14 (12.5%) | 98 (87.5%) |
| Education, Arts & Media | 0 (0.0%) | 34 (100.0%) |
| Legal Services & Support | 0 (0.0%) | 0 (0.0%) |
| Education Instruction & Library | 14 (30.4%) | 32 (69.6%) |
| Arts, Media & Entertainment | 0 (0.0%) | 32 (100.0%) |
| Health Diagnosing & Treating | 0 (0.0%) | 61 (100.0%) |
| Health Technologists | 0 (0.0%) | 27 (100.0%) |
| Total (Category) | 128 (43.1%) | 169 (56.9%) |
| Total (Overall) | 1,131 (55.7%) | 899 (44.3%) |
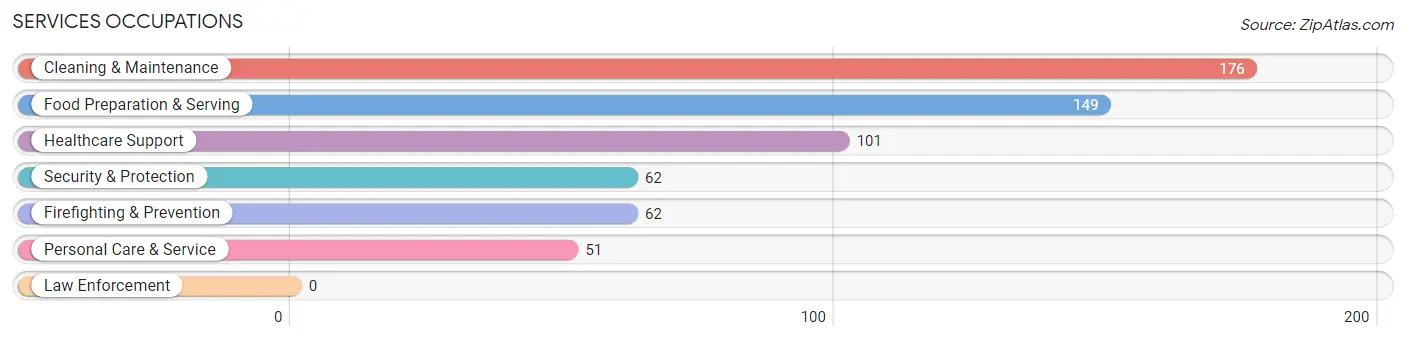
Services Occupations
The most common Services occupations in Mayfair are Cleaning & Maintenance (176 | 8.7%), Food Preparation & Serving (149 | 7.3%), Healthcare Support (101 | 5.0%), Security & Protection (62 | 3.0%), and Firefighting & Prevention (62 | 3.0%).
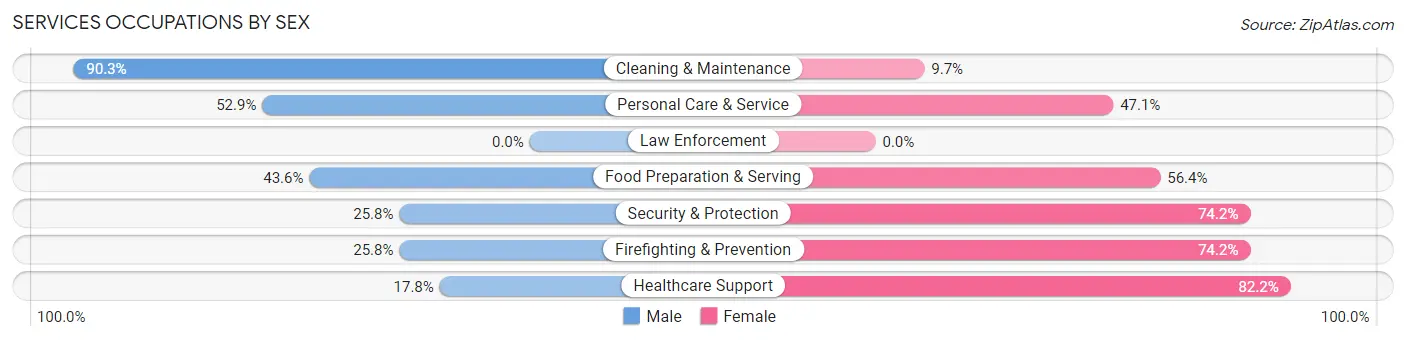
Services Occupations by Sex
Within the Services occupations in Mayfair, the most male-oriented occupations are Cleaning & Maintenance (90.3%), Personal Care & Service (52.9%), and Food Preparation & Serving (43.6%), while the most female-oriented occupations are Healthcare Support (82.2%), Security & Protection (74.2%), and Firefighting & Prevention (74.2%).
| Occupation | Male | Female |
| Healthcare Support | 18 (17.8%) | 83 (82.2%) |
| Security & Protection | 16 (25.8%) | 46 (74.2%) |
| Firefighting & Prevention | 16 (25.8%) | 46 (74.2%) |
| Law Enforcement | 0 (0.0%) | 0 (0.0%) |
| Food Preparation & Serving | 65 (43.6%) | 84 (56.4%) |
| Cleaning & Maintenance | 159 (90.3%) | 17 (9.7%) |
| Personal Care & Service | 27 (52.9%) | 24 (47.1%) |
| Total (Category) | 285 (52.9%) | 254 (47.1%) |
| Total (Overall) | 1,131 (55.7%) | 899 (44.3%) |
Sales and Office Occupations
The most common Sales and Office occupations in Mayfair are Office & Administration (372 | 18.3%), and Sales & Related (190 | 9.4%).

Sales and Office Occupations by Sex
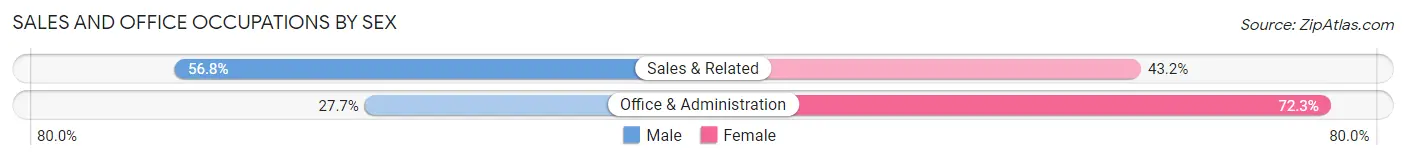
| Occupation | Male | Female |
| Sales & Related | 108 (56.8%) | 82 (43.2%) |
| Office & Administration | 103 (27.7%) | 269 (72.3%) |
| Total (Category) | 211 (37.5%) | 351 (62.5%) |
| Total (Overall) | 1,131 (55.7%) | 899 (44.3%) |
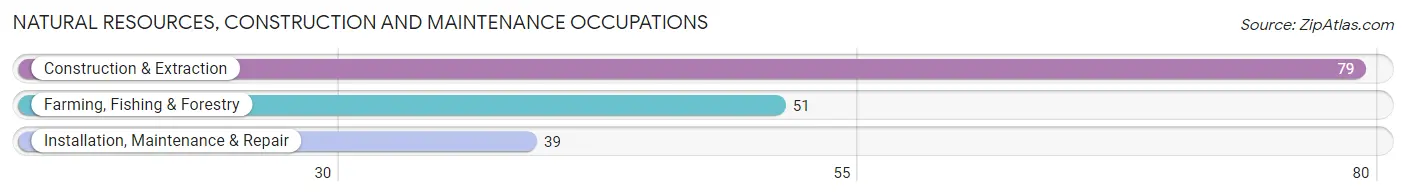
Natural Resources, Construction and Maintenance Occupations
The most common Natural Resources, Construction and Maintenance occupations in Mayfair are Construction & Extraction (79 | 3.9%), Farming, Fishing & Forestry (51 | 2.5%), and Installation, Maintenance & Repair (39 | 1.9%).
Natural Resources, Construction and Maintenance Occupations by Sex
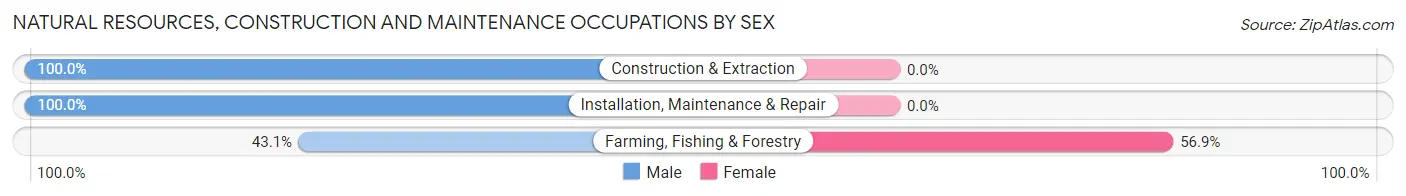
| Occupation | Male | Female |
| Farming, Fishing & Forestry | 22 (43.1%) | 29 (56.9%) |
| Construction & Extraction | 79 (100.0%) | 0 (0.0%) |
| Installation, Maintenance & Repair | 39 (100.0%) | 0 (0.0%) |
| Total (Category) | 140 (82.8%) | 29 (17.2%) |
| Total (Overall) | 1,131 (55.7%) | 899 (44.3%) |
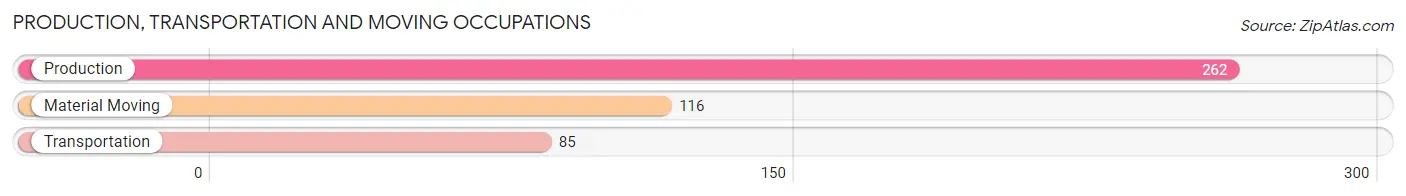
Production, Transportation and Moving Occupations
The most common Production, Transportation and Moving occupations in Mayfair are Production (262 | 12.9%), Material Moving (116 | 5.7%), and Transportation (85 | 4.2%).
Production, Transportation and Moving Occupations by Sex
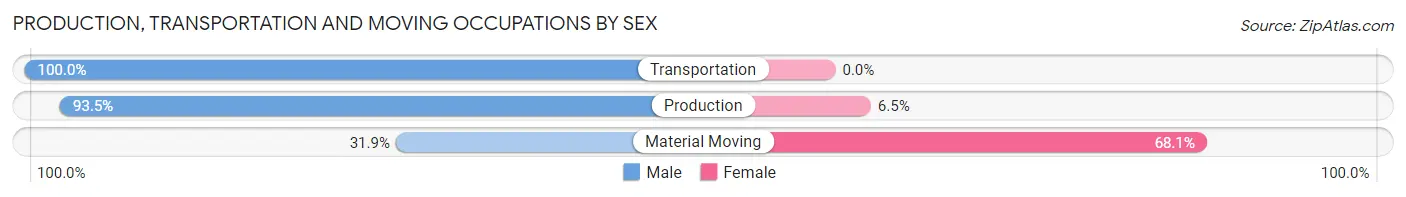
| Occupation | Male | Female |
| Production | 245 (93.5%) | 17 (6.5%) |
| Transportation | 85 (100.0%) | 0 (0.0%) |
| Material Moving | 37 (31.9%) | 79 (68.1%) |
| Total (Category) | 367 (79.3%) | 96 (20.7%) |
| Total (Overall) | 1,131 (55.7%) | 899 (44.3%) |
Employment Industries by Sex in Mayfair
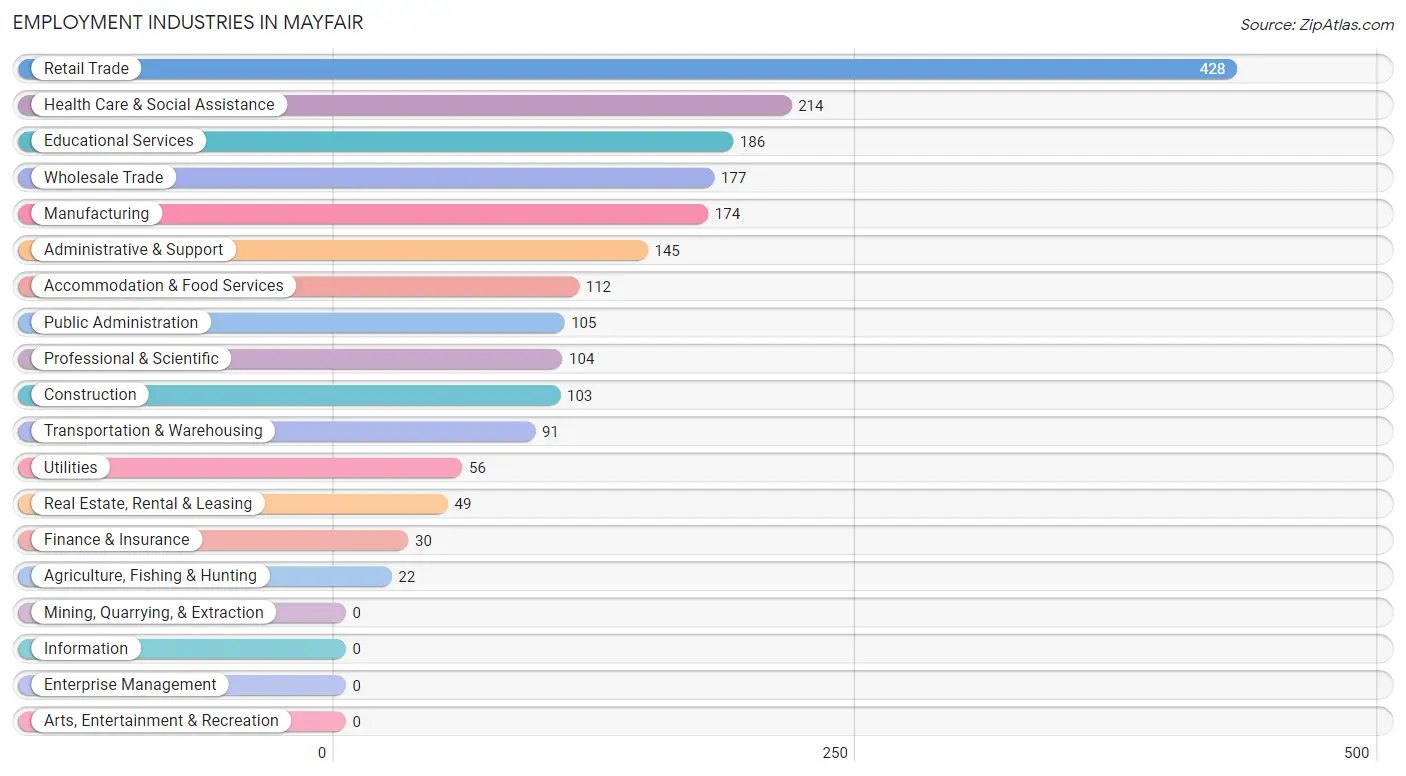
Employment Industries in Mayfair
The major employment industries in Mayfair include Retail Trade (428 | 21.1%), Health Care & Social Assistance (214 | 10.5%), Educational Services (186 | 9.2%), Wholesale Trade (177 | 8.7%), and Manufacturing (174 | 8.6%).
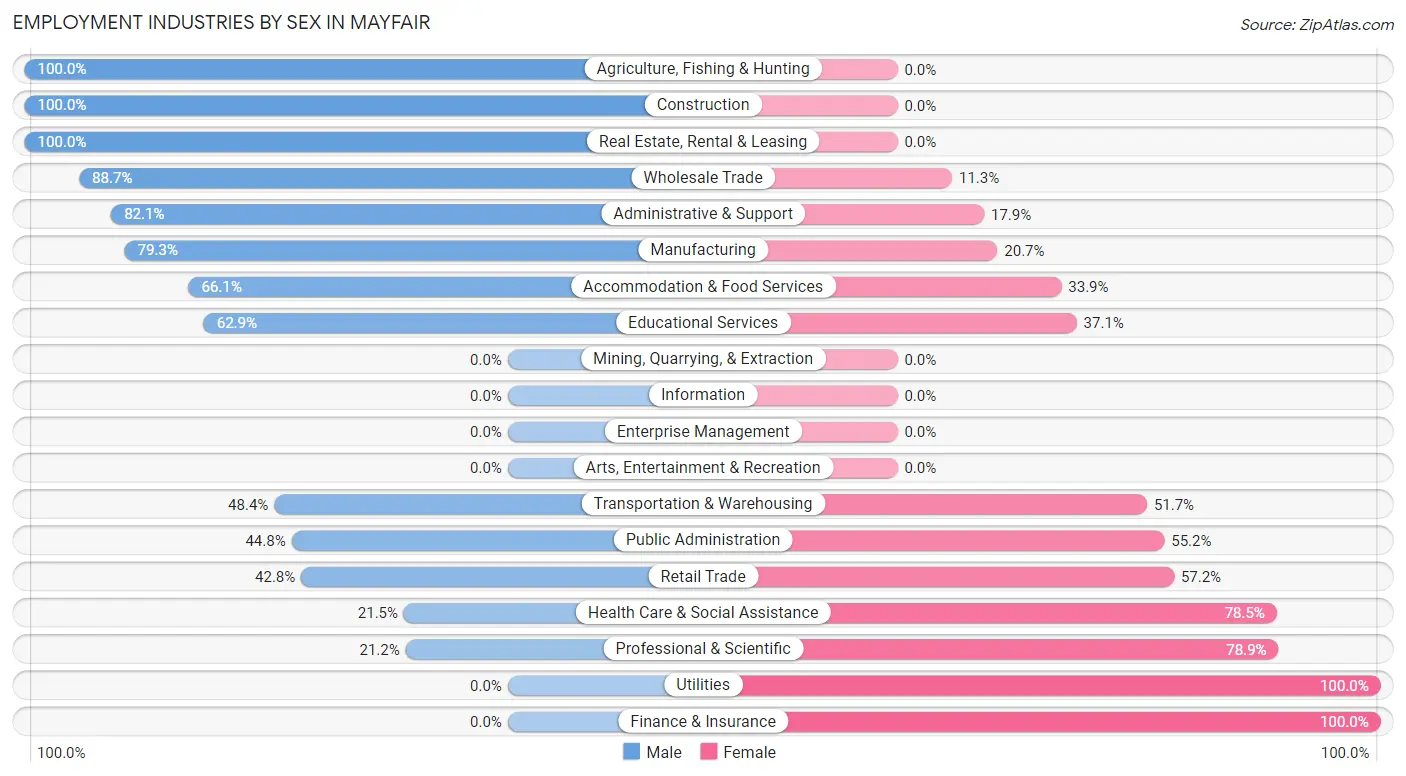
Employment Industries by Sex in Mayfair
The Mayfair industries that see more men than women are Agriculture, Fishing & Hunting (100.0%), Construction (100.0%), and Real Estate, Rental & Leasing (100.0%), whereas the industries that tend to have a higher number of women are Utilities (100.0%), Finance & Insurance (100.0%), and Professional & Scientific (78.8%).
| Industry | Male | Female |
| Agriculture, Fishing & Hunting | 22 (100.0%) | 0 (0.0%) |
| Mining, Quarrying, & Extraction | 0 (0.0%) | 0 (0.0%) |
| Construction | 103 (100.0%) | 0 (0.0%) |
| Manufacturing | 138 (79.3%) | 36 (20.7%) |
| Wholesale Trade | 157 (88.7%) | 20 (11.3%) |
| Retail Trade | 183 (42.8%) | 245 (57.2%) |
| Transportation & Warehousing | 44 (48.3%) | 47 (51.6%) |
| Utilities | 0 (0.0%) | 56 (100.0%) |
| Information | 0 (0.0%) | 0 (0.0%) |
| Finance & Insurance | 0 (0.0%) | 30 (100.0%) |
| Real Estate, Rental & Leasing | 49 (100.0%) | 0 (0.0%) |
| Professional & Scientific | 22 (21.1%) | 82 (78.8%) |
| Enterprise Management | 0 (0.0%) | 0 (0.0%) |
| Administrative & Support | 119 (82.1%) | 26 (17.9%) |
| Educational Services | 117 (62.9%) | 69 (37.1%) |
| Health Care & Social Assistance | 46 (21.5%) | 168 (78.5%) |
| Arts, Entertainment & Recreation | 0 (0.0%) | 0 (0.0%) |
| Accommodation & Food Services | 74 (66.1%) | 38 (33.9%) |
| Public Administration | 47 (44.8%) | 58 (55.2%) |
| Total | 1,131 (55.7%) | 899 (44.3%) |
Education in Mayfair
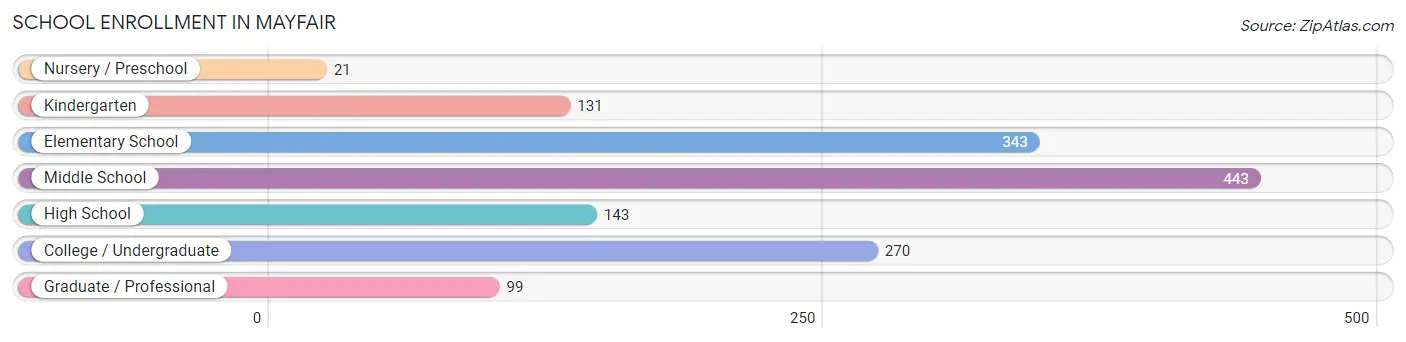
School Enrollment in Mayfair
The most common levels of schooling among the 1,450 students in Mayfair are middle school (443 | 30.5%), elementary school (343 | 23.7%), and college / undergraduate (270 | 18.6%).
| School Level | # Students | % Students |
| Nursery / Preschool | 21 | 1.5% |
| Kindergarten | 131 | 9.0% |
| Elementary School | 343 | 23.7% |
| Middle School | 443 | 30.5% |
| High School | 143 | 9.9% |
| College / Undergraduate | 270 | 18.6% |
| Graduate / Professional | 99 | 6.8% |
| Total | 1,450 | 100.0% |
School Enrollment by Age by Funding Source in Mayfair
Out of a total of 1,450 students who are enrolled in schools in Mayfair, 19 (1.3%) attend a private institution, while the remaining 1,431 (98.7%) are enrolled in public schools. The age group of 25 to 34 year olds has the highest likelihood of being enrolled in private schools, with 19 (9.9% in the age bracket) enrolled. Conversely, the age group of 3 to 4 year olds has the lowest likelihood of being enrolled in a private school, with 21 (100.0% in the age bracket) attending a public institution.
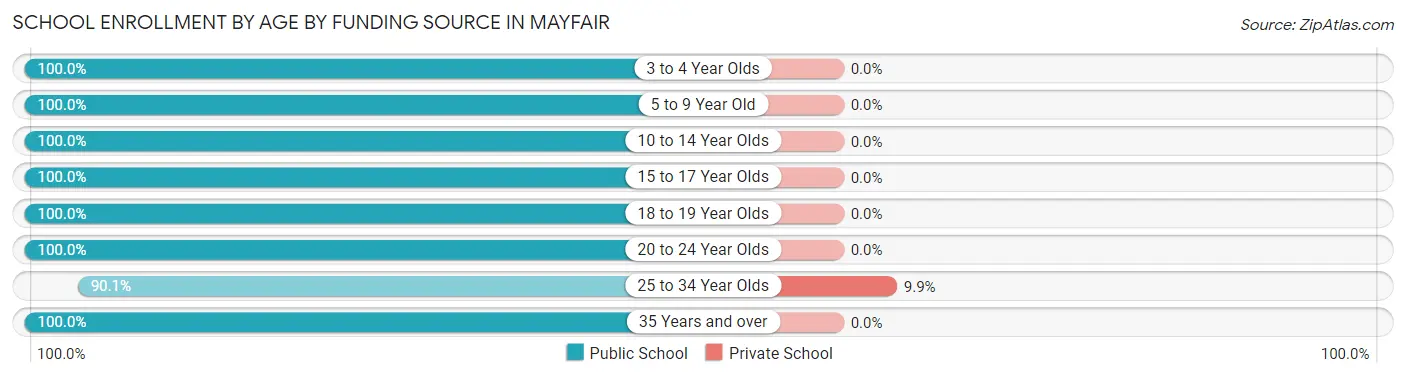
| Age Bracket | Public School | Private School |
| 3 to 4 Year Olds | 21 (100.0%) | 0 (0.0%) |
| 5 to 9 Year Old | 473 (100.0%) | 0 (0.0%) |
| 10 to 14 Year Olds | 404 (100.0%) | 0 (0.0%) |
| 15 to 17 Year Olds | 98 (100.0%) | 0 (0.0%) |
| 18 to 19 Year Olds | 64 (100.0%) | 0 (0.0%) |
| 20 to 24 Year Olds | 142 (100.0%) | 0 (0.0%) |
| 25 to 34 Year Olds | 173 (90.1%) | 19 (9.9%) |
| 35 Years and over | 56 (100.0%) | 0 (0.0%) |
| Total | 1,431 (98.7%) | 19 (1.3%) |
Educational Attainment by Field of Study in Mayfair
Bio, nature & agricultural (145 | 31.7%), business (111 | 24.2%), liberal arts & history (49 | 10.7%), science & technology (42 | 9.2%), and visual & performing arts (42 | 9.2%) are the most common fields of study among 458 individuals in Mayfair who have obtained a bachelor's degree or higher.
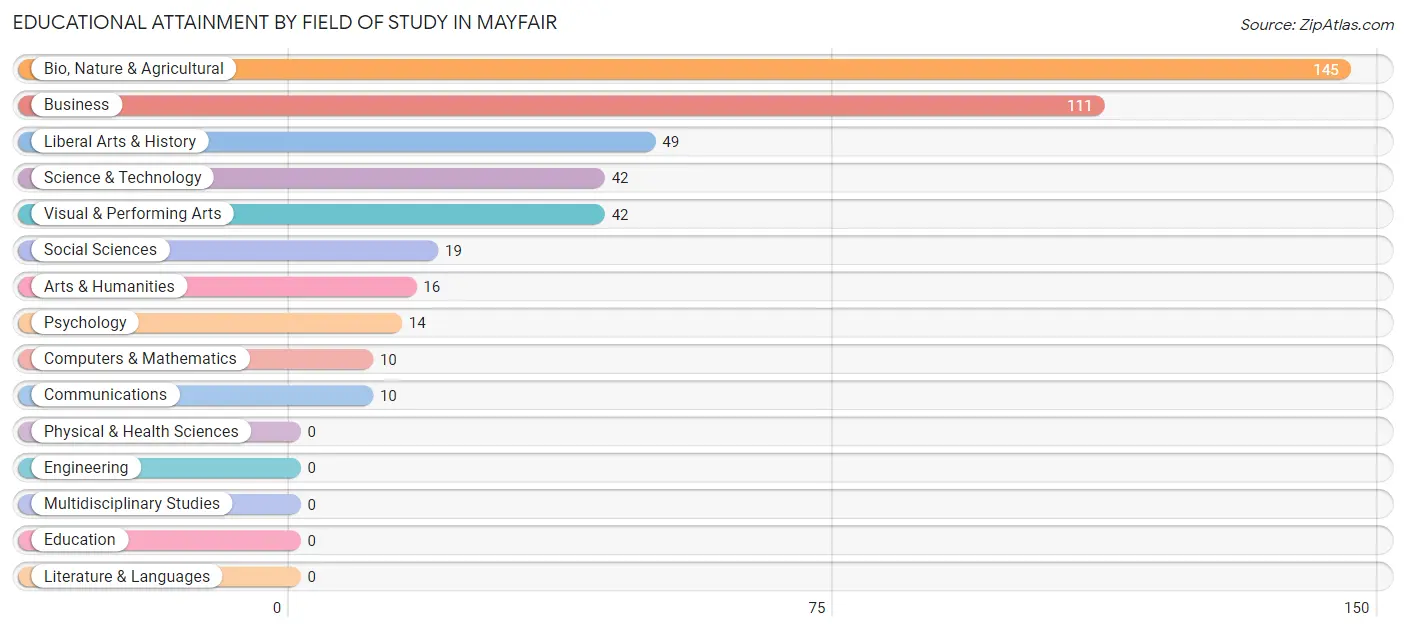
| Field of Study | # Graduates | % Graduates |
| Computers & Mathematics | 10 | 2.2% |
| Bio, Nature & Agricultural | 145 | 31.7% |
| Physical & Health Sciences | 0 | 0.0% |
| Psychology | 14 | 3.1% |
| Social Sciences | 19 | 4.2% |
| Engineering | 0 | 0.0% |
| Multidisciplinary Studies | 0 | 0.0% |
| Science & Technology | 42 | 9.2% |
| Business | 111 | 24.2% |
| Education | 0 | 0.0% |
| Literature & Languages | 0 | 0.0% |
| Liberal Arts & History | 49 | 10.7% |
| Visual & Performing Arts | 42 | 9.2% |
| Communications | 10 | 2.2% |
| Arts & Humanities | 16 | 3.5% |
| Total | 458 | 100.0% |
Transportation & Commute in Mayfair
Vehicle Availability by Sex in Mayfair
The most prevalent vehicle ownership categories in Mayfair are males with 2 vehicles (686, accounting for 61.0%) and females with 2 vehicles (363, making up 76.6%).
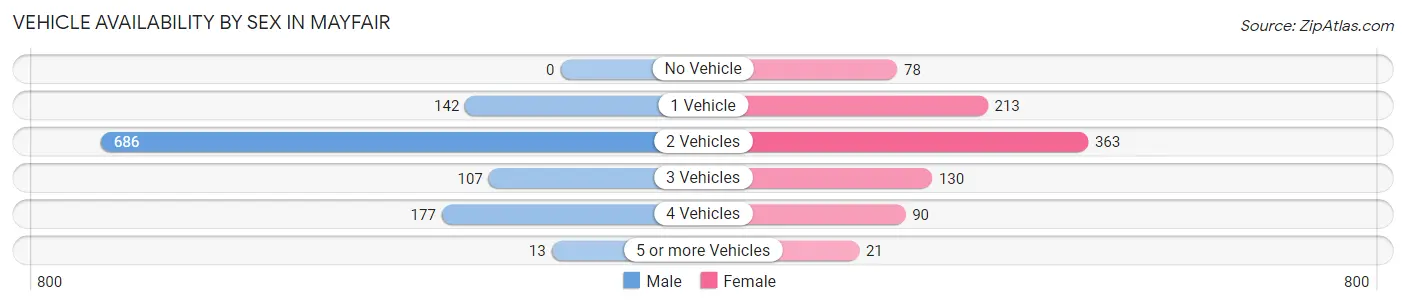
| Vehicles Available | Male | Female |
| No Vehicle | 0 (0.0%) | 78 (8.7%) |
| 1 Vehicle | 142 (12.6%) | 213 (23.8%) |
| 2 Vehicles | 686 (61.0%) | 363 (40.6%) |
| 3 Vehicles | 107 (9.5%) | 130 (14.5%) |
| 4 Vehicles | 177 (15.7%) | 90 (10.1%) |
| 5 or more Vehicles | 13 (1.2%) | 21 (2.4%) |
| Total | 1,125 (100.0%) | 895 (100.0%) |
Commute Time in Mayfair
The most frequently occuring commute durations in Mayfair are 15 to 19 minutes (447 commuters, 23.5%), 20 to 24 minutes (381 commuters, 20.1%), and 10 to 14 minutes (354 commuters, 18.6%).
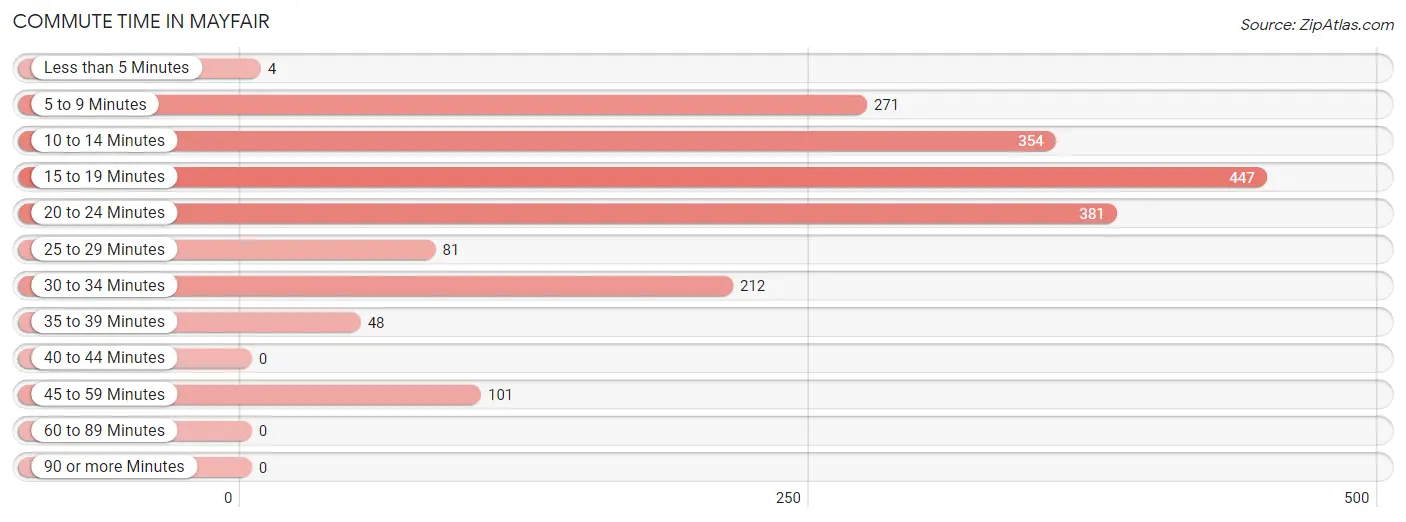
| Commute Time | # Commuters | % Commuters |
| Less than 5 Minutes | 4 | 0.2% |
| 5 to 9 Minutes | 271 | 14.3% |
| 10 to 14 Minutes | 354 | 18.6% |
| 15 to 19 Minutes | 447 | 23.5% |
| 20 to 24 Minutes | 381 | 20.1% |
| 25 to 29 Minutes | 81 | 4.3% |
| 30 to 34 Minutes | 212 | 11.2% |
| 35 to 39 Minutes | 48 | 2.5% |
| 40 to 44 Minutes | 0 | 0.0% |
| 45 to 59 Minutes | 101 | 5.3% |
| 60 to 89 Minutes | 0 | 0.0% |
| 90 or more Minutes | 0 | 0.0% |
Commute Time by Sex in Mayfair
The most common commute times in Mayfair are 15 to 19 minutes (232 commuters, 21.0%) for males and 15 to 19 minutes (215 commuters, 27.0%) for females.
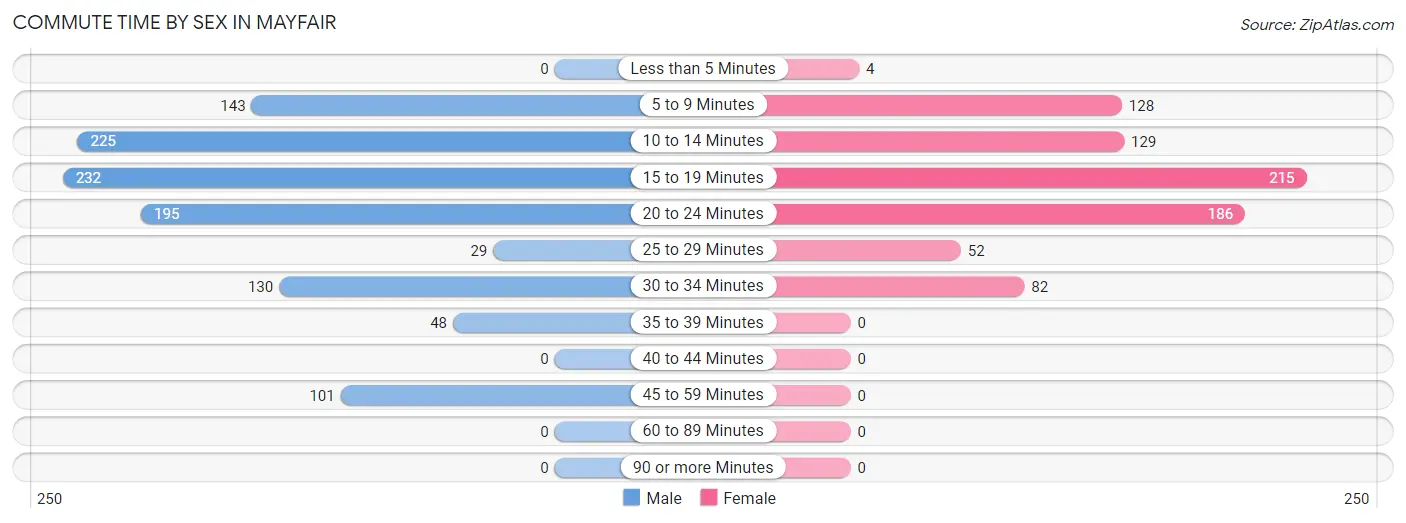
| Commute Time | Male | Female |
| Less than 5 Minutes | 0 (0.0%) | 4 (0.5%) |
| 5 to 9 Minutes | 143 (13.0%) | 128 (16.1%) |
| 10 to 14 Minutes | 225 (20.4%) | 129 (16.2%) |
| 15 to 19 Minutes | 232 (21.0%) | 215 (27.0%) |
| 20 to 24 Minutes | 195 (17.7%) | 186 (23.4%) |
| 25 to 29 Minutes | 29 (2.6%) | 52 (6.5%) |
| 30 to 34 Minutes | 130 (11.8%) | 82 (10.3%) |
| 35 to 39 Minutes | 48 (4.3%) | 0 (0.0%) |
| 40 to 44 Minutes | 0 (0.0%) | 0 (0.0%) |
| 45 to 59 Minutes | 101 (9.2%) | 0 (0.0%) |
| 60 to 89 Minutes | 0 (0.0%) | 0 (0.0%) |
| 90 or more Minutes | 0 (0.0%) | 0 (0.0%) |
Time of Departure to Work by Sex in Mayfair
The most frequent times of departure to work in Mayfair are 5:00 AM to 5:29 AM (249, 22.6%) for males and 7:30 AM to 7:59 AM (188, 23.6%) for females.
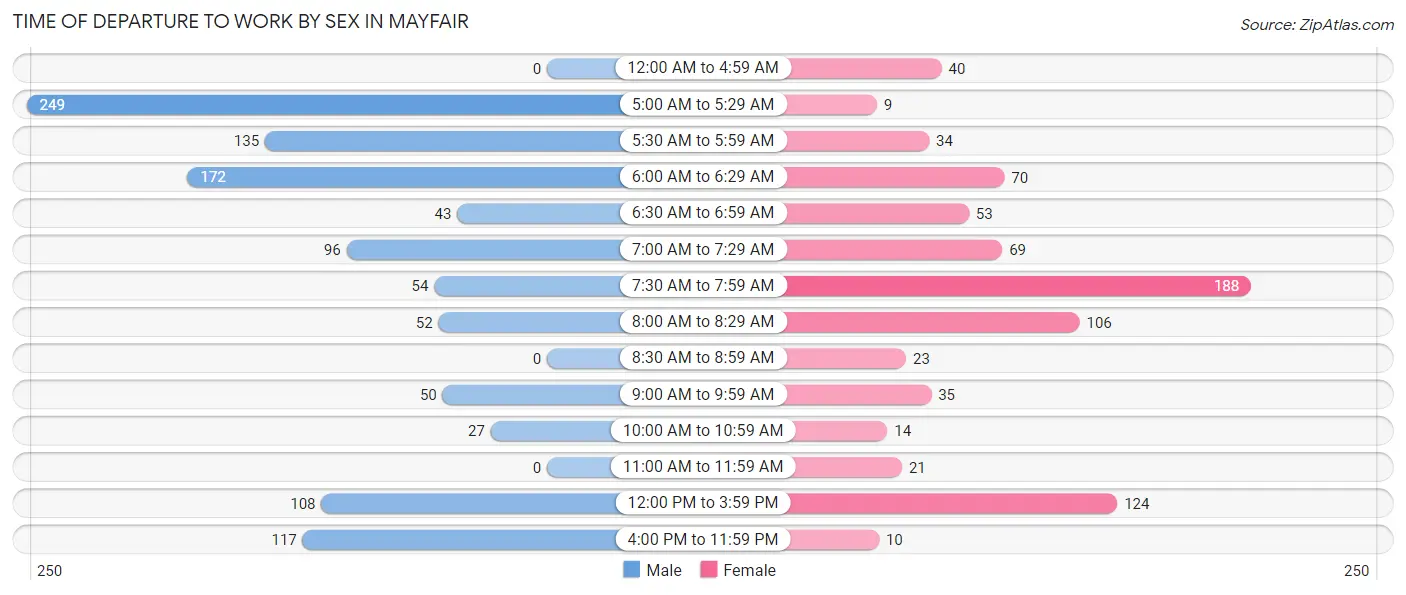
| Time of Departure | Male | Female |
| 12:00 AM to 4:59 AM | 0 (0.0%) | 40 (5.0%) |
| 5:00 AM to 5:29 AM | 249 (22.6%) | 9 (1.1%) |
| 5:30 AM to 5:59 AM | 135 (12.2%) | 34 (4.3%) |
| 6:00 AM to 6:29 AM | 172 (15.6%) | 70 (8.8%) |
| 6:30 AM to 6:59 AM | 43 (3.9%) | 53 (6.7%) |
| 7:00 AM to 7:29 AM | 96 (8.7%) | 69 (8.7%) |
| 7:30 AM to 7:59 AM | 54 (4.9%) | 188 (23.6%) |
| 8:00 AM to 8:29 AM | 52 (4.7%) | 106 (13.3%) |
| 8:30 AM to 8:59 AM | 0 (0.0%) | 23 (2.9%) |
| 9:00 AM to 9:59 AM | 50 (4.5%) | 35 (4.4%) |
| 10:00 AM to 10:59 AM | 27 (2.5%) | 14 (1.8%) |
| 11:00 AM to 11:59 AM | 0 (0.0%) | 21 (2.6%) |
| 12:00 PM to 3:59 PM | 108 (9.8%) | 124 (15.6%) |
| 4:00 PM to 11:59 PM | 117 (10.6%) | 10 (1.3%) |
| Total | 1,103 (100.0%) | 796 (100.0%) |
Housing Occupancy in Mayfair
Occupancy by Ownership in Mayfair
Of the total 1,640 dwellings in Mayfair, owner-occupied units account for 752 (45.9%), while renter-occupied units make up 888 (54.1%).
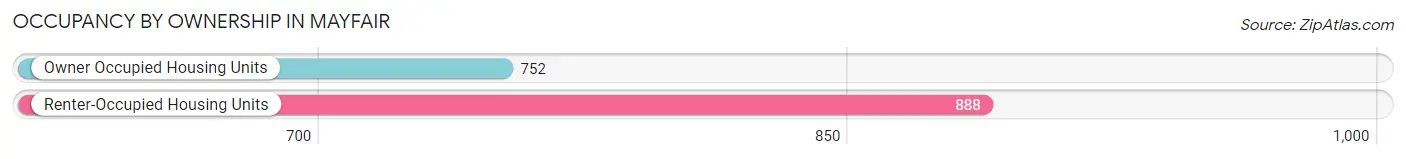
| Occupancy | # Housing Units | % Housing Units |
| Owner Occupied Housing Units | 752 | 45.9% |
| Renter-Occupied Housing Units | 888 | 54.1% |
| Total Occupied Housing Units | 1,640 | 100.0% |
Occupancy by Household Size in Mayfair
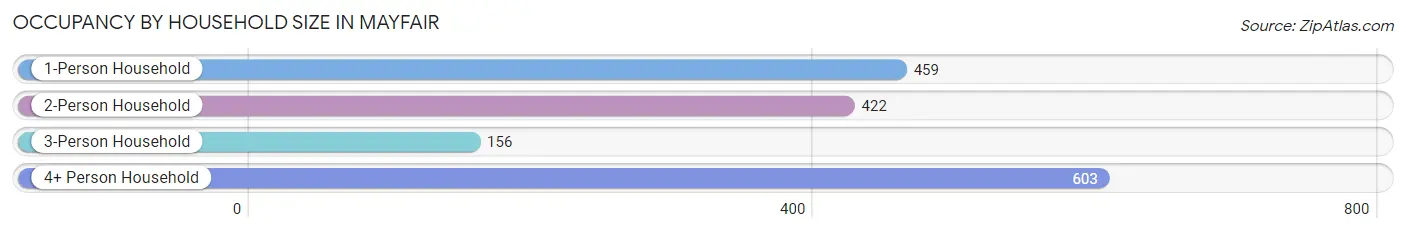
| Household Size | # Housing Units | % Housing Units |
| 1-Person Household | 459 | 28.0% |
| 2-Person Household | 422 | 25.7% |
| 3-Person Household | 156 | 9.5% |
| 4+ Person Household | 603 | 36.8% |
| Total Housing Units | 1,640 | 100.0% |
Occupancy by Ownership by Household Size in Mayfair
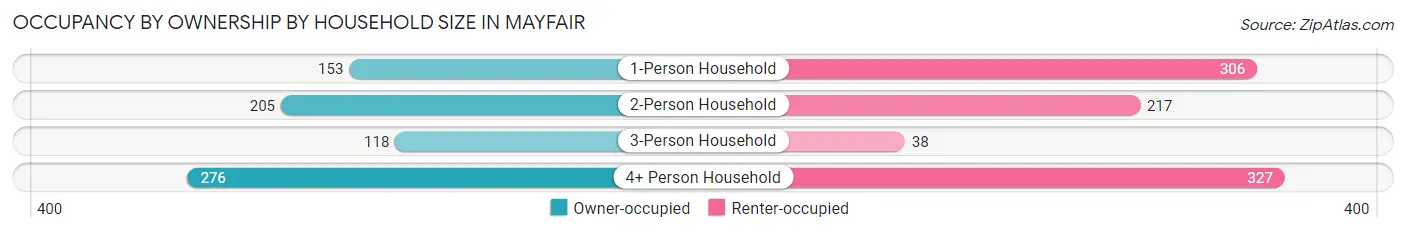
| Household Size | Owner-occupied | Renter-occupied |
| 1-Person Household | 153 (33.3%) | 306 (66.7%) |
| 2-Person Household | 205 (48.6%) | 217 (51.4%) |
| 3-Person Household | 118 (75.6%) | 38 (24.4%) |
| 4+ Person Household | 276 (45.8%) | 327 (54.2%) |
| Total Housing Units | 752 (45.9%) | 888 (54.1%) |
Occupancy by Educational Attainment in Mayfair
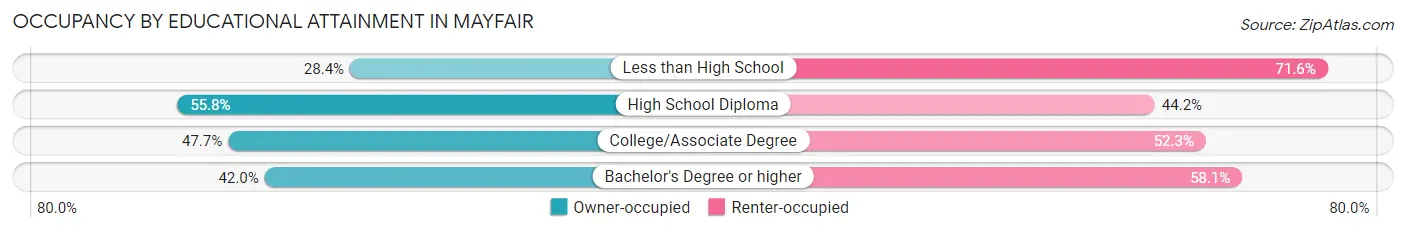
| Household Size | Owner-occupied | Renter-occupied |
| Less than High School | 71 (28.4%) | 179 (71.6%) |
| High School Diploma | 241 (55.8%) | 191 (44.2%) |
| College/Associate Degree | 315 (47.7%) | 345 (52.3%) |
| Bachelor's Degree or higher | 125 (41.9%) | 173 (58.1%) |
Occupancy by Age of Householder in Mayfair
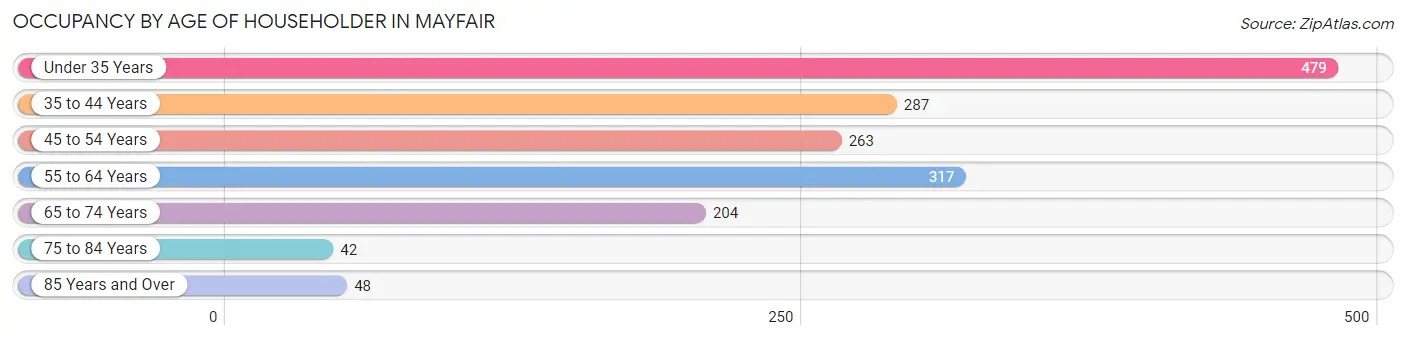
| Age Bracket | # Households | % Households |
| Under 35 Years | 479 | 29.2% |
| 35 to 44 Years | 287 | 17.5% |
| 45 to 54 Years | 263 | 16.0% |
| 55 to 64 Years | 317 | 19.3% |
| 65 to 74 Years | 204 | 12.4% |
| 75 to 84 Years | 42 | 2.6% |
| 85 Years and Over | 48 | 2.9% |
| Total | 1,640 | 100.0% |
Housing Finances in Mayfair
Median Income by Occupancy in Mayfair
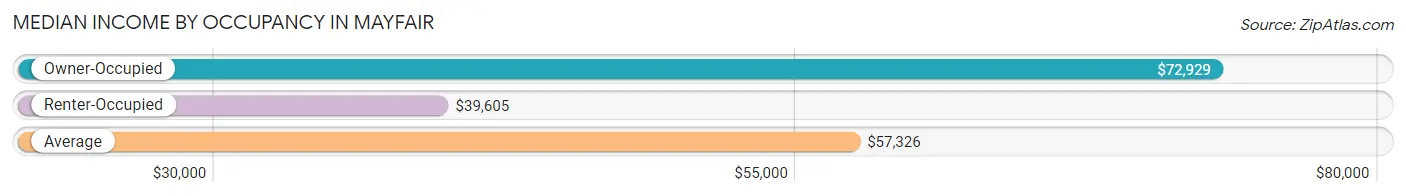
| Occupancy Type | # Households | Median Income |
| Owner-Occupied | 752 (45.9%) | $72,929 |
| Renter-Occupied | 888 (54.1%) | $39,605 |
| Average | 1,640 (100.0%) | $57,326 |
Occupancy by Householder Income Bracket in Mayfair
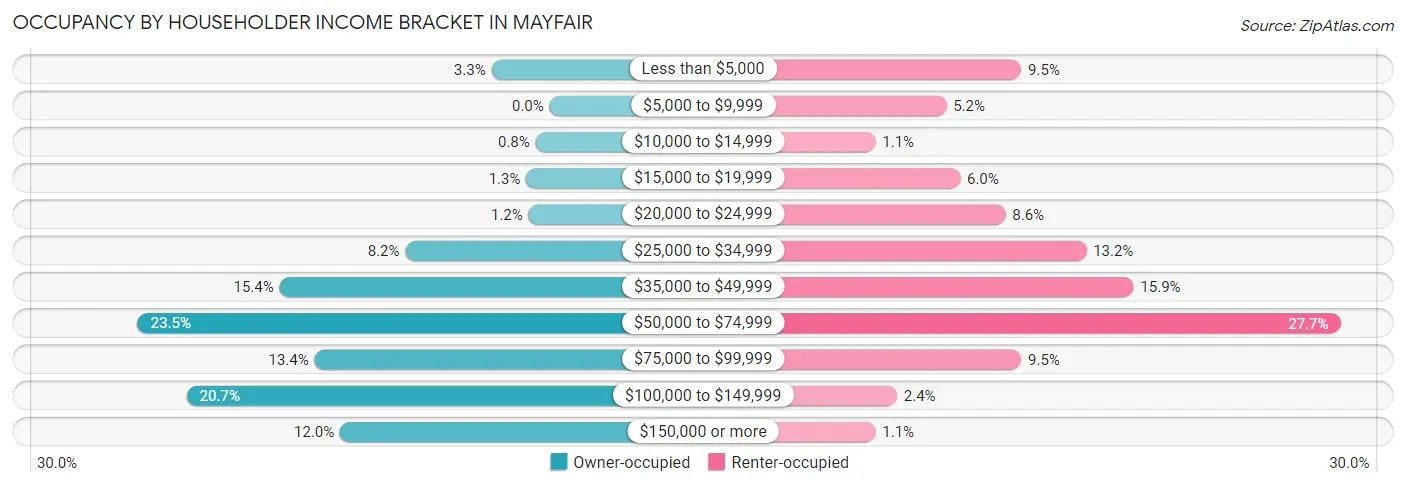
| Income Bracket | Owner-occupied | Renter-occupied |
| Less than $5,000 | 25 (3.3%) | 84 (9.5%) |
| $5,000 to $9,999 | 0 (0.0%) | 46 (5.2%) |
| $10,000 to $14,999 | 6 (0.8%) | 10 (1.1%) |
| $15,000 to $19,999 | 10 (1.3%) | 53 (6.0%) |
| $20,000 to $24,999 | 9 (1.2%) | 76 (8.6%) |
| $25,000 to $34,999 | 62 (8.2%) | 117 (13.2%) |
| $35,000 to $49,999 | 116 (15.4%) | 141 (15.9%) |
| $50,000 to $74,999 | 177 (23.5%) | 246 (27.7%) |
| $75,000 to $99,999 | 101 (13.4%) | 84 (9.5%) |
| $100,000 to $149,999 | 156 (20.7%) | 21 (2.4%) |
| $150,000 or more | 90 (12.0%) | 10 (1.1%) |
| Total | 752 (100.0%) | 888 (100.0%) |
Monthly Housing Cost Tiers in Mayfair
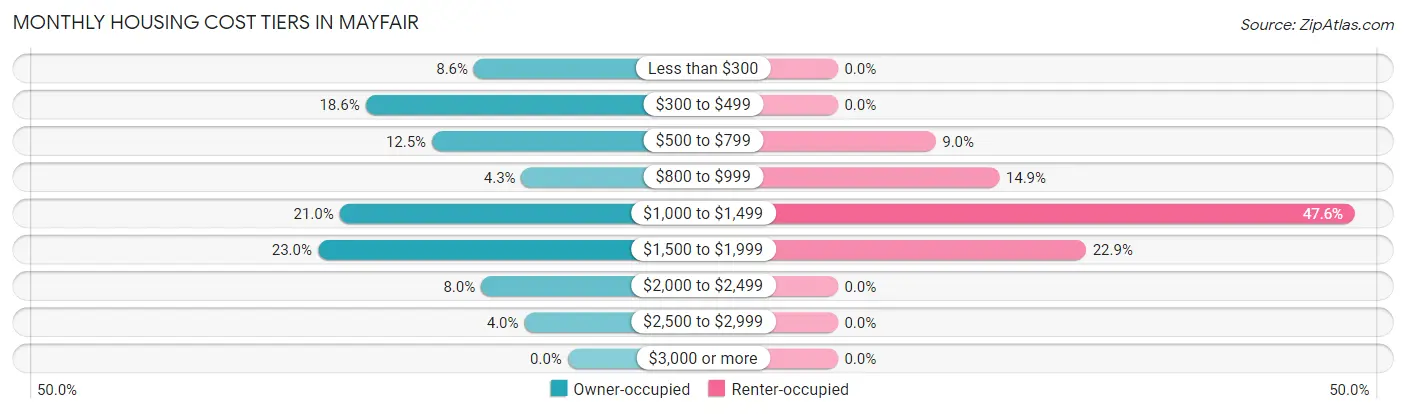
| Monthly Cost | Owner-occupied | Renter-occupied |
| Less than $300 | 65 (8.6%) | 0 (0.0%) |
| $300 to $499 | 140 (18.6%) | 0 (0.0%) |
| $500 to $799 | 94 (12.5%) | 80 (9.0%) |
| $800 to $999 | 32 (4.3%) | 132 (14.9%) |
| $1,000 to $1,499 | 158 (21.0%) | 423 (47.6%) |
| $1,500 to $1,999 | 173 (23.0%) | 203 (22.9%) |
| $2,000 to $2,499 | 60 (8.0%) | 0 (0.0%) |
| $2,500 to $2,999 | 30 (4.0%) | 0 (0.0%) |
| $3,000 or more | 0 (0.0%) | 0 (0.0%) |
| Total | 752 (100.0%) | 888 (100.0%) |
Physical Housing Characteristics in Mayfair
Housing Structures in Mayfair
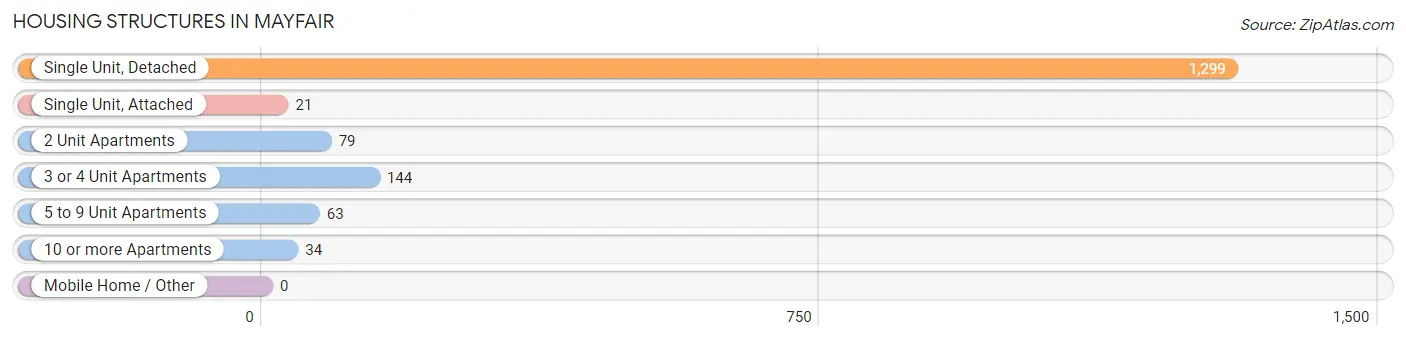
| Structure Type | # Housing Units | % Housing Units |
| Single Unit, Detached | 1,299 | 79.2% |
| Single Unit, Attached | 21 | 1.3% |
| 2 Unit Apartments | 79 | 4.8% |
| 3 or 4 Unit Apartments | 144 | 8.8% |
| 5 to 9 Unit Apartments | 63 | 3.8% |
| 10 or more Apartments | 34 | 2.1% |
| Mobile Home / Other | 0 | 0.0% |
| Total | 1,640 | 100.0% |
Housing Structures by Occupancy in Mayfair
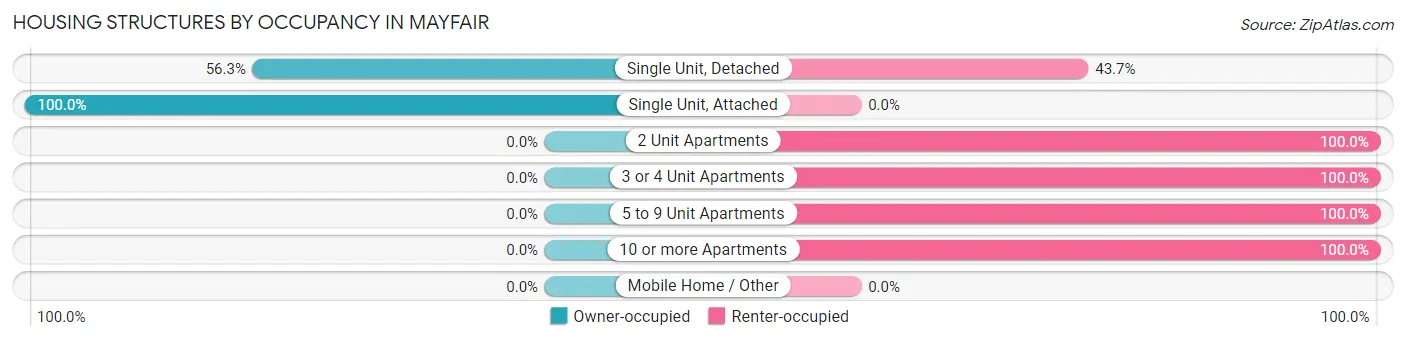
| Structure Type | Owner-occupied | Renter-occupied |
| Single Unit, Detached | 731 (56.3%) | 568 (43.7%) |
| Single Unit, Attached | 21 (100.0%) | 0 (0.0%) |
| 2 Unit Apartments | 0 (0.0%) | 79 (100.0%) |
| 3 or 4 Unit Apartments | 0 (0.0%) | 144 (100.0%) |
| 5 to 9 Unit Apartments | 0 (0.0%) | 63 (100.0%) |
| 10 or more Apartments | 0 (0.0%) | 34 (100.0%) |
| Mobile Home / Other | 0 (0.0%) | 0 (0.0%) |
| Total | 752 (45.9%) | 888 (54.1%) |
Housing Structures by Number of Rooms in Mayfair
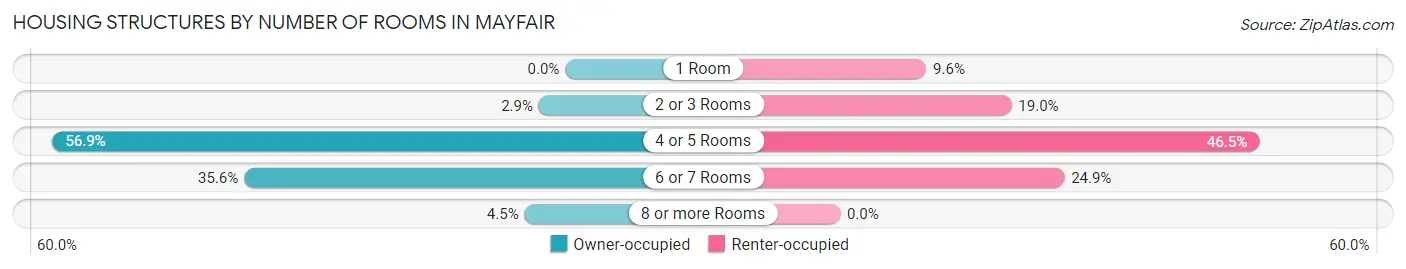
| Number of Rooms | Owner-occupied | Renter-occupied |
| 1 Room | 0 (0.0%) | 85 (9.6%) |
| 2 or 3 Rooms | 22 (2.9%) | 169 (19.0%) |
| 4 or 5 Rooms | 428 (56.9%) | 413 (46.5%) |
| 6 or 7 Rooms | 268 (35.6%) | 221 (24.9%) |
| 8 or more Rooms | 34 (4.5%) | 0 (0.0%) |
| Total | 752 (100.0%) | 888 (100.0%) |
Housing Structure by Heating Type in Mayfair
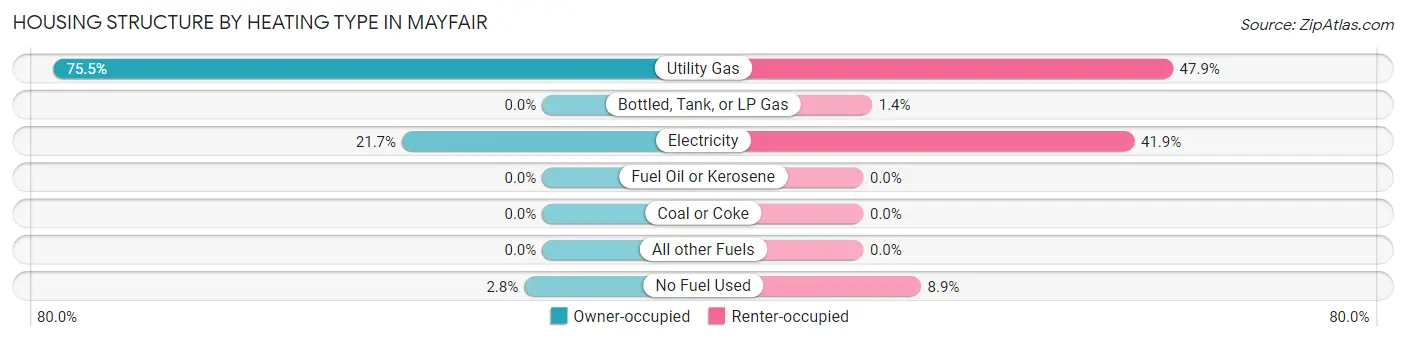
| Heating Type | Owner-occupied | Renter-occupied |
| Utility Gas | 568 (75.5%) | 425 (47.9%) |
| Bottled, Tank, or LP Gas | 0 (0.0%) | 12 (1.3%) |
| Electricity | 163 (21.7%) | 372 (41.9%) |
| Fuel Oil or Kerosene | 0 (0.0%) | 0 (0.0%) |
| Coal or Coke | 0 (0.0%) | 0 (0.0%) |
| All other Fuels | 0 (0.0%) | 0 (0.0%) |
| No Fuel Used | 21 (2.8%) | 79 (8.9%) |
| Total | 752 (100.0%) | 888 (100.0%) |
Household Vehicle Usage in Mayfair
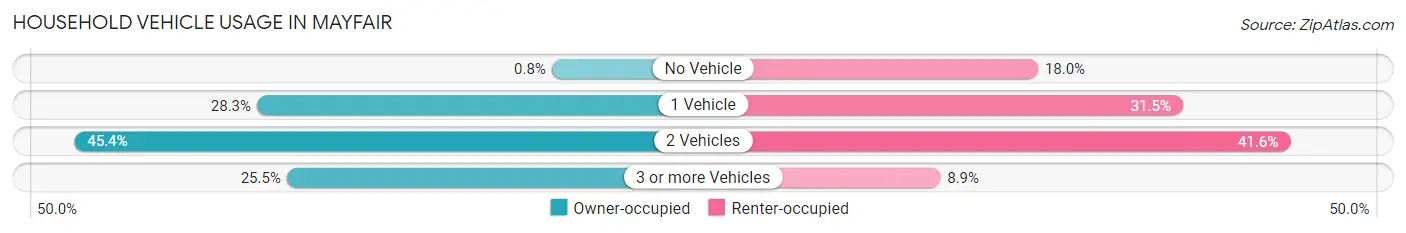
| Vehicles per Household | Owner-occupied | Renter-occupied |
| No Vehicle | 6 (0.8%) | 160 (18.0%) |
| 1 Vehicle | 213 (28.3%) | 280 (31.5%) |
| 2 Vehicles | 341 (45.4%) | 369 (41.5%) |
| 3 or more Vehicles | 192 (25.5%) | 79 (8.9%) |
| Total | 752 (100.0%) | 888 (100.0%) |
Real Estate & Mortgages in Mayfair
Real Estate and Mortgage Overview in Mayfair
| Characteristic | Without Mortgage | With Mortgage |
| Housing Units | 299 | 453 |
| Median Property Value | $211,300 | $229,300 |
| Median Household Income | $56,076 | $80 |
| Monthly Housing Costs | $448 | $0 |
| Real Estate Taxes | $1,192 | $0 |
Property Value by Mortgage Status in Mayfair
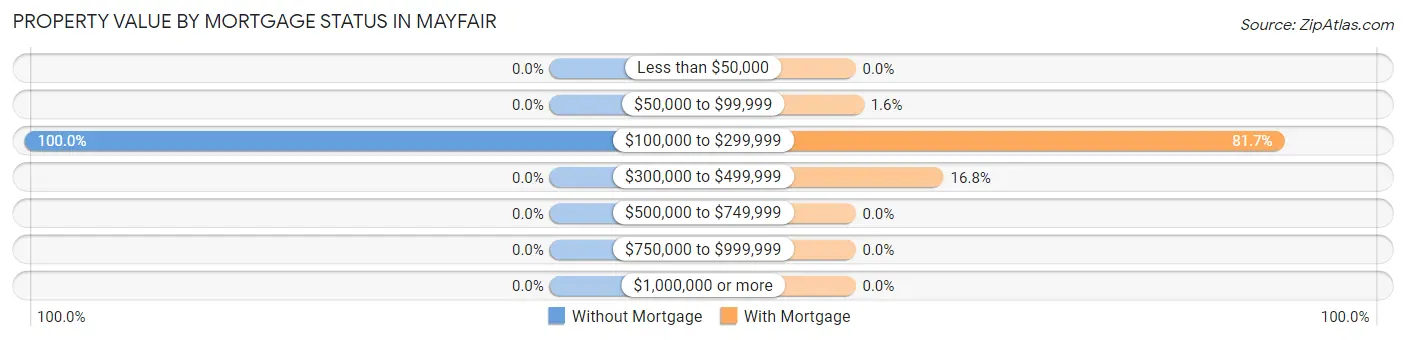
| Property Value | Without Mortgage | With Mortgage |
| Less than $50,000 | 0 (0.0%) | 0 (0.0%) |
| $50,000 to $99,999 | 0 (0.0%) | 7 (1.5%) |
| $100,000 to $299,999 | 299 (100.0%) | 370 (81.7%) |
| $300,000 to $499,999 | 0 (0.0%) | 76 (16.8%) |
| $500,000 to $749,999 | 0 (0.0%) | 0 (0.0%) |
| $750,000 to $999,999 | 0 (0.0%) | 0 (0.0%) |
| $1,000,000 or more | 0 (0.0%) | 0 (0.0%) |
| Total | 299 (100.0%) | 453 (100.0%) |
Household Income by Mortgage Status in Mayfair
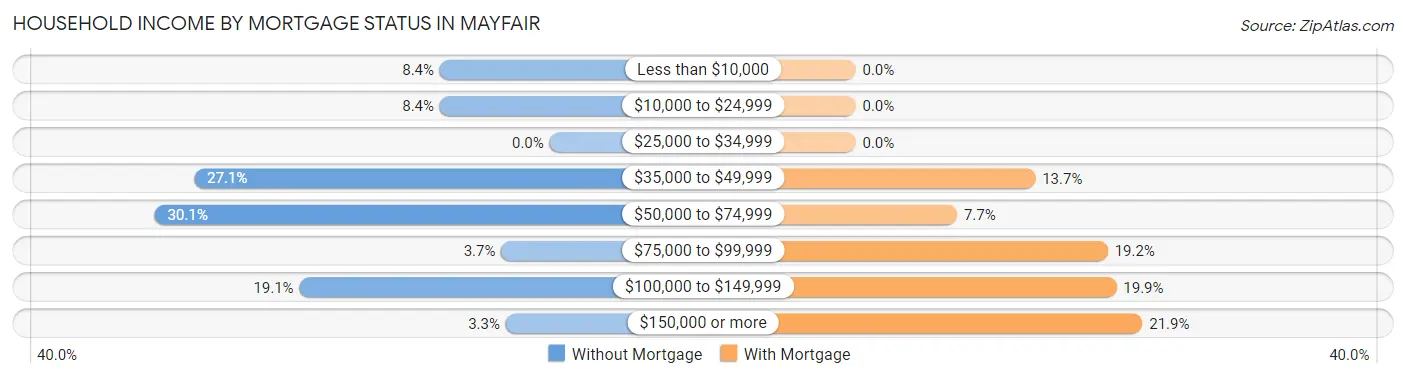
| Household Income | Without Mortgage | With Mortgage |
| Less than $10,000 | 25 (8.4%) | 0 (0.0%) |
| $10,000 to $24,999 | 25 (8.4%) | 0 (0.0%) |
| $25,000 to $34,999 | 0 (0.0%) | 0 (0.0%) |
| $35,000 to $49,999 | 81 (27.1%) | 62 (13.7%) |
| $50,000 to $74,999 | 90 (30.1%) | 35 (7.7%) |
| $75,000 to $99,999 | 11 (3.7%) | 87 (19.2%) |
| $100,000 to $149,999 | 57 (19.1%) | 90 (19.9%) |
| $150,000 or more | 10 (3.3%) | 99 (21.8%) |
| Total | 299 (100.0%) | 453 (100.0%) |
Property Value to Household Income Ratio in Mayfair
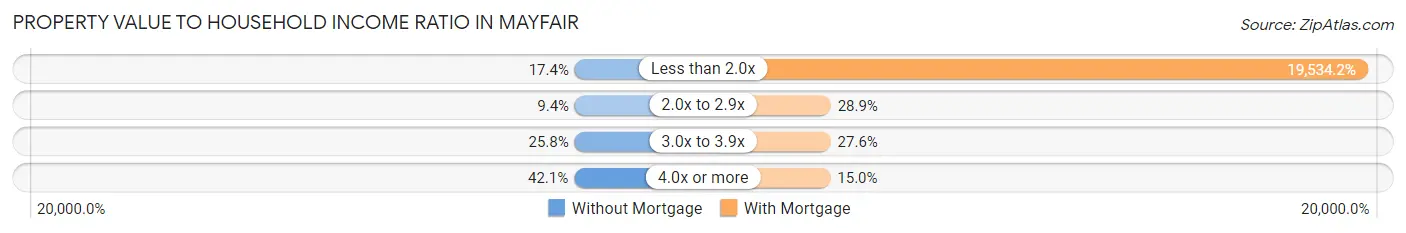
| Value-to-Income Ratio | Without Mortgage | With Mortgage |
| Less than 2.0x | 52 (17.4%) | 88,490 (19,534.2%) |
| 2.0x to 2.9x | 28 (9.4%) | 131 (28.9%) |
| 3.0x to 3.9x | 77 (25.8%) | 125 (27.6%) |
| 4.0x or more | 126 (42.1%) | 68 (15.0%) |
| Total | 299 (100.0%) | 453 (100.0%) |
Real Estate Taxes by Mortgage Status in Mayfair
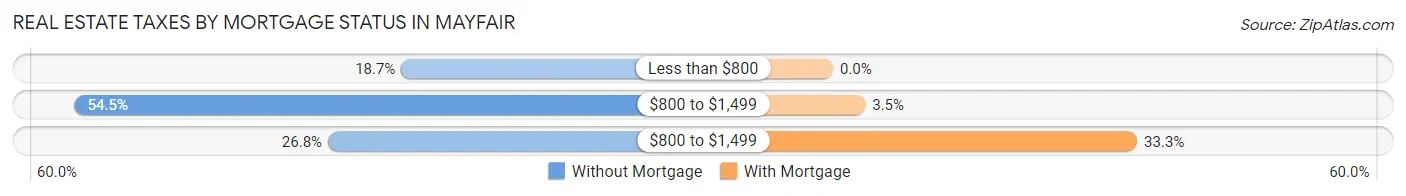
| Property Taxes | Without Mortgage | With Mortgage |
| Less than $800 | 56 (18.7%) | 0 (0.0%) |
| $800 to $1,499 | 163 (54.5%) | 16 (3.5%) |
| $800 to $1,499 | 80 (26.8%) | 151 (33.3%) |
| Total | 299 (100.0%) | 453 (100.0%) |
Health & Disability in Mayfair
Health Insurance Coverage by Age in Mayfair
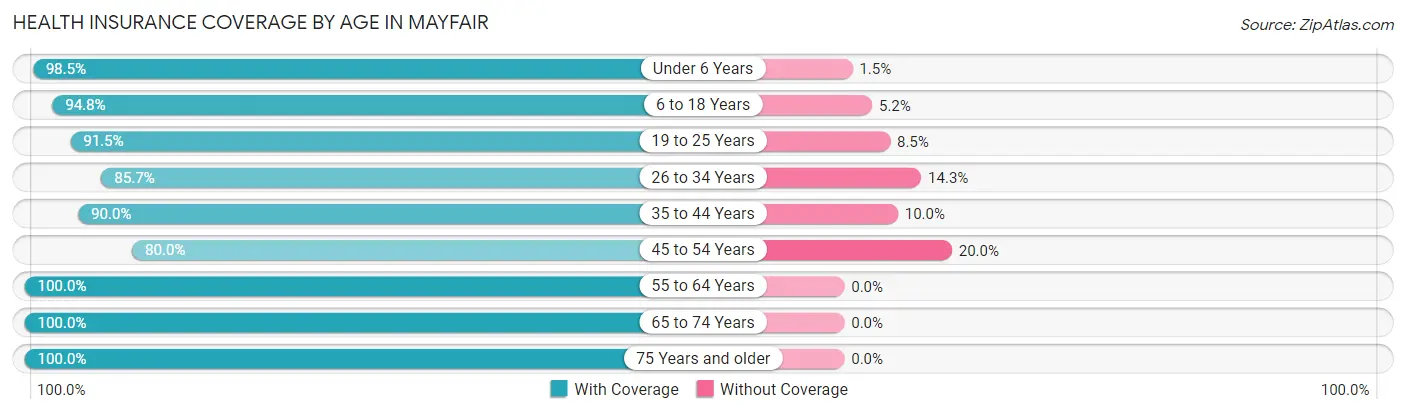
| Age Bracket | With Coverage | Without Coverage |
| Under 6 Years | 454 (98.5%) | 7 (1.5%) |
| 6 to 18 Years | 954 (94.8%) | 52 (5.2%) |
| 19 to 25 Years | 386 (91.5%) | 36 (8.5%) |
| 26 to 34 Years | 849 (85.7%) | 142 (14.3%) |
| 35 to 44 Years | 524 (90.0%) | 58 (10.0%) |
| 45 to 54 Years | 371 (80.0%) | 93 (20.0%) |
| 55 to 64 Years | 549 (100.0%) | 0 (0.0%) |
| 65 to 74 Years | 283 (100.0%) | 0 (0.0%) |
| 75 Years and older | 159 (100.0%) | 0 (0.0%) |
| Total | 4,529 (92.1%) | 388 (7.9%) |
Health Insurance Coverage by Citizenship Status in Mayfair
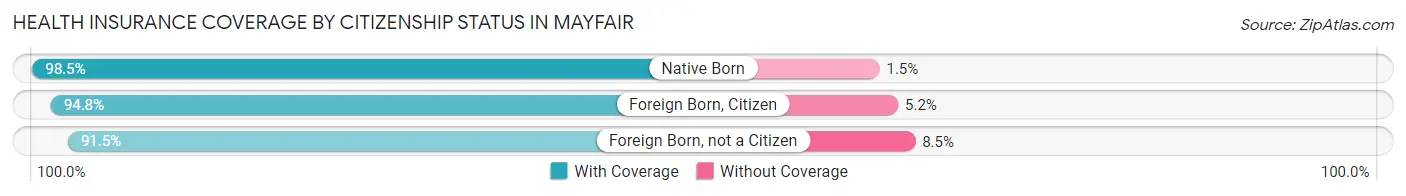
| Citizenship Status | With Coverage | Without Coverage |
| Native Born | 454 (98.5%) | 7 (1.5%) |
| Foreign Born, Citizen | 954 (94.8%) | 52 (5.2%) |
| Foreign Born, not a Citizen | 386 (91.5%) | 36 (8.5%) |
Health Insurance Coverage by Household Income in Mayfair
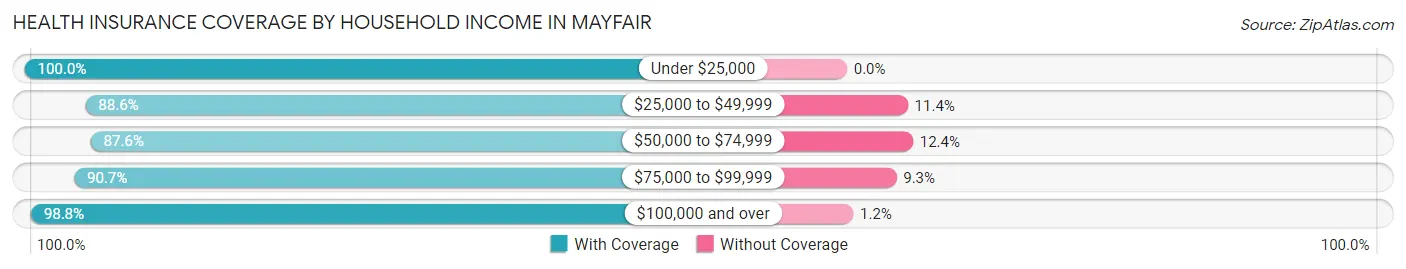
| Household Income | With Coverage | Without Coverage |
| Under $25,000 | 686 (100.0%) | 0 (0.0%) |
| $25,000 to $49,999 | 1,189 (88.6%) | 153 (11.4%) |
| $50,000 to $74,999 | 1,041 (87.6%) | 147 (12.4%) |
| $75,000 to $99,999 | 763 (90.7%) | 78 (9.3%) |
| $100,000 and over | 834 (98.8%) | 10 (1.2%) |
Public vs Private Health Insurance Coverage by Age in Mayfair
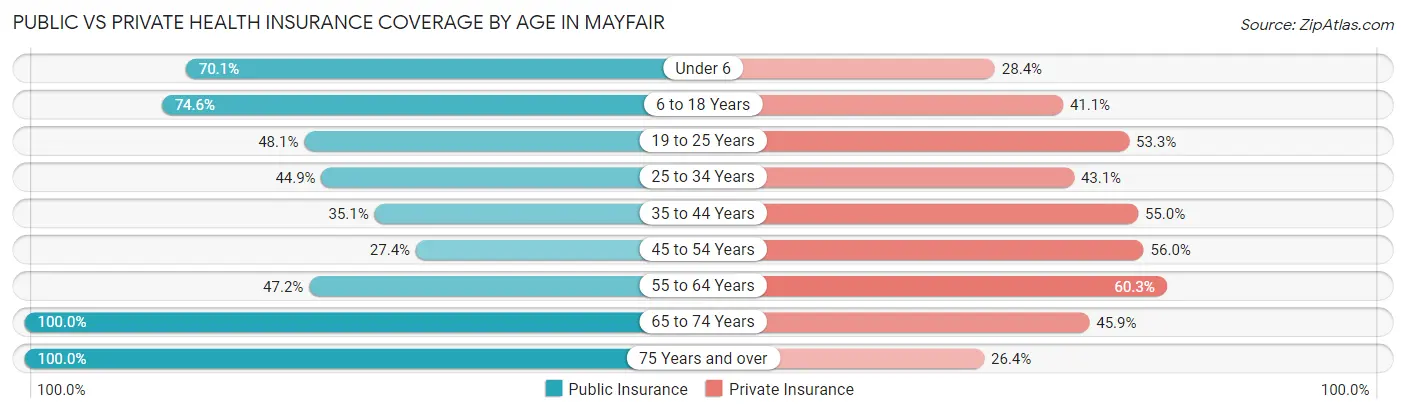
| Age Bracket | Public Insurance | Private Insurance |
| Under 6 | 323 (70.1%) | 131 (28.4%) |
| 6 to 18 Years | 750 (74.6%) | 413 (41.0%) |
| 19 to 25 Years | 203 (48.1%) | 225 (53.3%) |
| 25 to 34 Years | 445 (44.9%) | 427 (43.1%) |
| 35 to 44 Years | 204 (35.0%) | 320 (55.0%) |
| 45 to 54 Years | 127 (27.4%) | 260 (56.0%) |
| 55 to 64 Years | 259 (47.2%) | 331 (60.3%) |
| 65 to 74 Years | 283 (100.0%) | 130 (45.9%) |
| 75 Years and over | 159 (100.0%) | 42 (26.4%) |
| Total | 2,753 (56.0%) | 2,279 (46.4%) |
Disability Status by Sex by Age in Mayfair
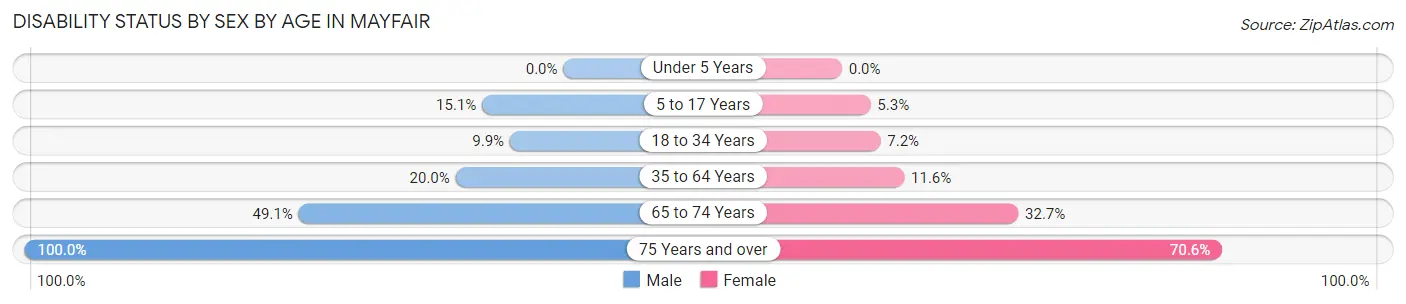
| Age Bracket | Male | Female |
| Under 5 Years | 0 (0.0%) | 0 (0.0%) |
| 5 to 17 Years | 74 (15.1%) | 28 (5.3%) |
| 18 to 34 Years | 65 (9.9%) | 55 (7.2%) |
| 35 to 64 Years | 179 (20.0%) | 81 (11.6%) |
| 65 to 74 Years | 85 (49.1%) | 36 (32.7%) |
| 75 Years and over | 6 (100.0%) | 108 (70.6%) |
Disability Class by Sex by Age in Mayfair
Disability Class: Hearing Difficulty
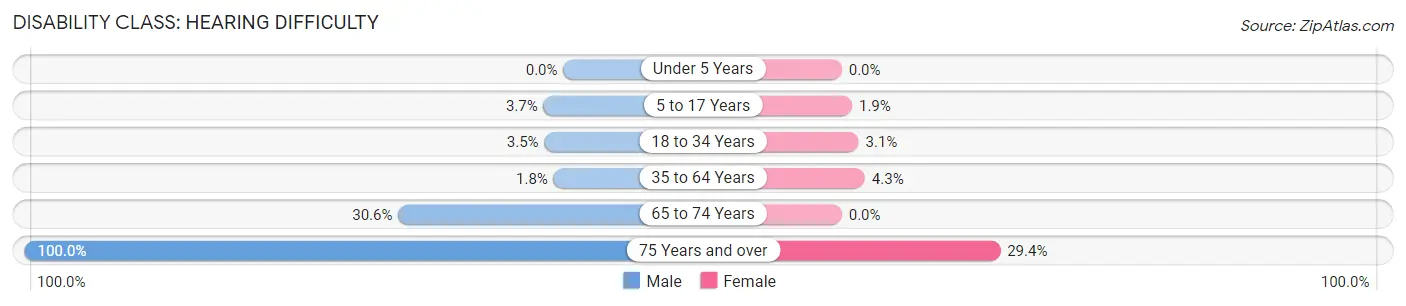
| Age Bracket | Male | Female |
| Under 5 Years | 0 (0.0%) | 0 (0.0%) |
| 5 to 17 Years | 18 (3.7%) | 10 (1.9%) |
| 18 to 34 Years | 23 (3.5%) | 24 (3.1%) |
| 35 to 64 Years | 16 (1.8%) | 30 (4.3%) |
| 65 to 74 Years | 53 (30.6%) | 0 (0.0%) |
| 75 Years and over | 6 (100.0%) | 45 (29.4%) |
Disability Class: Vision Difficulty
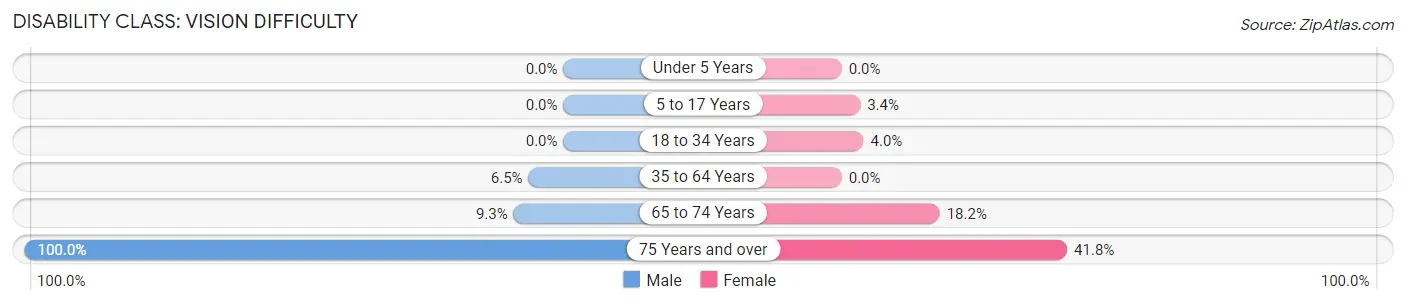
| Age Bracket | Male | Female |
| Under 5 Years | 0 (0.0%) | 0 (0.0%) |
| 5 to 17 Years | 0 (0.0%) | 18 (3.4%) |
| 18 to 34 Years | 0 (0.0%) | 31 (4.0%) |
| 35 to 64 Years | 58 (6.5%) | 0 (0.0%) |
| 65 to 74 Years | 16 (9.2%) | 20 (18.2%) |
| 75 Years and over | 6 (100.0%) | 64 (41.8%) |
Disability Class: Cognitive Difficulty
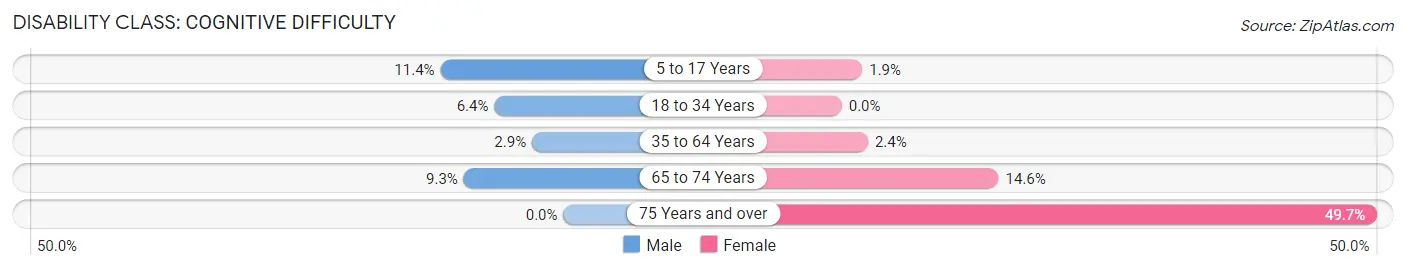
| Age Bracket | Male | Female |
| 5 to 17 Years | 56 (11.4%) | 10 (1.9%) |
| 18 to 34 Years | 42 (6.4%) | 0 (0.0%) |
| 35 to 64 Years | 26 (2.9%) | 17 (2.4%) |
| 65 to 74 Years | 16 (9.2%) | 16 (14.5%) |
| 75 Years and over | 0 (0.0%) | 76 (49.7%) |
Disability Class: Ambulatory Difficulty
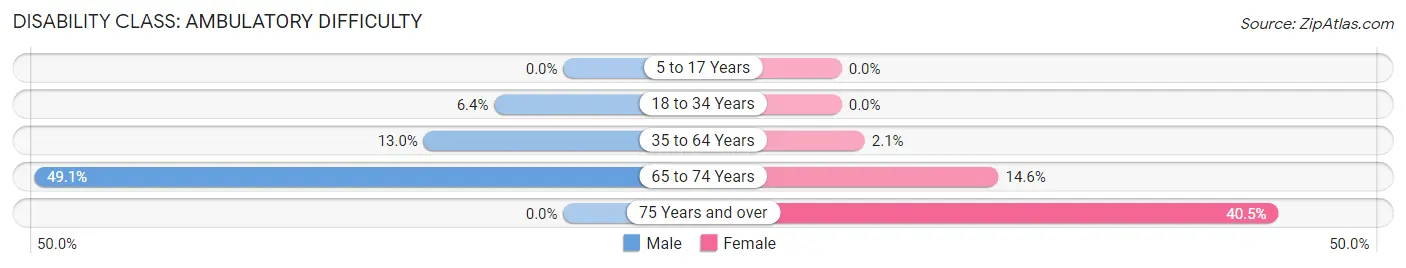
| Age Bracket | Male | Female |
| 5 to 17 Years | 0 (0.0%) | 0 (0.0%) |
| 18 to 34 Years | 42 (6.4%) | 0 (0.0%) |
| 35 to 64 Years | 116 (13.0%) | 15 (2.1%) |
| 65 to 74 Years | 85 (49.1%) | 16 (14.5%) |
| 75 Years and over | 0 (0.0%) | 62 (40.5%) |
Disability Class: Self-Care Difficulty
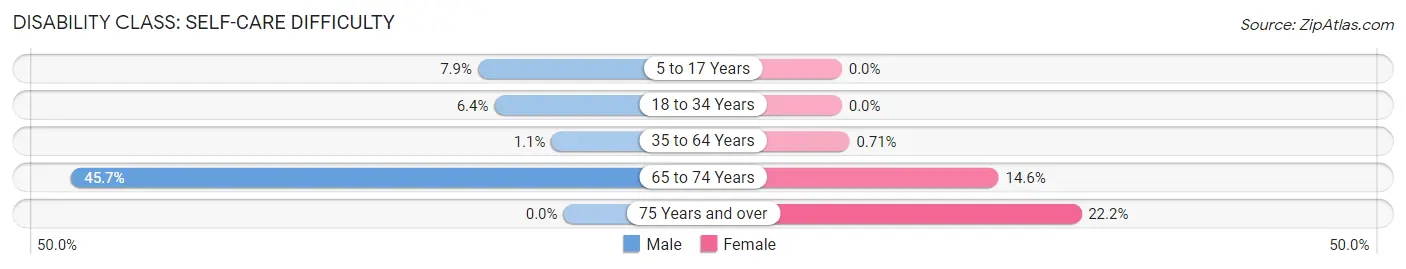
| Age Bracket | Male | Female |
| 5 to 17 Years | 39 (7.9%) | 0 (0.0%) |
| 18 to 34 Years | 42 (6.4%) | 0 (0.0%) |
| 35 to 64 Years | 10 (1.1%) | 5 (0.7%) |
| 65 to 74 Years | 79 (45.7%) | 16 (14.5%) |
| 75 Years and over | 0 (0.0%) | 34 (22.2%) |
Technology Access in Mayfair
Computing Device Access in Mayfair
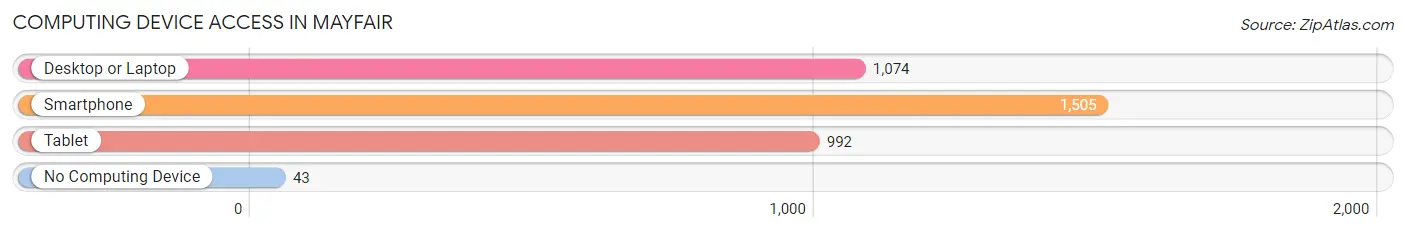
| Device Type | # Households | % Households |
| Desktop or Laptop | 1,074 | 65.5% |
| Smartphone | 1,505 | 91.8% |
| Tablet | 992 | 60.5% |
| No Computing Device | 43 | 2.6% |
| Total | 1,640 | 100.0% |
Internet Access in Mayfair
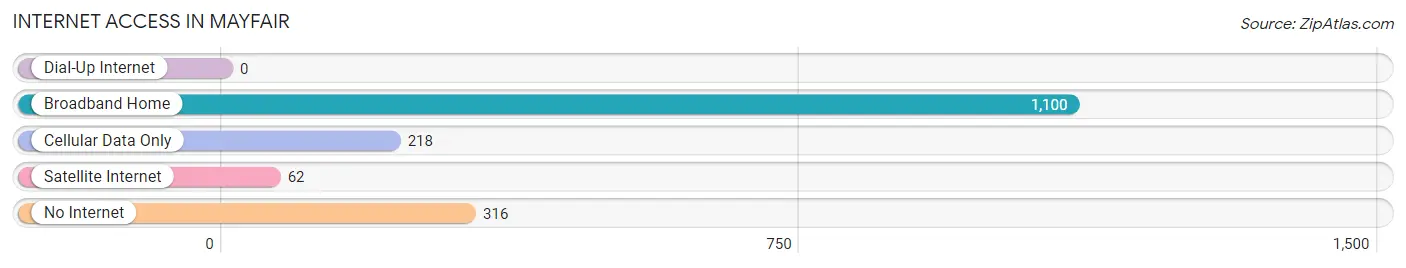
| Internet Type | # Households | % Households |
| Dial-Up Internet | 0 | 0.0% |
| Broadband Home | 1,100 | 67.1% |
| Cellular Data Only | 218 | 13.3% |
| Satellite Internet | 62 | 3.8% |
| No Internet | 316 | 19.3% |
| Total | 1,640 | 100.0% |
Mayfair Summary
Mayfair is a small, unincorporated community located in Los Angeles County, California. It is situated in the southeastern portion of the county, just south of the city of Bellflower and west of the city of Lakewood. The community is bordered by the cities of Bellflower, Lakewood, and Cerritos. Mayfair is part of the Gateway Cities region of Los Angeles County.
History
Mayfair was founded in the early 1920s by a group of real estate developers. The developers named the community after the Mayfair Hotel in London, England. The community was originally planned as a residential subdivision, but it was never fully developed.
In the 1950s, Mayfair began to experience a population boom as many people moved to the area from other parts of Los Angeles County. This population growth was largely due to the construction of the nearby Lakewood Center Mall, which opened in 1954. The mall provided employment opportunities for many of the new residents of Mayfair.
Geography
Mayfair is located in the southeastern portion of Los Angeles County, just south of the city of Bellflower and west of the city of Lakewood. The community is bordered by the cities of Bellflower, Lakewood, and Cerritos. Mayfair is part of the Gateway Cities region of Los Angeles County.
The community is situated on a flat plain, with an elevation of approximately 50 feet above sea level. The climate in Mayfair is mild and temperate, with average temperatures ranging from the mid-50s in the winter to the mid-70s in the summer.
Economy
Mayfair is primarily a residential community, with no major industries or businesses located within its boundaries. The primary sources of employment for Mayfair residents are the nearby Lakewood Center Mall and other businesses located in the surrounding cities.
The median household income in Mayfair is approximately $50,000, which is slightly lower than the median household income for Los Angeles County as a whole. The unemployment rate in Mayfair is also slightly higher than the county average.
Demographics
As of the 2010 census, the population of Mayfair was 8,845. The racial makeup of the community was 57.3% White, 16.2% Hispanic or Latino, 15.3% Asian, and 11.2% African American.
The median age in Mayfair is 37.5 years, which is slightly lower than the median age for Los Angeles County as a whole. The median household income in Mayfair is approximately $50,000, which is slightly lower than the median household income for Los Angeles County as a whole.
Mayfair is a diverse community, with a variety of cultures and backgrounds represented. The community is home to a large number of immigrants from Mexico, El Salvador, and other Latin American countries. The community also has a significant Asian population, with many residents coming from China, Vietnam, and other Asian countries.
Common Questions
What is Per Capita Income in Mayfair?
Per Capita income in Mayfair is $21,560.
What is the Median Family Income in Mayfair?
Median Family Income in Mayfair is $66,447.
What is the Median Household income in Mayfair?
Median Household Income in Mayfair is $57,326.
What is Income or Wage Gap in Mayfair?
Income or Wage Gap in Mayfair is 10.9%.
Women in Mayfair earn 89.1 cents for every dollar earned by a man.
What is Inequality or Gini Index in Mayfair?
Inequality or Gini Index in Mayfair is 0.39.
What is the Total Population of Mayfair?
Total Population of Mayfair is 4,937.
What is the Total Male Population of Mayfair?
Total Male Population of Mayfair is 2,486.
What is the Total Female Population of Mayfair?
Total Female Population of Mayfair is 2,451.
What is the Ratio of Males per 100 Females in Mayfair?
There are 101.43 Males per 100 Females in Mayfair.
What is the Ratio of Females per 100 Males in Mayfair?
There are 98.59 Females per 100 Males in Mayfair.
What is the Median Population Age in Mayfair?
Median Population Age in Mayfair is 31.5 Years.
What is the Average Family Size in Mayfair
Average Family Size in Mayfair is 3.9 People.
What is the Average Household Size in Mayfair
Average Household Size in Mayfair is 3.0 People.
How Large is the Labor Force in Mayfair?
There are 2,244 People in the Labor Forcein in Mayfair.
What is the Percentage of People in the Labor Force in Mayfair?
62.9% of People are in the Labor Force in Mayfair.
What is the Unemployment Rate in Mayfair?
Unemployment Rate in Mayfair is 8.7%.