Calipatria, CA Map & Demographics
Calipatria Map
Calipatria Overview
$9,080
PER CAPITA INCOME
$51,314
AVG FAMILY INCOME
$43,095
AVG HOUSEHOLD INCOME
0.1%
WAGE / INCOME GAP [ % ]
99.9¢/ $1
WAGE / INCOME GAP [ $ ]
$13,552
FAMILY INCOME DEFICIT
0.40
INEQUALITY / GINI INDEX
6,579
TOTAL POPULATION
4,767
MALE POPULATION
1,812
FEMALE POPULATION
263.08
MALES / 100 FEMALES
38.01
FEMALES / 100 MALES
34.1
MEDIAN AGE
3.8
AVG FAMILY SIZE
3.1
AVG HOUSEHOLD SIZE
1,285
LABOR FORCE [ PEOPLE ]
22.9%
PERCENT IN LABOR FORCE
14.5%
UNEMPLOYMENT RATE
Calipatria Zip Codes
Calipatria Area Codes
Income in Calipatria
Income Overview in Calipatria
Per Capita Income in Calipatria is $9,080, while median incomes of families and households are $51,314 and $43,095 respectively.
| Characteristic | Number | Measure |
| Per Capita Income | 6,579 | $9,080 |
| Median Family Income | 781 | $51,314 |
| Mean Family Income | 781 | $55,170 |
| Median Household Income | 1,078 | $43,095 |
| Mean Household Income | 1,078 | $45,751 |
| Income Deficit | 781 | $13,552 |
| Wage / Income Gap (%) | 6,579 | 0.15% |
| Wage / Income Gap ($) | 6,579 | 99.85¢ per $1 |
| Gini / Inequality Index | 6,579 | 0.40 |
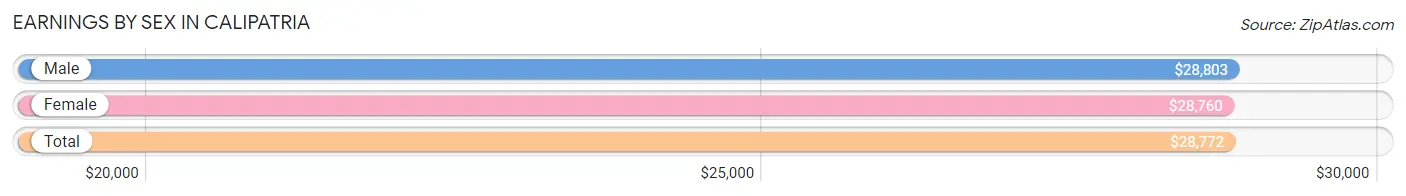
Earnings by Sex in Calipatria
Average Earnings in Calipatria are $28,772, $28,803 for men and $28,760 for women, a difference of 0.2%.
| Sex | Number | Average Earnings |
| Male | 761 (54.9%) | $28,803 |
| Female | 626 (45.1%) | $28,760 |
| Total | 1,387 (100.0%) | $28,772 |
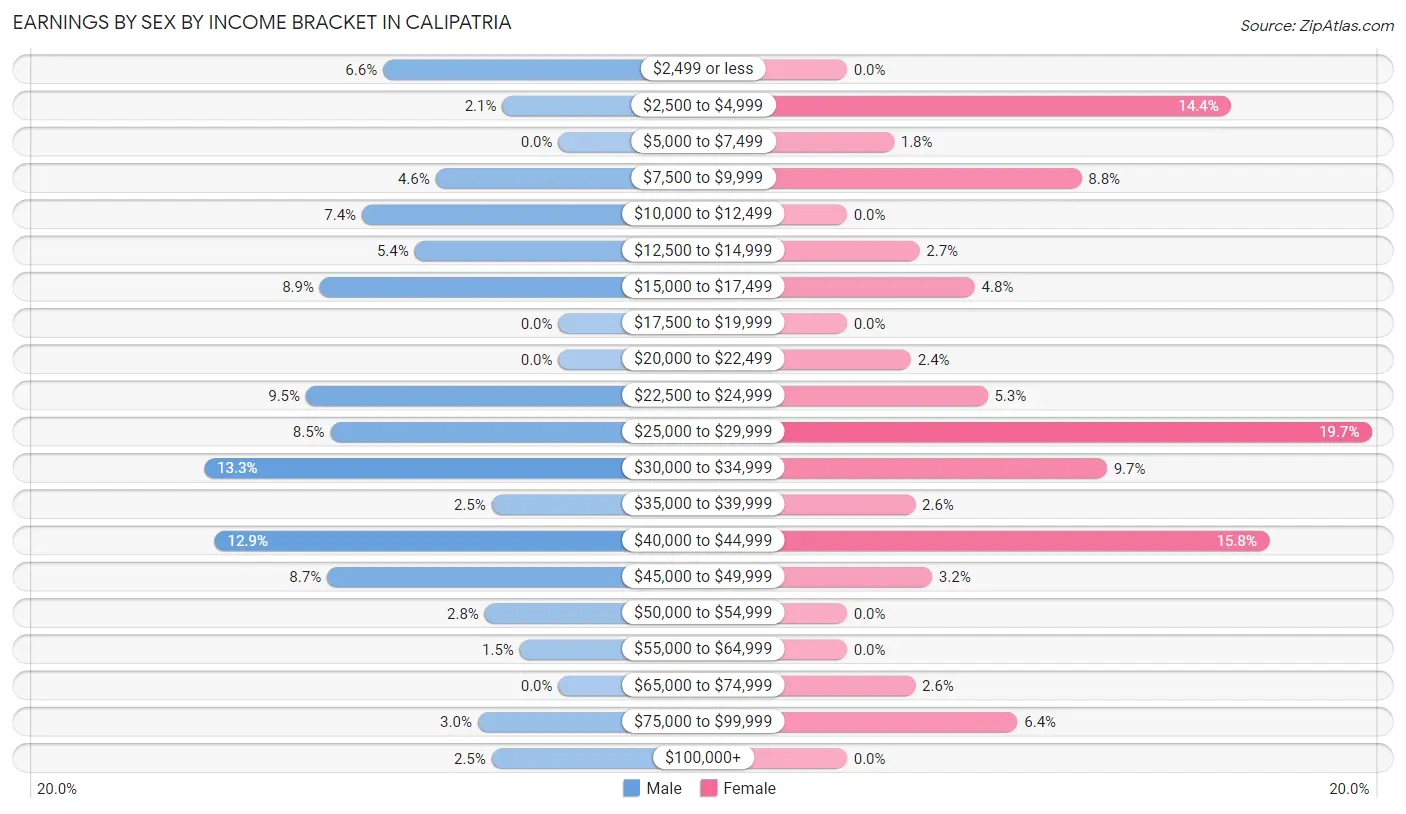
Earnings by Sex by Income Bracket in Calipatria
The most common earnings brackets in Calipatria are $30,000 to $34,999 for men (101 | 13.3%) and $25,000 to $29,999 for women (123 | 19.7%).
| Income | Male | Female |
| $2,499 or less | 50 (6.6%) | 0 (0.0%) |
| $2,500 to $4,999 | 16 (2.1%) | 90 (14.4%) |
| $5,000 to $7,499 | 0 (0.0%) | 11 (1.8%) |
| $7,500 to $9,999 | 35 (4.6%) | 55 (8.8%) |
| $10,000 to $12,499 | 56 (7.4%) | 0 (0.0%) |
| $12,500 to $14,999 | 41 (5.4%) | 17 (2.7%) |
| $15,000 to $17,499 | 68 (8.9%) | 30 (4.8%) |
| $17,500 to $19,999 | 0 (0.0%) | 0 (0.0%) |
| $20,000 to $22,499 | 0 (0.0%) | 15 (2.4%) |
| $22,500 to $24,999 | 72 (9.5%) | 33 (5.3%) |
| $25,000 to $29,999 | 65 (8.5%) | 123 (19.7%) |
| $30,000 to $34,999 | 101 (13.3%) | 61 (9.7%) |
| $35,000 to $39,999 | 19 (2.5%) | 16 (2.6%) |
| $40,000 to $44,999 | 98 (12.9%) | 99 (15.8%) |
| $45,000 to $49,999 | 66 (8.7%) | 20 (3.2%) |
| $50,000 to $54,999 | 21 (2.8%) | 0 (0.0%) |
| $55,000 to $64,999 | 11 (1.5%) | 0 (0.0%) |
| $65,000 to $74,999 | 0 (0.0%) | 16 (2.6%) |
| $75,000 to $99,999 | 23 (3.0%) | 40 (6.4%) |
| $100,000+ | 19 (2.5%) | 0 (0.0%) |
| Total | 761 (100.0%) | 626 (100.0%) |
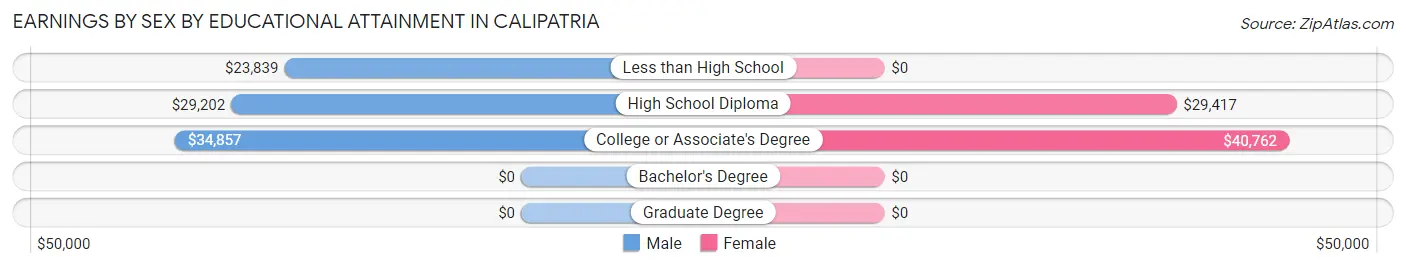
Earnings by Sex by Educational Attainment in Calipatria
Average earnings in Calipatria are $29,574 for men and $29,146 for women, a difference of 1.5%. Men with an educational attainment of college or associate's degree enjoy the highest average annual earnings of $34,857, while those with less than high school education earn the least with $23,839. Women with an educational attainment of college or associate's degree earn the most with the average annual earnings of $40,762, while those with high school diploma education have the smallest earnings of $29,417.
| Educational Attainment | Male Income | Female Income |
| Less than High School | $23,839 | $0 |
| High School Diploma | $29,202 | $29,417 |
| College or Associate's Degree | $34,857 | $40,762 |
| Bachelor's Degree | - | - |
| Graduate Degree | - | - |
| Total | $29,574 | $29,146 |
Family Income in Calipatria
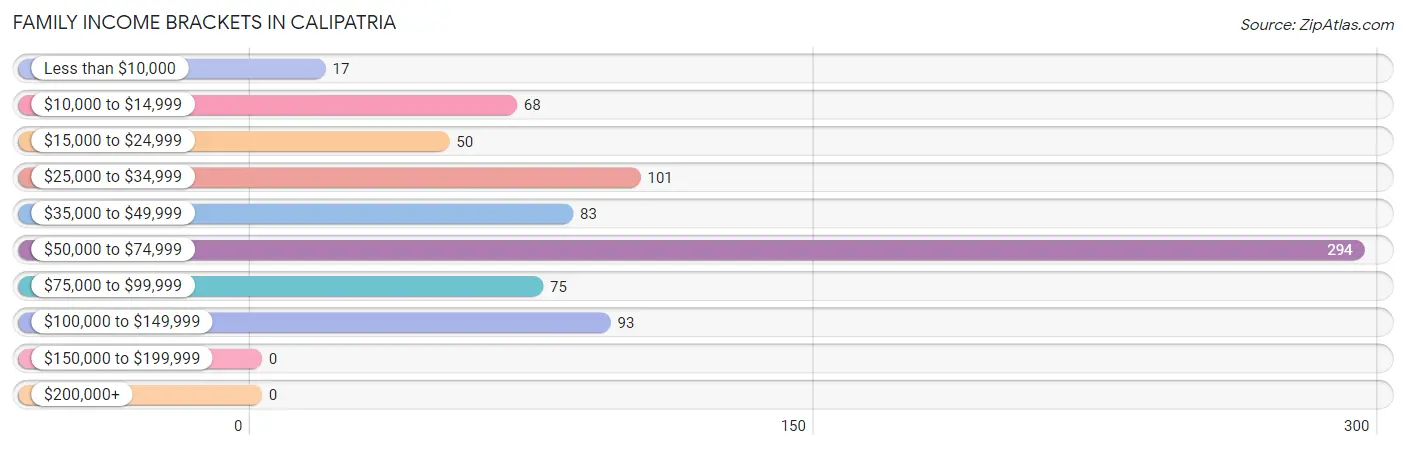
Family Income Brackets in Calipatria
According to the Calipatria family income data, there are 294 families falling into the $50,000 to $74,999 income range, which is the most common income bracket and makes up 37.6% of all families.
| Income Bracket | # Families | % Families |
| Less than $10,000 | 17 | 2.2% |
| $10,000 to $14,999 | 68 | 8.7% |
| $15,000 to $24,999 | 50 | 6.4% |
| $25,000 to $34,999 | 101 | 12.9% |
| $35,000 to $49,999 | 83 | 10.6% |
| $50,000 to $74,999 | 294 | 37.6% |
| $75,000 to $99,999 | 75 | 9.6% |
| $100,000 to $149,999 | 93 | 11.9% |
| $150,000 to $199,999 | 0 | 0.0% |
| $200,000+ | 0 | 0.0% |
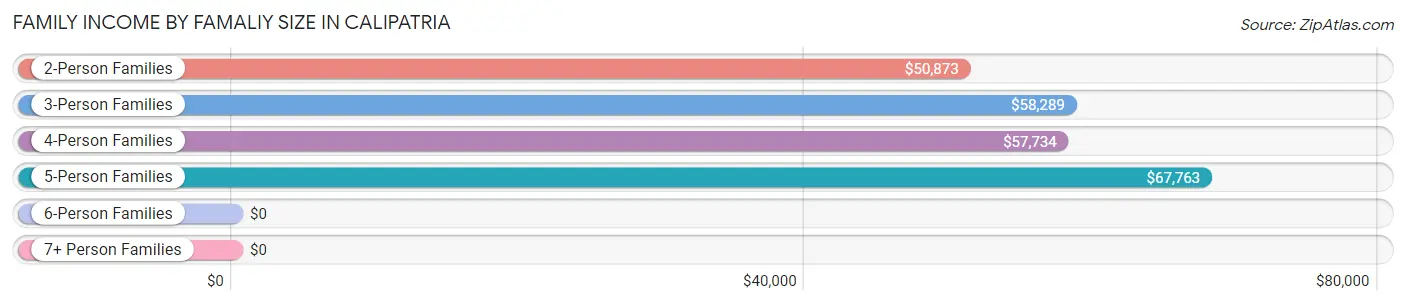
Family Income by Famaliy Size in Calipatria
5-person families (58 | 7.4%) account for the highest median family income in Calipatria with $67,763 per family, while 2-person families (363 | 46.5%) have the highest median income of $25,436 per family member.
| Income Bracket | # Families | Median Income |
| 2-Person Families | 363 (46.5%) | $50,873 |
| 3-Person Families | 112 (14.3%) | $58,289 |
| 4-Person Families | 203 (26.0%) | $57,734 |
| 5-Person Families | 58 (7.4%) | $67,763 |
| 6-Person Families | 14 (1.8%) | $0 |
| 7+ Person Families | 31 (4.0%) | $0 |
| Total | 781 (100.0%) | $51,314 |
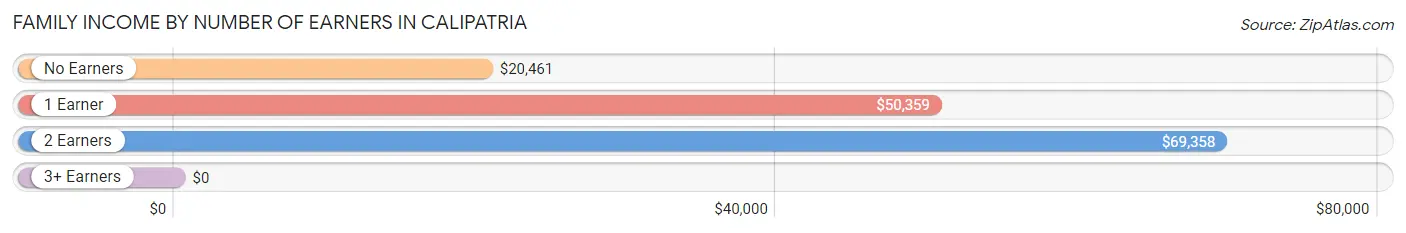
Family Income by Number of Earners in Calipatria
| Number of Earners | # Families | Median Income |
| No Earners | 79 (10.1%) | $20,461 |
| 1 Earner | 379 (48.5%) | $50,359 |
| 2 Earners | 295 (37.8%) | $69,358 |
| 3+ Earners | 28 (3.6%) | $0 |
| Total | 781 (100.0%) | $51,314 |
Household Income in Calipatria
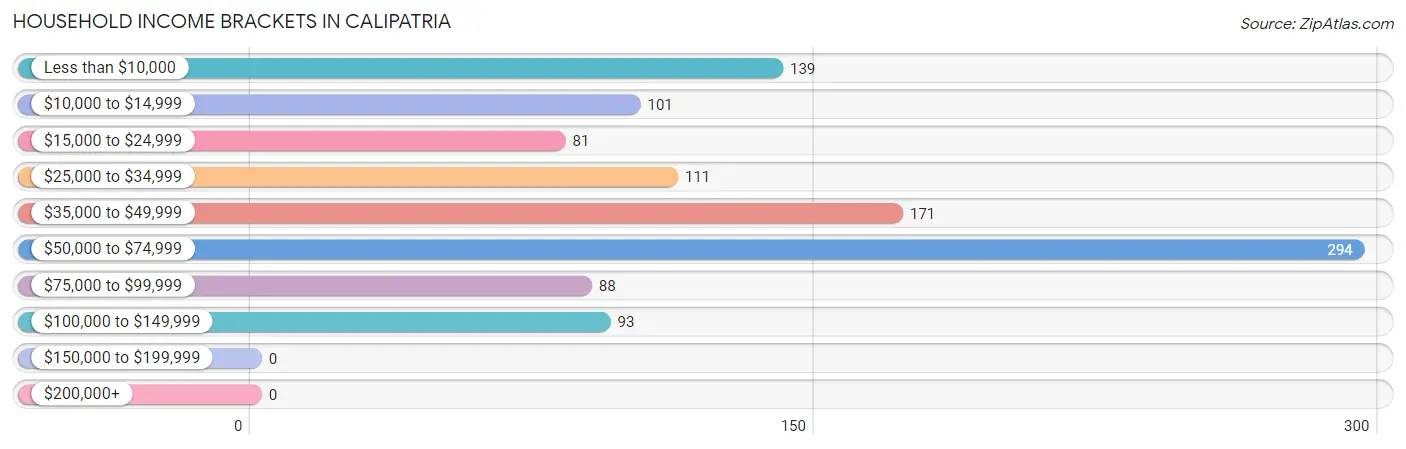
Household Income Brackets in Calipatria
With 294 households falling in the category, the $50,000 to $74,999 income range is the most frequent in Calipatria, accounting for 27.3% of all households.
| Income Bracket | # Households | % Households |
| Less than $10,000 | 139 | 12.9% |
| $10,000 to $14,999 | 101 | 9.4% |
| $15,000 to $24,999 | 81 | 7.5% |
| $25,000 to $34,999 | 111 | 10.3% |
| $35,000 to $49,999 | 171 | 15.9% |
| $50,000 to $74,999 | 294 | 27.3% |
| $75,000 to $99,999 | 88 | 8.2% |
| $100,000 to $149,999 | 93 | 8.6% |
| $150,000 to $199,999 | 0 | 0.0% |
| $200,000+ | 0 | 0.0% |
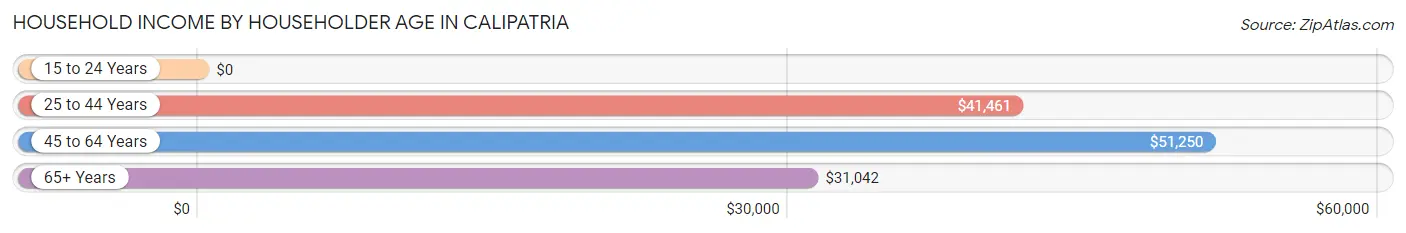
Household Income by Householder Age in Calipatria
The median household income in Calipatria is $43,095, with the highest median household income of $51,250 found in the 45 to 64 years age bracket for the primary householder. A total of 356 households (33.0%) fall into this category. Meanwhile, the 15 to 24 years age bracket for the primary householder has the lowest median household income of $0, with 65 households (6.0%) in this group.
| Income Bracket | # Households | Median Income |
| 15 to 24 Years | 65 (6.0%) | $0 |
| 25 to 44 Years | 372 (34.5%) | $41,461 |
| 45 to 64 Years | 356 (33.0%) | $51,250 |
| 65+ Years | 285 (26.4%) | $31,042 |
| Total | 1,078 (100.0%) | $43,095 |
Poverty in Calipatria
Income Below Poverty by Sex and Age in Calipatria
With 24.0% poverty level for males and 32.6% for females among the residents of Calipatria, under 5 year old males and 15 year old females are the most vulnerable to poverty, with 70 males (68.6%) and 47 females (100.0%) in their respective age groups living below the poverty level.
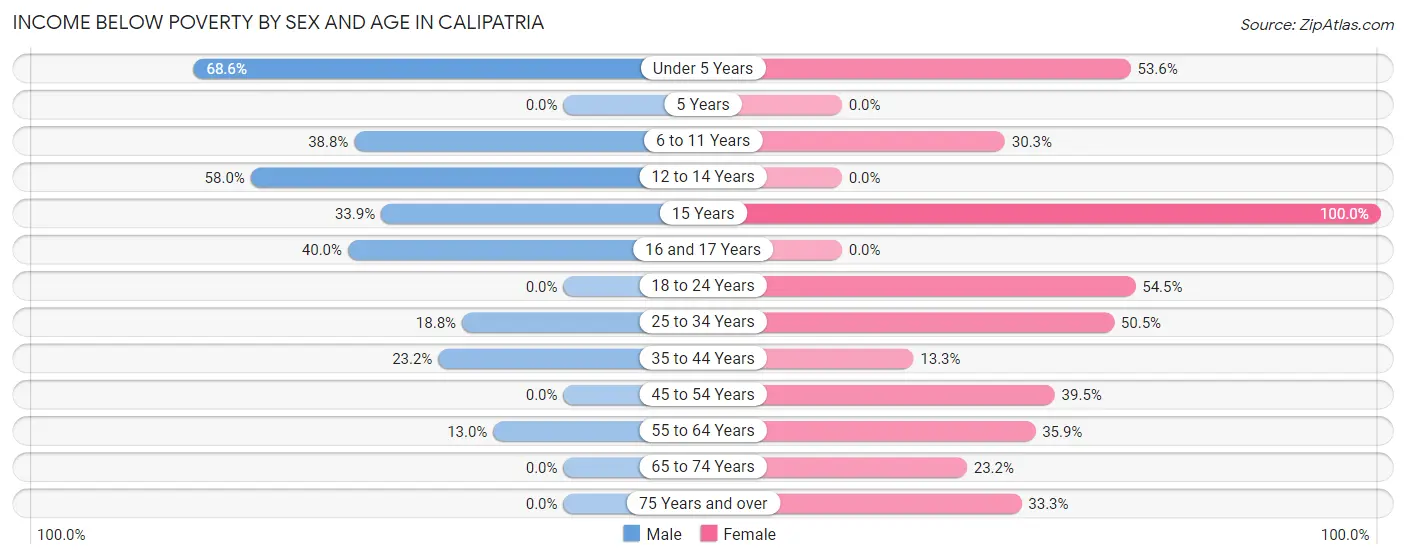
| Age Bracket | Male | Female |
| Under 5 Years | 70 (68.6%) | 67 (53.6%) |
| 5 Years | 0 (0.0%) | 0 (0.0%) |
| 6 to 11 Years | 66 (38.8%) | 56 (30.3%) |
| 12 to 14 Years | 83 (58.0%) | 0 (0.0%) |
| 15 Years | 22 (33.9%) | 47 (100.0%) |
| 16 and 17 Years | 16 (40.0%) | 0 (0.0%) |
| 18 to 24 Years | 0 (0.0%) | 73 (54.5%) |
| 25 to 34 Years | 45 (18.8%) | 50 (50.5%) |
| 35 to 44 Years | 36 (23.2%) | 36 (13.3%) |
| 45 to 54 Years | 0 (0.0%) | 96 (39.5%) |
| 55 to 64 Years | 41 (13.0%) | 70 (35.9%) |
| 65 to 74 Years | 0 (0.0%) | 58 (23.2%) |
| 75 Years and over | 0 (0.0%) | 36 (33.3%) |
| Total | 379 (24.0%) | 589 (32.6%) |
Income Above Poverty by Sex and Age in Calipatria
According to the poverty statistics in Calipatria, males aged 5 years and females aged 12 to 14 years are the age groups that are most secure financially, with 100.0% of males and 100.0% of females in these age groups living above the poverty line.
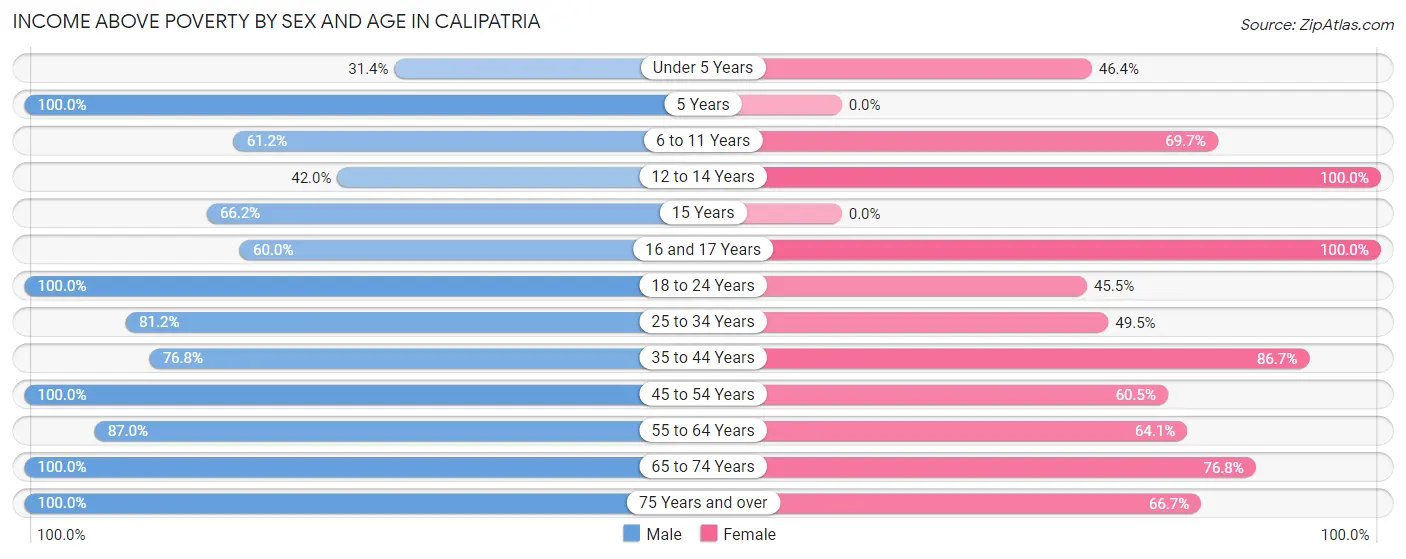
| Age Bracket | Male | Female |
| Under 5 Years | 32 (31.4%) | 58 (46.4%) |
| 5 Years | 14 (100.0%) | 0 (0.0%) |
| 6 to 11 Years | 104 (61.2%) | 129 (69.7%) |
| 12 to 14 Years | 60 (42.0%) | 118 (100.0%) |
| 15 Years | 43 (66.1%) | 0 (0.0%) |
| 16 and 17 Years | 24 (60.0%) | 31 (100.0%) |
| 18 to 24 Years | 162 (100.0%) | 61 (45.5%) |
| 25 to 34 Years | 194 (81.2%) | 49 (49.5%) |
| 35 to 44 Years | 119 (76.8%) | 235 (86.7%) |
| 45 to 54 Years | 73 (100.0%) | 147 (60.5%) |
| 55 to 64 Years | 274 (87.0%) | 125 (64.1%) |
| 65 to 74 Years | 82 (100.0%) | 192 (76.8%) |
| 75 Years and over | 19 (100.0%) | 72 (66.7%) |
| Total | 1,200 (76.0%) | 1,217 (67.4%) |
Income Below Poverty Among Married-Couple Families in Calipatria
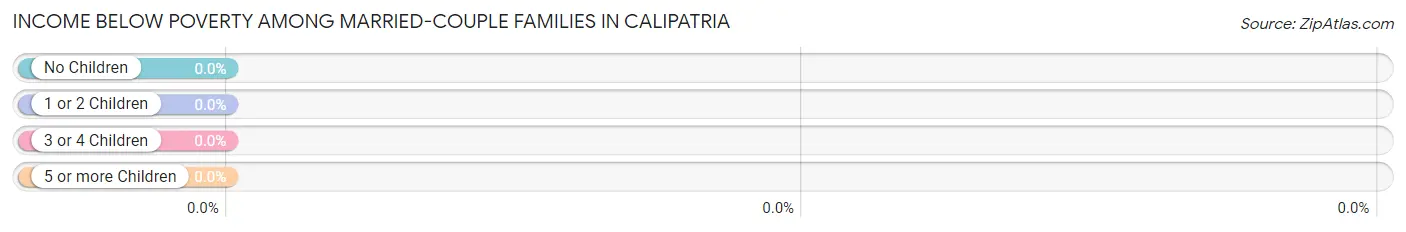
| Children | Above Poverty | Below Poverty |
| No Children | 293 (100.0%) | 0 (0.0%) |
| 1 or 2 Children | 101 (100.0%) | 0 (0.0%) |
| 3 or 4 Children | 46 (100.0%) | 0 (0.0%) |
| 5 or more Children | 0 (0.0%) | 0 (0.0%) |
| Total | 440 (100.0%) | 0 (0.0%) |
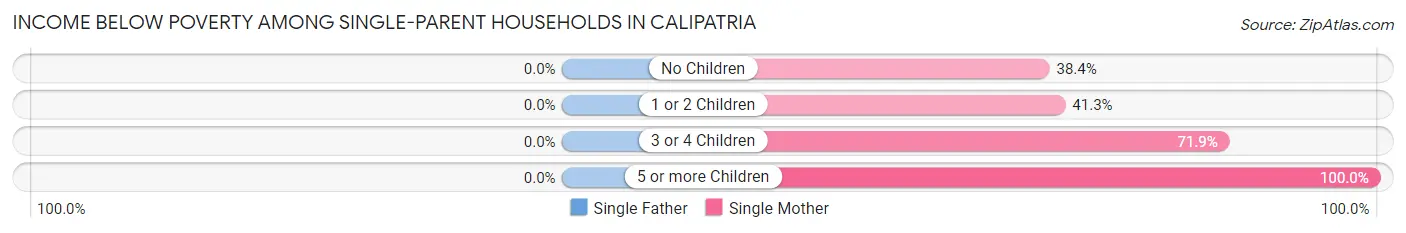
Income Below Poverty Among Single-Parent Households in Calipatria
| Children | Single Father | Single Mother |
| No Children | 0 (0.0%) | 51 (38.4%) |
| 1 or 2 Children | 0 (0.0%) | 19 (41.3%) |
| 3 or 4 Children | 0 (0.0%) | 46 (71.9%) |
| 5 or more Children | 0 (0.0%) | 19 (100.0%) |
| Total | 0 (0.0%) | 135 (51.5%) |
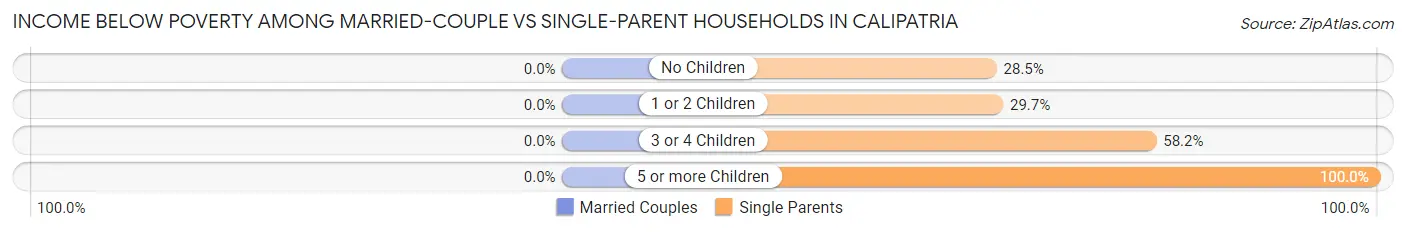
Income Below Poverty Among Married-Couple vs Single-Parent Households in Calipatria
| Children | Married-Couple Families | Single-Parent Households |
| No Children | 0 (0.0%) | 51 (28.5%) |
| 1 or 2 Children | 0 (0.0%) | 19 (29.7%) |
| 3 or 4 Children | 0 (0.0%) | 46 (58.2%) |
| 5 or more Children | 0 (0.0%) | 19 (100.0%) |
| Total | 0 (0.0%) | 135 (39.6%) |
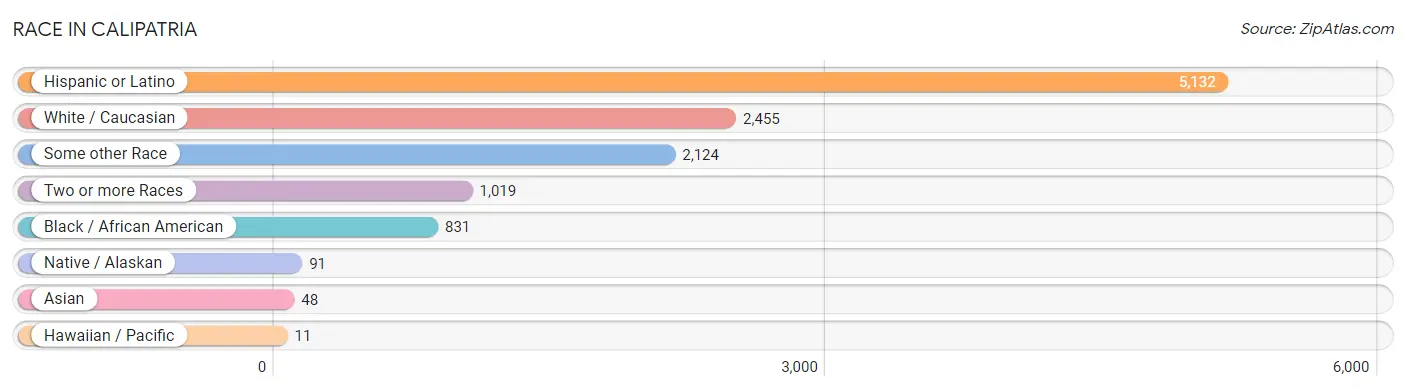
Race in Calipatria
The most populous races in Calipatria are Hispanic or Latino (5,132 | 78.0%), White / Caucasian (2,455 | 37.3%), and Some other Race (2,124 | 32.3%).
| Race | # Population | % Population |
| Asian | 48 | 0.7% |
| Black / African American | 831 | 12.6% |
| Hawaiian / Pacific | 11 | 0.2% |
| Hispanic or Latino | 5,132 | 78.0% |
| Native / Alaskan | 91 | 1.4% |
| White / Caucasian | 2,455 | 37.3% |
| Two or more Races | 1,019 | 15.5% |
| Some other Race | 2,124 | 32.3% |
| Total | 6,579 | 100.0% |
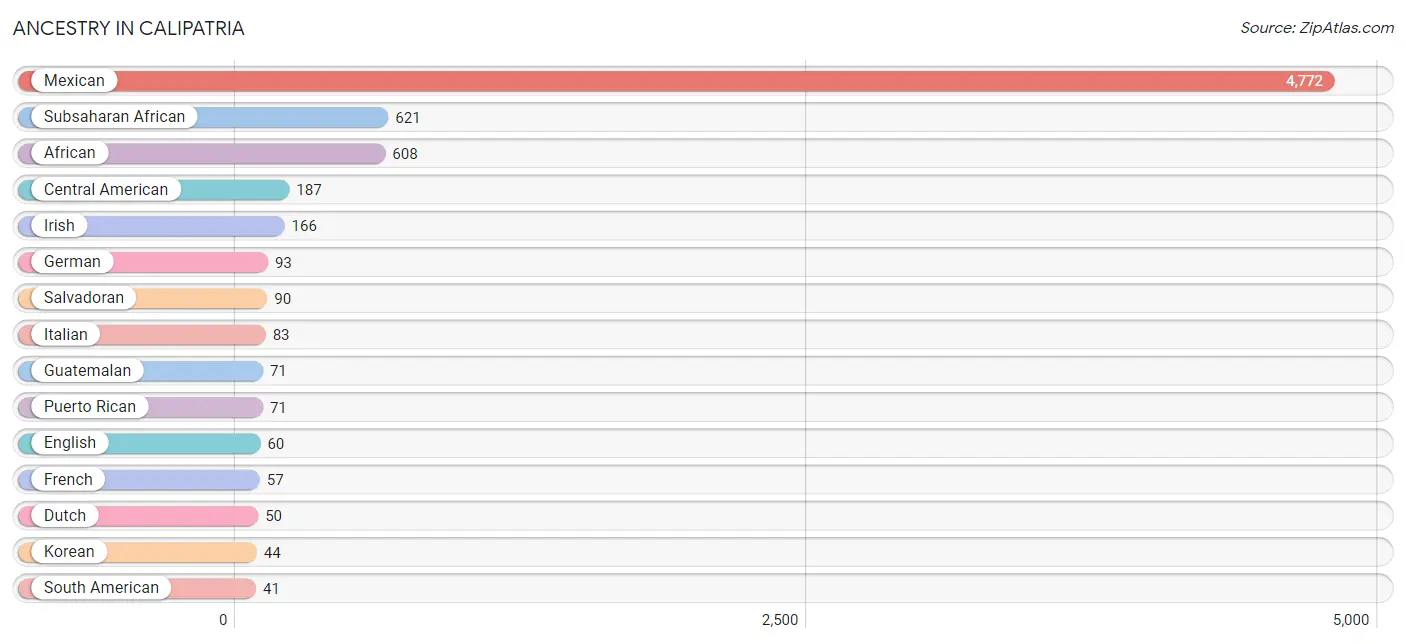
Ancestry in Calipatria
The most populous ancestries reported in Calipatria are Mexican (4,772 | 72.5%), Subsaharan African (621 | 9.4%), African (608 | 9.2%), Central American (187 | 2.8%), and Irish (166 | 2.5%), together accounting for 96.6% of all Calipatria residents.
| Ancestry | # Population | % Population |
| African | 608 | 9.2% |
| Apache | 28 | 0.4% |
| Argentinean | 6 | 0.1% |
| Belizean | 10 | 0.2% |
| Bhutanese | 20 | 0.3% |
| Central American | 187 | 2.8% |
| Cherokee | 9 | 0.1% |
| Chilean | 5 | 0.1% |
| Chippewa | 4 | 0.1% |
| Choctaw | 5 | 0.1% |
| Colombian | 24 | 0.4% |
| Cuban | 23 | 0.4% |
| Dominican | 4 | 0.1% |
| Dutch | 50 | 0.8% |
| English | 60 | 0.9% |
| Ethiopian | 9 | 0.1% |
| European | 28 | 0.4% |
| French | 57 | 0.9% |
| French Canadian | 4 | 0.1% |
| German | 93 | 1.4% |
| Guamanian / Chamorro | 11 | 0.2% |
| Guatemalan | 71 | 1.1% |
| Honduran | 21 | 0.3% |
| Hopi | 8 | 0.1% |
| Irish | 166 | 2.5% |
| Italian | 83 | 1.3% |
| Jamaican | 16 | 0.2% |
| Japanese | 3 | 0.1% |
| Korean | 44 | 0.7% |
| Mexican | 4,772 | 72.5% |
| Mexican American Indian | 7 | 0.1% |
| Navajo | 6 | 0.1% |
| Nicaraguan | 5 | 0.1% |
| Nigerian | 4 | 0.1% |
| Norwegian | 6 | 0.1% |
| Paiute | 12 | 0.2% |
| Peruvian | 6 | 0.1% |
| Pima | 5 | 0.1% |
| Polish | 12 | 0.2% |
| Puerto Rican | 71 | 1.1% |
| Russian | 7 | 0.1% |
| Salvadoran | 90 | 1.4% |
| Samoan | 14 | 0.2% |
| Scotch-Irish | 6 | 0.1% |
| Scottish | 26 | 0.4% |
| South American | 41 | 0.6% |
| Spaniard | 18 | 0.3% |
| Subsaharan African | 621 | 9.4% |
| Thai | 5 | 0.1% |
| Tongan | 4 | 0.1% | View All 50 Rows |
Immigrants in Calipatria
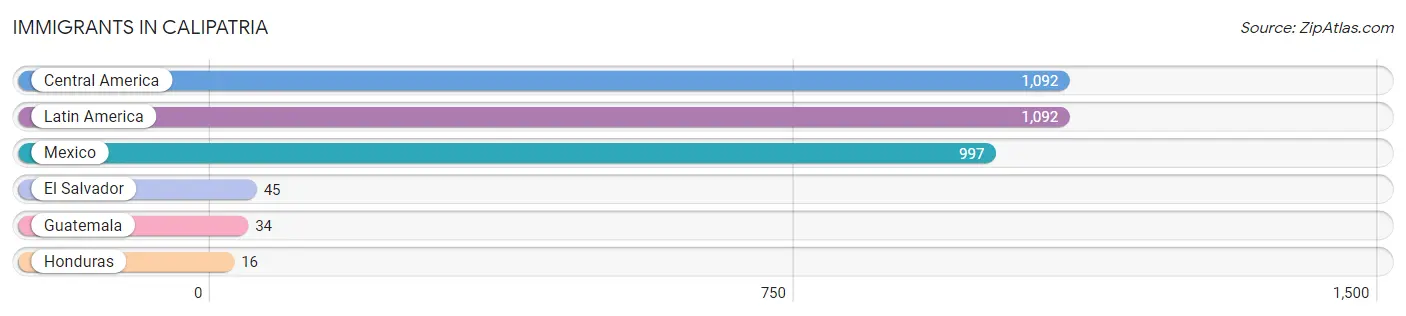
The most numerous immigrant groups reported in Calipatria came from Central America (1,092 | 16.6%), Latin America (1,092 | 16.6%), Mexico (997 | 15.1%), El Salvador (45 | 0.7%), and Guatemala (34 | 0.5%), together accounting for 49.5% of all Calipatria residents.
| Immigration Origin | # Population | % Population |
| Central America | 1,092 | 16.6% |
| El Salvador | 45 | 0.7% |
| Guatemala | 34 | 0.5% |
| Honduras | 16 | 0.2% |
| Latin America | 1,092 | 16.6% |
| Mexico | 997 | 15.1% | View All 6 Rows |
Sex and Age in Calipatria
Sex and Age in Calipatria
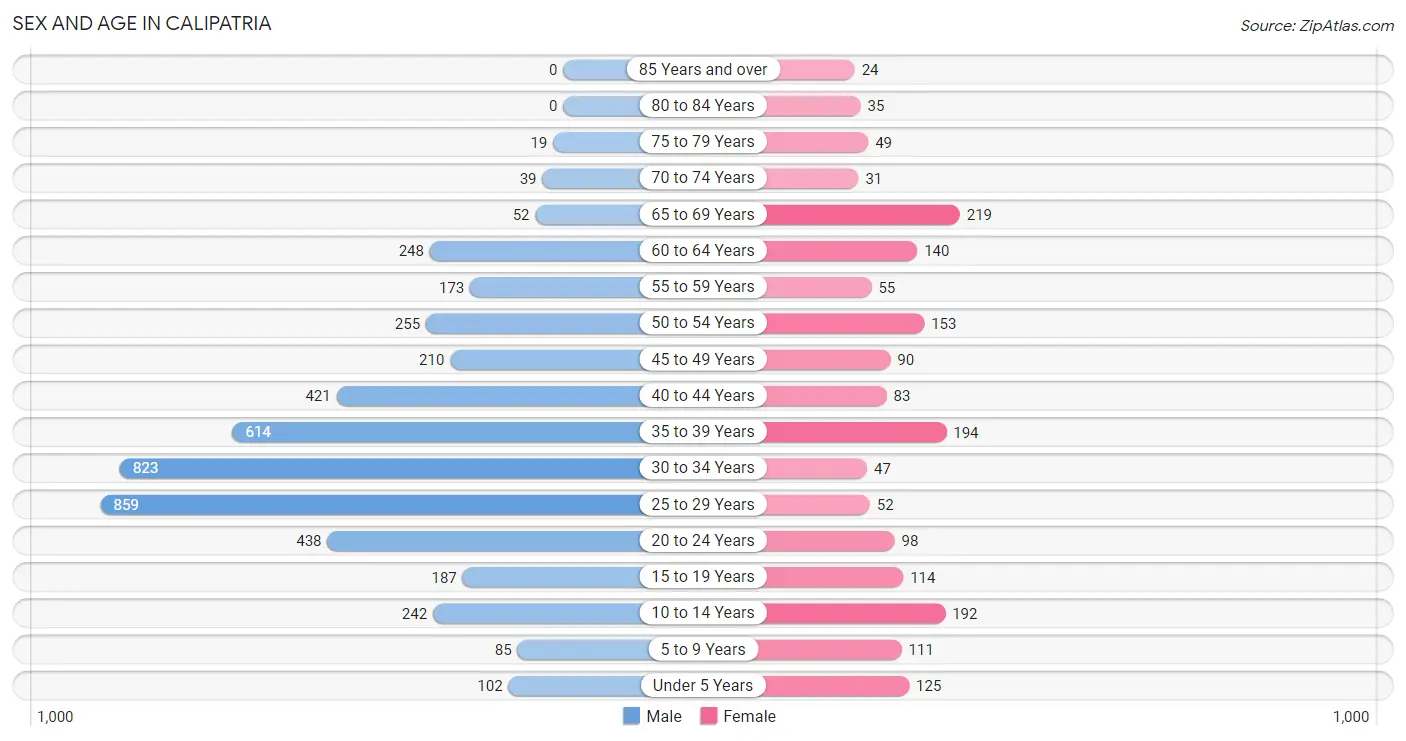
The most populous age groups in Calipatria are 25 to 29 Years (859 | 18.0%) for men and 65 to 69 Years (219 | 12.1%) for women.
| Age Bracket | Male | Female |
| Under 5 Years | 102 (2.1%) | 125 (6.9%) |
| 5 to 9 Years | 85 (1.8%) | 111 (6.1%) |
| 10 to 14 Years | 242 (5.1%) | 192 (10.6%) |
| 15 to 19 Years | 187 (3.9%) | 114 (6.3%) |
| 20 to 24 Years | 438 (9.2%) | 98 (5.4%) |
| 25 to 29 Years | 859 (18.0%) | 52 (2.9%) |
| 30 to 34 Years | 823 (17.3%) | 47 (2.6%) |
| 35 to 39 Years | 614 (12.9%) | 194 (10.7%) |
| 40 to 44 Years | 421 (8.8%) | 83 (4.6%) |
| 45 to 49 Years | 210 (4.4%) | 90 (5.0%) |
| 50 to 54 Years | 255 (5.3%) | 153 (8.4%) |
| 55 to 59 Years | 173 (3.6%) | 55 (3.0%) |
| 60 to 64 Years | 248 (5.2%) | 140 (7.7%) |
| 65 to 69 Years | 52 (1.1%) | 219 (12.1%) |
| 70 to 74 Years | 39 (0.8%) | 31 (1.7%) |
| 75 to 79 Years | 19 (0.4%) | 49 (2.7%) |
| 80 to 84 Years | 0 (0.0%) | 35 (1.9%) |
| 85 Years and over | 0 (0.0%) | 24 (1.3%) |
| Total | 4,767 (100.0%) | 1,812 (100.0%) |
Families and Households in Calipatria
Median Family Size in Calipatria
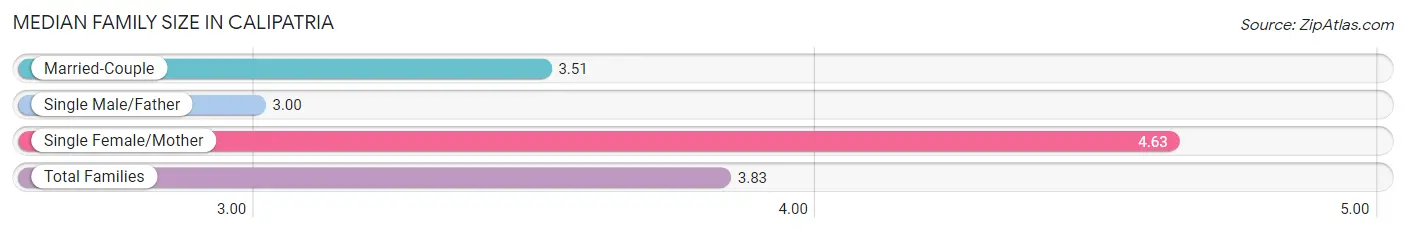
The median family size in Calipatria is 3.83 persons per family, with single female/mother families (262 | 33.6%) accounting for the largest median family size of 4.63 persons per family. On the other hand, single male/father families (79 | 10.1%) represent the smallest median family size with 3.00 persons per family.
| Family Type | # Families | Family Size |
| Married-Couple | 440 (56.3%) | 3.51 |
| Single Male/Father | 79 (10.1%) | 3.00 |
| Single Female/Mother | 262 (33.6%) | 4.63 |
| Total Families | 781 (100.0%) | 3.83 |
Median Household Size in Calipatria
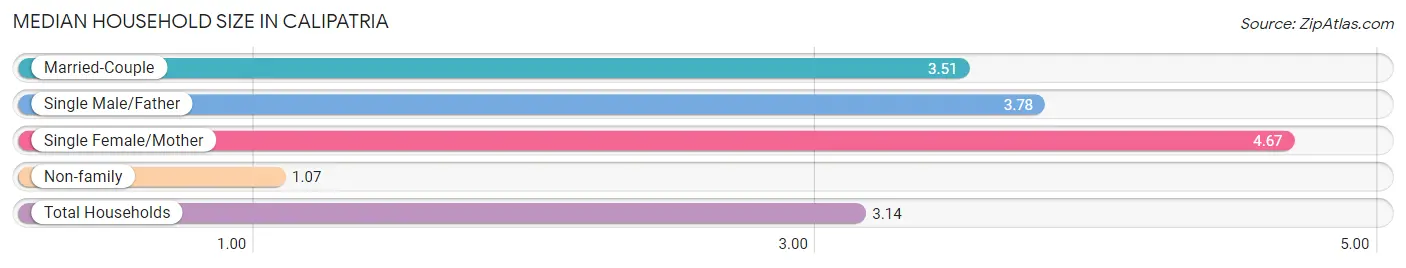
The median household size in Calipatria is 3.14 persons per household, with single female/mother households (262 | 24.3%) accounting for the largest median household size of 4.67 persons per household. non-family households (297 | 27.6%) represent the smallest median household size with 1.07 persons per household.
| Household Type | # Households | Household Size |
| Married-Couple | 440 (40.8%) | 3.51 |
| Single Male/Father | 79 (7.3%) | 3.78 |
| Single Female/Mother | 262 (24.3%) | 4.67 |
| Non-family | 297 (27.6%) | 1.07 |
| Total Households | 1,078 (100.0%) | 3.14 |
Household Size by Marriage Status in Calipatria
Out of a total of 1,078 households in Calipatria, 781 (72.5%) are family households, while 297 (27.6%) are nonfamily households. The most numerous type of family households are 2-person households, comprising 326, and the most common type of nonfamily households are 1-person households, comprising 286.
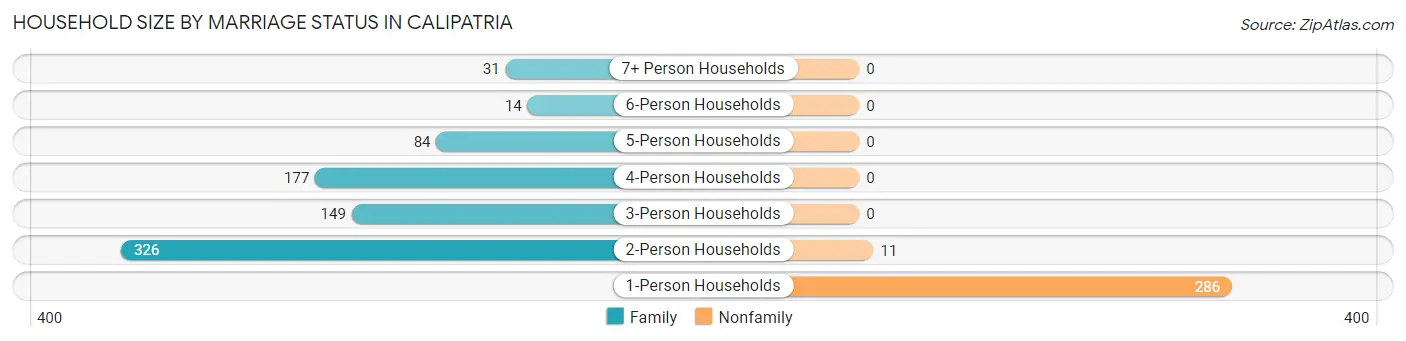
| Household Size | Family Households | Nonfamily Households |
| 1-Person Households | - | 286 (26.5%) |
| 2-Person Households | 326 (30.2%) | 11 (1.0%) |
| 3-Person Households | 149 (13.8%) | 0 (0.0%) |
| 4-Person Households | 177 (16.4%) | 0 (0.0%) |
| 5-Person Households | 84 (7.8%) | 0 (0.0%) |
| 6-Person Households | 14 (1.3%) | 0 (0.0%) |
| 7+ Person Households | 31 (2.9%) | 0 (0.0%) |
| Total | 781 (72.5%) | 297 (27.6%) |
Female Fertility in Calipatria
Fertility by Age in Calipatria
Average fertility rate in Calipatria is 48.0 births per 1,000 women. Women in the age bracket of 35 to 50 years have the highest fertility rate with 86.0 births per 1,000 women. Women in the age bracket of 35 to 50 years acount for 100.0% of all women with births.
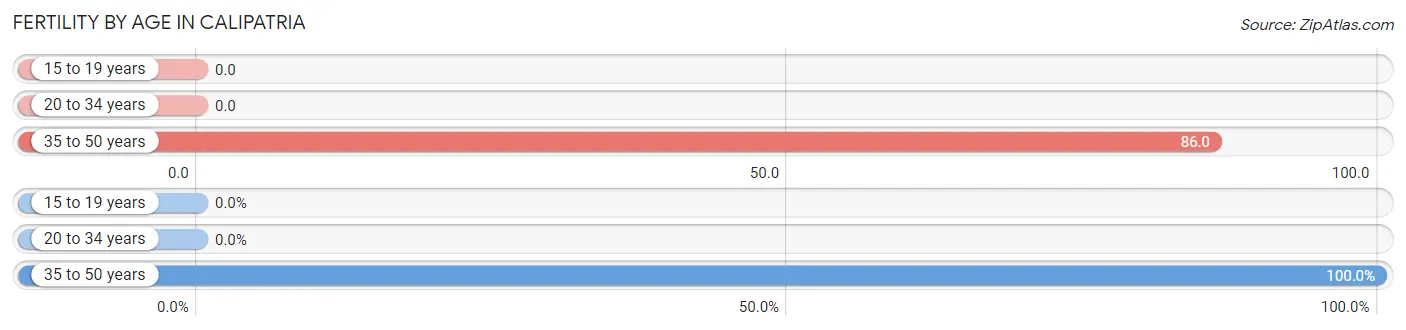
| Age Bracket | Women with Births | Births / 1,000 Women |
| 15 to 19 years | 0 (0.0%) | 0.0 |
| 20 to 34 years | 0 (0.0%) | 0.0 |
| 35 to 50 years | 34 (100.0%) | 86.0 |
| Total | 34 (100.0%) | 48.0 |
Fertility by Age by Marriage Status in Calipatria
44.1% of women with births (34) in Calipatria are married. The highest percentage of unmarried women with births falls into 35 to 50 years age bracket with 55.9% of them unmarried at the time of birth, while the lowest percentage of unmarried women with births belong to 35 to 50 years age bracket with 55.9% of them unmarried.
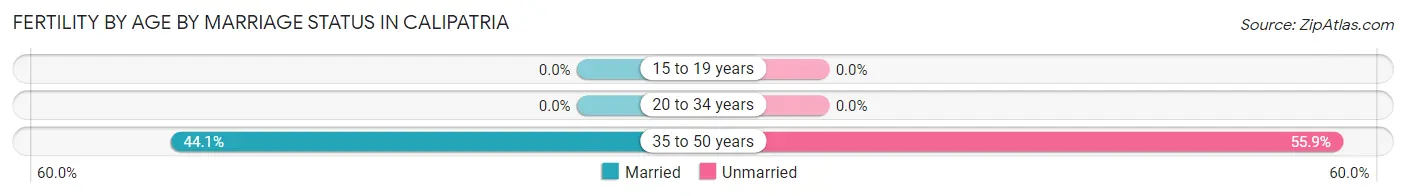
| Age Bracket | Married | Unmarried |
| 15 to 19 years | 0 (0.0%) | 0 (0.0%) |
| 20 to 34 years | 0 (0.0%) | 0 (0.0%) |
| 35 to 50 years | 15 (44.1%) | 19 (55.9%) |
| Total | 15 (44.1%) | 19 (55.9%) |
Fertility by Education in Calipatria
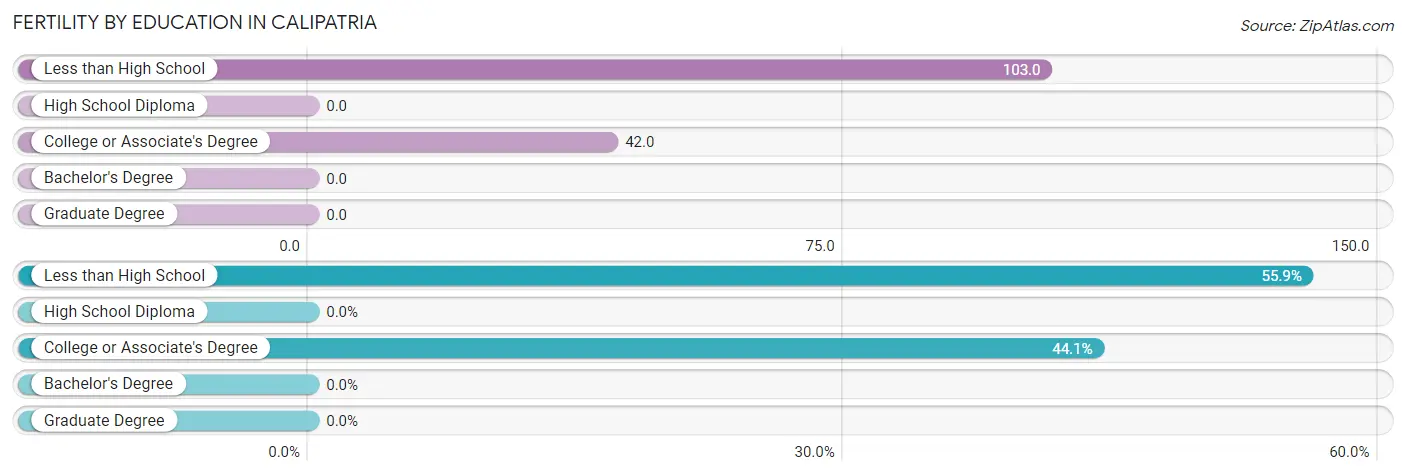
| Educational Attainment | Women with Births | Births / 1,000 Women |
| Less than High School | 19 (55.9%) | 103.0 |
| High School Diploma | 0 (0.0%) | 0.0 |
| College or Associate's Degree | 15 (44.1%) | 42.0 |
| Bachelor's Degree | 0 (0.0%) | 0.0 |
| Graduate Degree | 0 (0.0%) | 0.0 |
| Total | 34 (100.0%) | 48.0 |
Fertility by Education by Marriage Status in Calipatria
55.9% of women with births in Calipatria are unmarried. Women with the educational attainment of college or associate's degree are most likely to be married with 100.0% of them married at childbirth, while women with the educational attainment of less than high school are least likely to be married with 100.0% of them unmarried at childbirth.
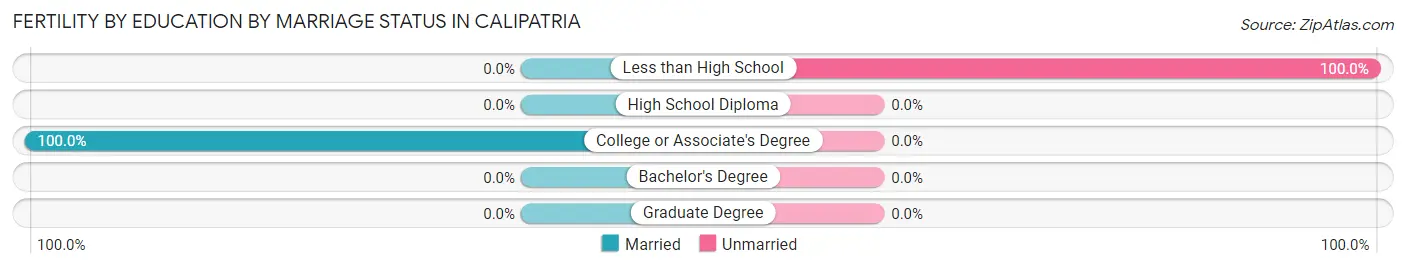
| Educational Attainment | Married | Unmarried |
| Less than High School | 0 (0.0%) | 19 (100.0%) |
| High School Diploma | 0 (0.0%) | 0 (0.0%) |
| College or Associate's Degree | 15 (100.0%) | 0 (0.0%) |
| Bachelor's Degree | 0 (0.0%) | 0 (0.0%) |
| Graduate Degree | 0 (0.0%) | 0 (0.0%) |
| Total | 15 (44.1%) | 19 (55.9%) |
Employment Characteristics in Calipatria
Employment by Class of Employer in Calipatria
Among the 1,099 employed individuals in Calipatria, private company employees (847 | 77.1%), local government employees (155 | 14.1%), and state government employees (49 | 4.5%) make up the most common classes of employment.
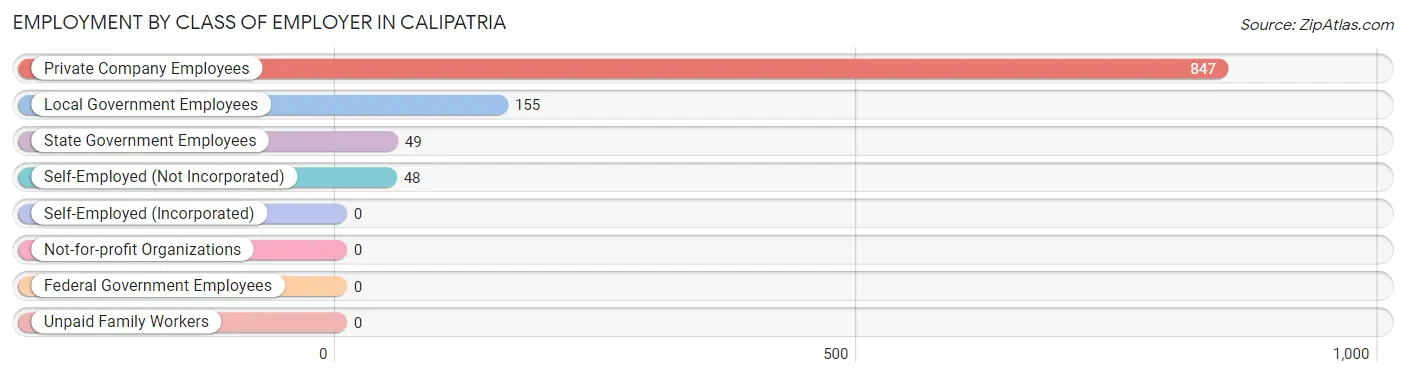
| Employer Class | # Employees | % Employees |
| Private Company Employees | 847 | 77.1% |
| Self-Employed (Incorporated) | 0 | 0.0% |
| Self-Employed (Not Incorporated) | 48 | 4.4% |
| Not-for-profit Organizations | 0 | 0.0% |
| Local Government Employees | 155 | 14.1% |
| State Government Employees | 49 | 4.5% |
| Federal Government Employees | 0 | 0.0% |
| Unpaid Family Workers | 0 | 0.0% |
| Total | 1,099 | 100.0% |
Employment Status by Age in Calipatria
According to the labor force statistics for Calipatria, out of the total population over 16 years of age (5,610), 22.9% or 1,285 individuals are in the labor force, with 14.5% or 186 of them unemployed. The age group with the highest labor force participation rate is 55 to 59 years, with 62.3% or 142 individuals in the labor force. Within the labor force, the 20 to 24 years age range has the highest percentage of unemployed individuals, with 48.5% or 48 of them being unemployed.
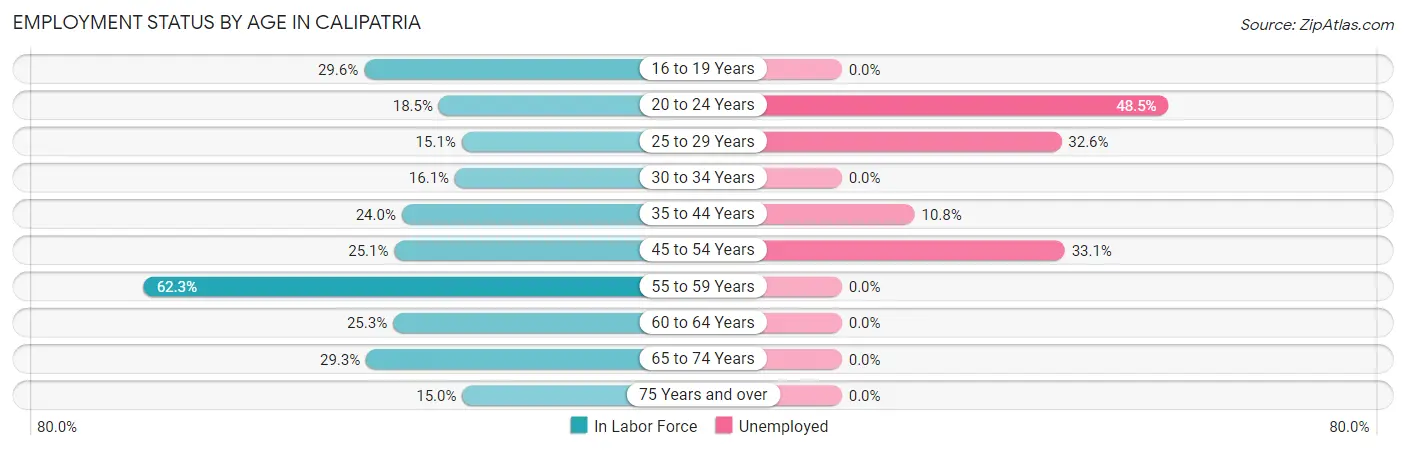
| Age Bracket | In Labor Force | Unemployed |
| 16 to 19 Years | 56 (29.6%) | 0 (0.0%) |
| 20 to 24 Years | 99 (18.5%) | 48 (48.5%) |
| 25 to 29 Years | 138 (15.1%) | 45 (32.6%) |
| 30 to 34 Years | 140 (16.1%) | 0 (0.0%) |
| 35 to 44 Years | 315 (24.0%) | 34 (10.8%) |
| 45 to 54 Years | 178 (25.1%) | 59 (33.1%) |
| 55 to 59 Years | 142 (62.3%) | 0 (0.0%) |
| 60 to 64 Years | 98 (25.3%) | 0 (0.0%) |
| 65 to 74 Years | 100 (29.3%) | 0 (0.0%) |
| 75 Years and over | 19 (15.0%) | 0 (0.0%) |
| Total | 1,285 (22.9%) | 186 (14.5%) |
Employment Status by Educational Attainment in Calipatria
According to labor force statistics for Calipatria, 22.9% of individuals (1,011) out of the total population between 25 and 64 years of age (4,417) are in the labor force, with 13.6% or 137 of them being unemployed. The group with the highest labor force participation rate are those with the educational attainment of bachelor's degree or higher, with 47.2% or 25 individuals in the labor force. Within the labor force, individuals with less than high school education have the highest percentage of unemployment, with 17.3% or 35 of them being unemployed.
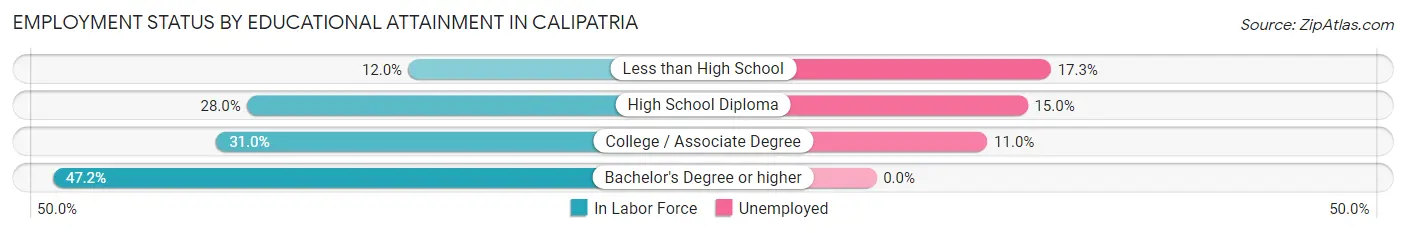
| Educational Attainment | In Labor Force | Unemployed |
| Less than High School | 202 (12.0%) | 292 (17.3%) |
| High School Diploma | 428 (28.0%) | 229 (15.0%) |
| College / Associate Degree | 356 (31.0%) | 126 (11.0%) |
| Bachelor's Degree or higher | 25 (47.2%) | 0 (0.0%) |
| Total | 1,011 (22.9%) | 601 (13.6%) |
Employment Occupations by Sex in Calipatria
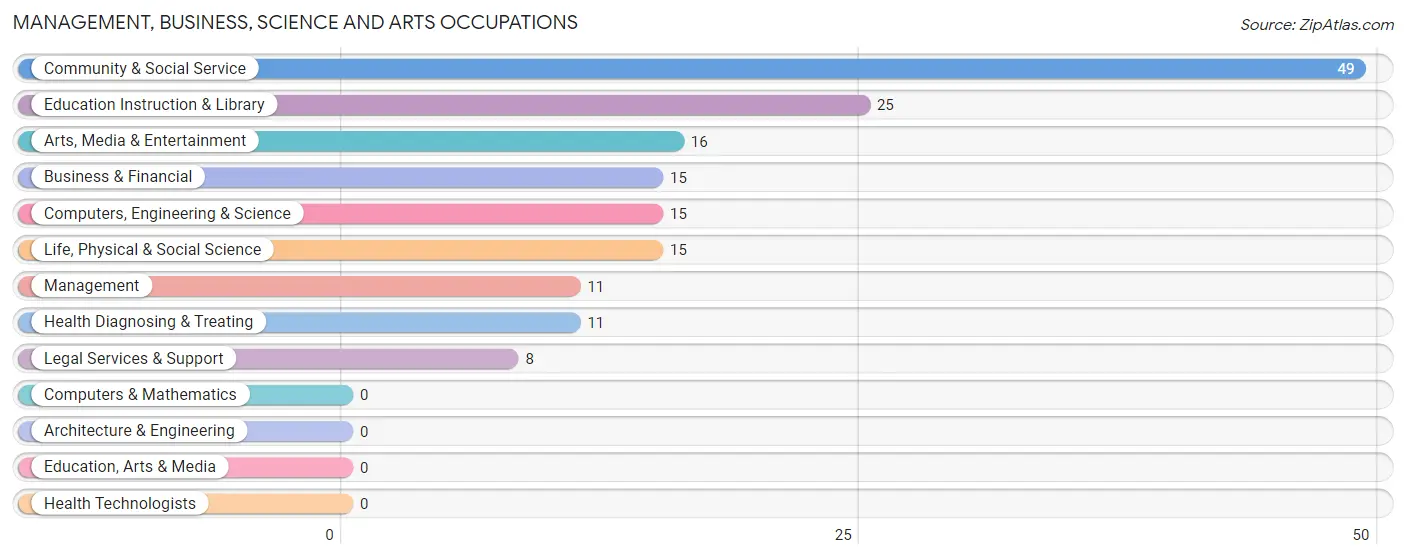
Management, Business, Science and Arts Occupations
The most common Management, Business, Science and Arts occupations in Calipatria are Community & Social Service (49 | 4.5%), Education Instruction & Library (25 | 2.3%), Arts, Media & Entertainment (16 | 1.5%), Business & Financial (15 | 1.4%), and Computers, Engineering & Science (15 | 1.4%).
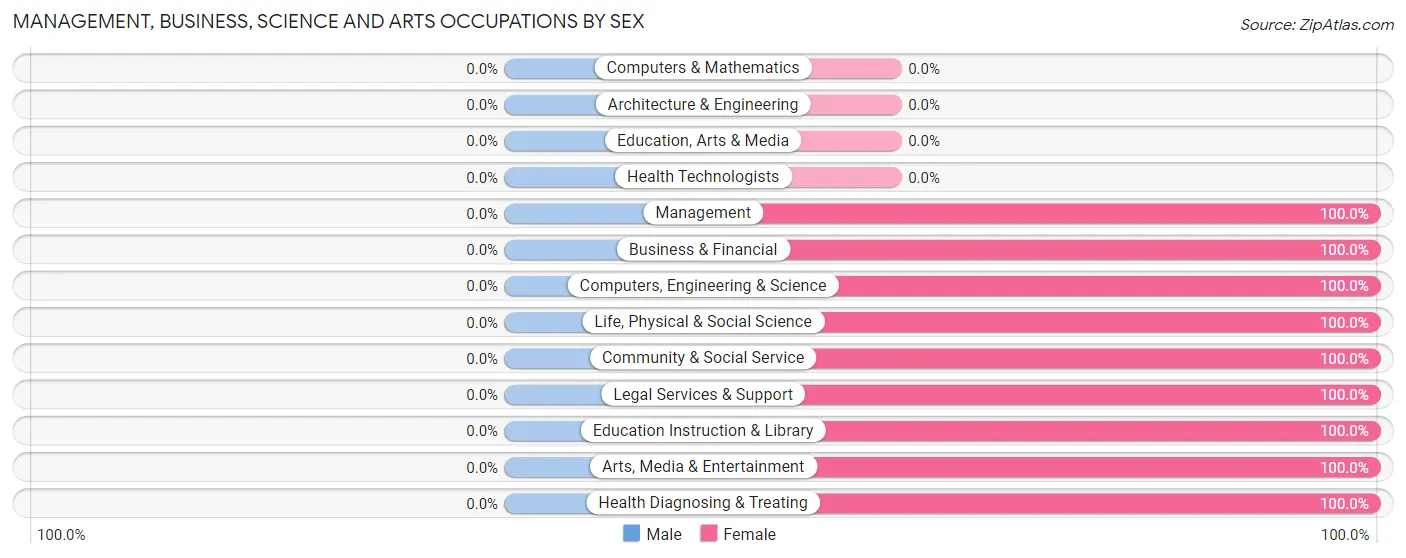
Management, Business, Science and Arts Occupations by Sex
| Occupation | Male | Female |
| Management | 0 (0.0%) | 11 (100.0%) |
| Business & Financial | 0 (0.0%) | 15 (100.0%) |
| Computers, Engineering & Science | 0 (0.0%) | 15 (100.0%) |
| Computers & Mathematics | 0 (0.0%) | 0 (0.0%) |
| Architecture & Engineering | 0 (0.0%) | 0 (0.0%) |
| Life, Physical & Social Science | 0 (0.0%) | 15 (100.0%) |
| Community & Social Service | 0 (0.0%) | 49 (100.0%) |
| Education, Arts & Media | 0 (0.0%) | 0 (0.0%) |
| Legal Services & Support | 0 (0.0%) | 8 (100.0%) |
| Education Instruction & Library | 0 (0.0%) | 25 (100.0%) |
| Arts, Media & Entertainment | 0 (0.0%) | 16 (100.0%) |
| Health Diagnosing & Treating | 0 (0.0%) | 11 (100.0%) |
| Health Technologists | 0 (0.0%) | 0 (0.0%) |
| Total (Category) | 0 (0.0%) | 101 (100.0%) |
| Total (Overall) | 555 (50.5%) | 544 (49.5%) |
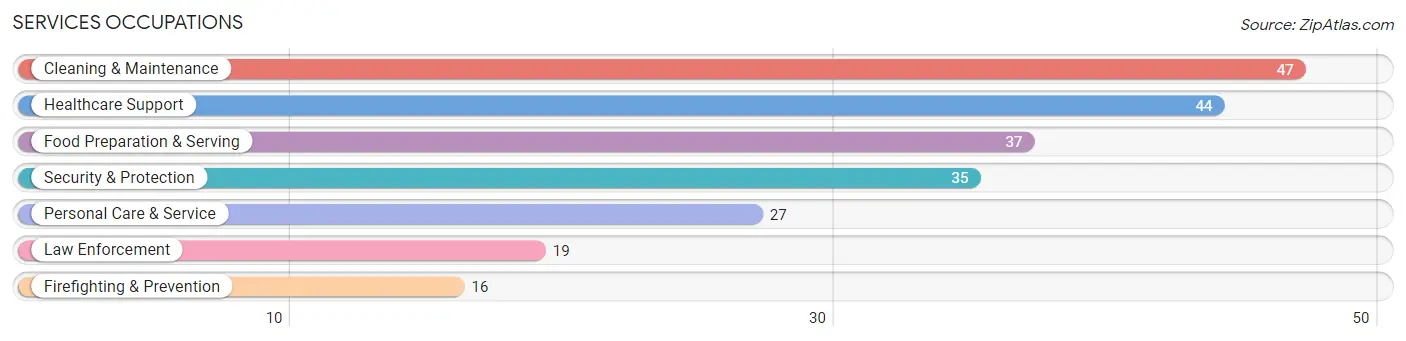
Services Occupations
The most common Services occupations in Calipatria are Cleaning & Maintenance (47 | 4.3%), Healthcare Support (44 | 4.0%), Food Preparation & Serving (37 | 3.4%), Security & Protection (35 | 3.2%), and Personal Care & Service (27 | 2.5%).
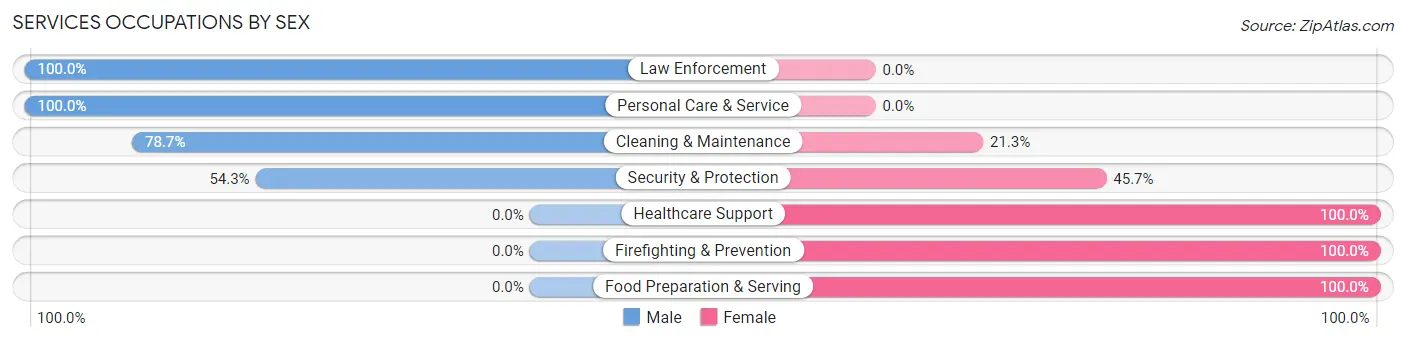
Services Occupations by Sex
Within the Services occupations in Calipatria, the most male-oriented occupations are Law Enforcement (100.0%), Personal Care & Service (100.0%), and Cleaning & Maintenance (78.7%), while the most female-oriented occupations are Healthcare Support (100.0%), Firefighting & Prevention (100.0%), and Food Preparation & Serving (100.0%).
| Occupation | Male | Female |
| Healthcare Support | 0 (0.0%) | 44 (100.0%) |
| Security & Protection | 19 (54.3%) | 16 (45.7%) |
| Firefighting & Prevention | 0 (0.0%) | 16 (100.0%) |
| Law Enforcement | 19 (100.0%) | 0 (0.0%) |
| Food Preparation & Serving | 0 (0.0%) | 37 (100.0%) |
| Cleaning & Maintenance | 37 (78.7%) | 10 (21.3%) |
| Personal Care & Service | 27 (100.0%) | 0 (0.0%) |
| Total (Category) | 83 (43.7%) | 107 (56.3%) |
| Total (Overall) | 555 (50.5%) | 544 (49.5%) |
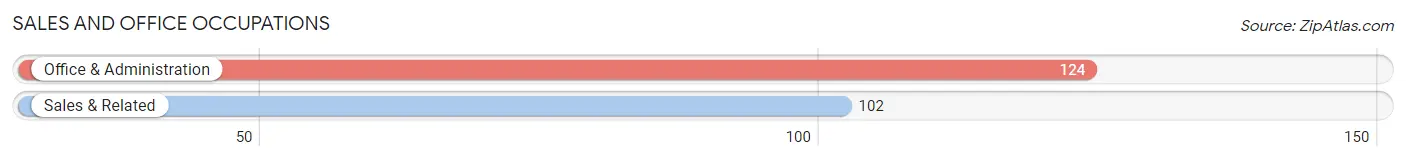
Sales and Office Occupations
The most common Sales and Office occupations in Calipatria are Office & Administration (124 | 11.3%), and Sales & Related (102 | 9.3%).
Sales and Office Occupations by Sex
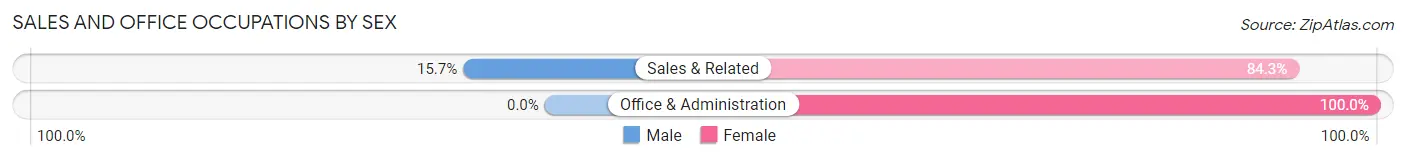
| Occupation | Male | Female |
| Sales & Related | 16 (15.7%) | 86 (84.3%) |
| Office & Administration | 0 (0.0%) | 124 (100.0%) |
| Total (Category) | 16 (7.1%) | 210 (92.9%) |
| Total (Overall) | 555 (50.5%) | 544 (49.5%) |
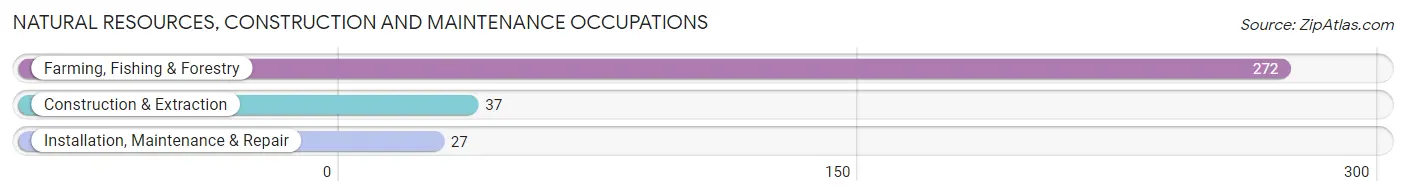
Natural Resources, Construction and Maintenance Occupations
The most common Natural Resources, Construction and Maintenance occupations in Calipatria are Farming, Fishing & Forestry (272 | 24.7%), Construction & Extraction (37 | 3.4%), and Installation, Maintenance & Repair (27 | 2.5%).
Natural Resources, Construction and Maintenance Occupations by Sex
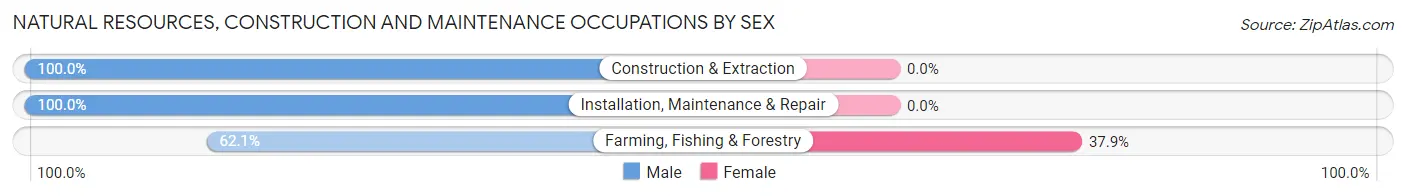
| Occupation | Male | Female |
| Farming, Fishing & Forestry | 169 (62.1%) | 103 (37.9%) |
| Construction & Extraction | 37 (100.0%) | 0 (0.0%) |
| Installation, Maintenance & Repair | 27 (100.0%) | 0 (0.0%) |
| Total (Category) | 233 (69.4%) | 103 (30.6%) |
| Total (Overall) | 555 (50.5%) | 544 (49.5%) |
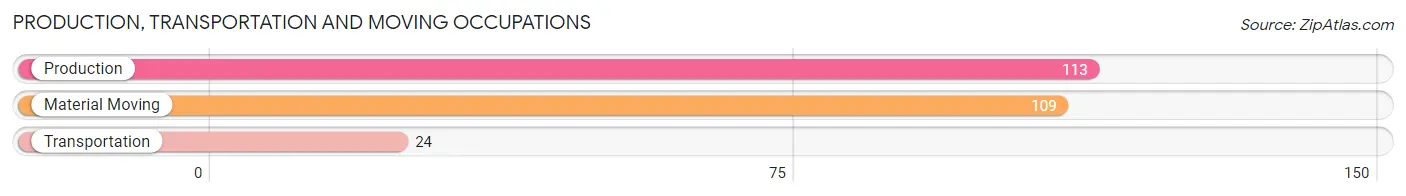
Production, Transportation and Moving Occupations
The most common Production, Transportation and Moving occupations in Calipatria are Production (113 | 10.3%), Material Moving (109 | 9.9%), and Transportation (24 | 2.2%).
Production, Transportation and Moving Occupations by Sex
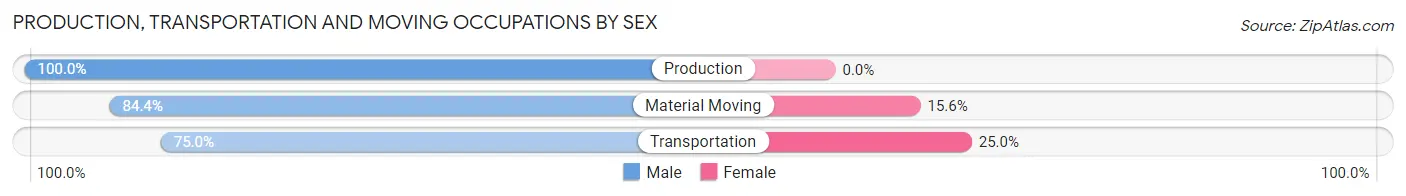
| Occupation | Male | Female |
| Production | 113 (100.0%) | 0 (0.0%) |
| Transportation | 18 (75.0%) | 6 (25.0%) |
| Material Moving | 92 (84.4%) | 17 (15.6%) |
| Total (Category) | 223 (90.6%) | 23 (9.3%) |
| Total (Overall) | 555 (50.5%) | 544 (49.5%) |
Employment Industries by Sex in Calipatria
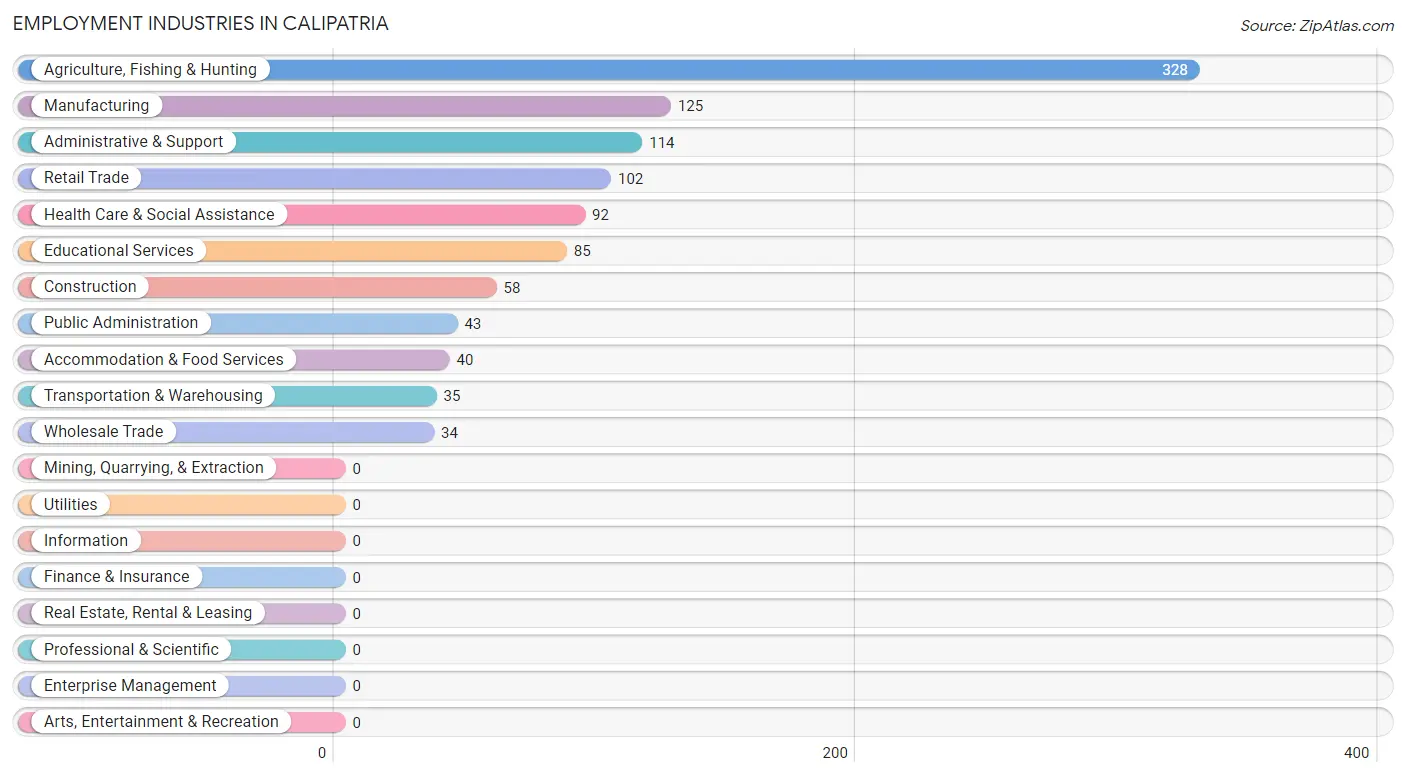
Employment Industries in Calipatria
The major employment industries in Calipatria include Agriculture, Fishing & Hunting (328 | 29.8%), Manufacturing (125 | 11.4%), Administrative & Support (114 | 10.4%), Retail Trade (102 | 9.3%), and Health Care & Social Assistance (92 | 8.4%).
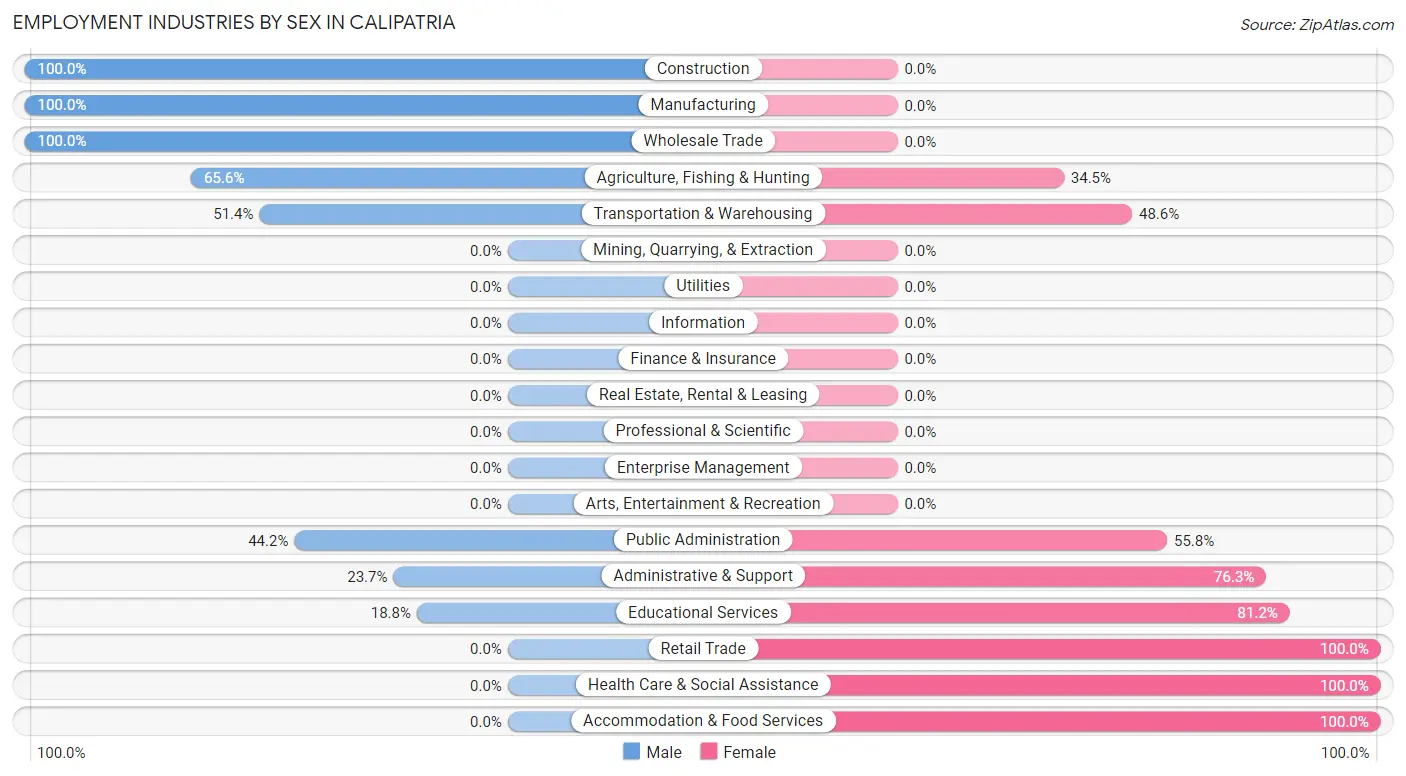
Employment Industries by Sex in Calipatria
The Calipatria industries that see more men than women are Construction (100.0%), Manufacturing (100.0%), and Wholesale Trade (100.0%), whereas the industries that tend to have a higher number of women are Retail Trade (100.0%), Health Care & Social Assistance (100.0%), and Accommodation & Food Services (100.0%).
| Industry | Male | Female |
| Agriculture, Fishing & Hunting | 215 (65.5%) | 113 (34.4%) |
| Mining, Quarrying, & Extraction | 0 (0.0%) | 0 (0.0%) |
| Construction | 58 (100.0%) | 0 (0.0%) |
| Manufacturing | 125 (100.0%) | 0 (0.0%) |
| Wholesale Trade | 34 (100.0%) | 0 (0.0%) |
| Retail Trade | 0 (0.0%) | 102 (100.0%) |
| Transportation & Warehousing | 18 (51.4%) | 17 (48.6%) |
| Utilities | 0 (0.0%) | 0 (0.0%) |
| Information | 0 (0.0%) | 0 (0.0%) |
| Finance & Insurance | 0 (0.0%) | 0 (0.0%) |
| Real Estate, Rental & Leasing | 0 (0.0%) | 0 (0.0%) |
| Professional & Scientific | 0 (0.0%) | 0 (0.0%) |
| Enterprise Management | 0 (0.0%) | 0 (0.0%) |
| Administrative & Support | 27 (23.7%) | 87 (76.3%) |
| Educational Services | 16 (18.8%) | 69 (81.2%) |
| Health Care & Social Assistance | 0 (0.0%) | 92 (100.0%) |
| Arts, Entertainment & Recreation | 0 (0.0%) | 0 (0.0%) |
| Accommodation & Food Services | 0 (0.0%) | 40 (100.0%) |
| Public Administration | 19 (44.2%) | 24 (55.8%) |
| Total | 555 (50.5%) | 544 (49.5%) |
Education in Calipatria
School Enrollment in Calipatria
The most common levels of schooling among the 1,753 students in Calipatria are high school (739 | 42.2%), college / undergraduate (453 | 25.8%), and middle school (312 | 17.8%).
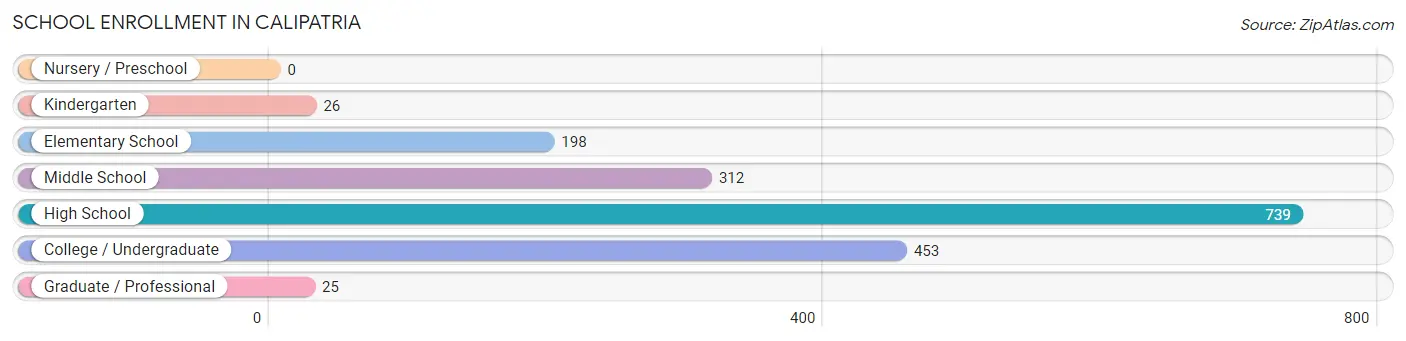
| School Level | # Students | % Students |
| Nursery / Preschool | 0 | 0.0% |
| Kindergarten | 26 | 1.5% |
| Elementary School | 198 | 11.3% |
| Middle School | 312 | 17.8% |
| High School | 739 | 42.2% |
| College / Undergraduate | 453 | 25.8% |
| Graduate / Professional | 25 | 1.4% |
| Total | 1,753 | 100.0% |
School Enrollment by Age by Funding Source in Calipatria
Out of a total of 1,753 students who are enrolled in schools in Calipatria, 21 (1.2%) attend a private institution, while the remaining 1,732 (98.8%) are enrolled in public schools. The age group of 25 to 34 year olds has the highest likelihood of being enrolled in private schools, with 12 (3.6% in the age bracket) enrolled. Conversely, the age group of 5 to 9 year old has the lowest likelihood of being enrolled in a private school, with 196 (100.0% in the age bracket) attending a public institution.
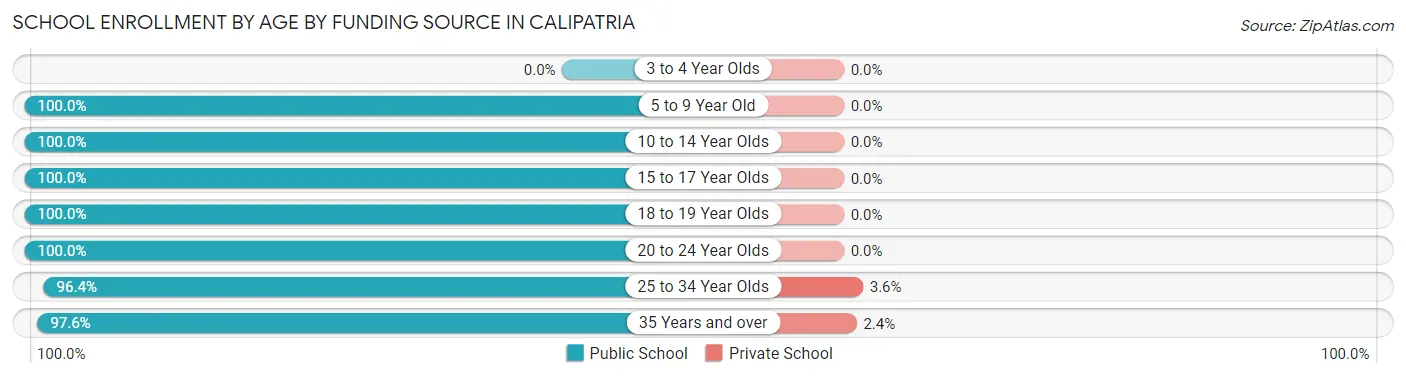
| Age Bracket | Public School | Private School |
| 3 to 4 Year Olds | 0 (0.0%) | 0 (0.0%) |
| 5 to 9 Year Old | 196 (100.0%) | 0 (0.0%) |
| 10 to 14 Year Olds | 434 (100.0%) | 0 (0.0%) |
| 15 to 17 Year Olds | 183 (100.0%) | 0 (0.0%) |
| 18 to 19 Year Olds | 60 (100.0%) | 0 (0.0%) |
| 20 to 24 Year Olds | 166 (100.0%) | 0 (0.0%) |
| 25 to 34 Year Olds | 325 (96.4%) | 12 (3.6%) |
| 35 Years and over | 368 (97.6%) | 9 (2.4%) |
| Total | 1,732 (98.8%) | 21 (1.2%) |
Educational Attainment by Field of Study in Calipatria
Education (25 | 37.9%), social sciences (19 | 28.8%), science & technology (13 | 19.7%), physical & health sciences (5 | 7.6%), and business (4 | 6.1%) are the most common fields of study among 66 individuals in Calipatria who have obtained a bachelor's degree or higher.
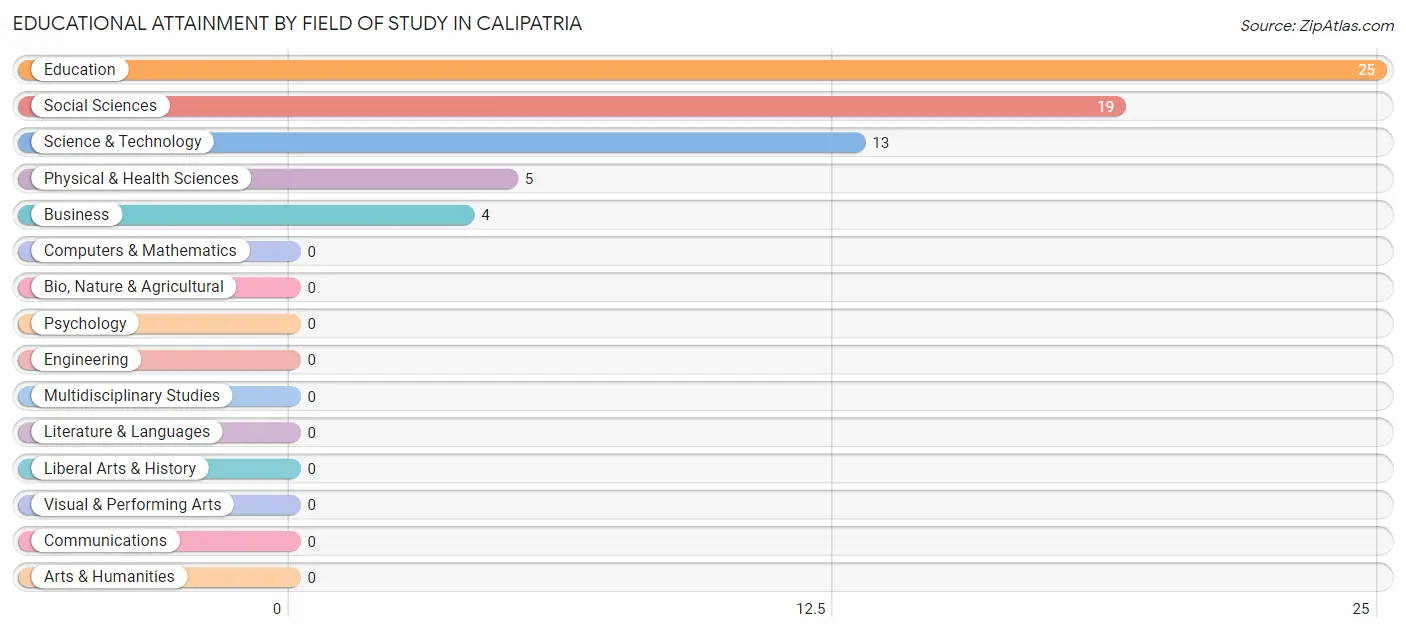
| Field of Study | # Graduates | % Graduates |
| Computers & Mathematics | 0 | 0.0% |
| Bio, Nature & Agricultural | 0 | 0.0% |
| Physical & Health Sciences | 5 | 7.6% |
| Psychology | 0 | 0.0% |
| Social Sciences | 19 | 28.8% |
| Engineering | 0 | 0.0% |
| Multidisciplinary Studies | 0 | 0.0% |
| Science & Technology | 13 | 19.7% |
| Business | 4 | 6.1% |
| Education | 25 | 37.9% |
| Literature & Languages | 0 | 0.0% |
| Liberal Arts & History | 0 | 0.0% |
| Visual & Performing Arts | 0 | 0.0% |
| Communications | 0 | 0.0% |
| Arts & Humanities | 0 | 0.0% |
| Total | 66 | 100.0% |
Transportation & Commute in Calipatria
Vehicle Availability by Sex in Calipatria
The most prevalent vehicle ownership categories in Calipatria are males with 2 vehicles (232, accounting for 41.8%) and females with 2 vehicles (213, making up 42.6%).
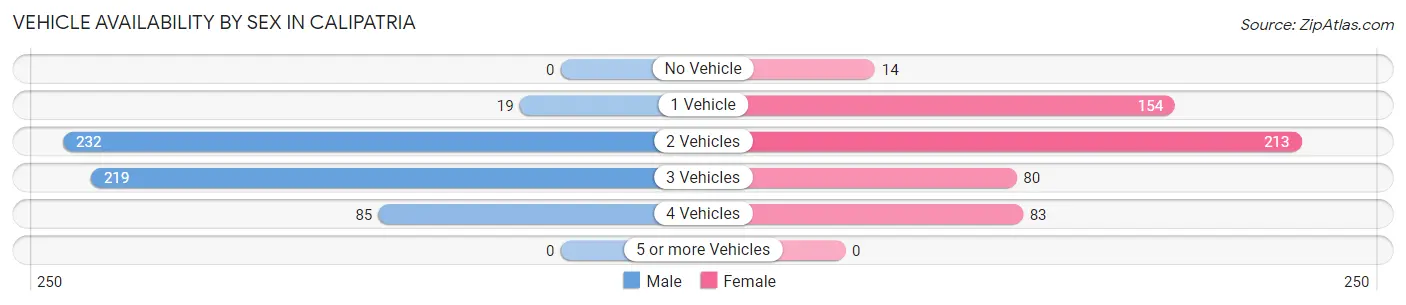
| Vehicles Available | Male | Female |
| No Vehicle | 0 (0.0%) | 14 (2.6%) |
| 1 Vehicle | 19 (3.4%) | 154 (28.3%) |
| 2 Vehicles | 232 (41.8%) | 213 (39.2%) |
| 3 Vehicles | 219 (39.5%) | 80 (14.7%) |
| 4 Vehicles | 85 (15.3%) | 83 (15.3%) |
| 5 or more Vehicles | 0 (0.0%) | 0 (0.0%) |
| Total | 555 (100.0%) | 544 (100.0%) |
Commute Time in Calipatria
The most frequently occuring commute durations in Calipatria are 5 to 9 minutes (281 commuters, 25.9%), 10 to 14 minutes (256 commuters, 23.6%), and 15 to 19 minutes (240 commuters, 22.1%).
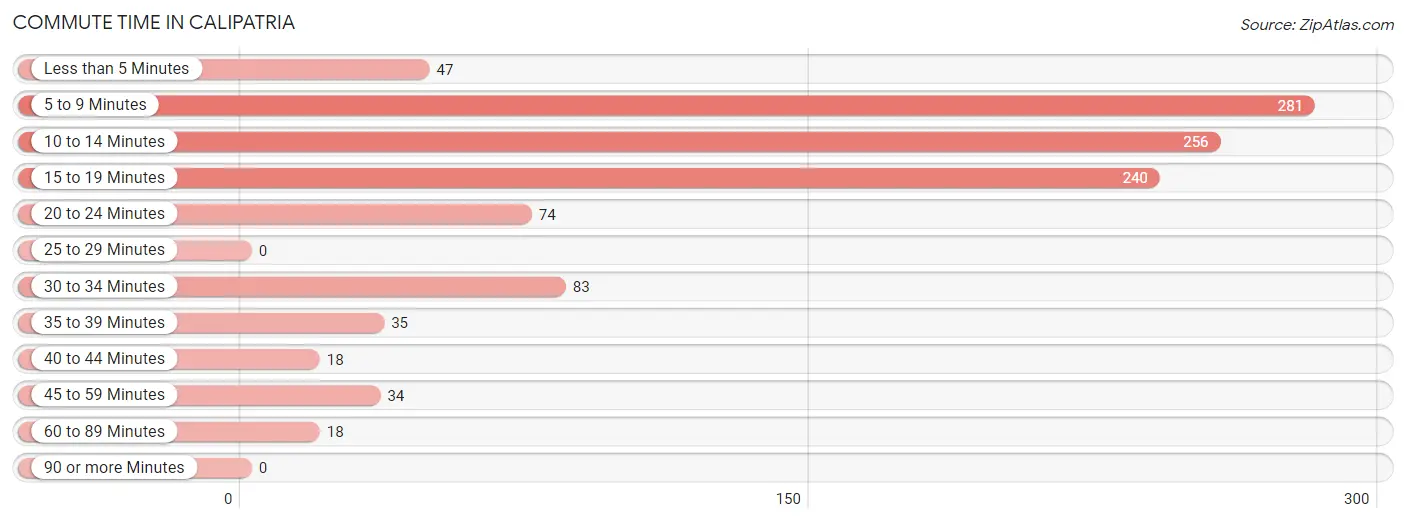
| Commute Time | # Commuters | % Commuters |
| Less than 5 Minutes | 47 | 4.3% |
| 5 to 9 Minutes | 281 | 25.9% |
| 10 to 14 Minutes | 256 | 23.6% |
| 15 to 19 Minutes | 240 | 22.1% |
| 20 to 24 Minutes | 74 | 6.8% |
| 25 to 29 Minutes | 0 | 0.0% |
| 30 to 34 Minutes | 83 | 7.6% |
| 35 to 39 Minutes | 35 | 3.2% |
| 40 to 44 Minutes | 18 | 1.7% |
| 45 to 59 Minutes | 34 | 3.1% |
| 60 to 89 Minutes | 18 | 1.7% |
| 90 or more Minutes | 0 | 0.0% |
Commute Time by Sex in Calipatria
The most common commute times in Calipatria are 5 to 9 minutes (147 commuters, 26.5%) for males and 15 to 19 minutes (140 commuters, 26.4%) for females.
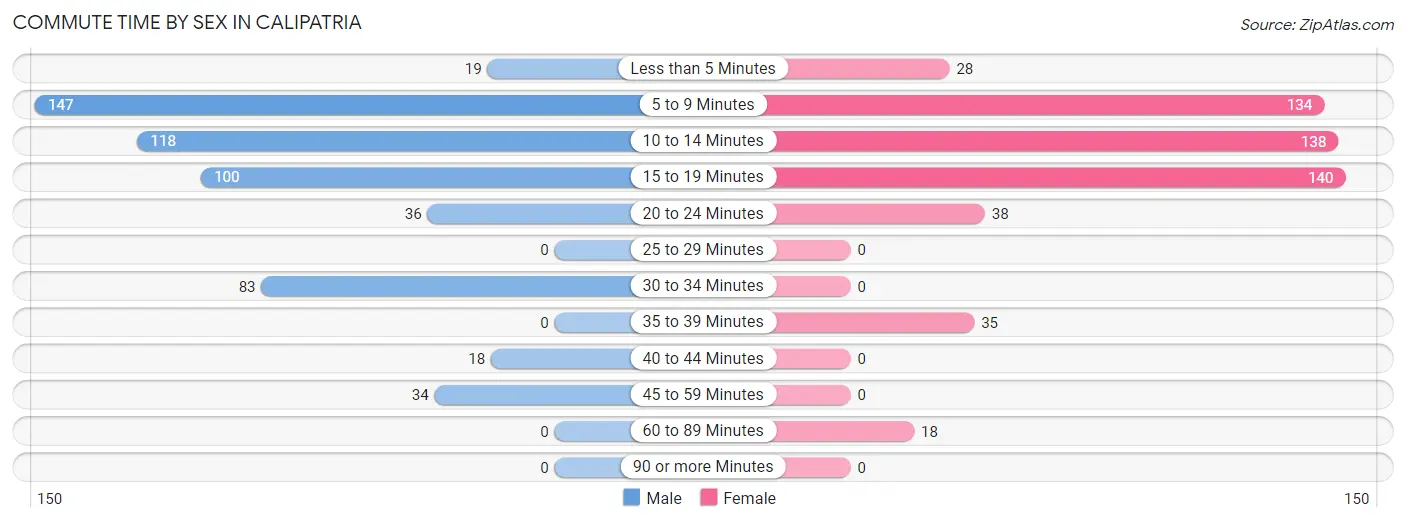
| Commute Time | Male | Female |
| Less than 5 Minutes | 19 (3.4%) | 28 (5.3%) |
| 5 to 9 Minutes | 147 (26.5%) | 134 (25.2%) |
| 10 to 14 Minutes | 118 (21.3%) | 138 (26.0%) |
| 15 to 19 Minutes | 100 (18.0%) | 140 (26.4%) |
| 20 to 24 Minutes | 36 (6.5%) | 38 (7.2%) |
| 25 to 29 Minutes | 0 (0.0%) | 0 (0.0%) |
| 30 to 34 Minutes | 83 (14.9%) | 0 (0.0%) |
| 35 to 39 Minutes | 0 (0.0%) | 35 (6.6%) |
| 40 to 44 Minutes | 18 (3.2%) | 0 (0.0%) |
| 45 to 59 Minutes | 34 (6.1%) | 0 (0.0%) |
| 60 to 89 Minutes | 0 (0.0%) | 18 (3.4%) |
| 90 or more Minutes | 0 (0.0%) | 0 (0.0%) |
Time of Departure to Work by Sex in Calipatria
The most frequent times of departure to work in Calipatria are 5:00 AM to 5:29 AM (209, 37.7%) for males and 7:00 AM to 7:29 AM (175, 33.0%) for females.
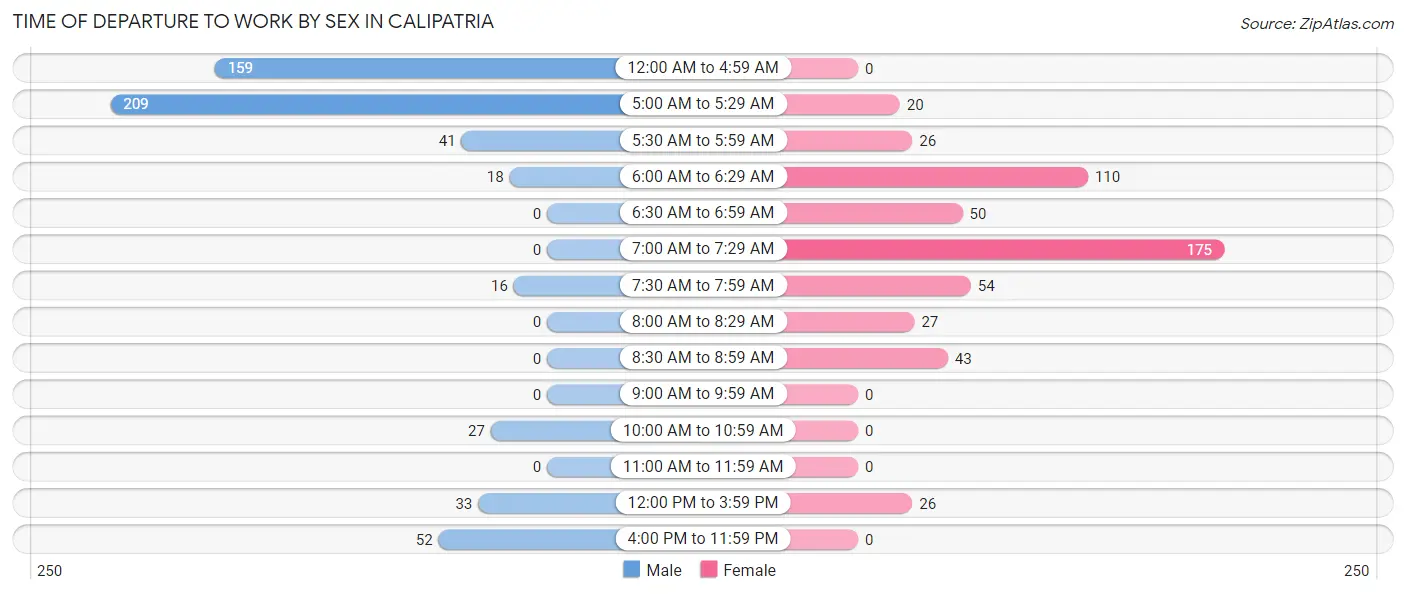
| Time of Departure | Male | Female |
| 12:00 AM to 4:59 AM | 159 (28.6%) | 0 (0.0%) |
| 5:00 AM to 5:29 AM | 209 (37.7%) | 20 (3.8%) |
| 5:30 AM to 5:59 AM | 41 (7.4%) | 26 (4.9%) |
| 6:00 AM to 6:29 AM | 18 (3.2%) | 110 (20.7%) |
| 6:30 AM to 6:59 AM | 0 (0.0%) | 50 (9.4%) |
| 7:00 AM to 7:29 AM | 0 (0.0%) | 175 (33.0%) |
| 7:30 AM to 7:59 AM | 16 (2.9%) | 54 (10.2%) |
| 8:00 AM to 8:29 AM | 0 (0.0%) | 27 (5.1%) |
| 8:30 AM to 8:59 AM | 0 (0.0%) | 43 (8.1%) |
| 9:00 AM to 9:59 AM | 0 (0.0%) | 0 (0.0%) |
| 10:00 AM to 10:59 AM | 27 (4.9%) | 0 (0.0%) |
| 11:00 AM to 11:59 AM | 0 (0.0%) | 0 (0.0%) |
| 12:00 PM to 3:59 PM | 33 (5.9%) | 26 (4.9%) |
| 4:00 PM to 11:59 PM | 52 (9.4%) | 0 (0.0%) |
| Total | 555 (100.0%) | 531 (100.0%) |
Housing Occupancy in Calipatria
Occupancy by Ownership in Calipatria
Of the total 1,078 dwellings in Calipatria, owner-occupied units account for 689 (63.9%), while renter-occupied units make up 389 (36.1%).
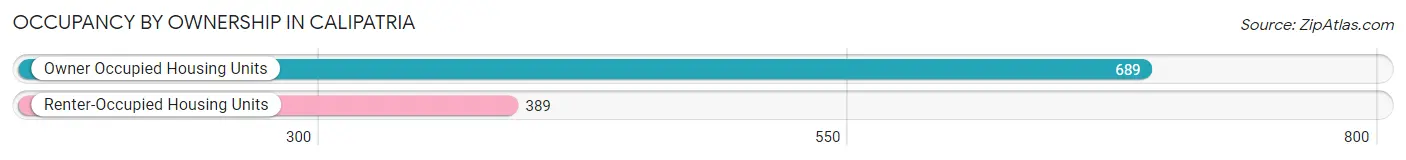
| Occupancy | # Housing Units | % Housing Units |
| Owner Occupied Housing Units | 689 | 63.9% |
| Renter-Occupied Housing Units | 389 | 36.1% |
| Total Occupied Housing Units | 1,078 | 100.0% |
Occupancy by Household Size in Calipatria
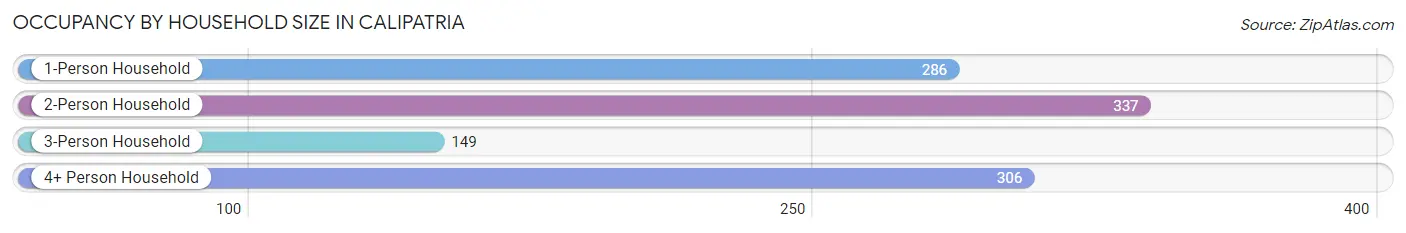
| Household Size | # Housing Units | % Housing Units |
| 1-Person Household | 286 | 26.5% |
| 2-Person Household | 337 | 31.3% |
| 3-Person Household | 149 | 13.8% |
| 4+ Person Household | 306 | 28.4% |
| Total Housing Units | 1,078 | 100.0% |
Occupancy by Ownership by Household Size in Calipatria
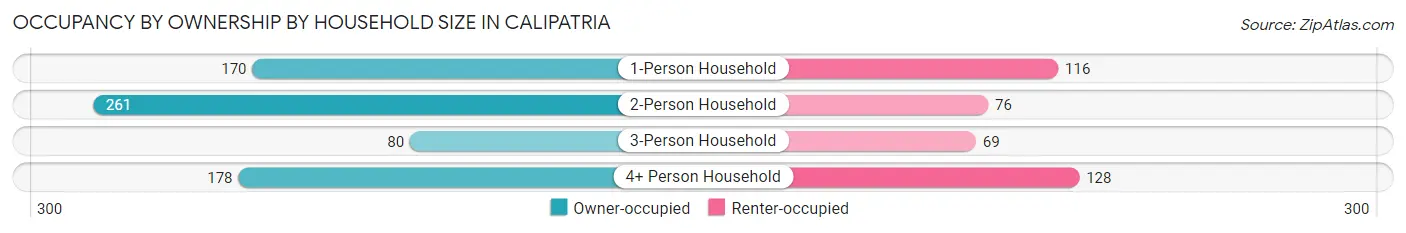
| Household Size | Owner-occupied | Renter-occupied |
| 1-Person Household | 170 (59.4%) | 116 (40.6%) |
| 2-Person Household | 261 (77.4%) | 76 (22.6%) |
| 3-Person Household | 80 (53.7%) | 69 (46.3%) |
| 4+ Person Household | 178 (58.2%) | 128 (41.8%) |
| Total Housing Units | 689 (63.9%) | 389 (36.1%) |
Occupancy by Educational Attainment in Calipatria
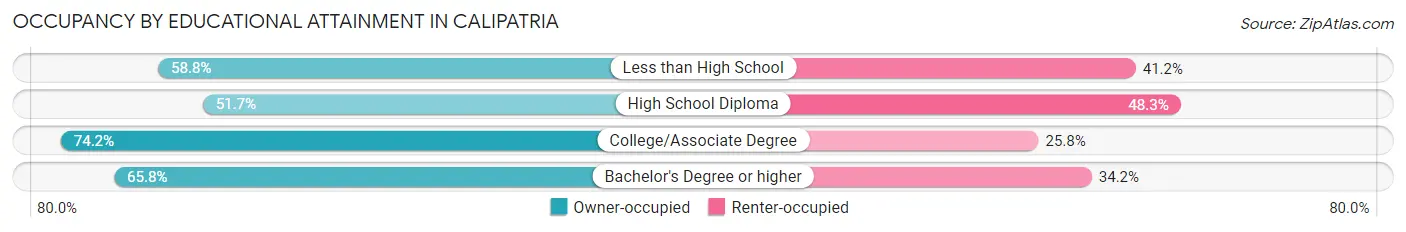
| Household Size | Owner-occupied | Renter-occupied |
| Less than High School | 190 (58.8%) | 133 (41.2%) |
| High School Diploma | 134 (51.7%) | 125 (48.3%) |
| College/Associate Degree | 340 (74.2%) | 118 (25.8%) |
| Bachelor's Degree or higher | 25 (65.8%) | 13 (34.2%) |
Occupancy by Age of Householder in Calipatria
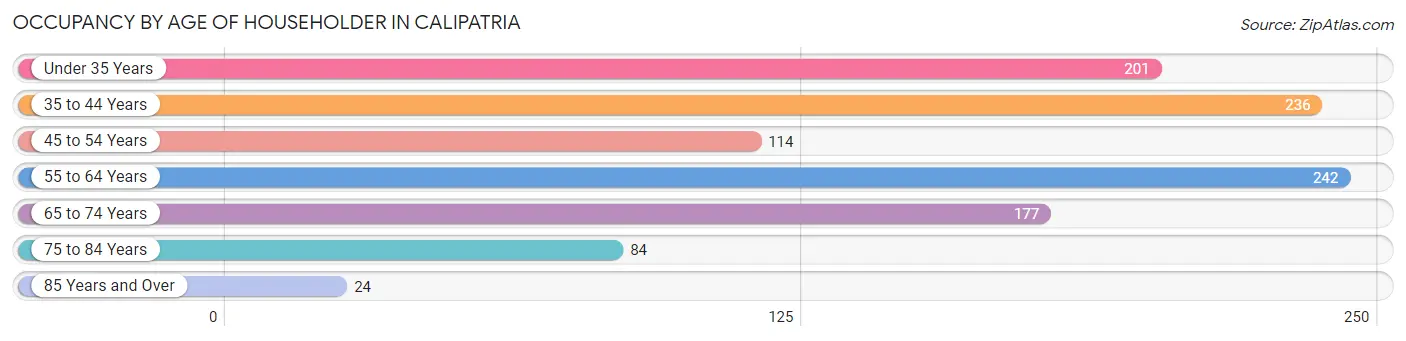
| Age Bracket | # Households | % Households |
| Under 35 Years | 201 | 18.6% |
| 35 to 44 Years | 236 | 21.9% |
| 45 to 54 Years | 114 | 10.6% |
| 55 to 64 Years | 242 | 22.5% |
| 65 to 74 Years | 177 | 16.4% |
| 75 to 84 Years | 84 | 7.8% |
| 85 Years and Over | 24 | 2.2% |
| Total | 1,078 | 100.0% |
Housing Finances in Calipatria
Median Income by Occupancy in Calipatria
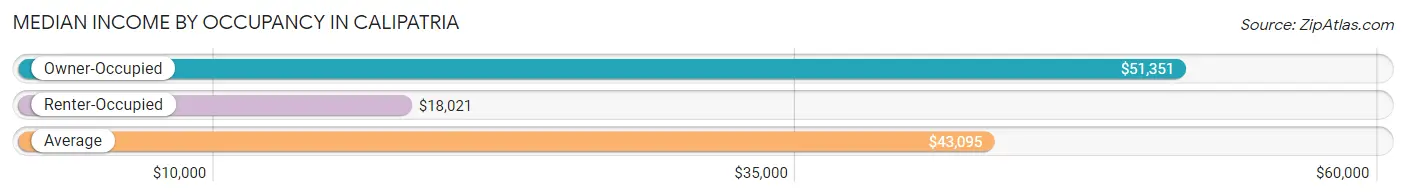
| Occupancy Type | # Households | Median Income |
| Owner-Occupied | 689 (63.9%) | $51,351 |
| Renter-Occupied | 389 (36.1%) | $18,021 |
| Average | 1,078 (100.0%) | $43,095 |
Occupancy by Householder Income Bracket in Calipatria
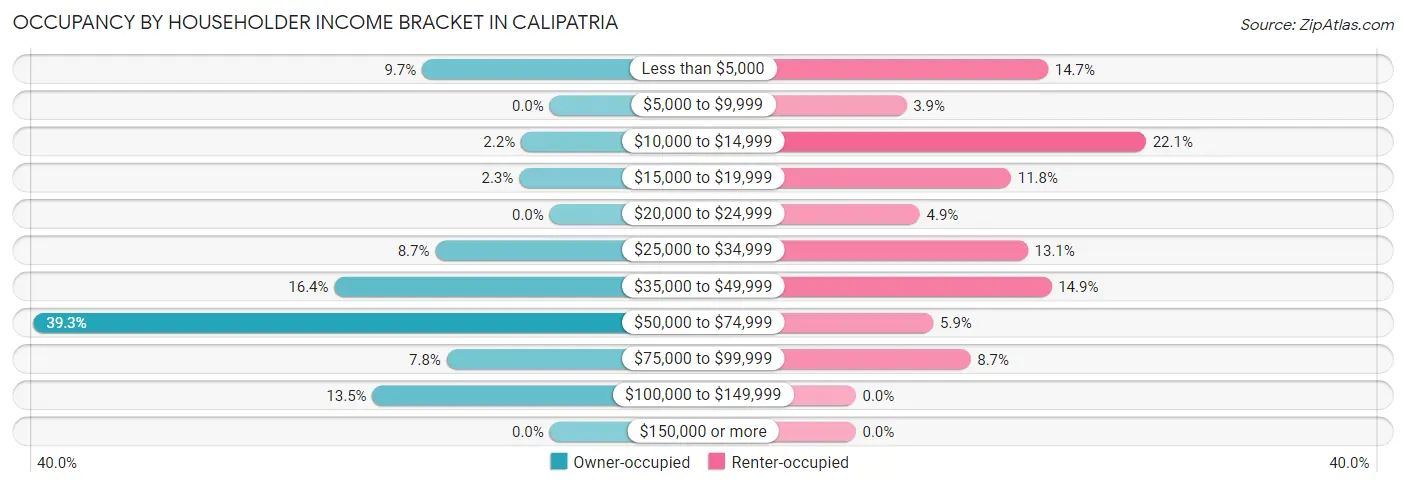
| Income Bracket | Owner-occupied | Renter-occupied |
| Less than $5,000 | 67 (9.7%) | 57 (14.6%) |
| $5,000 to $9,999 | 0 (0.0%) | 15 (3.9%) |
| $10,000 to $14,999 | 15 (2.2%) | 86 (22.1%) |
| $15,000 to $19,999 | 16 (2.3%) | 46 (11.8%) |
| $20,000 to $24,999 | 0 (0.0%) | 19 (4.9%) |
| $25,000 to $34,999 | 60 (8.7%) | 51 (13.1%) |
| $35,000 to $49,999 | 113 (16.4%) | 58 (14.9%) |
| $50,000 to $74,999 | 271 (39.3%) | 23 (5.9%) |
| $75,000 to $99,999 | 54 (7.8%) | 34 (8.7%) |
| $100,000 to $149,999 | 93 (13.5%) | 0 (0.0%) |
| $150,000 or more | 0 (0.0%) | 0 (0.0%) |
| Total | 689 (100.0%) | 389 (100.0%) |
Monthly Housing Cost Tiers in Calipatria
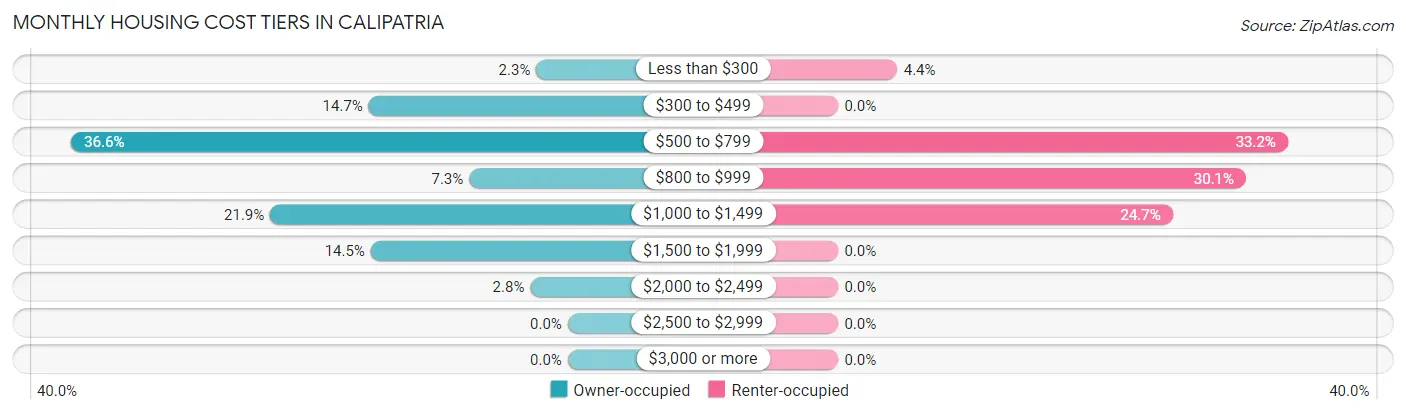
| Monthly Cost | Owner-occupied | Renter-occupied |
| Less than $300 | 16 (2.3%) | 17 (4.4%) |
| $300 to $499 | 101 (14.7%) | 0 (0.0%) |
| $500 to $799 | 252 (36.6%) | 129 (33.2%) |
| $800 to $999 | 50 (7.3%) | 117 (30.1%) |
| $1,000 to $1,499 | 151 (21.9%) | 96 (24.7%) |
| $1,500 to $1,999 | 100 (14.5%) | 0 (0.0%) |
| $2,000 to $2,499 | 19 (2.8%) | 0 (0.0%) |
| $2,500 to $2,999 | 0 (0.0%) | 0 (0.0%) |
| $3,000 or more | 0 (0.0%) | 0 (0.0%) |
| Total | 689 (100.0%) | 389 (100.0%) |
Physical Housing Characteristics in Calipatria
Housing Structures in Calipatria
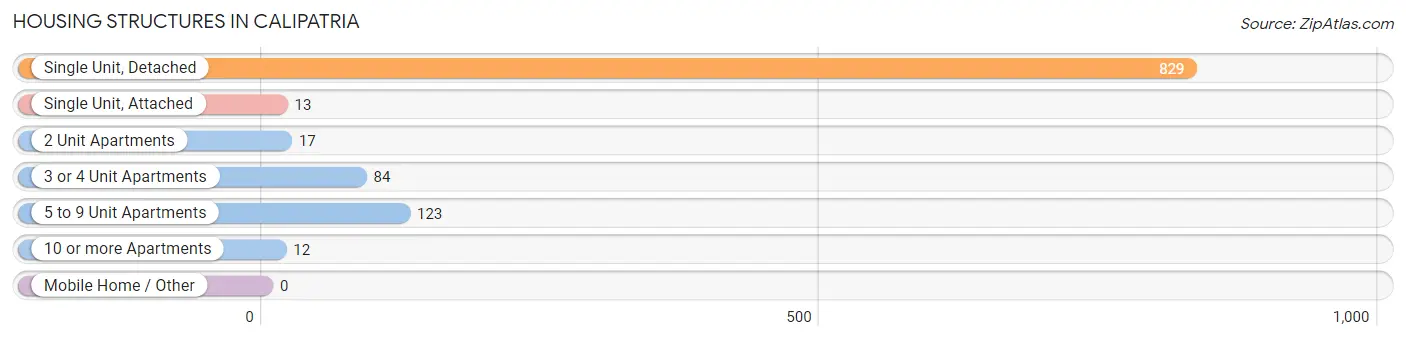
| Structure Type | # Housing Units | % Housing Units |
| Single Unit, Detached | 829 | 76.9% |
| Single Unit, Attached | 13 | 1.2% |
| 2 Unit Apartments | 17 | 1.6% |
| 3 or 4 Unit Apartments | 84 | 7.8% |
| 5 to 9 Unit Apartments | 123 | 11.4% |
| 10 or more Apartments | 12 | 1.1% |
| Mobile Home / Other | 0 | 0.0% |
| Total | 1,078 | 100.0% |
Housing Structures by Occupancy in Calipatria
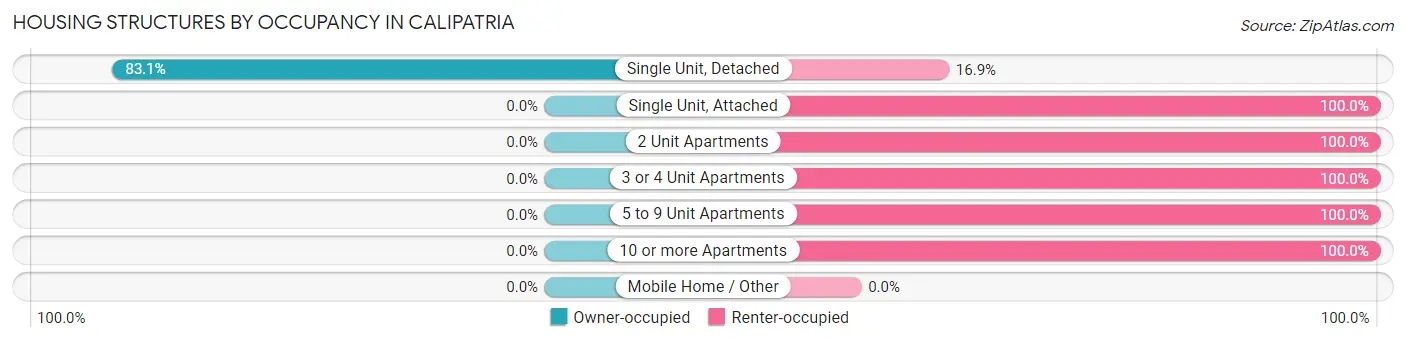
| Structure Type | Owner-occupied | Renter-occupied |
| Single Unit, Detached | 689 (83.1%) | 140 (16.9%) |
| Single Unit, Attached | 0 (0.0%) | 13 (100.0%) |
| 2 Unit Apartments | 0 (0.0%) | 17 (100.0%) |
| 3 or 4 Unit Apartments | 0 (0.0%) | 84 (100.0%) |
| 5 to 9 Unit Apartments | 0 (0.0%) | 123 (100.0%) |
| 10 or more Apartments | 0 (0.0%) | 12 (100.0%) |
| Mobile Home / Other | 0 (0.0%) | 0 (0.0%) |
| Total | 689 (63.9%) | 389 (36.1%) |
Housing Structures by Number of Rooms in Calipatria
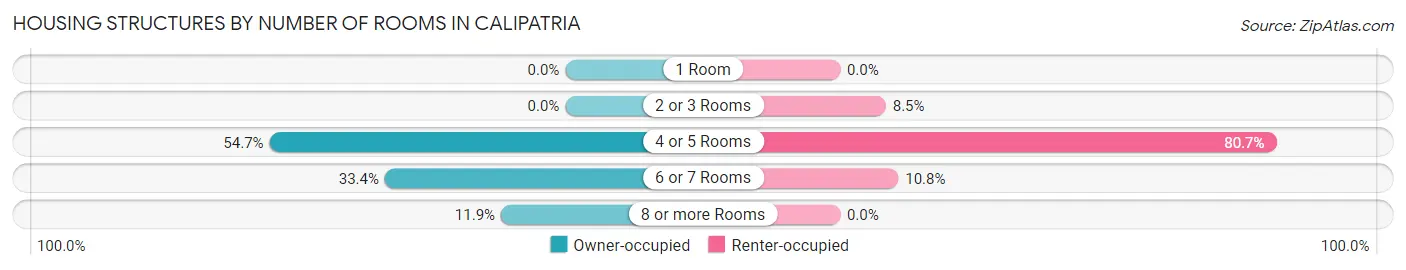
| Number of Rooms | Owner-occupied | Renter-occupied |
| 1 Room | 0 (0.0%) | 0 (0.0%) |
| 2 or 3 Rooms | 0 (0.0%) | 33 (8.5%) |
| 4 or 5 Rooms | 377 (54.7%) | 314 (80.7%) |
| 6 or 7 Rooms | 230 (33.4%) | 42 (10.8%) |
| 8 or more Rooms | 82 (11.9%) | 0 (0.0%) |
| Total | 689 (100.0%) | 389 (100.0%) |
Housing Structure by Heating Type in Calipatria
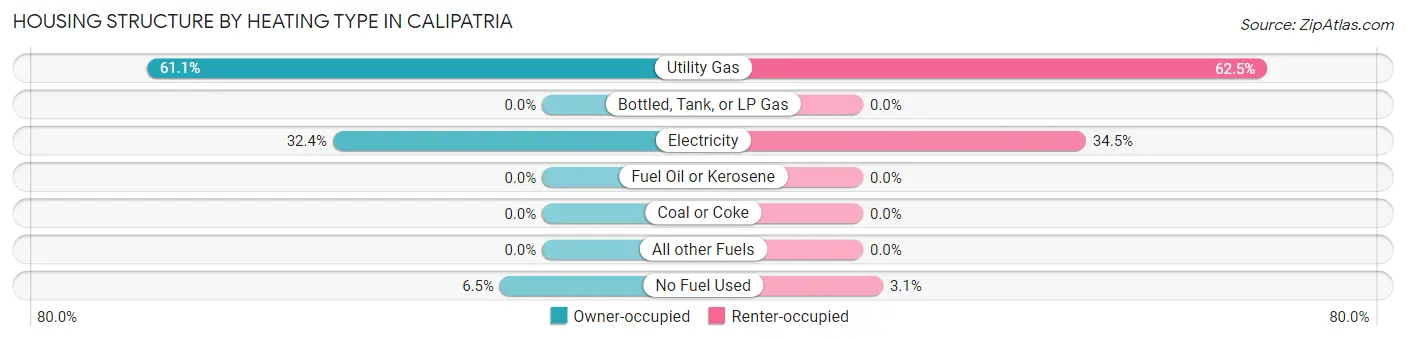
| Heating Type | Owner-occupied | Renter-occupied |
| Utility Gas | 421 (61.1%) | 243 (62.5%) |
| Bottled, Tank, or LP Gas | 0 (0.0%) | 0 (0.0%) |
| Electricity | 223 (32.4%) | 134 (34.4%) |
| Fuel Oil or Kerosene | 0 (0.0%) | 0 (0.0%) |
| Coal or Coke | 0 (0.0%) | 0 (0.0%) |
| All other Fuels | 0 (0.0%) | 0 (0.0%) |
| No Fuel Used | 45 (6.5%) | 12 (3.1%) |
| Total | 689 (100.0%) | 389 (100.0%) |
Household Vehicle Usage in Calipatria
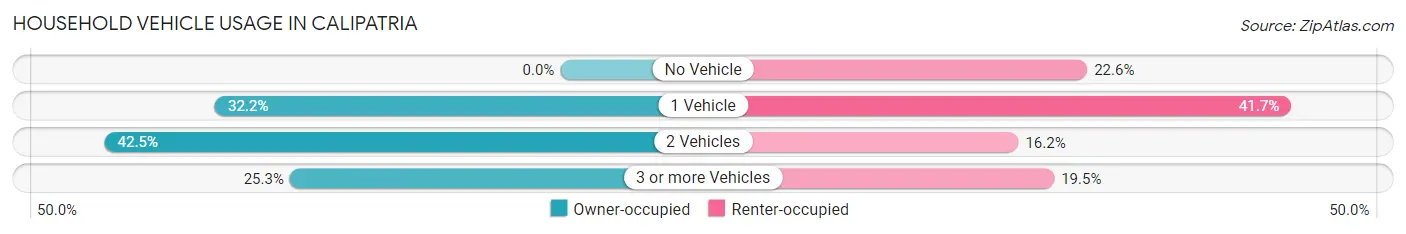
| Vehicles per Household | Owner-occupied | Renter-occupied |
| No Vehicle | 0 (0.0%) | 88 (22.6%) |
| 1 Vehicle | 222 (32.2%) | 162 (41.6%) |
| 2 Vehicles | 293 (42.5%) | 63 (16.2%) |
| 3 or more Vehicles | 174 (25.3%) | 76 (19.5%) |
| Total | 689 (100.0%) | 389 (100.0%) |
Real Estate & Mortgages in Calipatria
Real Estate and Mortgage Overview in Calipatria
| Characteristic | Without Mortgage | With Mortgage |
| Housing Units | 325 | 364 |
| Median Property Value | $165,500 | $214,400 |
| Median Household Income | $50,818 | $0 |
| Monthly Housing Costs | $547 | $0 |
| Real Estate Taxes | $1,703 | $0 |
Property Value by Mortgage Status in Calipatria
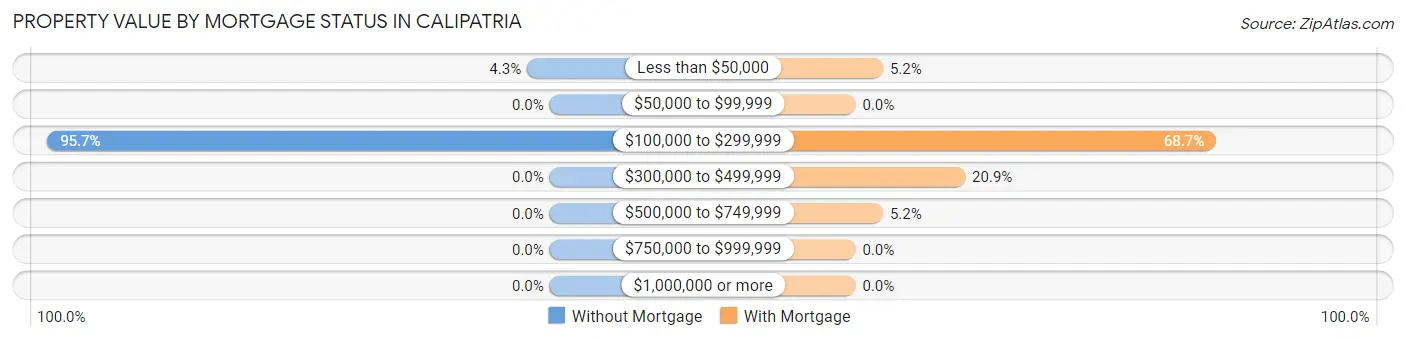
| Property Value | Without Mortgage | With Mortgage |
| Less than $50,000 | 14 (4.3%) | 19 (5.2%) |
| $50,000 to $99,999 | 0 (0.0%) | 0 (0.0%) |
| $100,000 to $299,999 | 311 (95.7%) | 250 (68.7%) |
| $300,000 to $499,999 | 0 (0.0%) | 76 (20.9%) |
| $500,000 to $749,999 | 0 (0.0%) | 19 (5.2%) |
| $750,000 to $999,999 | 0 (0.0%) | 0 (0.0%) |
| $1,000,000 or more | 0 (0.0%) | 0 (0.0%) |
| Total | 325 (100.0%) | 364 (100.0%) |
Household Income by Mortgage Status in Calipatria
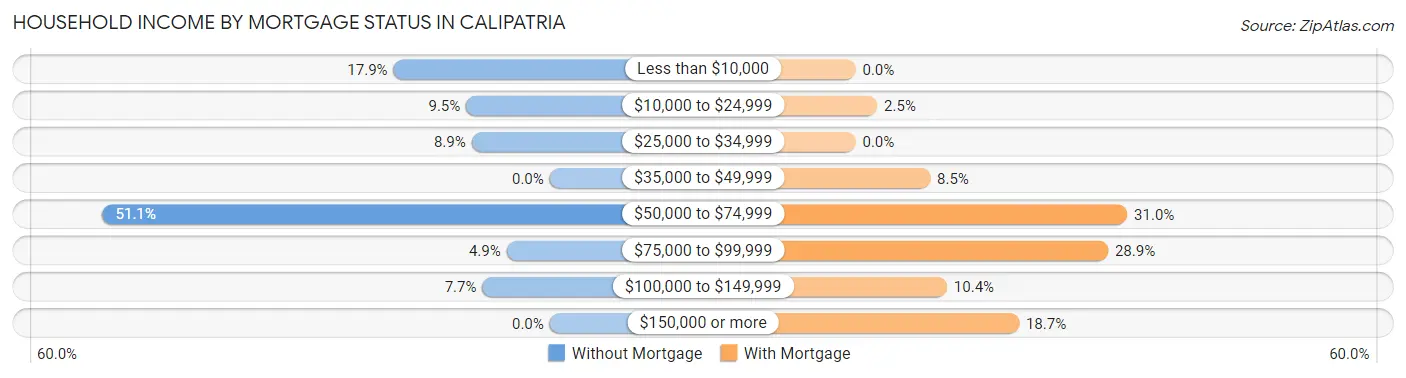
| Household Income | Without Mortgage | With Mortgage |
| Less than $10,000 | 58 (17.8%) | 0 (0.0%) |
| $10,000 to $24,999 | 31 (9.5%) | 9 (2.5%) |
| $25,000 to $34,999 | 29 (8.9%) | 0 (0.0%) |
| $35,000 to $49,999 | 0 (0.0%) | 31 (8.5%) |
| $50,000 to $74,999 | 166 (51.1%) | 113 (31.0%) |
| $75,000 to $99,999 | 16 (4.9%) | 105 (28.8%) |
| $100,000 to $149,999 | 25 (7.7%) | 38 (10.4%) |
| $150,000 or more | 0 (0.0%) | 68 (18.7%) |
| Total | 325 (100.0%) | 364 (100.0%) |
Property Value to Household Income Ratio in Calipatria
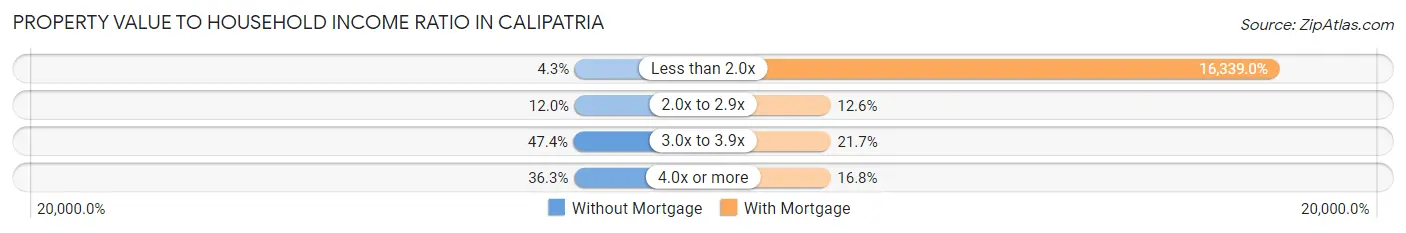
| Value-to-Income Ratio | Without Mortgage | With Mortgage |
| Less than 2.0x | 14 (4.3%) | 59,474 (16,339.0%) |
| 2.0x to 2.9x | 39 (12.0%) | 46 (12.6%) |
| 3.0x to 3.9x | 154 (47.4%) | 79 (21.7%) |
| 4.0x or more | 118 (36.3%) | 61 (16.8%) |
| Total | 325 (100.0%) | 364 (100.0%) |
Real Estate Taxes by Mortgage Status in Calipatria
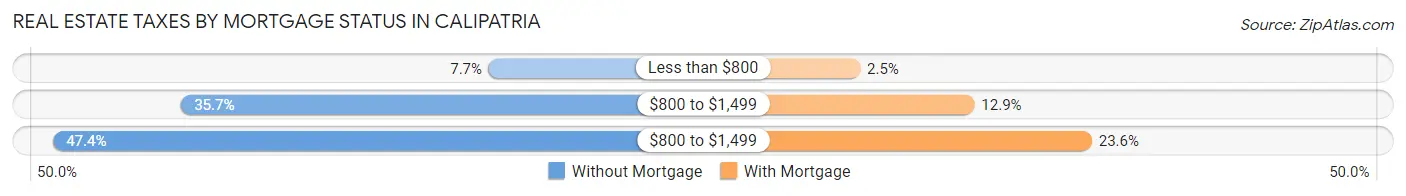
| Property Taxes | Without Mortgage | With Mortgage |
| Less than $800 | 25 (7.7%) | 9 (2.5%) |
| $800 to $1,499 | 116 (35.7%) | 47 (12.9%) |
| $800 to $1,499 | 154 (47.4%) | 86 (23.6%) |
| Total | 325 (100.0%) | 364 (100.0%) |
Health & Disability in Calipatria
Health Insurance Coverage by Age in Calipatria
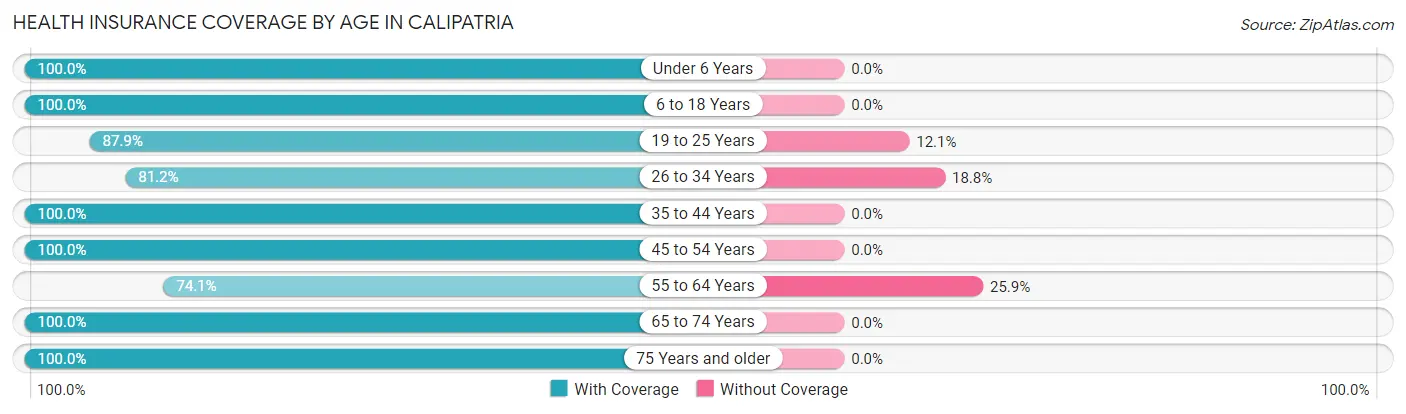
| Age Bracket | With Coverage | Without Coverage |
| Under 6 Years | 241 (100.0%) | 0 (0.0%) |
| 6 to 18 Years | 825 (100.0%) | 0 (0.0%) |
| 19 to 25 Years | 319 (87.9%) | 44 (12.1%) |
| 26 to 34 Years | 199 (81.2%) | 46 (18.8%) |
| 35 to 44 Years | 426 (100.0%) | 0 (0.0%) |
| 45 to 54 Years | 316 (100.0%) | 0 (0.0%) |
| 55 to 64 Years | 378 (74.1%) | 132 (25.9%) |
| 65 to 74 Years | 332 (100.0%) | 0 (0.0%) |
| 75 Years and older | 127 (100.0%) | 0 (0.0%) |
| Total | 3,163 (93.4%) | 222 (6.6%) |
Health Insurance Coverage by Citizenship Status in Calipatria

| Citizenship Status | With Coverage | Without Coverage |
| Native Born | 241 (100.0%) | 0 (0.0%) |
| Foreign Born, Citizen | 825 (100.0%) | 0 (0.0%) |
| Foreign Born, not a Citizen | 319 (87.9%) | 44 (12.1%) |
Health Insurance Coverage by Household Income in Calipatria
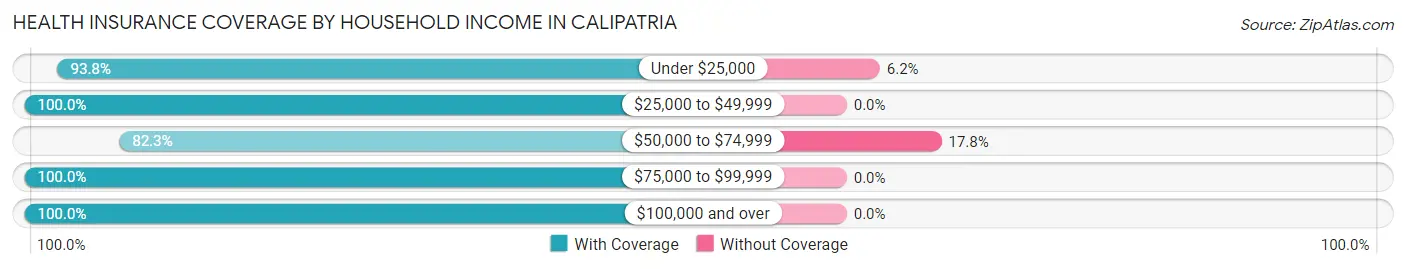
| Household Income | With Coverage | Without Coverage |
| Under $25,000 | 848 (93.8%) | 56 (6.2%) |
| $25,000 to $49,999 | 790 (100.0%) | 0 (0.0%) |
| $50,000 to $74,999 | 769 (82.3%) | 166 (17.7%) |
| $75,000 to $99,999 | 346 (100.0%) | 0 (0.0%) |
| $100,000 and over | 410 (100.0%) | 0 (0.0%) |
Public vs Private Health Insurance Coverage by Age in Calipatria
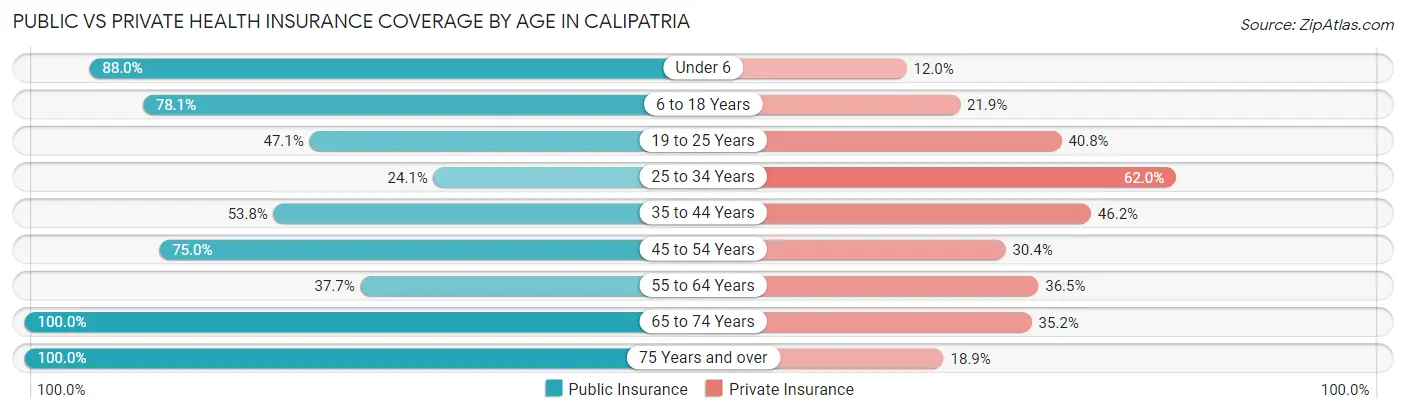
| Age Bracket | Public Insurance | Private Insurance |
| Under 6 | 212 (88.0%) | 29 (12.0%) |
| 6 to 18 Years | 644 (78.1%) | 181 (21.9%) |
| 19 to 25 Years | 171 (47.1%) | 148 (40.8%) |
| 25 to 34 Years | 59 (24.1%) | 152 (62.0%) |
| 35 to 44 Years | 229 (53.8%) | 197 (46.2%) |
| 45 to 54 Years | 237 (75.0%) | 96 (30.4%) |
| 55 to 64 Years | 192 (37.7%) | 186 (36.5%) |
| 65 to 74 Years | 332 (100.0%) | 117 (35.2%) |
| 75 Years and over | 127 (100.0%) | 24 (18.9%) |
| Total | 2,203 (65.1%) | 1,130 (33.4%) |
Disability Status by Sex by Age in Calipatria
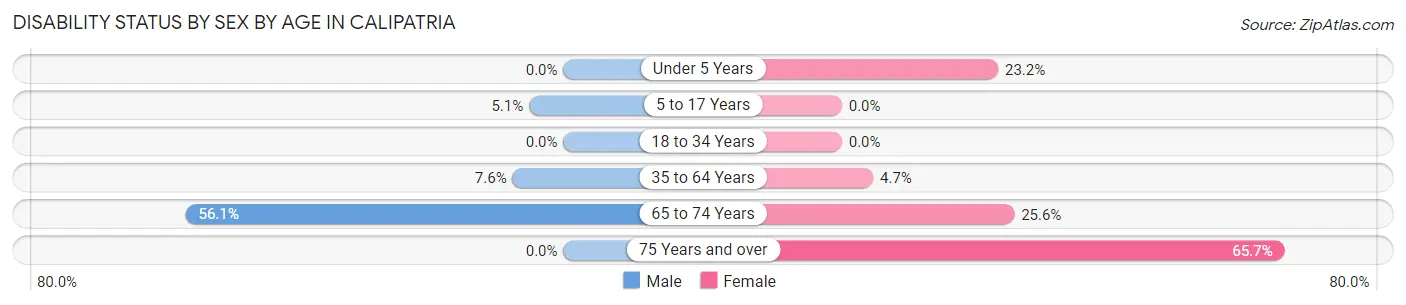
| Age Bracket | Male | Female |
| Under 5 Years | 0 (0.0%) | 29 (23.2%) |
| 5 to 17 Years | 22 (5.1%) | 0 (0.0%) |
| 18 to 34 Years | 0 (0.0%) | 0 (0.0%) |
| 35 to 64 Years | 41 (7.5%) | 33 (4.6%) |
| 65 to 74 Years | 46 (56.1%) | 64 (25.6%) |
| 75 Years and over | 0 (0.0%) | 71 (65.7%) |
Disability Class by Sex by Age in Calipatria
Disability Class: Hearing Difficulty
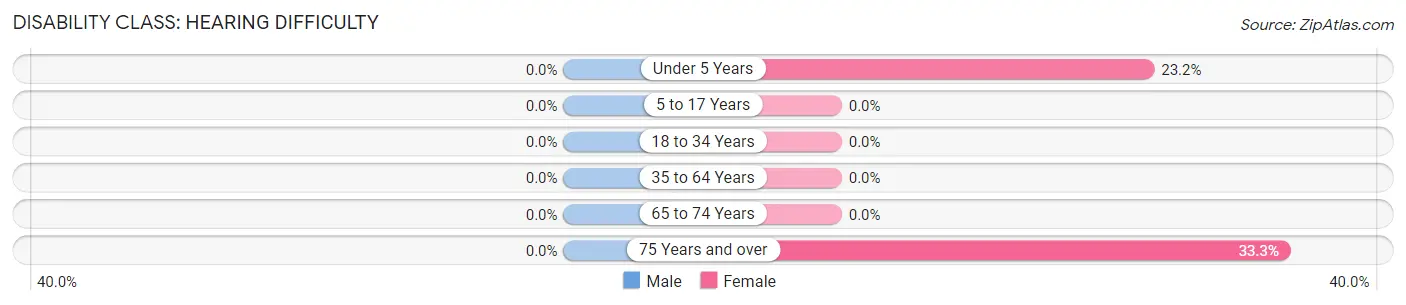
| Age Bracket | Male | Female |
| Under 5 Years | 0 (0.0%) | 29 (23.2%) |
| 5 to 17 Years | 0 (0.0%) | 0 (0.0%) |
| 18 to 34 Years | 0 (0.0%) | 0 (0.0%) |
| 35 to 64 Years | 0 (0.0%) | 0 (0.0%) |
| 65 to 74 Years | 0 (0.0%) | 0 (0.0%) |
| 75 Years and over | 0 (0.0%) | 36 (33.3%) |
Disability Class: Vision Difficulty
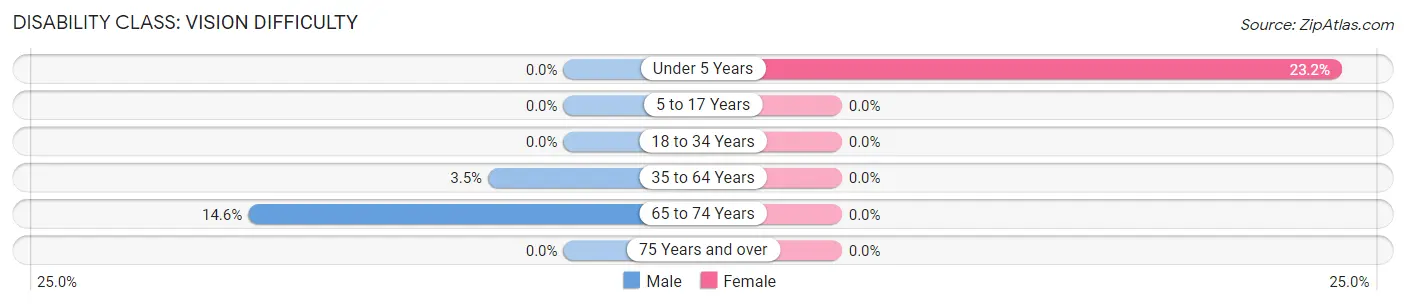
| Age Bracket | Male | Female |
| Under 5 Years | 0 (0.0%) | 29 (23.2%) |
| 5 to 17 Years | 0 (0.0%) | 0 (0.0%) |
| 18 to 34 Years | 0 (0.0%) | 0 (0.0%) |
| 35 to 64 Years | 19 (3.5%) | 0 (0.0%) |
| 65 to 74 Years | 12 (14.6%) | 0 (0.0%) |
| 75 Years and over | 0 (0.0%) | 0 (0.0%) |
Disability Class: Cognitive Difficulty
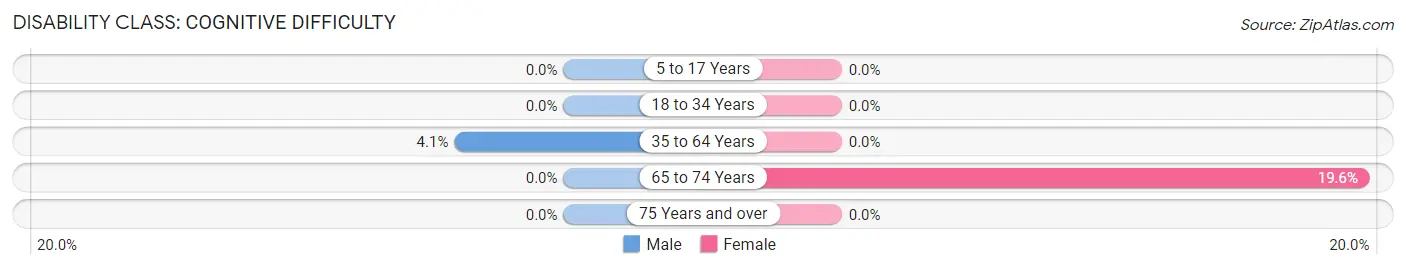
| Age Bracket | Male | Female |
| 5 to 17 Years | 0 (0.0%) | 0 (0.0%) |
| 18 to 34 Years | 0 (0.0%) | 0 (0.0%) |
| 35 to 64 Years | 22 (4.1%) | 0 (0.0%) |
| 65 to 74 Years | 0 (0.0%) | 49 (19.6%) |
| 75 Years and over | 0 (0.0%) | 0 (0.0%) |
Disability Class: Ambulatory Difficulty
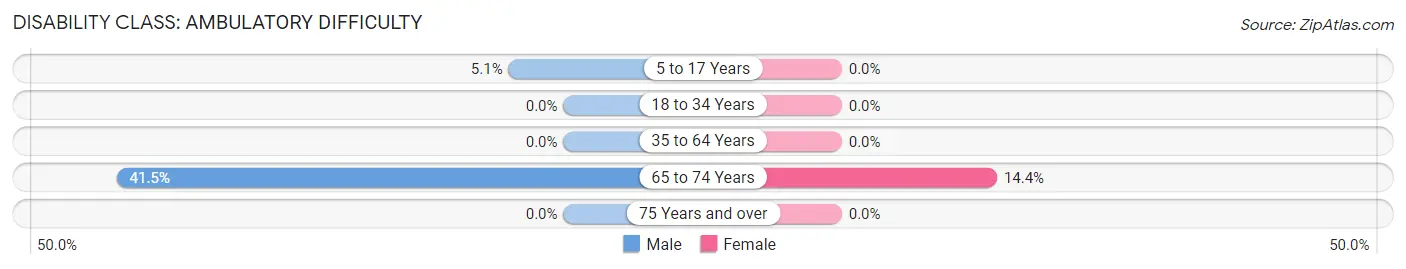
| Age Bracket | Male | Female |
| 5 to 17 Years | 22 (5.1%) | 0 (0.0%) |
| 18 to 34 Years | 0 (0.0%) | 0 (0.0%) |
| 35 to 64 Years | 0 (0.0%) | 0 (0.0%) |
| 65 to 74 Years | 34 (41.5%) | 36 (14.4%) |
| 75 Years and over | 0 (0.0%) | 0 (0.0%) |
Disability Class: Self-Care Difficulty
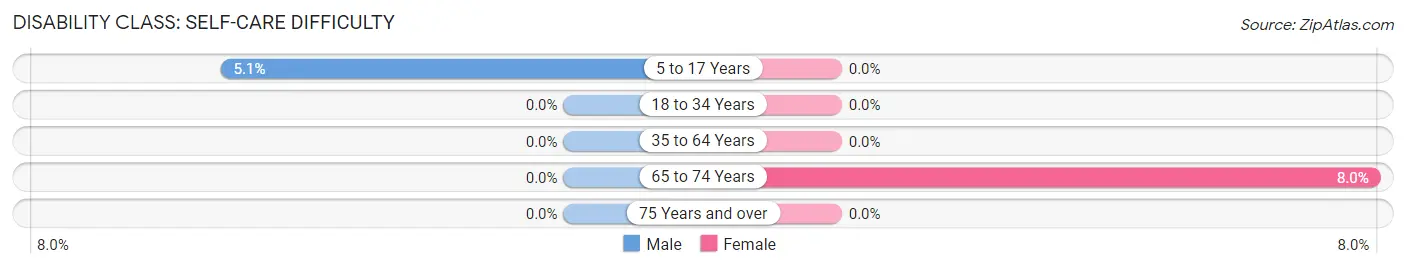
| Age Bracket | Male | Female |
| 5 to 17 Years | 22 (5.1%) | 0 (0.0%) |
| 18 to 34 Years | 0 (0.0%) | 0 (0.0%) |
| 35 to 64 Years | 0 (0.0%) | 0 (0.0%) |
| 65 to 74 Years | 0 (0.0%) | 20 (8.0%) |
| 75 Years and over | 0 (0.0%) | 0 (0.0%) |
Technology Access in Calipatria
Computing Device Access in Calipatria
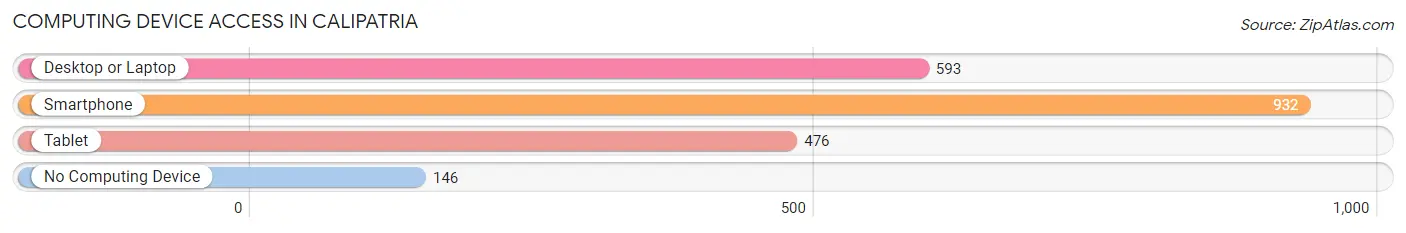
| Device Type | # Households | % Households |
| Desktop or Laptop | 593 | 55.0% |
| Smartphone | 932 | 86.5% |
| Tablet | 476 | 44.2% |
| No Computing Device | 146 | 13.5% |
| Total | 1,078 | 100.0% |
Internet Access in Calipatria
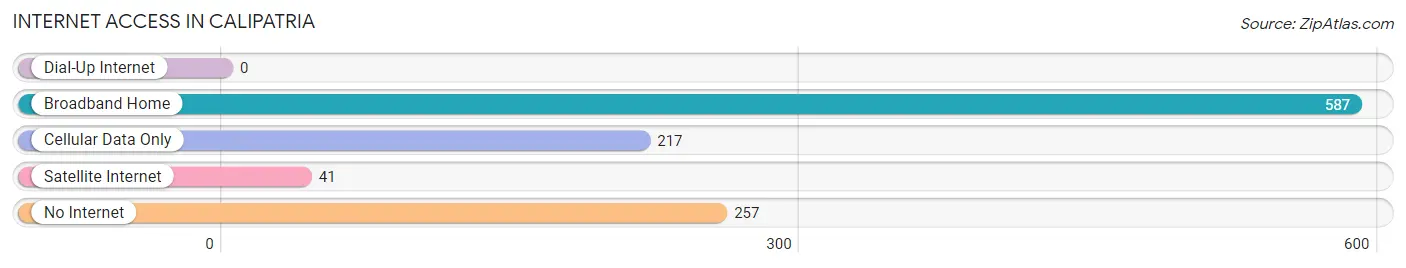
| Internet Type | # Households | % Households |
| Dial-Up Internet | 0 | 0.0% |
| Broadband Home | 587 | 54.4% |
| Cellular Data Only | 217 | 20.1% |
| Satellite Internet | 41 | 3.8% |
| No Internet | 257 | 23.8% |
| Total | 1,078 | 100.0% |
Calipatria Summary
Calipatria is a small city located in Imperial County, California, United States. It is situated in the Imperial Valley, about 30 miles north of the Mexican border. The city was incorporated in 1908 and has a population of approximately 7,000 people.
History
Calipatria was founded in 1908 by the Southern Pacific Railroad. The city was named after the Calipatria Land Company, which was formed by the railroad to develop the area. The city was originally a farming community, but it has since become a center for industry and commerce.
The city was the site of a major battle during the Mexican-American War in 1846. The Battle of Calipatria was fought between the Mexican forces and the United States Army. The U.S. forces were victorious and the city was annexed by the United States.
Geography
Calipatria is located in the Imperial Valley, which is a desert region in southeastern California. The city is situated on the banks of the New River, which is a tributary of the Colorado River. The city is surrounded by the Algodones Dunes, which are the largest sand dunes in the United States.
The climate in Calipatria is hot and dry, with temperatures reaching over 100 degrees Fahrenheit in the summer months. The city receives very little rainfall, with an average of only 4 inches per year.
Economy
Calipatria’s economy is largely based on agriculture and industry. The city is home to several large agricultural companies, including Imperial Valley Produce and Calipatria Farms. The city is also home to several manufacturing companies, including Imperial Valley Manufacturing and Imperial Valley Plastics.
The city is also home to several retail stores, including Walmart and Target. The city is also home to several restaurants, including El Pollo Loco and McDonald’s.
Demographics
As of the 2010 census, the population of Calipatria was 7,015. The racial makeup of the city was 57.3% White, 0.7% African American, 0.7% Native American, 0.3% Asian, 0.1% Pacific Islander, and 39.9% from other races. Hispanic or Latino of any race were 78.2% of the population.
The median household income in Calipatria was $30,938, and the median family income was $35,938. The per capita income for the city was $13,845. About 24.3% of families and 28.2% of the population were below the poverty line, including 37.2% of those under age 18 and 15.2% of those age 65 or over.
Calipatria is a small city with a rich history and a diverse population. The city is home to several large agricultural and manufacturing companies, as well as several retail stores and restaurants. The city has a hot and dry climate, and receives very little rainfall. The city has a median household income of $30,938 and a per capita income of $13,845. The population of Calipatria is largely Hispanic or Latino, with 78.2% of the population identifying as such.
Common Questions
What is Per Capita Income in Calipatria?
Per Capita income in Calipatria is $9,080.
What is the Median Family Income in Calipatria?
Median Family Income in Calipatria is $51,314.
What is the Median Household income in Calipatria?
Median Household Income in Calipatria is $43,095.
What is Income or Wage Gap in Calipatria?
Income or Wage Gap in Calipatria is 0.1%.
Women in Calipatria earn 99.9 cents for every dollar earned by a man.
What is Family Income Deficit in Calipatria?
Family Income Deficit in Calipatria is $13,552.
Families that are below poverty line in Calipatria earn $13,552 less on average than the poverty threshold level.
What is Inequality or Gini Index in Calipatria?
Inequality or Gini Index in Calipatria is 0.40.
What is the Total Population of Calipatria?
Total Population of Calipatria is 6,579.
What is the Total Male Population of Calipatria?
Total Male Population of Calipatria is 4,767.
What is the Total Female Population of Calipatria?
Total Female Population of Calipatria is 1,812.
What is the Ratio of Males per 100 Females in Calipatria?
There are 263.08 Males per 100 Females in Calipatria.
What is the Ratio of Females per 100 Males in Calipatria?
There are 38.01 Females per 100 Males in Calipatria.
What is the Median Population Age in Calipatria?
Median Population Age in Calipatria is 34.1 Years.
What is the Average Family Size in Calipatria
Average Family Size in Calipatria is 3.8 People.
What is the Average Household Size in Calipatria
Average Household Size in Calipatria is 3.1 People.
How Large is the Labor Force in Calipatria?
There are 1,285 People in the Labor Forcein in Calipatria.
What is the Percentage of People in the Labor Force in Calipatria?
22.9% of People are in the Labor Force in Calipatria.
What is the Unemployment Rate in Calipatria?
Unemployment Rate in Calipatria is 14.5%.