Cities with the Highest Poverty Level Among Children Under the Age of 5 in Massachusetts
RELATED REPORTS & OPTIONS
Highest Poverty | Child 0-5
Massachusetts
Compare Cities
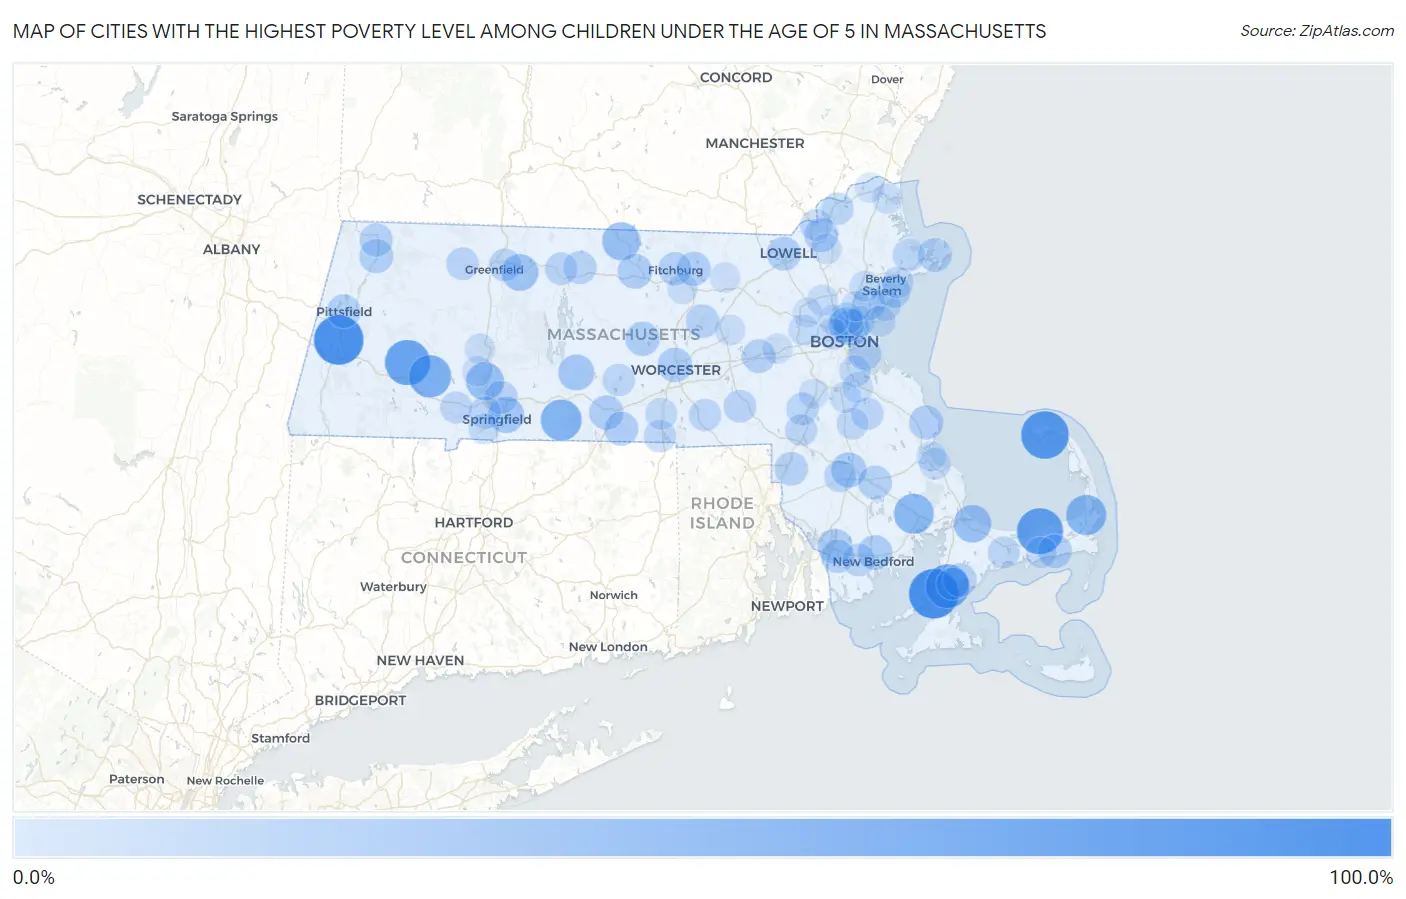
Map of Cities with the Highest Poverty Level Among Children Under the Age of 5 in Massachusetts
0.0%
100.0%
Cities with the Highest Poverty Level Among Children Under the Age of 5 in Massachusetts
| City | Child Poverty | vs State | vs National | |
| 1. | Lenox | 100.0% | 12.6%(+87.4)#1 | 18.1%(+81.9)#52 |
| 2. | Woods Hole | 100.0% | 12.6%(+87.4)#2 | 18.1%(+81.9)#171 |
| 3. | Provincetown | 90.6% | 12.6%(+78.0)#3 | 18.1%(+72.6)#1,011 |
| 4. | Dennis | 83.3% | 12.6%(+70.7)#4 | 18.1%(+65.3)#1,206 |
| 5. | Chester | 78.6% | 12.6%(+66.0)#5 | 18.1%(+60.5)#1,384 |
| 6. | Falmouth | 72.0% | 12.6%(+59.4)#6 | 18.1%(+53.9)#1,674 |
| 7. | Huntington | 64.0% | 12.6%(+51.4)#7 | 18.1%(+45.9)#2,187 |
| 8. | Monson Center | 57.5% | 12.6%(+44.9)#8 | 18.1%(+39.4)#2,729 |
| 9. | Orleans | 54.1% | 12.6%(+41.5)#9 | 18.1%(+36.0)#3,029 |
| 10. | West Wareham | 52.6% | 12.6%(+40.0)#10 | 18.1%(+34.6)#3,174 |
| 11. | Winchendon | 43.3% | 12.6%(+30.8)#11 | 18.1%(+25.3)#4,378 |
| 12. | Holyoke | 43.1% | 12.6%(+30.5)#12 | 18.1%(+25.1)#4,413 |
| 13. | Sandwich | 41.7% | 12.6%(+29.1)#13 | 18.1%(+23.6)#4,624 |
| 14. | Millers Falls | 37.7% | 12.6%(+25.1)#14 | 18.1%(+19.6)#5,273 |
| 15. | Chelsea | 33.7% | 12.6%(+21.2)#15 | 18.1%(+15.7)#5,992 |
| 16. | Ware | 33.6% | 12.6%(+21.0)#16 | 18.1%(+15.5)#6,021 |
| 17. | Springfield | 33.5% | 12.6%(+20.9)#17 | 18.1%(+15.4)#6,030 |
| 18. | Raynham Center | 29.6% | 12.6%(+17.0)#18 | 18.1%(+11.5)#6,924 |
| 19. | Everett | 28.6% | 12.6%(+16.1)#19 | 18.1%(+10.6)#7,119 |
| 20. | Fall River | 28.3% | 12.6%(+15.7)#20 | 18.1%(+10.2)#7,243 |
| 21. | Gardner | 28.0% | 12.6%(+15.4)#21 | 18.1%(+9.97)#7,298 |
| 22. | New Bedford | 26.9% | 12.6%(+14.3)#22 | 18.1%(+8.80)#7,601 |
| 23. | Worcester | 26.7% | 12.6%(+14.1)#23 | 18.1%(+8.60)#7,665 |
| 24. | Rutland | 25.7% | 12.6%(+13.1)#24 | 18.1%(+7.65)#7,867 |
| 25. | Fiskdale | 25.5% | 12.6%(+12.9)#25 | 18.1%(+7.47)#7,912 |
| 26. | Marshfield | 25.0% | 12.6%(+12.4)#26 | 18.1%(+6.94)#8,002 |
| 27. | Lunenburg | 24.3% | 12.6%(+11.7)#27 | 18.1%(+6.26)#8,261 |
| 28. | Southbridge Town | 24.3% | 12.6%(+11.7)#28 | 18.1%(+6.26)#8,264 |
| 29. | Lowell | 24.1% | 12.6%(+11.5)#29 | 18.1%(+6.06)#8,309 |
| 30. | Adams | 24.0% | 12.6%(+11.4)#30 | 18.1%(+5.95)#8,343 |
| 31. | Lawrence | 23.9% | 12.6%(+11.3)#31 | 18.1%(+5.87)#8,370 |
| 32. | Middleborough Center | 23.4% | 12.6%(+10.8)#32 | 18.1%(+5.32)#8,519 |
| 33. | Gloucester | 23.2% | 12.6%(+10.6)#33 | 18.1%(+5.17)#8,551 |
| 34. | Pittsfield | 23.0% | 12.6%(+10.5)#34 | 18.1%(+4.98)#8,638 |
| 35. | Dennis Port | 22.9% | 12.6%(+10.3)#35 | 18.1%(+4.79)#8,673 |
| 36. | Greenfield | 22.6% | 12.6%(+10.0)#36 | 18.1%(+4.55)#8,734 |
| 37. | East Falmouth | 22.4% | 12.6%(+9.84)#37 | 18.1%(+4.36)#8,796 |
| 38. | Framingham | 21.9% | 12.6%(+9.33)#38 | 18.1%(+3.85)#8,954 |
| 39. | Salem | 21.9% | 12.6%(+9.32)#39 | 18.1%(+3.84)#8,958 |
| 40. | Attleboro | 21.6% | 12.6%(+9.06)#40 | 18.1%(+3.58)#9,049 |
| 41. | Clinton | 21.5% | 12.6%(+8.95)#41 | 18.1%(+3.47)#9,084 |
| 42. | North Westport | 21.5% | 12.6%(+8.91)#42 | 18.1%(+3.44)#9,094 |
| 43. | Fitchburg | 20.8% | 12.6%(+8.18)#43 | 18.1%(+2.70)#9,330 |
| 44. | North Adams | 20.8% | 12.6%(+8.18)#44 | 18.1%(+2.70)#9,331 |
| 45. | Athol | 20.3% | 12.6%(+7.75)#45 | 18.1%(+2.28)#9,459 |
| 46. | Boston | 19.5% | 12.6%(+6.92)#46 | 18.1%(+1.45)#9,728 |
| 47. | Chicopee | 19.4% | 12.6%(+6.77)#47 | 18.1%(+1.29)#9,783 |
| 48. | Lynn | 19.0% | 12.6%(+6.45)#48 | 18.1%(+0.976)#9,888 |
| 49. | Turners Falls | 18.5% | 12.6%(+5.91)#49 | 18.1%(+0.437)#10,056 |
| 50. | Shelburne Falls | 18.4% | 12.6%(+5.78)#50 | 18.1%(+0.305)#10,094 |
| 51. | Smith Mills | 18.2% | 12.6%(+5.59)#51 | 18.1%(+0.119)#10,136 |
| 52. | Milford | 18.0% | 12.6%(+5.36)#52 | 18.1%(-0.113)#10,227 |
| 53. | Orange | 17.4% | 12.6%(+4.83)#53 | 18.1%(-0.647)#10,412 |
| 54. | Essex | 17.3% | 12.6%(+4.70)#54 | 18.1%(-0.779)#10,469 |
| 55. | Walpole | 16.9% | 12.6%(+4.34)#55 | 18.1%(-1.13)#10,564 |
| 56. | Malden | 16.9% | 12.6%(+4.32)#56 | 18.1%(-1.16)#10,570 |
| 57. | Haverhill | 16.5% | 12.6%(+3.93)#57 | 18.1%(-1.54)#10,731 |
| 58. | East Brookfield | 16.4% | 12.6%(+3.81)#58 | 18.1%(-1.67)#10,776 |
| 59. | West Springfield Town | 16.1% | 12.6%(+3.55)#59 | 18.1%(-1.92)#10,847 |
| 60. | Abington | 16.0% | 12.6%(+3.44)#60 | 18.1%(-2.04)#10,886 |
| 61. | Teaticket | 16.0% | 12.6%(+3.41)#61 | 18.1%(-2.06)#10,893 |
| 62. | Whitinsville | 16.0% | 12.6%(+3.38)#62 | 18.1%(-2.10)#10,915 |
| 63. | Taunton | 15.4% | 12.6%(+2.79)#63 | 18.1%(-2.69)#11,131 |
| 64. | Webster | 15.4% | 12.6%(+2.77)#64 | 18.1%(-2.70)#11,135 |
| 65. | Methuen Town | 15.3% | 12.6%(+2.75)#65 | 18.1%(-2.72)#11,137 |
| 66. | Westfield | 15.0% | 12.6%(+2.41)#66 | 18.1%(-3.07)#11,249 |
| 67. | Swampscott | 14.9% | 12.6%(+2.35)#67 | 18.1%(-3.13)#11,271 |
| 68. | Barnstable Town | 14.9% | 12.6%(+2.26)#68 | 18.1%(-3.21)#11,296 |
| 69. | Foxborough | 14.5% | 12.6%(+1.91)#69 | 18.1%(-3.57)#11,418 |
| 70. | Oxford | 13.8% | 12.6%(+1.21)#70 | 18.1%(-4.27)#11,695 |
| 71. | Beverly | 13.5% | 12.6%(+0.901)#71 | 18.1%(-4.58)#11,814 |
| 72. | Plymouth | 13.5% | 12.6%(+0.885)#72 | 18.1%(-4.59)#11,821 |
| 73. | Quincy | 13.2% | 12.6%(+0.653)#73 | 18.1%(-4.82)#11,908 |
| 74. | Brockton | 13.1% | 12.6%(+0.492)#74 | 18.1%(-4.98)#11,965 |
| 75. | South Yarmouth | 11.4% | 12.6%(-1.21)#75 | 18.1%(-6.69)#12,614 |
| 76. | Nahant | 11.0% | 12.6%(-1.58)#76 | 18.1%(-7.05)#12,788 |
| 77. | Cambridge | 10.7% | 12.6%(-1.93)#77 | 18.1%(-7.40)#12,906 |
| 78. | Randolph Town | 10.2% | 12.6%(-2.39)#78 | 18.1%(-7.87)#13,096 |
| 79. | Peabody | 10.1% | 12.6%(-2.48)#79 | 18.1%(-7.96)#13,126 |
| 80. | Waltham | 10.0% | 12.6%(-2.62)#80 | 18.1%(-8.10)#13,213 |
| 81. | Agawam Town | 9.8% | 12.6%(-2.77)#81 | 18.1%(-8.25)#13,248 |
| 82. | Braintree Town | 9.3% | 12.6%(-3.29)#82 | 18.1%(-8.77)#13,443 |
| 83. | Revere | 9.1% | 12.6%(-3.53)#83 | 18.1%(-9.01)#13,571 |
| 84. | Woburn | 9.0% | 12.6%(-3.63)#84 | 18.1%(-9.10)#13,598 |
| 85. | Medford | 8.8% | 12.6%(-3.80)#85 | 18.1%(-9.27)#13,663 |
| 86. | Leominster | 8.7% | 12.6%(-3.89)#86 | 18.1%(-9.37)#13,712 |
| 87. | Hudson | 8.0% | 12.6%(-4.60)#87 | 18.1%(-10.1)#14,005 |
| 88. | Northampton | 8.0% | 12.6%(-4.62)#88 | 18.1%(-10.1)#14,016 |
| 89. | Ayer | 7.8% | 12.6%(-4.77)#89 | 18.1%(-10.2)#14,056 |
| 90. | Easthampton Town | 7.8% | 12.6%(-4.77)#90 | 18.1%(-10.2)#14,057 |
| 91. | Andover | 7.7% | 12.6%(-4.92)#91 | 18.1%(-10.4)#14,135 |
| 92. | Cochituate | 7.6% | 12.6%(-5.00)#92 | 18.1%(-10.5)#14,170 |
| 93. | North Attleborough | 7.3% | 12.6%(-5.31)#93 | 18.1%(-10.8)#14,284 |
| 94. | Norwood | 6.7% | 12.6%(-5.91)#94 | 18.1%(-11.4)#14,551 |
| 95. | Newburyport | 6.6% | 12.6%(-5.98)#95 | 18.1%(-11.5)#14,592 |
| 96. | Saugus | 6.3% | 12.6%(-6.29)#96 | 18.1%(-11.8)#14,707 |
| 97. | North Plymouth | 6.3% | 12.6%(-6.31)#97 | 18.1%(-11.8)#14,711 |
| 98. | Amesbury Town | 6.0% | 12.6%(-6.55)#98 | 18.1%(-12.0)#14,833 |
| 99. | Lexington | 5.9% | 12.6%(-6.73)#99 | 18.1%(-12.2)#14,904 |
| 100. | Amherst | 5.5% | 12.6%(-7.08)#100 | 18.1%(-12.6)#15,040 |
Common Questions
What are the Top 10 Cities with the Highest Poverty Level Among Children Under the Age of 5 in Massachusetts?
Top 10 Cities with the Highest Poverty Level Among Children Under the Age of 5 in Massachusetts are:
#1
100.0%
#2
100.0%
#3
90.6%
#4
83.3%
#5
78.6%
#6
72.0%
#7
64.0%
#8
57.5%
#9
54.1%
#10
52.6%
What city has the Highest Poverty Level Among Children Under the Age of 5 in Massachusetts?
Lenox has the Highest Poverty Level Among Children Under the Age of 5 in Massachusetts with 100.0%.
What is the Poverty Level Among Children Under the Age of 5 in the State of Massachusetts?
Poverty Level Among Children Under the Age of 5 in Massachusetts is 12.6%.
What is the Poverty Level Among Children Under the Age of 5 in the United States?
Poverty Level Among Children Under the Age of 5 in the United States is 18.1%.