Cities with the Highest Poverty Level Among Children Under the Age of 5 in North Dakota
RELATED REPORTS & OPTIONS
Highest Poverty | Child 0-5
North Dakota
Compare Cities
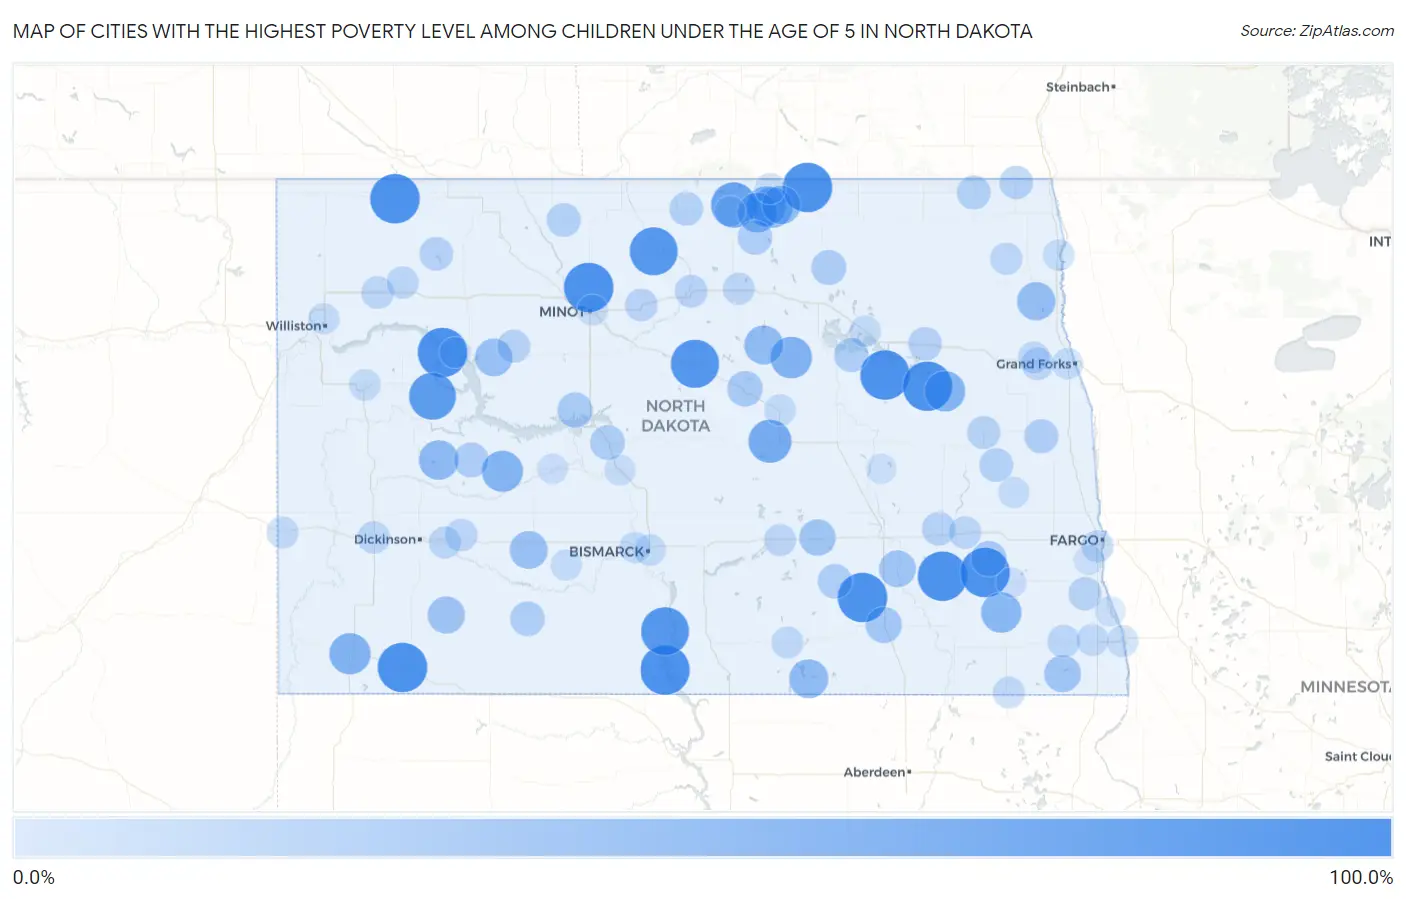
Map of Cities with the Highest Poverty Level Among Children Under the Age of 5 in North Dakota
0.0%
100.0%
Cities with the Highest Poverty Level Among Children Under the Age of 5 in North Dakota
| City | Child Poverty | vs State | vs National | |
| 1. | Four Bears Village | 100.0% | 13.1%(+86.9)#1 | 18.1%(+81.9)#498 |
| 2. | Litchville | 100.0% | 13.1%(+86.9)#2 | 18.1%(+81.9)#654 |
| 3. | Fort Yates | 100.0% | 13.1%(+86.9)#3 | 18.1%(+81.9)#667 |
| 4. | Noonan | 100.0% | 13.1%(+86.9)#5 | 18.1%(+81.9)#674 |
| 5. | Ruthville | 100.0% | 13.1%(+86.9)#6 | 18.1%(+81.9)#675 |
| 6. | Warwick | 100.0% | 13.1%(+86.9)#7 | 18.1%(+81.9)#763 |
| 7. | Reeder | 100.0% | 13.1%(+86.9)#8 | 18.1%(+81.9)#798 |
| 8. | Pekin | 100.0% | 13.1%(+86.9)#9 | 18.1%(+81.9)#830 |
| 9. | Nome | 100.0% | 13.1%(+86.9)#10 | 18.1%(+81.9)#864 |
| 10. | Jud | 100.0% | 13.1%(+86.9)#11 | 18.1%(+81.9)#872 |
| 11. | Hansboro | 100.0% | 13.1%(+86.9)#12 | 18.1%(+81.9)#904 |
| 12. | Drake | 93.8% | 13.1%(+80.6)#13 | 18.1%(+75.7)#954 |
| 13. | Cannon Ball | 92.8% | 13.1%(+79.7)#14 | 18.1%(+74.7)#970 |
| 14. | Upham | 92.3% | 13.1%(+79.2)#15 | 18.1%(+74.2)#983 |
| 15. | Mandaree | 87.3% | 13.1%(+74.2)#16 | 18.1%(+69.3)#1,090 |
| 16. | East Dunseith | 79.6% | 13.1%(+66.5)#17 | 18.1%(+61.5)#1,362 |
| 17. | Bowdon | 69.2% | 13.1%(+56.1)#18 | 18.1%(+51.2)#1,836 |
| 18. | Maddock | 62.5% | 13.1%(+49.4)#19 | 18.1%(+44.4)#2,304 |
| 19. | Bowman | 60.5% | 13.1%(+47.4)#20 | 18.1%(+42.5)#2,468 |
| 20. | Golden Valley | 60.0% | 13.1%(+46.9)#21 | 18.1%(+41.9)#2,533 |
| 21. | Mcville | 57.1% | 13.1%(+44.0)#22 | 18.1%(+39.1)#2,765 |
| 22. | Lisbon | 56.5% | 13.1%(+43.4)#23 | 18.1%(+38.4)#2,825 |
| 23. | Green Acres | 56.0% | 13.1%(+42.9)#24 | 18.1%(+37.9)#2,862 |
| 24. | Belcourt | 54.9% | 13.1%(+41.8)#25 | 18.1%(+36.8)#2,975 |
| 25. | Shell Valley | 54.6% | 13.1%(+41.5)#26 | 18.1%(+36.6)#2,994 |
| 26. | Dunn Center | 52.8% | 13.1%(+39.7)#27 | 18.1%(+34.8)#3,161 |
| 27. | Ashley | 50.0% | 13.1%(+36.9)#28 | 18.1%(+31.9)#3,439 |
| 28. | Esmond | 50.0% | 13.1%(+36.9)#29 | 18.1%(+31.9)#3,562 |
| 29. | Rolla | 48.0% | 13.1%(+34.9)#30 | 18.1%(+29.9)#3,756 |
| 30. | Minto | 47.1% | 13.1%(+34.0)#31 | 18.1%(+29.0)#3,866 |
| 31. | Glen Ullin | 44.9% | 13.1%(+31.8)#32 | 18.1%(+26.8)#4,161 |
| 32. | Parshall | 43.9% | 13.1%(+30.8)#33 | 18.1%(+25.9)#4,301 |
| 33. | Regent | 41.7% | 13.1%(+28.6)#34 | 18.1%(+23.6)#4,640 |
| 34. | Lidgerwood | 40.0% | 13.1%(+26.9)#35 | 18.1%(+21.9)#4,868 |
| 35. | Montpelier | 40.0% | 13.1%(+26.9)#36 | 18.1%(+21.9)#4,922 |
| 36. | Medina | 38.5% | 13.1%(+25.4)#37 | 18.1%(+20.4)#5,157 |
| 37. | Edgeley | 37.1% | 13.1%(+24.0)#38 | 18.1%(+19.0)#5,381 |
| 38. | Harvey | 33.7% | 13.1%(+20.6)#39 | 18.1%(+15.6)#6,002 |
| 39. | Fingal | 33.3% | 13.1%(+20.2)#40 | 18.1%(+15.3)#6,172 |
| 40. | Garrison | 32.5% | 13.1%(+19.4)#41 | 18.1%(+14.4)#6,302 |
| 41. | Cando | 31.1% | 13.1%(+18.0)#42 | 18.1%(+13.1)#6,556 |
| 42. | Halliday | 31.0% | 13.1%(+17.9)#43 | 18.1%(+13.0)#6,585 |
| 43. | Underwood | 30.0% | 13.1%(+16.9)#44 | 18.1%(+11.9)#6,798 |
| 44. | Elgin | 29.7% | 13.1%(+16.6)#45 | 18.1%(+11.7)#6,888 |
| 45. | Gackle | 29.6% | 13.1%(+16.5)#46 | 18.1%(+11.6)#6,910 |
| 46. | Rolette | 29.2% | 13.1%(+16.1)#47 | 18.1%(+11.1)#7,006 |
| 47. | Mayville | 28.3% | 13.1%(+15.2)#48 | 18.1%(+10.2)#7,244 |
| 48. | Fort Totten | 27.8% | 13.1%(+14.7)#49 | 18.1%(+9.76)#7,350 |
| 49. | Walhalla | 26.7% | 13.1%(+13.6)#50 | 18.1%(+8.60)#7,645 |
| 50. | Mohall | 26.7% | 13.1%(+13.6)#51 | 18.1%(+8.60)#7,650 |
| 51. | Hope | 25.9% | 13.1%(+12.8)#52 | 18.1%(+7.86)#7,823 |
| 52. | Bottineau | 25.5% | 13.1%(+12.4)#53 | 18.1%(+7.43)#7,924 |
| 53. | Lakota | 25.0% | 13.1%(+11.9)#54 | 18.1%(+6.94)#8,050 |
| 54. | Powers Lake | 25.0% | 13.1%(+11.9)#55 | 18.1%(+6.94)#8,089 |
| 55. | Sanborn | 25.0% | 13.1%(+11.9)#56 | 18.1%(+6.94)#8,115 |
| 56. | Neche | 24.1% | 13.1%(+11.0)#57 | 18.1%(+6.08)#8,308 |
| 57. | Walcott | 23.8% | 13.1%(+10.7)#58 | 18.1%(+5.75)#8,404 |
| 58. | Finley | 23.8% | 13.1%(+10.7)#59 | 18.1%(+5.75)#8,405 |
| 59. | Plaza | 23.1% | 13.1%(+9.98)#60 | 18.1%(+5.01)#8,633 |
| 60. | Trenton | 22.0% | 13.1%(+8.85)#61 | 18.1%(+3.89)#8,944 |
| 61. | Towner | 21.2% | 13.1%(+8.11)#62 | 18.1%(+3.15)#9,205 |
| 62. | Granville | 21.1% | 13.1%(+7.95)#63 | 18.1%(+2.99)#9,261 |
| 63. | Ray | 20.7% | 13.1%(+7.59)#64 | 18.1%(+2.63)#9,352 |
| 64. | Wyndmere | 20.7% | 13.1%(+7.59)#65 | 18.1%(+2.63)#9,354 |
| 65. | Belfield | 20.4% | 13.1%(+7.31)#66 | 18.1%(+2.35)#9,443 |
| 66. | Emerado | 20.0% | 13.1%(+6.90)#67 | 18.1%(+1.94)#9,567 |
| 67. | Taylor | 20.0% | 13.1%(+6.90)#68 | 18.1%(+1.94)#9,596 |
| 68. | Valley City | 19.9% | 13.1%(+6.84)#69 | 18.1%(+1.88)#9,613 |
| 69. | Tioga | 19.5% | 13.1%(+6.43)#70 | 18.1%(+1.46)#9,719 |
| 70. | Gladstone | 19.4% | 13.1%(+6.25)#71 | 18.1%(+1.29)#9,793 |
| 71. | Hoople | 18.6% | 13.1%(+5.50)#72 | 18.1%(+0.542)#10,018 |
| 72. | Fargo | 18.3% | 13.1%(+5.19)#73 | 18.1%(+0.228)#10,113 |
| 73. | Tappen | 18.2% | 13.1%(+5.08)#74 | 18.1%(+0.119)#10,171 |
| 74. | Rugby | 18.0% | 13.1%(+4.92)#75 | 18.1%(-0.045)#10,209 |
| 75. | Wishek | 17.8% | 13.1%(+4.68)#76 | 18.1%(-0.285)#10,291 |
| 76. | Mooreton | 17.6% | 13.1%(+4.55)#77 | 18.1%(-0.416)#10,353 |
| 77. | Grand Forks Afb | 17.3% | 13.1%(+4.19)#78 | 18.1%(-0.775)#10,465 |
| 78. | Beach | 17.0% | 13.1%(+3.90)#79 | 18.1%(-1.06)#10,543 |
| 79. | Havana | 16.7% | 13.1%(+3.57)#80 | 18.1%(-1.40)#10,701 |
| 80. | Fessenden | 16.2% | 13.1%(+3.11)#81 | 18.1%(-1.85)#10,828 |
| 81. | Watford City | 16.2% | 13.1%(+3.07)#82 | 18.1%(-1.90)#10,844 |
| 82. | Wahpeton | 16.0% | 13.1%(+2.89)#83 | 18.1%(-2.07)#10,908 |
| 83. | Bismarck | 15.7% | 13.1%(+2.56)#84 | 18.1%(-2.40)#11,003 |
| 84. | Drayton | 15.4% | 13.1%(+2.28)#85 | 18.1%(-2.68)#11,091 |
| 85. | Mandan | 15.2% | 13.1%(+2.09)#86 | 18.1%(-2.87)#11,176 |
| 86. | Devils Lake | 15.1% | 13.1%(+2.03)#87 | 18.1%(-2.93)#11,195 |
| 87. | Grand Forks | 14.6% | 13.1%(+1.52)#88 | 18.1%(-3.44)#11,376 |
| 88. | Williston | 14.6% | 13.1%(+1.48)#89 | 18.1%(-3.48)#11,383 |
| 89. | Page | 14.3% | 13.1%(+1.18)#90 | 18.1%(-3.78)#11,524 |
| 90. | Almont | 13.8% | 13.1%(+0.692)#91 | 18.1%(-4.27)#11,704 |
| 91. | New Town | 13.2% | 13.1%(+0.106)#92 | 18.1%(-4.86)#11,918 |
| 92. | Washburn | 13.2% | 13.1%(+0.106)#93 | 18.1%(-4.86)#11,919 |
| 93. | Minot | 12.7% | 13.1%(-0.451)#94 | 18.1%(-5.41)#12,122 |
| 94. | St John | 12.5% | 13.1%(-0.601)#95 | 18.1%(-5.56)#12,224 |
| 95. | Dunseith | 11.7% | 13.1%(-1.43)#96 | 18.1%(-6.40)#12,502 |
| 96. | Hazen | 11.0% | 13.1%(-2.12)#97 | 18.1%(-7.08)#12,795 |
| 97. | Enderlin | 10.4% | 13.1%(-2.65)#98 | 18.1%(-7.62)#13,004 |
| 98. | Kensal | 10.2% | 13.1%(-2.90)#99 | 18.1%(-7.86)#13,095 |
| 99. | Abercrombie | 10.0% | 13.1%(-3.10)#100 | 18.1%(-8.06)#13,201 |
| 100. | Horace | 9.6% | 13.1%(-3.50)#101 | 18.1%(-8.47)#13,323 |
Common Questions
What are the Top 10 Cities with the Highest Poverty Level Among Children Under the Age of 5 in North Dakota?
Top 10 Cities with the Highest Poverty Level Among Children Under the Age of 5 in North Dakota are:
#1
100.0%
#2
100.0%
#3
100.0%
#4
100.0%
#5
100.0%
#6
100.0%
#7
100.0%
#8
100.0%
#9
100.0%
#10
100.0%
What city has the Highest Poverty Level Among Children Under the Age of 5 in North Dakota?
Four Bears Village has the Highest Poverty Level Among Children Under the Age of 5 in North Dakota with 100.0%.
What is the Poverty Level Among Children Under the Age of 5 in the State of North Dakota?
Poverty Level Among Children Under the Age of 5 in North Dakota is 13.1%.
What is the Poverty Level Among Children Under the Age of 5 in the United States?
Poverty Level Among Children Under the Age of 5 in the United States is 18.1%.