Cities with the Highest Poverty Level Among Children Under the Age of 5 in Ohio
RELATED REPORTS & OPTIONS
Highest Poverty | Child 0-5
Ohio
Compare Cities
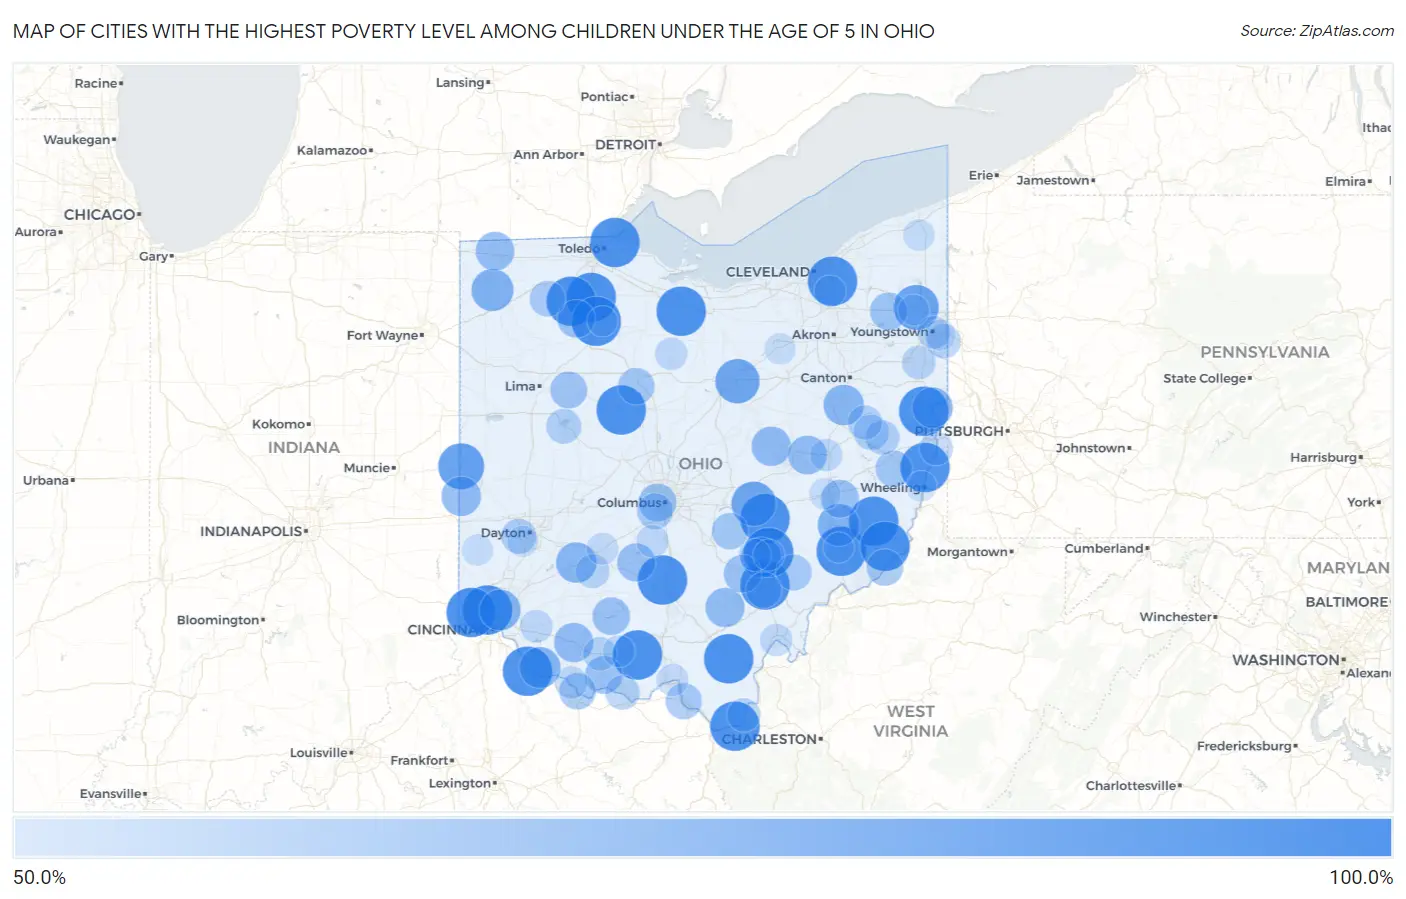
Map of Cities with the Highest Poverty Level Among Children Under the Age of 5 in Ohio
0.0%
100.0%
Cities with the Highest Poverty Level Among Children Under the Age of 5 in Ohio
| City | Child Poverty | vs State | vs National | |
| 1. | Skyline Acres | 100.0% | 20.7%(+79.3)#1 | 18.1%(+81.9)#137 |
| 2. | North Randall | 100.0% | 20.7%(+79.3)#2 | 18.1%(+81.9)#147 |
| 3. | Miamitown | 100.0% | 20.7%(+79.3)#3 | 18.1%(+81.9)#176 |
| 4. | Chauncey | 100.0% | 20.7%(+79.3)#4 | 18.1%(+81.9)#195 |
| 5. | Kingsville | 100.0% | 20.7%(+79.3)#5 | 18.1%(+81.9)#225 |
| 6. | La Rue | 100.0% | 20.7%(+79.3)#6 | 18.1%(+81.9)#237 |
| 7. | Proctorville | 100.0% | 20.7%(+79.3)#7 | 18.1%(+81.9)#293 |
| 8. | Miller | 100.0% | 20.7%(+79.3)#8 | 18.1%(+81.9)#295 |
| 9. | Madison Place | 100.0% | 20.7%(+79.3)#9 | 18.1%(+81.9)#301 |
| 10. | Portage | 100.0% | 20.7%(+79.3)#10 | 18.1%(+81.9)#343 |
| 11. | Andersonville | 100.0% | 20.7%(+79.3)#11 | 18.1%(+81.9)#350 |
| 12. | Irondale | 100.0% | 20.7%(+79.3)#12 | 18.1%(+81.9)#454 |
| 13. | Flat Rock | 100.0% | 20.7%(+79.3)#13 | 18.1%(+81.9)#456 |
| 14. | Milton Center | 100.0% | 20.7%(+79.3)#14 | 18.1%(+81.9)#596 |
| 15. | Macksburg | 100.0% | 20.7%(+79.3)#15 | 18.1%(+81.9)#649 |
| 16. | Rarden | 100.0% | 20.7%(+79.3)#16 | 18.1%(+81.9)#653 |
| 17. | East Fultonham | 100.0% | 20.7%(+79.3)#17 | 18.1%(+81.9)#669 |
| 18. | Harbor View | 100.0% | 20.7%(+79.3)#18 | 18.1%(+81.9)#706 |
| 19. | Bairdstown | 100.0% | 20.7%(+79.3)#19 | 18.1%(+81.9)#735 |
| 20. | Connorville | 100.0% | 20.7%(+79.3)#20 | 18.1%(+81.9)#744 |
| 21. | Neville | 100.0% | 20.7%(+79.3)#21 | 18.1%(+81.9)#820 |
| 22. | Miltonsburg | 100.0% | 20.7%(+79.3)#22 | 18.1%(+81.9)#848 |
| 23. | Rendville | 100.0% | 20.7%(+79.3)#23 | 18.1%(+81.9)#860 |
| 24. | Centerville Thurman | 100.0% | 20.7%(+79.3)#24 | 18.1%(+81.9)#862 |
| 25. | Antioch | 100.0% | 20.7%(+79.3)#25 | 18.1%(+81.9)#873 |
| 26. | Union City | 92.0% | 20.7%(+71.3)#26 | 18.1%(+73.9)#985 |
| 27. | Morgandale | 90.2% | 20.7%(+69.6)#27 | 18.1%(+72.2)#1,021 |
| 28. | Gratiot | 88.9% | 20.7%(+68.2)#28 | 18.1%(+70.8)#1,046 |
| 29. | Mifflin | 88.5% | 20.7%(+67.8)#29 | 18.1%(+70.4)#1,052 |
| 30. | Ney | 83.3% | 20.7%(+62.7)#30 | 18.1%(+65.3)#1,217 |
| 31. | Sarahsville | 83.3% | 20.7%(+62.7)#31 | 18.1%(+65.3)#1,234 |
| 32. | Felicity | 81.2% | 20.7%(+60.6)#32 | 18.1%(+63.2)#1,289 |
| 33. | Lockland | 81.2% | 20.7%(+60.5)#33 | 18.1%(+63.1)#1,294 |
| 34. | Wellsville | 80.0% | 20.7%(+59.3)#34 | 18.1%(+61.9)#1,314 |
| 35. | Port William | 80.0% | 20.7%(+59.3)#35 | 18.1%(+61.9)#1,340 |
| 36. | Hemlock | 80.0% | 20.7%(+59.3)#36 | 18.1%(+61.9)#1,343 |
| 37. | Zoar | 80.0% | 20.7%(+59.3)#37 | 18.1%(+61.9)#1,349 |
| 38. | Hollansburg | 77.8% | 20.7%(+57.1)#38 | 18.1%(+59.7)#1,414 |
| 39. | Nellie | 77.6% | 20.7%(+56.9)#39 | 18.1%(+59.5)#1,423 |
| 40. | Sardinia | 77.3% | 20.7%(+56.6)#40 | 18.1%(+59.2)#1,430 |
| 41. | Mcarthur | 77.1% | 20.7%(+56.4)#41 | 18.1%(+59.0)#1,445 |
| 42. | Oakwood Village Paulding County | 76.9% | 20.7%(+56.3)#42 | 18.1%(+58.9)#1,452 |
| 43. | West Lafayette | 76.6% | 20.7%(+56.0)#43 | 18.1%(+58.6)#1,464 |
| 44. | Kunkle | 76.0% | 20.7%(+55.3)#44 | 18.1%(+57.9)#1,486 |
| 45. | New Holland | 74.8% | 20.7%(+54.1)#45 | 18.1%(+56.7)#1,562 |
| 46. | Lore City | 74.6% | 20.7%(+53.9)#46 | 18.1%(+56.5)#1,566 |
| 47. | Valleyview | 74.3% | 20.7%(+53.6)#47 | 18.1%(+56.2)#1,573 |
| 48. | Hoytville | 74.3% | 20.7%(+53.6)#48 | 18.1%(+56.2)#1,574 |
| 49. | Haydenville | 73.9% | 20.7%(+53.2)#49 | 18.1%(+55.9)#1,589 |
| 50. | West Union | 73.8% | 20.7%(+53.2)#50 | 18.1%(+55.8)#1,594 |
| 51. | Highland Holiday | 73.8% | 20.7%(+53.2)#51 | 18.1%(+55.8)#1,595 |
| 52. | Windham | 73.5% | 20.7%(+52.8)#52 | 18.1%(+55.4)#1,612 |
| 53. | Alger | 72.4% | 20.7%(+51.7)#53 | 18.1%(+54.3)#1,659 |
| 54. | Aberdeen | 71.4% | 20.7%(+50.8)#54 | 18.1%(+53.4)#1,693 |
| 55. | Rushville | 71.4% | 20.7%(+50.8)#55 | 18.1%(+53.4)#1,704 |
| 56. | Harpster | 71.4% | 20.7%(+50.8)#56 | 18.1%(+53.4)#1,707 |
| 57. | New Athens | 71.4% | 20.7%(+50.8)#57 | 18.1%(+53.4)#1,708 |
| 58. | Matamoras | 71.2% | 20.7%(+50.6)#58 | 18.1%(+53.2)#1,725 |
| 59. | Franklin Furnace | 70.8% | 20.7%(+50.2)#59 | 18.1%(+52.8)#1,739 |
| 60. | Petersburg | 70.3% | 20.7%(+49.6)#60 | 18.1%(+52.2)#1,767 |
| 61. | Urbancrest | 70.0% | 20.7%(+49.3)#61 | 18.1%(+51.9)#1,775 |
| 62. | Chesterhill | 70.0% | 20.7%(+49.3)#62 | 18.1%(+51.9)#1,782 |
| 63. | The Plains | 69.5% | 20.7%(+48.8)#63 | 18.1%(+51.4)#1,812 |
| 64. | Malinta | 69.2% | 20.7%(+48.6)#64 | 18.1%(+51.2)#1,833 |
| 65. | Bowerston | 68.4% | 20.7%(+47.8)#65 | 18.1%(+50.4)#1,877 |
| 66. | Drexel | 68.2% | 20.7%(+47.5)#66 | 18.1%(+50.1)#1,888 |
| 67. | Russells Point | 68.1% | 20.7%(+47.4)#67 | 18.1%(+50.0)#1,893 |
| 68. | Lowellville | 66.7% | 20.7%(+46.0)#68 | 18.1%(+48.6)#1,970 |
| 69. | Scio | 66.7% | 20.7%(+46.0)#69 | 18.1%(+48.6)#1,985 |
| 70. | Sherrodsville | 66.7% | 20.7%(+46.0)#70 | 18.1%(+48.6)#2,000 |
| 71. | Rome Stout | 66.7% | 20.7%(+46.0)#71 | 18.1%(+48.6)#2,033 |
| 72. | Sabina | 65.8% | 20.7%(+45.1)#72 | 18.1%(+47.7)#2,064 |
| 73. | Seaman | 65.3% | 20.7%(+44.6)#73 | 18.1%(+47.2)#2,095 |
| 74. | Washingtonville | 65.2% | 20.7%(+44.5)#74 | 18.1%(+47.2)#2,099 |
| 75. | Athalia | 64.7% | 20.7%(+44.0)#75 | 18.1%(+46.6)#2,138 |
| 76. | Mingo Junction | 64.4% | 20.7%(+43.8)#76 | 18.1%(+46.4)#2,157 |
| 77. | Youngstown | 63.7% | 20.7%(+43.0)#77 | 18.1%(+45.6)#2,199 |
| 78. | Owensville | 63.0% | 20.7%(+42.4)#78 | 18.1%(+45.0)#2,254 |
| 79. | Ripley | 62.7% | 20.7%(+42.0)#79 | 18.1%(+44.6)#2,277 |
| 80. | Newcomerstown | 62.6% | 20.7%(+41.9)#80 | 18.1%(+44.5)#2,286 |
| 81. | Pomeroy | 62.5% | 20.7%(+41.8)#81 | 18.1%(+44.4)#2,291 |
| 82. | Darbyville | 62.5% | 20.7%(+41.8)#82 | 18.1%(+44.4)#2,309 |
| 83. | Chatfield | 62.5% | 20.7%(+41.8)#83 | 18.1%(+44.4)#2,310 |
| 84. | Shawnee | 61.9% | 20.7%(+41.2)#84 | 18.1%(+43.8)#2,348 |
| 85. | Bidwell | 61.5% | 20.7%(+40.9)#85 | 18.1%(+43.5)#2,378 |
| 86. | Peebles | 61.4% | 20.7%(+40.8)#86 | 18.1%(+43.4)#2,392 |
| 87. | Portsmouth | 61.3% | 20.7%(+40.6)#87 | 18.1%(+43.2)#2,403 |
| 88. | Jeffersonville | 61.3% | 20.7%(+40.6)#88 | 18.1%(+43.2)#2,404 |
| 89. | Walton Hills | 60.7% | 20.7%(+40.0)#89 | 18.1%(+42.7)#2,451 |
| 90. | Jefferson | 60.7% | 20.7%(+40.0)#90 | 18.1%(+42.6)#2,456 |
| 91. | Camden | 60.2% | 20.7%(+39.5)#91 | 18.1%(+42.1)#2,484 |
| 92. | Cambridge | 60.1% | 20.7%(+39.5)#92 | 18.1%(+42.1)#2,486 |
| 93. | Corning | 60.0% | 20.7%(+39.3)#93 | 18.1%(+41.9)#2,514 |
| 94. | Burbank | 60.0% | 20.7%(+39.3)#94 | 18.1%(+41.9)#2,526 |
| 95. | Moraine | 59.7% | 20.7%(+39.0)#95 | 18.1%(+41.6)#2,561 |
| 96. | Campbell | 59.6% | 20.7%(+38.9)#96 | 18.1%(+41.5)#2,565 |
| 97. | Warren | 59.1% | 20.7%(+38.4)#97 | 18.1%(+41.1)#2,593 |
| 98. | Bridgeport | 58.8% | 20.7%(+38.2)#98 | 18.1%(+40.8)#2,613 |
| 99. | Bloomdale | 58.0% | 20.7%(+37.3)#99 | 18.1%(+39.9)#2,688 |
| 100. | Dexter City | 57.9% | 20.7%(+37.2)#100 | 18.1%(+39.8)#2,696 |
Common Questions
What are the Top 10 Cities with the Highest Poverty Level Among Children Under the Age of 5 in Ohio?
Top 10 Cities with the Highest Poverty Level Among Children Under the Age of 5 in Ohio are:
#1
100.0%
#2
100.0%
#3
100.0%
#4
100.0%
#5
100.0%
#6
100.0%
#7
100.0%
#8
100.0%
#9
100.0%
#10
100.0%
What city has the Highest Poverty Level Among Children Under the Age of 5 in Ohio?
Skyline Acres has the Highest Poverty Level Among Children Under the Age of 5 in Ohio with 100.0%.
What is the Poverty Level Among Children Under the Age of 5 in the State of Ohio?
Poverty Level Among Children Under the Age of 5 in Ohio is 20.7%.
What is the Poverty Level Among Children Under the Age of 5 in the United States?
Poverty Level Among Children Under the Age of 5 in the United States is 18.1%.