Cities with the Highest Poverty Level Among Children Under the Age of 5 in Vermont

RELATED REPORTS & OPTIONS

Highest Poverty | Child 0-5
Population
Families and Households
Female Fertility
Female Fertility (Unmarried)
Race (Community Size)
Race (Percentage)
Ancestry (Community Size)
AfghanAfricanAlaska NativeAlaskan AthabascanAlbanianAleutAlsatianAmericanApacheArabArapahoArgentineanArmenianAssyrian / Chaldean / SyriacAustralianAustrianBahamianBangladeshiBarbadianBasqueBelgianBelizeanBermudanBhutaneseBlackfeetBolivianBrazilianBritishBritish West IndianBulgarianBurmeseCajunCambodianCanadianCape VerdeanCarpatho RusynCelticCentral AmericanCentral American IndianCherokeeCheyenneChickasawChileanChineseChippewaChoctawColombianColvilleComancheCosta RicanCreeCreekCroatianCrowCubanCypriotCzechCzechoslovakianDanishDelawareDominicanDutchDutch West IndianEastern EuropeanEcuadorianEgyptianEnglishEstonianEthiopianEuropeanFijianFilipinoFinnishFrenchFrench American IndianFrench CanadianGermanGerman RussianGhanaianGreekGuamanian / ChamorroGuatemalanGuyaneseHaitianHmongHonduranHopiHoumaHungarianIcelanderIndian (Asian)IndonesianInupiatIranianIraqiIrishIroquoisIsraeliItalianJamaicanJapaneseJordanianKenyanKiowaKoreanLaotianLatvianLebaneseLiberianLithuanianLumbeeLuxembourgerMacedonianMalaysianMalteseMarshalleseMenomineeMexicanMexican American IndianMongolianMoroccanNative HawaiianNavajoNepaleseNew ZealanderNicaraguanNigerianNorthern EuropeanNorwegianOkinawanOsageOttawaPaiutePakistaniPalestinianPanamanianParaguayanPennsylvania GermanPeruvianPimaPolishPortuguesePotawatomiPuebloPuerto RicanPuget Sound SalishRomanianRussianSalvadoranSamoanScandinavianScotch-IrishScottishSeminoleSenegaleseSerbianShoshoneSierra LeoneanSiouxSlavicSlovakSloveneSomaliSouth AfricanSouth AmericanSouth American IndianSoviet UnionSpaniardSpanishSpanish AmericanSpanish American IndianSri LankanSubsaharan AfricanSudaneseSwedishSwissSyrianTaiwaneseThaiTlingit-HaidaTohono O'OdhamTonganTrinidadian and TobagonianTsimshianTurkishU.S. Virgin IslanderUgandanUkrainianUruguayanUteVenezuelanVietnameseWelshWest IndianYakamaYaquiYugoslavianYumanYup'ikZimbabwean
Ancestry (Percentage)
AfghanAfricanAlaska NativeAlaskan AthabascanAlbanianAleutAlsatianAmericanApacheArabArapahoArgentineanArmenianAssyrian / Chaldean / SyriacAustralianAustrianBahamianBangladeshiBarbadianBasqueBelgianBelizeanBermudanBhutaneseBlackfeetBolivianBrazilianBritishBritish West IndianBulgarianBurmeseCajunCambodianCanadianCape VerdeanCarpatho RusynCelticCentral AmericanCentral American IndianCherokeeCheyenneChickasawChileanChineseChippewaChoctawColombianColvilleComancheCosta RicanCreeCreekCroatianCrowCubanCypriotCzechCzechoslovakianDanishDelawareDominicanDutchDutch West IndianEastern EuropeanEcuadorianEgyptianEnglishEstonianEthiopianEuropeanFijianFilipinoFinnishFrenchFrench American IndianFrench CanadianGermanGerman RussianGhanaianGreekGuamanian / ChamorroGuatemalanGuyaneseHaitianHmongHonduranHopiHoumaHungarianIcelanderIndian (Asian)IndonesianInupiatIranianIraqiIrishIroquoisIsraeliItalianJamaicanJapaneseJordanianKenyanKiowaKoreanLaotianLatvianLebaneseLiberianLithuanianLumbeeLuxembourgerMacedonianMalaysianMalteseMarshalleseMenomineeMexicanMexican American IndianMongolianMoroccanNative HawaiianNavajoNepaleseNew ZealanderNicaraguanNigerianNorthern EuropeanNorwegianOkinawanOsageOttawaPaiutePakistaniPalestinianPanamanianParaguayanPennsylvania GermanPeruvianPimaPolishPortuguesePotawatomiPuebloPuerto RicanPuget Sound SalishRomanianRussianSalvadoranSamoanScandinavianScotch-IrishScottishSeminoleSenegaleseSerbianShoshoneSierra LeoneanSiouxSlavicSlovakSloveneSomaliSouth AfricanSouth AmericanSouth American IndianSoviet UnionSpaniardSpanishSpanish AmericanSpanish American IndianSri LankanSubsaharan AfricanSudaneseSwedishSwissSyrianTaiwaneseThaiTlingit-HaidaTohono O'OdhamTonganTrinidadian and TobagonianTsimshianTurkishU.S. Virgin IslanderUgandanUkrainianUruguayanUteVenezuelanVietnameseWelshWest IndianYakamaYaquiYugoslavianYumanYup'ikZimbabwean
Immigrant Origin (Total)
AfghanistanAfricaAlbaniaArgentinaArmeniaAsiaAustraliaAustriaAzoresBahamasBangladeshBarbadosBelarusBelgiumBelizeBoliviaBosnia and HerzegovinaBrazilBulgariaBurma / MyanmarCabo VerdeCambodiaCameroonCanadaCaribbeanCentral AmericaChileChinaColombiaCongoCosta RicaCroatiaCubaCzechoslovakiaDenmarkDominicaDominican RepublicEastern AfricaEastern AsiaEastern EuropeEcuadorEgyptEl SalvadorEnglandEritreaEthiopiaEuropeFijiFranceGermanyGhanaGreeceGrenadaGuatemalaGuyanaHaitiHondurasHong KongHungaryIndiaIndonesiaIranIraqIrelandIsraelItalyJamaicaJapanJordanKazakhstanKenyaKoreaKuwaitLaosLatin AmericaLatviaLebanonLiberiaLithuaniaMalaysiaMexicoMicronesiaMiddle AfricaMoldovaMoroccoNepalNetherlandsNicaraguaNigeriaNorth MacedoniaNorthern AfricaNorthern EuropeNorwayOceaniaPakistanPanamaPeruPhilippinesPolandPortugalRomaniaRussiaSaudi ArabiaScotlandSenegalSerbiaSierra LeoneSingaporeSomaliaSouth AfricaSouth AmericaSouth Central AsiaSouth Eastern AsiaSouthern EuropeSpainSri LankaSt. Vincent and the GrenadinesSudanSwedenSwitzerlandSyriaTaiwanThailandTrinidad and TobagoTurkeyUgandaUkraineUruguayUzbekistanVenezuelaVietnamWest IndiesWestern AfricaWestern AsiaWestern EuropeYemenZaireZimbabwe
Immigrant Origin (Percentage)
AfghanistanAfricaAlbaniaArgentinaArmeniaAsiaAustraliaAustriaAzoresBahamasBangladeshBarbadosBelarusBelgiumBelizeBoliviaBosnia and HerzegovinaBrazilBulgariaBurma / MyanmarCabo VerdeCambodiaCameroonCanadaCaribbeanCentral AmericaChileChinaColombiaCongoCosta RicaCroatiaCubaCzechoslovakiaDenmarkDominicaDominican RepublicEastern AfricaEastern AsiaEastern EuropeEcuadorEgyptEl SalvadorEnglandEritreaEthiopiaEuropeFijiFranceGermanyGhanaGreeceGrenadaGuatemalaGuyanaHaitiHondurasHong KongHungaryIndiaIndonesiaIranIraqIrelandIsraelItalyJamaicaJapanJordanKazakhstanKenyaKoreaKuwaitLaosLatin AmericaLatviaLebanonLiberiaLithuaniaMalaysiaMexicoMicronesiaMiddle AfricaMoldovaMoroccoNepalNetherlandsNicaraguaNigeriaNorth MacedoniaNorthern AfricaNorthern EuropeNorwayOceaniaPakistanPanamaPeruPhilippinesPolandPortugalRomaniaRussiaSaudi ArabiaScotlandSenegalSerbiaSierra LeoneSingaporeSomaliaSouth AfricaSouth AmericaSouth Central AsiaSouth Eastern AsiaSouthern EuropeSpainSri LankaSt. Vincent and the GrenadinesSudanSwedenSwitzerlandSyriaTaiwanThailandTrinidad and TobagoTurkeyUgandaUkraineUruguayUzbekistanVenezuelaVietnamWest IndiesWestern AfricaWestern AsiaWestern EuropeYemenZaireZimbabwe
Income
Income (Families)
Income (Households)
Poverty
Poverty (Families)
Unemployment
Employment Occupations
Employment Industries
Employer Class
Commute Time
Commute Means
School Enrollment
Education by Degree Field
Occupancy
Finances
Physical Characteristics
Vermont
Compare Cities
Comparison Subject

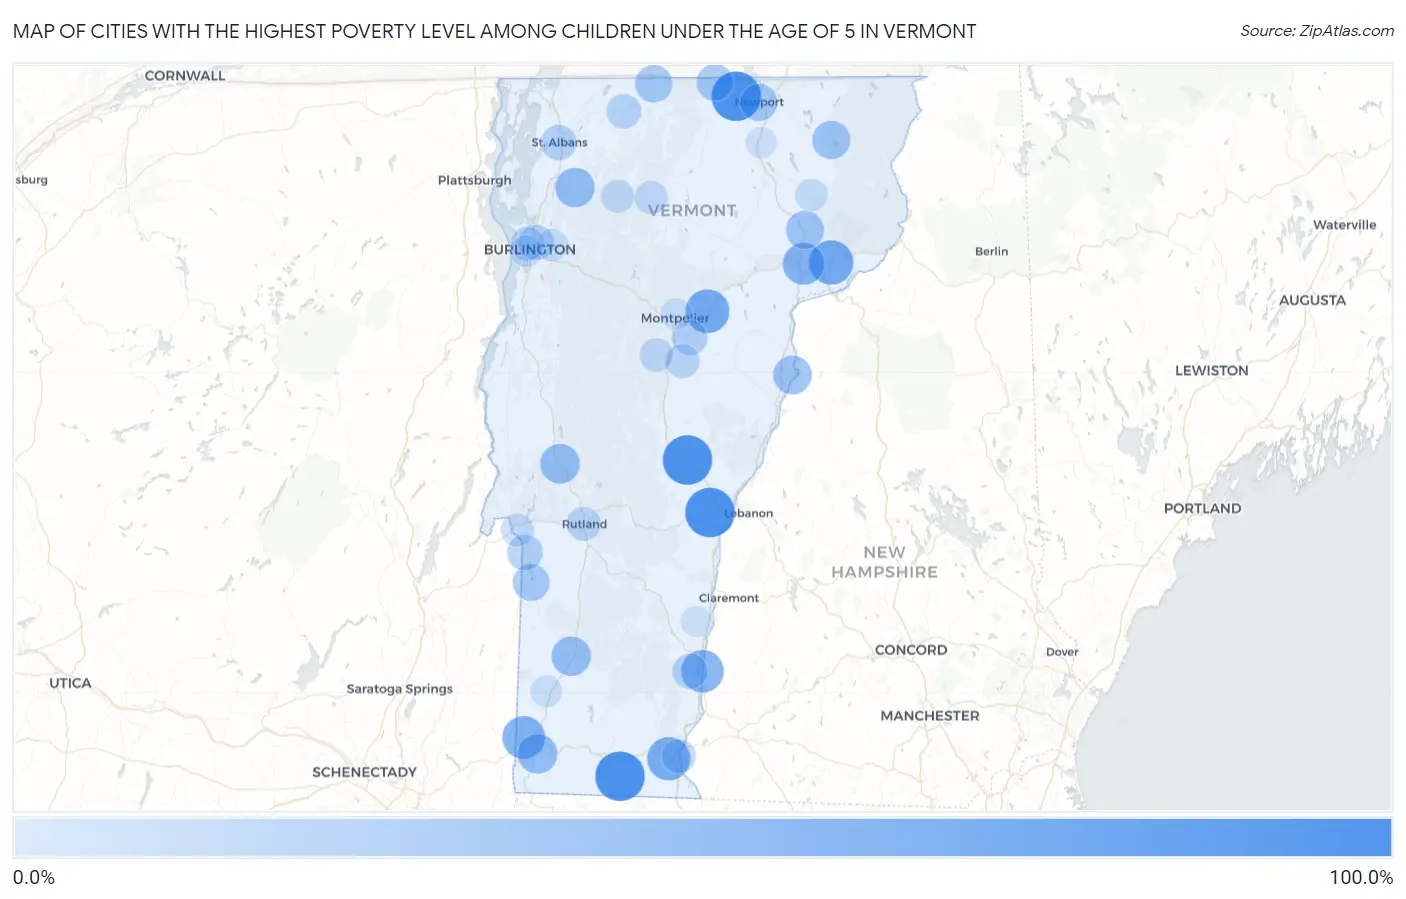
Map of Cities with the Highest Poverty Level Among Children Under the Age of 5 in Vermont

0.0%
100.0%
Cities with the Highest Poverty Level Among Children Under the Age of 5 in Vermont Map

Cities with the Highest Poverty Level Among Children Under the Age of 5 in Vermont

City Child Poverty vs State vs National
1.South Royalton100.0%11.5%(+88.5)#118.1%(+81.9)#330
2.Lunenburg100.0%11.5%(+88.5)#218.1%(+81.9)#410
3.Quechee100.0%11.5%(+88.5)#318.1%(+81.9)#411
4.Jacksonville100.0%11.5%(+88.5)#418.1%(+81.9)#525
5.Algiers100.0%11.5%(+88.5)#518.1%(+81.9)#540
6.Gilman100.0%11.5%(+88.5)#618.1%(+81.9)#554
7.Newport Center100.0%11.5%(+88.5)#718.1%(+81.9)#578
8.Sheffield75.0%11.5%(+63.5)#818.1%(+56.9)#1,544
9.Concord72.2%11.5%(+60.7)#918.1%(+54.2)#1,668
10.Plainfield69.7%11.5%(+58.2)#1018.1%(+51.6)#1,800
11.West Brattleboro66.4%11.5%(+54.9)#1118.1%(+48.3)#2,041
12.North Bennington64.5%11.5%(+53.0)#1218.1%(+46.5)#2,152
13.Bellows Falls62.7%11.5%(+51.2)#1318.1%(+44.7)#2,274
14.St Johnsbury60.0%11.5%(+48.5)#1418.1%(+41.9)#2,489
15.Bennington48.2%11.5%(+36.7)#1518.1%(+30.1)#3,731
16.Brandon48.0%11.5%(+36.5)#1618.1%(+29.9)#3,749
17.Fairfax47.7%11.5%(+36.2)#1718.1%(+29.7)#3,786
18.Manchester Center47.2%11.5%(+35.7)#1818.1%(+29.1)#3,849
19.Newbury42.9%11.5%(+31.3)#1918.1%(+24.8)#4,460
20.Lyndonville40.4%11.5%(+28.8)#2018.1%(+22.3)#4,814
21.Island Pond40.0%11.5%(+28.5)#2118.1%(+21.9)#4,864
22.Richford36.4%11.5%(+24.8)#2218.1%(+18.3)#5,501
23.Newport35.5%11.5%(+24.0)#2318.1%(+17.5)#5,676
24.North Troy33.3%11.5%(+21.8)#2418.1%(+15.3)#6,097
25.St. George33.3%11.5%(+21.8)#2518.1%(+15.3)#6,111
26.Wells33.3%11.5%(+21.8)#2618.1%(+15.3)#6,123
27.Pawlet33.3%11.5%(+21.8)#2718.1%(+15.3)#6,133
28.Poultney28.1%11.5%(+16.6)#2818.1%(+10.0)#7,289
29.St Albans25.3%11.5%(+13.8)#2918.1%(+7.26)#7,964
30.Saxtons River25.3%11.5%(+13.8)#3018.1%(+7.25)#7,967
31.Barre25.1%11.5%(+13.6)#3118.1%(+7.02)#7,995
32.Winooski24.8%11.5%(+13.3)#3218.1%(+6.78)#8,140
33.Enosburg Falls23.2%11.5%(+11.7)#3318.1%(+5.13)#8,569
34.Williamstown20.0%11.5%(+8.48)#3418.1%(+1.94)#9,531
35.Brattleboro19.7%11.5%(+8.14)#3518.1%(+1.60)#9,680
36.Rutland19.6%11.5%(+8.04)#3618.1%(+1.50)#9,708
37.Burlington18.5%11.5%(+6.96)#3718.1%(+0.415)#10,060
38.Castleton Four Corners17.9%11.5%(+6.34)#3818.1%(-0.206)#10,262
39.Northfield16.8%11.5%(+5.24)#3918.1%(-1.31)#10,610
40.Jeffersonville15.4%11.5%(+3.87)#4018.1%(-2.68)#11,097
41.Johnson14.5%11.5%(+3.03)#4118.1%(-3.52)#11,401
42.Fair Haven14.2%11.5%(+2.67)#4218.1%(-3.88)#11,559
43.Stamford12.5%11.5%(+0.983)#4318.1%(-5.56)#12,199
44.West Burke12.5%11.5%(+0.983)#4418.1%(-5.56)#12,232
45.Essex Junction10.5%11.5%(-0.975)#4518.1%(-7.52)#12,940
46.Arlington8.8%11.5%(-2.67)#4618.1%(-9.21)#13,643
47.South Burlington8.7%11.5%(-2.77)#4718.1%(-9.31)#13,677
48.Montpelier7.2%11.5%(-4.30)#4818.1%(-10.8)#14,315
49.Springfield5.9%11.5%(-5.61)#4918.1%(-12.2)#14,874
50.Orleans5.9%11.5%(-5.64)#5018.1%(-12.2)#14,888

Common Questions

What are the Top 10 Cities with the Highest Poverty Level Among Children Under the Age of 5 in Vermont?
Top 10 Cities with the Highest Poverty Level Among Children Under the Age of 5 in Vermont are:
What city has the Highest Poverty Level Among Children Under the Age of 5 in Vermont?
South Royalton has the Highest Poverty Level Among Children Under the Age of 5 in Vermont with 100.0%.
What is the Poverty Level Among Children Under the Age of 5 in the State of Vermont?
Poverty Level Among Children Under the Age of 5 in Vermont is 11.5%.
What is the Poverty Level Among Children Under the Age of 5 in the United States?
Poverty Level Among Children Under the Age of 5 in the United States is 18.1%.