Zip Codes with the Highest Poverty Level Among Children Under the Age of 5 in San Jose, CA

RELATED REPORTS & OPTIONS

Highest Poverty | Child 0-5
Population
Families and Households
Female Fertility
Female Fertility (Unmarried)
Race (Community Size)
Race (Percentage)
Ancestry (Community Size)
AfghanAfricanAlbanianAlsatianAmericanApacheArabArgentineanArmenianAssyrian / Chaldean / SyriacAustralianAustrianBangladeshiBarbadianBasqueBelgianBelizeanBhutaneseBlackfeetBolivianBrazilianBritishBritish West IndianBulgarianBurmeseCajunCambodianCanadianCelticCentral AmericanCentral American IndianCherokeeCheyenneChileanChippewaChoctawColombianComancheCosta RicanCreekCroatianCubanCzechCzechoslovakianDanishDelawareDominicanDutchEastern EuropeanEcuadorianEgyptianEnglishEstonianEthiopianEuropeanFilipinoFinnishFrenchFrench CanadianGermanGhanaianGreekGuamanian / ChamorroGuatemalanGuyaneseHaitianHonduranHungarianIcelanderIndian (Asian)IndonesianInupiatIranianIraqiIrishIroquoisIsraeliItalianJamaicanJapaneseJordanianKenyanKoreanLaotianLatvianLebaneseLithuanianLuxembourgerMacedonianMalaysianMalteseMexicanMexican American IndianMongolianMoroccanNative HawaiianNavajoNepaleseNew ZealanderNicaraguanNigerianNorthern EuropeanNorwegianOkinawanPaiutePakistaniPalestinianPanamanianParaguayanPennsylvania GermanPeruvianPimaPolishPortuguesePotawatomiPuebloPuerto RicanRomanianRussianSalvadoranSamoanScandinavianScotch-IrishScottishSerbianSierra LeoneanSiouxSlavicSlovakSloveneSouth AfricanSouth AmericanSouth American IndianSpaniardSpanishSpanish AmericanSpanish American IndianSri LankanSubsaharan AfricanSudaneseSwedishSwissSyrianTaiwaneseThaiTohono O'OdhamTonganTrinidadian and TobagonianTsimshianTurkishUkrainianVenezuelanVietnameseWelshWest IndianYaquiYugoslavianYumanYup'ik
Ancestry (Percentage)
AfghanAfricanAlbanianAlsatianAmericanApacheArabArgentineanArmenianAssyrian / Chaldean / SyriacAustralianAustrianBangladeshiBarbadianBasqueBelgianBelizeanBhutaneseBlackfeetBolivianBrazilianBritishBritish West IndianBulgarianBurmeseCajunCambodianCanadianCelticCentral AmericanCentral American IndianCherokeeCheyenneChileanChippewaChoctawColombianComancheCosta RicanCreekCroatianCubanCzechCzechoslovakianDanishDelawareDominicanDutchEastern EuropeanEcuadorianEgyptianEnglishEstonianEthiopianEuropeanFilipinoFinnishFrenchFrench CanadianGermanGhanaianGreekGuamanian / ChamorroGuatemalanGuyaneseHaitianHonduranHungarianIcelanderIndian (Asian)IndonesianInupiatIranianIraqiIrishIroquoisIsraeliItalianJamaicanJapaneseJordanianKenyanKoreanLaotianLatvianLebaneseLithuanianLuxembourgerMacedonianMalaysianMalteseMexicanMexican American IndianMongolianMoroccanNative HawaiianNavajoNepaleseNew ZealanderNicaraguanNigerianNorthern EuropeanNorwegianOkinawanPaiutePakistaniPalestinianPanamanianParaguayanPennsylvania GermanPeruvianPimaPolishPortuguesePotawatomiPuebloPuerto RicanRomanianRussianSalvadoranSamoanScandinavianScotch-IrishScottishSerbianSierra LeoneanSiouxSlavicSlovakSloveneSouth AfricanSouth AmericanSouth American IndianSpaniardSpanishSpanish AmericanSpanish American IndianSri LankanSubsaharan AfricanSudaneseSwedishSwissSyrianTaiwaneseThaiTohono O'OdhamTonganTrinidadian and TobagonianTsimshianTurkishUkrainianVenezuelanVietnameseWelshWest IndianYaquiYugoslavianYumanYup'ik
Immigrant Origin (Total)
AfghanistanAfricaArgentinaArmeniaAsiaAustraliaAustriaAzoresBangladeshBarbadosBelarusBelgiumBelizeBoliviaBosnia and HerzegovinaBrazilBulgariaBurma / MyanmarCambodiaCameroonCanadaCaribbeanCentral AmericaChileChinaColombiaCongoCosta RicaCroatiaCubaCzechoslovakiaDenmarkDominican RepublicEastern AfricaEastern AsiaEastern EuropeEcuadorEgyptEl SalvadorEnglandEritreaEthiopiaEuropeFijiFranceGermanyGhanaGreeceGuatemalaGuyanaHondurasHong KongHungaryIndiaIndonesiaIranIraqIrelandIsraelItalyJamaicaJapanJordanKazakhstanKenyaKoreaKuwaitLaosLatin AmericaLatviaLebanonLithuaniaMalaysiaMexicoMiddle AfricaMoldovaMoroccoNepalNetherlandsNicaraguaNigeriaNorth MacedoniaNorthern AfricaNorthern EuropeNorwayOceaniaPakistanPanamaPeruPhilippinesPolandPortugalRomaniaRussiaSaudi ArabiaScotlandSerbiaSierra LeoneSingaporeSomaliaSouth AfricaSouth AmericaSouth Central AsiaSouth Eastern AsiaSouthern EuropeSpainSri LankaSudanSwedenSwitzerlandSyriaTaiwanThailandTrinidad and TobagoTurkeyUgandaUkraineUzbekistanVenezuelaVietnamWestern AfricaWestern AsiaWestern EuropeZaireZimbabwe
Immigrant Origin (Percentage)
AfghanistanAfricaArgentinaArmeniaAsiaAustraliaAustriaAzoresBangladeshBarbadosBelarusBelgiumBelizeBoliviaBosnia and HerzegovinaBrazilBulgariaBurma / MyanmarCambodiaCameroonCanadaCaribbeanCentral AmericaChileChinaColombiaCongoCosta RicaCroatiaCubaCzechoslovakiaDenmarkDominican RepublicEastern AfricaEastern AsiaEastern EuropeEcuadorEgyptEl SalvadorEnglandEritreaEthiopiaEuropeFijiFranceGermanyGhanaGreeceGuatemalaGuyanaHondurasHong KongHungaryIndiaIndonesiaIranIraqIrelandIsraelItalyJamaicaJapanJordanKazakhstanKenyaKoreaKuwaitLaosLatin AmericaLatviaLebanonLithuaniaMalaysiaMexicoMiddle AfricaMoldovaMoroccoNepalNetherlandsNicaraguaNigeriaNorth MacedoniaNorthern AfricaNorthern EuropeNorwayOceaniaPakistanPanamaPeruPhilippinesPolandPortugalRomaniaRussiaSaudi ArabiaScotlandSerbiaSierra LeoneSingaporeSomaliaSouth AfricaSouth AmericaSouth Central AsiaSouth Eastern AsiaSouthern EuropeSpainSri LankaSudanSwedenSwitzerlandSyriaTaiwanThailandTrinidad and TobagoTurkeyUgandaUkraineUzbekistanVenezuelaVietnamWestern AfricaWestern AsiaWestern EuropeZaireZimbabwe
Income
Income (Families)
Income (Households)
Poverty
Poverty (Families)
Unemployment
Employment Occupations
Employment Industries
Employer Class
Commute Time
Commute Means
School Enrollment
Education by Degree Field
Occupancy
Finances
Physical Characteristics
San Jose
States
California Cities
AlhambraAnaheimAntiochApple ValleyArcadiaAuburnBakersfieldBerkeleyBreaBuena ParkBurbankCamarilloCanoga ParkCanyon CountryCarlsbadCarsonChicoChinoChula VistaCitrus HeightsClovisComptonConcordCoronaCosta MesaCovinaDaly CityDavisDesert Hot SpringsDowneyEl CajonEl MonteElk GroveEscondidoEurekaFairfieldFontanaFremontFresnoFullertonGarden GroveGardenaGlendaleGlendoraGrass ValleyHaywardHemetHesperiaHuntington BeachIndioInglewoodIrvineLa MesaLa PuenteLake ElsinoreLakewoodLancasterLivermoreLodiLompocLong BeachLos AngelesLos GatosMaderaMantecaMenifeeMercedMission ViejoModestoMonterey ParkMoreno ValleyMountain ViewMurrietaNapaNewport BeachNorth HollywoodNorthridgeNovatoOaklandOceansideOntarioOrangeOrovilleOxnardPalm DesertPalm SpringsPalmdalePalo AltoPasadenaPerrisPetalumaPleasantonPomonaPortervilleRancho CordovaRancho CucamongaReddingRedlandsRedondo BeachRedwood CityRichmondRiversideRosevilleSacramentoSalinasSan BernardinoSan DiegoSan FranciscoSan GabrielSan JacintoSan JoseSan LeandroSan Luis ObispoSan MarcosSan MateoSan PedroSan RafaelSanta AnaSanta BarbaraSanta ClaraSanta ClaritaSanta CruzSanta MariaSanta MonicaSanta RosaSherman OaksSimi ValleySpring ValleyStocktonSunnyvaleTemeculaThousand OaksTorranceTrabuco CanyonTracyTurlockTustinUplandVacavilleValenciaVallejoVan NuysVenturaVictorvilleVisaliaVistaWalnut CreekWest CovinaWest SacramentoWhittierWoodlandWoodland HillsYuba City
Compare Zip Codes
Comparison Subject

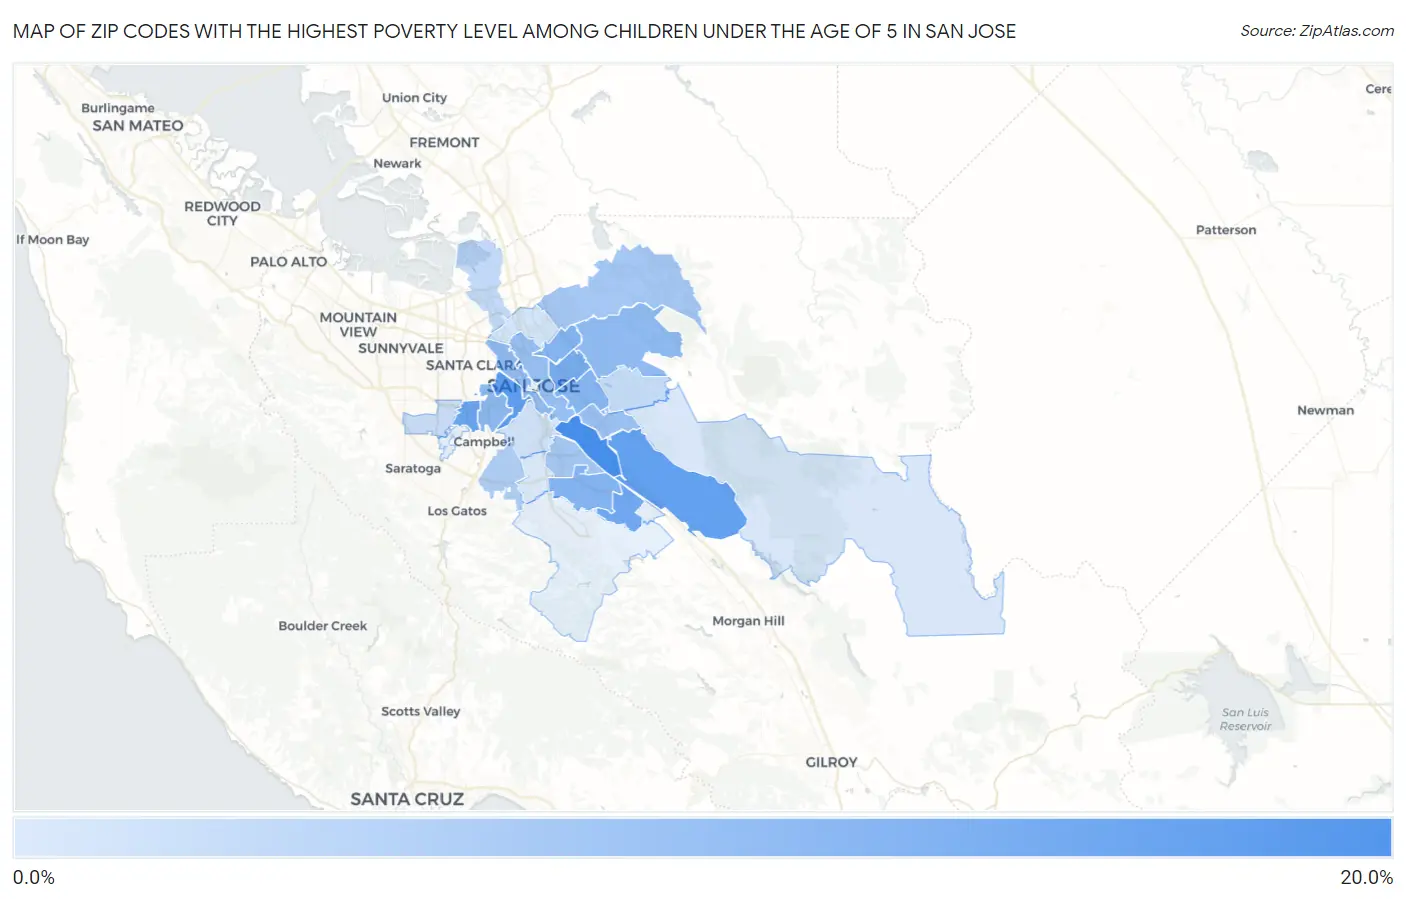
Map of Zip Codes with the Highest Poverty Level Among Children Under the Age of 5 in San Jose

0.0%
20.0%
Zip Codes with the Highest Poverty Level Among Children Under the Age of 5 in San Jose Map

Zip Codes with the Highest Poverty Level Among Children Under the Age of 5 in San Jose, CA

Zip Code Child Poverty vs State vs National
1.9511118.9%15.6%(+3.30)#47818.1%(+0.847)#10,540
2.9512615.7%15.6%(+0.040)#57418.1%(-2.41)#12,097
3.9513815.3%15.6%(-0.309)#58318.1%(-2.76)#12,291
4.9511713.9%15.6%(-1.69)#63418.1%(-4.14)#13,072
5.9511913.5%15.6%(-2.11)#65718.1%(-4.57)#13,325
6.9511612.7%15.6%(-2.92)#68818.1%(-5.37)#13,808
7.9512310.8%15.6%(-4.82)#74818.1%(-7.28)#14,956
8.9513310.7%15.6%(-4.93)#75218.1%(-7.39)#15,010
9.9512210.6%15.6%(-4.97)#75418.1%(-7.43)#15,034
10.951289.6%15.6%(-6.04)#79418.1%(-8.49)#15,657
11.951279.5%15.6%(-6.14)#80018.1%(-8.59)#15,750
12.951109.1%15.6%(-6.48)#81718.1%(-8.93)#15,965
13.951128.6%15.6%(-7.01)#84718.1%(-9.46)#16,337
14.951218.0%15.6%(-7.63)#88518.1%(-10.1)#16,767
15.951326.9%15.6%(-8.69)#93018.1%(-11.1)#17,433
16.951366.8%15.6%(-8.77)#93418.1%(-11.2)#17,503
17.951245.6%15.6%(-9.99)#98618.1%(-12.4)#18,337
18.951343.7%15.6%(-12.0)#1,09618.1%(-14.4)#19,746
19.951483.1%15.6%(-12.6)#1,12818.1%(-15.0)#20,129
20.951292.5%15.6%(-13.1)#1,14618.1%(-15.5)#20,481
21.951251.6%15.6%(-14.0)#1,18518.1%(-16.4)#21,054
22.951311.3%15.6%(-14.3)#1,19818.1%(-16.7)#21,231
23.951350.77%15.6%(-14.8)#1,22518.1%(-17.3)#21,509
24.951180.33%15.6%(-15.3)#1,23918.1%(-17.7)#21,654

Common Questions

What are the Top 10 Zip Codes with the Highest Poverty Level Among Children Under the Age of 5 in San Jose, CA?
Top 10 Zip Codes with the Highest Poverty Level Among Children Under the Age of 5 in San Jose, CA are:
#1
18.9%
#2
15.7%
#3
15.3%
#4
13.9%
#5
13.5%
#6
12.7%
#7
10.8%
#8
10.7%
#9
10.6%
#10
9.6%
What zip code has the Highest Poverty Level Among Children Under the Age of 5 in San Jose, CA?
95111 has the Highest Poverty Level Among Children Under the Age of 5 in San Jose, CA with 18.9%.
What is the Poverty Level Among Children Under the Age of 5 in San Jose, CA?
Poverty Level Among Children Under the Age of 5 in San Jose is 8.0%.
What is the Poverty Level Among Children Under the Age of 5 in California?
Poverty Level Among Children Under the Age of 5 in California is 15.6%.
What is the Poverty Level Among Children Under the Age of 5 in the United States?
Poverty Level Among Children Under the Age of 5 in the United States is 18.1%.