Cities with the Highest Poverty Level Among Children Under the Age of 5 in West Virginia
RELATED REPORTS & OPTIONS
Highest Poverty | Child 0-5
West Virginia
Compare Cities
Map of Cities with the Highest Poverty Level Among Children Under the Age of 5 in West Virginia
0.0%
100.0%
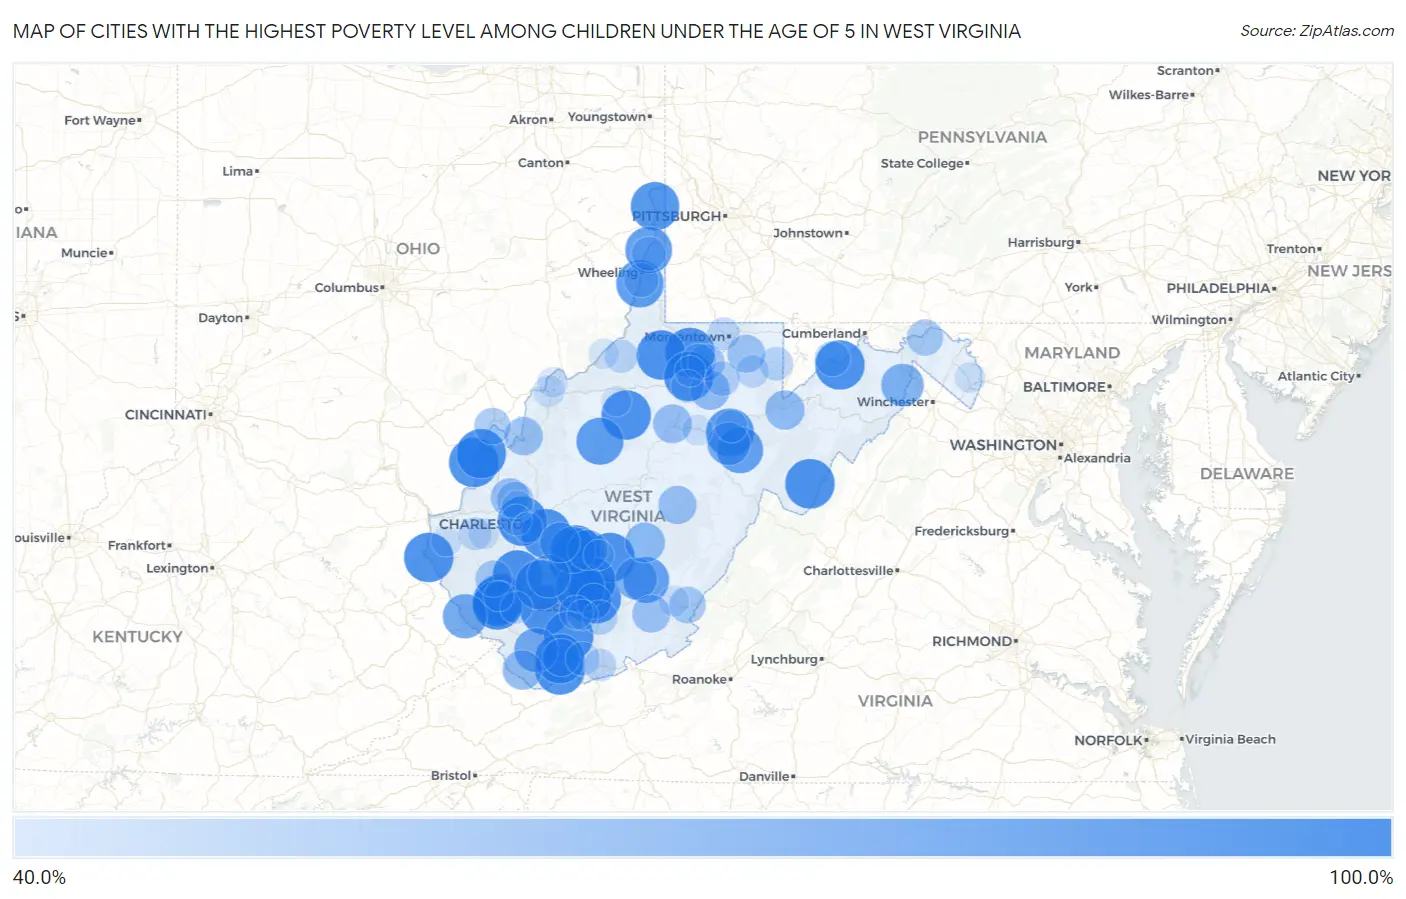
Cities with the Highest Poverty Level Among Children Under the Age of 5 in West Virginia
| City | Child Poverty | vs State | vs National | |
| 1. | Keyser | 100.0% | 25.5% (+74.5)#1 | 18.1% (+81.9)#6 |
| 2. | Prosperity | 100.0% | 25.5% (+74.5)#2 | 18.1% (+81.9)#90 |
| 3. | Sprague | 100.0% | 25.5% (+74.5)#3 | 18.1% (+81.9)#170 |
| 4. | Arthurdale | 100.0% | 25.5% (+74.5)#4 | 18.1% (+81.9)#178 |
| 5. | Rand | 100.0% | 25.5% (+74.5)#5 | 18.1% (+81.9)#182 |
| 6. | Mcconnell | 100.0% | 25.5% (+74.5)#6 | 18.1% (+81.9)#191 |
| 7. | Smithers | 100.0% | 25.5% (+74.5)#7 | 18.1% (+81.9)#201 |
| 8. | Kopperston | 100.0% | 25.5% (+74.5)#8 | 18.1% (+81.9)#215 |
| 9. | Piney View | 100.0% | 25.5% (+74.5)#9 | 18.1% (+81.9)#236 |
| 10. | Monaville | 100.0% | 25.5% (+74.5)#10 | 18.1% (+81.9)#251 |
| 11. | Jefferson | 100.0% | 25.5% (+74.5)#11 | 18.1% (+81.9)#264 |
| 12. | Fort Gay | 100.0% | 25.5% (+74.5)#12 | 18.1% (+81.9)#289 |
| 13. | Gallipolis Ferry | 100.0% | 25.5% (+74.5)#13 | 18.1% (+81.9)#290 |
| 14. | Boomer | 100.0% | 25.5% (+74.5)#14 | 18.1% (+81.9)#294 |
| 15. | Powellton | 100.0% | 25.5% (+74.5)#15 | 18.1% (+81.9)#332 |
| 16. | Hico | 100.0% | 25.5% (+74.5)#16 | 18.1% (+81.9)#381 |
| 17. | Kimberly | 100.0% | 25.5% (+74.5)#17 | 18.1% (+81.9)#388 |
| 18. | Corinne | 100.0% | 25.5% (+74.5)#18 | 18.1% (+81.9)#450 |
| 19. | Raymond | 100.0% | 25.5% (+74.5)#19 | 18.1% (+81.9)#462 |
| 20. | Scarbro | 100.0% | 25.5% (+74.5)#20 | 18.1% (+81.9)#499 |
| 21. | Greenview | 100.0% | 25.5% (+74.5)#21 | 18.1% (+81.9)#516 |
| 22. | Rachel | 100.0% | 25.5% (+74.5)#22 | 18.1% (+81.9)#524 |
| 23. | Henderson | 100.0% | 25.5% (+74.5)#23 | 18.1% (+81.9)#527 |
| 24. | Switzer | 100.0% | 25.5% (+74.5)#24 | 18.1% (+81.9)#560 |
| 25. | Anawalt | 100.0% | 25.5% (+74.5)#25 | 18.1% (+81.9)#605 |
| 26. | Brandywine | 100.0% | 25.5% (+74.5)#26 | 18.1% (+81.9)#607 |
| 27. | Baxter | 100.0% | 25.5% (+74.5)#27 | 18.1% (+81.9)#658 |
| 28. | Smithfield | 100.0% | 25.5% (+74.5)#28 | 18.1% (+81.9)#672 |
| 29. | Keystone | 100.0% | 25.5% (+74.5)#29 | 18.1% (+81.9)#760 |
| 30. | Twilight | 100.0% | 25.5% (+74.5)#30 | 18.1% (+81.9)#807 |
| 31. | Pax | 100.0% | 25.5% (+74.5)#31 | 18.1% (+81.9)#813 |
| 32. | Gypsy | 100.0% | 25.5% (+74.5)#32 | 18.1% (+81.9)#877 |
| 33. | Auburn | 100.0% | 25.5% (+74.5)#33 | 18.1% (+81.9)#892 |
| 34. | New Cumberland | 96.8% | 25.5% (+71.3)#34 | 18.1% (+78.7)#919 |
| 35. | Junior | 95.5% | 25.5% (+70.0)#35 | 18.1% (+77.4)#931 |
| 36. | Mcmechen | 93.7% | 25.5% (+68.2)#36 | 18.1% (+75.6)#956 |
| 37. | Grantsville | 92.6% | 25.5% (+67.1)#37 | 18.1% (+74.5)#973 |
| 38. | Beech Bottom | 91.7% | 25.5% (+66.2)#38 | 18.1% (+73.6)#994 |
| 39. | Montgomery | 90.6% | 25.5% (+65.1)#39 | 18.1% (+72.5)#1,012 |
| 40. | Beverly | 90.4% | 25.5% (+64.9)#40 | 18.1% (+72.3)#1,018 |
| 41. | Rupert | 89.1% | 25.5% (+63.6)#41 | 18.1% (+71.0)#1,040 |
| 42. | Chattaroy | 84.3% | 25.5% (+58.8)#42 | 18.1% (+66.2)#1,183 |
| 43. | Davy | 83.3% | 25.5% (+57.8)#43 | 18.1% (+65.3)#1,221 |
| 44. | Whitesville | 80.0% | 25.5% (+54.5)#44 | 18.1% (+61.9)#1,352 |
| 45. | Womelsdorf Coalton | 80.0% | 25.5% (+54.5)#45 | 18.1% (+61.9)#1,353 |
| 46. | Capon Bridge | 79.2% | 25.5% (+53.7)#46 | 18.1% (+61.1)#1,372 |
| 47. | Rainelle | 76.5% | 25.5% (+51.0)#47 | 18.1% (+58.4)#1,466 |
| 48. | Gauley Bridge | 72.5% | 25.5% (+47.0)#48 | 18.1% (+54.4)#1,656 |
| 49. | Cedar Grove | 72.0% | 25.5% (+46.5)#49 | 18.1% (+53.9)#1,673 |
| 50. | Nettie | 71.2% | 25.5% (+45.7)#50 | 18.1% (+53.1)#1,727 |
| 51. | Flemington | 70.0% | 25.5% (+44.5)#51 | 18.1% (+51.9)#1,784 |
| 52. | Raysal | 69.8% | 25.5% (+44.4)#52 | 18.1% (+51.8)#1,794 |
| 53. | Davis | 69.0% | 25.5% (+43.5)#53 | 18.1% (+50.9)#1,846 |
| 54. | Weston | 67.6% | 25.5% (+42.1)#54 | 18.1% (+49.5)#1,920 |
| 55. | Winfield | 66.5% | 25.5% (+41.0)#55 | 18.1% (+48.4)#2,038 |
| 56. | Ravenswood | 66.1% | 25.5% (+40.6)#56 | 18.1% (+48.0)#2,050 |
| 57. | Addison Webster Springs | 66.1% | 25.5% (+40.6)#57 | 18.1% (+48.0)#2,051 |
| 58. | Alderson | 65.3% | 25.5% (+39.8)#58 | 18.1% (+47.2)#2,093 |
| 59. | Reedsville | 65.0% | 25.5% (+39.5)#59 | 18.1% (+46.9)#2,113 |
| 60. | Northfork | 63.6% | 25.5% (+38.2)#60 | 18.1% (+45.6)#2,210 |
| 61. | Pleasant Valley | 62.0% | 25.5% (+36.6)#61 | 18.1% (+44.0)#2,337 |
| 62. | Bancroft | 61.5% | 25.5% (+36.1)#62 | 18.1% (+43.5)#2,382 |
| 63. | Chapmanville | 61.3% | 25.5% (+35.8)#63 | 18.1% (+43.2)#2,400 |
| 64. | Mason | 61.1% | 25.5% (+35.6)#64 | 18.1% (+43.0)#2,416 |
| 65. | White Sulphur Springs | 61.0% | 25.5% (+35.5)#65 | 18.1% (+43.0)#2,426 |
| 66. | Bath Berkeley Springs | 60.6% | 25.5% (+35.1)#66 | 18.1% (+42.5)#2,462 |
| 67. | Stanaford | 57.7% | 25.5% (+32.2)#67 | 18.1% (+39.6)#2,706 |
| 68. | Piedmont | 57.1% | 25.5% (+31.7)#68 | 18.1% (+39.1)#2,753 |
| 69. | Monongah | 56.8% | 25.5% (+31.3)#69 | 18.1% (+38.8)#2,790 |
| 70. | Grafton | 55.4% | 25.5% (+30.0)#70 | 18.1% (+37.4)#2,937 |
| 71. | Benwood | 55.2% | 25.5% (+29.7)#71 | 18.1% (+37.1)#2,957 |
| 72. | Shady Spring | 54.9% | 25.5% (+29.5)#72 | 18.1% (+36.9)#2,971 |
| 73. | Windsor Heights | 53.7% | 25.5% (+28.2)#73 | 18.1% (+35.7)#3,060 |
| 74. | Lester | 53.3% | 25.5% (+27.8)#74 | 18.1% (+35.3)#3,108 |
| 75. | Matoaka | 53.3% | 25.5% (+27.8)#75 | 18.1% (+35.3)#3,115 |
| 76. | Terra Alta | 52.9% | 25.5% (+27.4)#76 | 18.1% (+34.8)#3,151 |
| 77. | Middlebourne | 51.3% | 25.5% (+25.8)#77 | 18.1% (+33.2)#3,306 |
| 78. | Clarksburg | 50.9% | 25.5% (+25.4)#78 | 18.1% (+32.8)#3,338 |
| 79. | Granville | 50.0% | 25.5% (+24.5)#79 | 18.1% (+31.9)#3,417 |
| 80. | West Hamlin | 50.0% | 25.5% (+24.5)#80 | 18.1% (+31.9)#3,446 |
| 81. | Tunnelton | 50.0% | 25.5% (+24.5)#81 | 18.1% (+31.9)#3,488 |
| 82. | Princeton | 49.8% | 25.5% (+24.4)#82 | 18.1% (+31.8)#3,580 |
| 83. | Belington | 49.1% | 25.5% (+23.6)#83 | 18.1% (+31.0)#3,633 |
| 84. | Accoville | 48.3% | 25.5% (+22.8)#84 | 18.1% (+30.2)#3,717 |
| 85. | Parkersburg | 46.9% | 25.5% (+21.4)#85 | 18.1% (+28.8)#3,893 |
| 86. | Poca | 46.2% | 25.5% (+20.7)#86 | 18.1% (+28.1)#3,987 |
| 87. | Hamlin | 44.6% | 25.5% (+19.1)#87 | 18.1% (+26.5)#4,199 |
| 88. | Lewisburg | 44.4% | 25.5% (+19.0)#88 | 18.1% (+26.4)#4,209 |
| 89. | St Albans | 44.4% | 25.5% (+18.9)#89 | 18.1% (+26.3)#4,246 |
| 90. | Shinnston | 44.2% | 25.5% (+18.7)#90 | 18.1% (+26.2)#4,260 |
| 91. | Buckhannon | 44.2% | 25.5% (+18.7)#91 | 18.1% (+26.2)#4,262 |
| 92. | Shenandoah Junction | 44.1% | 25.5% (+18.6)#92 | 18.1% (+26.1)#4,277 |
| 93. | Sophia | 43.9% | 25.5% (+18.4)#93 | 18.1% (+25.8)#4,305 |
| 94. | Friendly | 43.8% | 25.5% (+18.3)#94 | 18.1% (+25.7)#4,336 |
| 95. | North Hills | 43.6% | 25.5% (+18.2)#95 | 18.1% (+25.6)#4,346 |
| 96. | Ansted | 43.3% | 25.5% (+17.8)#96 | 18.1% (+25.3)#4,383 |
| 97. | South Charleston | 42.9% | 25.5% (+17.4)#97 | 18.1% (+24.8)#4,438 |
| 98. | Wayne | 42.9% | 25.5% (+17.4)#98 | 18.1% (+24.8)#4,442 |
| 99. | Pullman | 42.9% | 25.5% (+17.4)#99 | 18.1% (+24.8)#4,471 |
| 100. | Logan | 42.6% | 25.5% (+17.1)#100 | 18.1% (+24.5)#4,510 |
Common Questions
What are the Top 10 Cities with the Highest Poverty Level Among Children Under the Age of 5 in West Virginia?
Top 10 Cities with the Highest Poverty Level Among Children Under the Age of 5 in West Virginia are:
#1
100.0%
#2
100.0%
#3
100.0%
#4
100.0%
#5
100.0%
#6
100.0%
#7
100.0%
#8
100.0%
#9
100.0%
#10
100.0%
What city has the Highest Poverty Level Among Children Under the Age of 5 in West Virginia?
Keyser has the Highest Poverty Level Among Children Under the Age of 5 in West Virginia with 100.0%.
What is the Poverty Level Among Children Under the Age of 5 in the State of West Virginia?
Poverty Level Among Children Under the Age of 5 in West Virginia is 25.5%.
What is the Poverty Level Among Children Under the Age of 5 in the United States?
Poverty Level Among Children Under the Age of 5 in the United States is 18.1%.