Cities with the Highest Poverty Level Among Children Under the Age of 5 in Kentucky
RELATED REPORTS & OPTIONS
Highest Poverty | Child 0-5
Kentucky
Compare Cities
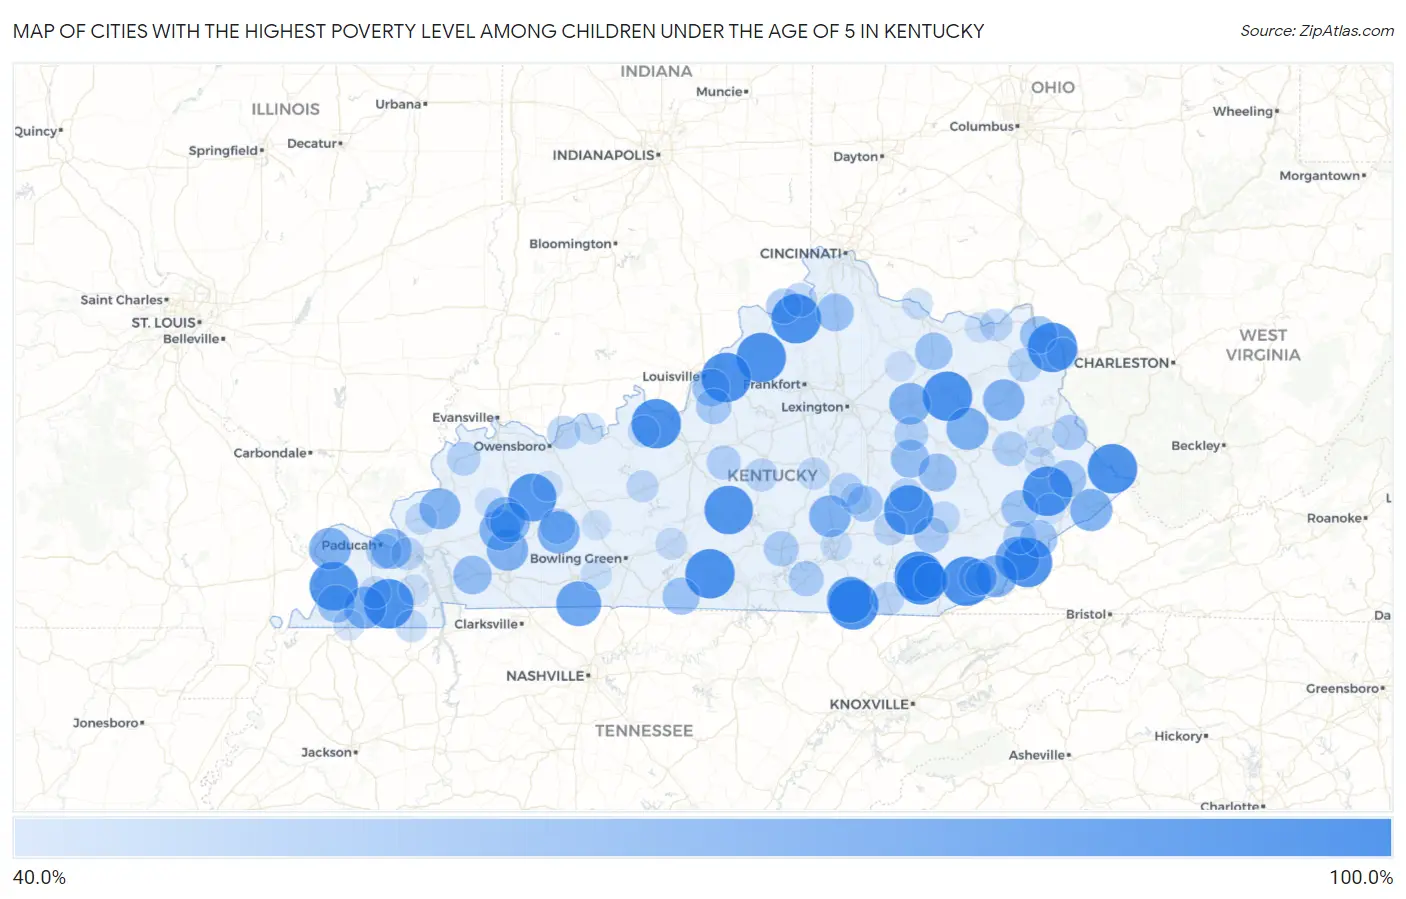
Map of Cities with the Highest Poverty Level Among Children Under the Age of 5 in Kentucky
0.0%
100.0%
Cities with the Highest Poverty Level Among Children Under the Age of 5 in Kentucky
| City | Child Poverty | vs State | vs National | |
| 1. | Barbourville | 100.0% | 23.3%(+76.7)#1 | 18.1%(+81.9)#16 |
| 2. | Pine Knot | 100.0% | 23.3%(+76.7)#2 | 18.1%(+81.9)#97 |
| 3. | Annville | 100.0% | 23.3%(+76.7)#3 | 18.1%(+81.9)#138 |
| 4. | Ironville | 100.0% | 23.3%(+76.7)#4 | 18.1%(+81.9)#228 |
| 5. | Artemus | 100.0% | 23.3%(+76.7)#5 | 18.1%(+81.9)#242 |
| 6. | Lynch | 100.0% | 23.3%(+76.7)#6 | 18.1%(+81.9)#243 |
| 7. | Mcdowell | 100.0% | 23.3%(+76.7)#7 | 18.1%(+81.9)#306 |
| 8. | Coldiron | 100.0% | 23.3%(+76.7)#8 | 18.1%(+81.9)#347 |
| 9. | Sanders | 100.0% | 23.3%(+76.7)#9 | 18.1%(+81.9)#378 |
| 10. | Salt Lick | 100.0% | 23.3%(+76.7)#10 | 18.1%(+81.9)#385 |
| 11. | Summer Shade | 100.0% | 23.3%(+76.7)#11 | 18.1%(+81.9)#457 |
| 12. | Mccarr | 100.0% | 23.3%(+76.7)#12 | 18.1%(+81.9)#514 |
| 13. | Smithfield | 100.0% | 23.3%(+76.7)#13 | 18.1%(+81.9)#601 |
| 14. | Ekron | 100.0% | 23.3%(+76.7)#14 | 18.1%(+81.9)#602 |
| 15. | Farmington | 100.0% | 23.3%(+76.7)#15 | 18.1%(+81.9)#626 |
| 16. | Sycamore | 100.0% | 23.3%(+76.7)#16 | 18.1%(+81.9)#685 |
| 17. | Summersville | 97.2% | 23.3%(+73.9)#17 | 18.1%(+79.2)#915 |
| 18. | Arlington | 97.1% | 23.3%(+73.8)#18 | 18.1%(+79.1)#917 |
| 19. | Sacramento | 95.5% | 23.3%(+72.1)#19 | 18.1%(+77.4)#930 |
| 20. | Stearns | 90.9% | 23.3%(+67.6)#20 | 18.1%(+72.8)#1,002 |
| 21. | Adairville | 87.5% | 23.3%(+64.2)#21 | 18.1%(+69.4)#1,075 |
| 22. | Cumberland | 84.8% | 23.3%(+61.5)#22 | 18.1%(+66.7)#1,163 |
| 23. | Elkhorn City | 80.0% | 23.3%(+56.7)#23 | 18.1%(+61.9)#1,316 |
| 24. | Beechmont | 80.0% | 23.3%(+56.7)#24 | 18.1%(+61.9)#1,322 |
| 25. | Ezel | 80.0% | 23.3%(+56.7)#25 | 18.1%(+61.9)#1,336 |
| 26. | Wingo | 79.3% | 23.3%(+56.0)#26 | 18.1%(+61.2)#1,367 |
| 27. | Barlow | 79.2% | 23.3%(+55.9)#27 | 18.1%(+61.2)#1,368 |
| 28. | Evarts | 79.2% | 23.3%(+55.8)#28 | 18.1%(+61.1)#1,371 |
| 29. | Eubank | 78.6% | 23.3%(+55.2)#29 | 18.1%(+60.5)#1,386 |
| 30. | Mount Sterling | 78.3% | 23.3%(+55.0)#30 | 18.1%(+60.2)#1,396 |
| 31. | Sandy Hook | 77.8% | 23.3%(+54.5)#31 | 18.1%(+59.7)#1,410 |
| 32. | Crofton | 77.8% | 23.3%(+54.5)#32 | 18.1%(+59.7)#1,411 |
| 33. | St Charles | 77.3% | 23.3%(+54.0)#33 | 18.1%(+59.2)#1,434 |
| 34. | Earlington | 76.3% | 23.3%(+53.0)#34 | 18.1%(+58.3)#1,472 |
| 35. | Marion | 76.2% | 23.3%(+52.8)#35 | 18.1%(+58.1)#1,482 |
| 36. | Ledbetter | 75.3% | 23.3%(+52.0)#36 | 18.1%(+57.3)#1,502 |
| 37. | Mortons Gap | 74.0% | 23.3%(+50.7)#37 | 18.1%(+56.0)#1,583 |
| 38. | Cadiz | 70.0% | 23.3%(+46.7)#38 | 18.1%(+51.9)#1,774 |
| 39. | Ravenna | 69.2% | 23.3%(+45.9)#39 | 18.1%(+51.2)#1,829 |
| 40. | Beattyville | 68.4% | 23.3%(+45.1)#40 | 18.1%(+50.4)#1,872 |
| 41. | Loyall | 68.0% | 23.3%(+44.7)#41 | 18.1%(+49.9)#1,898 |
| 42. | Dry Ridge | 67.4% | 23.3%(+44.1)#42 | 18.1%(+49.4)#1,932 |
| 43. | Greenup | 67.3% | 23.3%(+44.0)#43 | 18.1%(+49.3)#1,940 |
| 44. | Clinton | 67.3% | 23.3%(+44.0)#44 | 18.1%(+49.2)#1,945 |
| 45. | Poplar Hills | 67.1% | 23.3%(+43.8)#45 | 18.1%(+49.0)#1,953 |
| 46. | Coal Run Village | 66.9% | 23.3%(+43.6)#46 | 18.1%(+48.9)#1,956 |
| 47. | Whitesburg | 66.9% | 23.3%(+43.6)#47 | 18.1%(+48.9)#1,957 |
| 48. | Flemingsburg | 66.7% | 23.3%(+43.3)#48 | 18.1%(+48.6)#1,962 |
| 49. | Hindman | 66.7% | 23.3%(+43.3)#49 | 18.1%(+48.6)#1,982 |
| 50. | Fountain Run | 66.7% | 23.3%(+43.3)#50 | 18.1%(+48.6)#2,005 |
| 51. | Mount Vernon | 63.1% | 23.3%(+39.8)#51 | 18.1%(+45.1)#2,249 |
| 52. | Hebron Estates | 61.9% | 23.3%(+38.5)#52 | 18.1%(+43.8)#2,352 |
| 53. | Drakesboro | 61.8% | 23.3%(+38.4)#53 | 18.1%(+43.7)#2,359 |
| 54. | Manchester | 61.6% | 23.3%(+38.3)#54 | 18.1%(+43.6)#2,367 |
| 55. | Inez | 61.5% | 23.3%(+38.2)#55 | 18.1%(+43.5)#2,379 |
| 56. | Ghent | 61.5% | 23.3%(+38.2)#56 | 18.1%(+43.5)#2,386 |
| 57. | Farley | 60.8% | 23.3%(+37.4)#57 | 18.1%(+42.7)#2,450 |
| 58. | Russell Springs | 60.7% | 23.3%(+37.3)#58 | 18.1%(+42.6)#2,457 |
| 59. | Monticello | 60.6% | 23.3%(+37.3)#59 | 18.1%(+42.5)#2,461 |
| 60. | Flat Lick | 59.6% | 23.3%(+36.3)#60 | 18.1%(+41.6)#2,564 |
| 61. | Salyersville | 59.6% | 23.3%(+36.3)#61 | 18.1%(+41.5)#2,567 |
| 62. | Clay City | 58.5% | 23.3%(+35.2)#62 | 18.1%(+40.4)#2,650 |
| 63. | New Haven | 58.3% | 23.3%(+35.0)#63 | 18.1%(+40.3)#2,666 |
| 64. | Warsaw | 57.8% | 23.3%(+34.5)#64 | 18.1%(+39.7)#2,698 |
| 65. | Crab Orchard | 57.7% | 23.3%(+34.4)#65 | 18.1%(+39.6)#2,708 |
| 66. | Grayson | 57.4% | 23.3%(+34.1)#66 | 18.1%(+39.3)#2,735 |
| 67. | Breckinridge Center | 57.1% | 23.3%(+33.8)#67 | 18.1%(+39.1)#2,749 |
| 68. | Mckee | 56.5% | 23.3%(+33.2)#68 | 18.1%(+38.5)#2,816 |
| 69. | Maceo | 56.2% | 23.3%(+32.9)#69 | 18.1%(+38.2)#2,839 |
| 70. | Blackey | 56.2% | 23.3%(+32.9)#70 | 18.1%(+38.2)#2,847 |
| 71. | Emlyn | 55.6% | 23.3%(+32.2)#71 | 18.1%(+37.5)#2,910 |
| 72. | Lebanon | 55.3% | 23.3%(+32.0)#72 | 18.1%(+37.3)#2,944 |
| 73. | East Bernstadt | 55.1% | 23.3%(+31.8)#73 | 18.1%(+37.0)#2,961 |
| 74. | Calvert City | 54.7% | 23.3%(+31.4)#74 | 18.1%(+36.6)#2,988 |
| 75. | Garrison | 54.0% | 23.3%(+30.7)#75 | 18.1%(+35.9)#3,035 |
| 76. | Junction City | 53.3% | 23.3%(+30.0)#76 | 18.1%(+35.3)#3,098 |
| 77. | Mayfield | 53.3% | 23.3%(+29.9)#77 | 18.1%(+35.2)#3,118 |
| 78. | Harlan | 53.2% | 23.3%(+29.8)#78 | 18.1%(+35.1)#3,126 |
| 79. | Catlettsburg | 53.0% | 23.3%(+29.7)#79 | 18.1%(+34.9)#3,138 |
| 80. | Hazel | 52.9% | 23.3%(+29.6)#80 | 18.1%(+34.9)#3,146 |
| 81. | Oneida | 52.9% | 23.3%(+29.6)#81 | 18.1%(+34.8)#3,154 |
| 82. | Leitchfield | 52.6% | 23.3%(+29.3)#82 | 18.1%(+34.5)#3,181 |
| 83. | Salem | 52.4% | 23.3%(+29.1)#83 | 18.1%(+34.3)#3,194 |
| 84. | Irvington | 52.3% | 23.3%(+29.0)#84 | 18.1%(+34.2)#3,209 |
| 85. | Park City | 52.2% | 23.3%(+28.9)#85 | 18.1%(+34.1)#3,220 |
| 86. | Brodhead | 51.9% | 23.3%(+28.5)#86 | 18.1%(+33.8)#3,248 |
| 87. | Hawesville | 50.8% | 23.3%(+27.4)#87 | 18.1%(+32.7)#3,344 |
| 88. | Somerset | 50.6% | 23.3%(+27.2)#88 | 18.1%(+32.5)#3,360 |
| 89. | Fulton | 50.0% | 23.3%(+26.7)#89 | 18.1%(+31.9)#3,399 |
| 90. | Auburn | 50.0% | 23.3%(+26.7)#90 | 18.1%(+31.9)#3,408 |
| 91. | Dover | 50.0% | 23.3%(+26.7)#91 | 18.1%(+31.9)#3,497 |
| 92. | Paintsville | 49.5% | 23.3%(+26.1)#92 | 18.1%(+31.4)#3,608 |
| 93. | Livermore | 49.1% | 23.3%(+25.8)#93 | 18.1%(+31.0)#3,636 |
| 94. | Hardin | 48.8% | 23.3%(+25.5)#94 | 18.1%(+30.7)#3,670 |
| 95. | Carlisle | 48.4% | 23.3%(+25.1)#95 | 18.1%(+30.3)#3,704 |
| 96. | Vanceburg | 48.4% | 23.3%(+25.1)#96 | 18.1%(+30.3)#3,706 |
| 97. | Prestonsburg | 48.2% | 23.3%(+24.9)#97 | 18.1%(+30.1)#3,728 |
| 98. | Wheelwright | 48.1% | 23.3%(+24.8)#98 | 18.1%(+30.1)#3,736 |
| 99. | Morgantown | 47.4% | 23.3%(+24.1)#99 | 18.1%(+29.4)#3,815 |
| 100. | Nebo | 47.4% | 23.3%(+24.0)#100 | 18.1%(+29.3)#3,824 |
Common Questions
What are the Top 10 Cities with the Highest Poverty Level Among Children Under the Age of 5 in Kentucky?
Top 10 Cities with the Highest Poverty Level Among Children Under the Age of 5 in Kentucky are:
What city has the Highest Poverty Level Among Children Under the Age of 5 in Kentucky?
Barbourville has the Highest Poverty Level Among Children Under the Age of 5 in Kentucky with 100.0%.
What is the Poverty Level Among Children Under the Age of 5 in the State of Kentucky?
Poverty Level Among Children Under the Age of 5 in Kentucky is 23.3%.
What is the Poverty Level Among Children Under the Age of 5 in the United States?
Poverty Level Among Children Under the Age of 5 in the United States is 18.1%.