Cities with the Highest Poverty Level Among Children Under the Age of 5 in Florida
RELATED REPORTS & OPTIONS
Highest Poverty | Child 0-5
Florida
Compare Cities
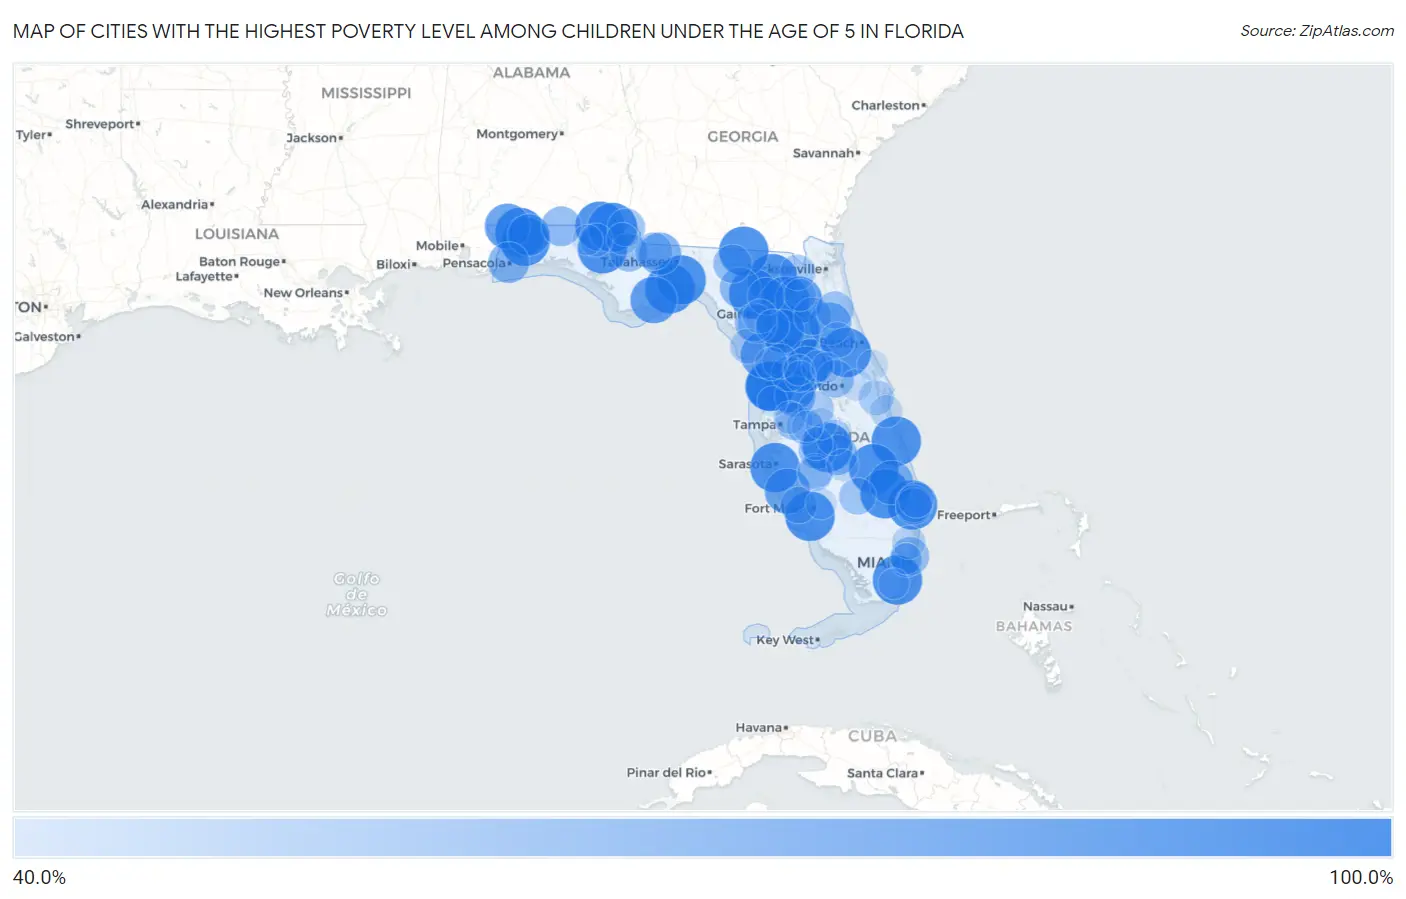
Map of Cities with the Highest Poverty Level Among Children Under the Age of 5 in Florida
0.0%
100.0%
Cities with the Highest Poverty Level Among Children Under the Age of 5 in Florida
| City | Child Poverty | vs State | vs National | |
| 1. | Siesta Key | 100.0% | 19.3%(+80.7)#1 | 18.1%(+81.9)#4 |
| 2. | Rainbow Springs | 100.0% | 19.3%(+80.7)#2 | 18.1%(+81.9)#5 |
| 3. | Gifford | 100.0% | 19.3%(+80.7)#3 | 18.1%(+81.9)#7 |
| 4. | Ocala Estates | 100.0% | 19.3%(+80.7)#4 | 18.1%(+81.9)#18 |
| 5. | Hill N Dale | 100.0% | 19.3%(+80.7)#5 | 18.1%(+81.9)#19 |
| 6. | Watertown | 100.0% | 19.3%(+80.7)#6 | 18.1%(+81.9)#34 |
| 7. | Royal Palm Estates | 100.0% | 19.3%(+80.7)#7 | 18.1%(+81.9)#68 |
| 8. | Harlem Heights | 100.0% | 19.3%(+80.7)#8 | 18.1%(+81.9)#75 |
| 9. | Cypress Quarters | 100.0% | 19.3%(+80.7)#9 | 18.1%(+81.9)#102 |
| 10. | Homestead Base | 100.0% | 19.3%(+80.7)#10 | 18.1%(+81.9)#126 |
| 11. | North Deland | 100.0% | 19.3%(+80.7)#11 | 18.1%(+81.9)#132 |
| 12. | Panacea | 100.0% | 19.3%(+80.7)#12 | 18.1%(+81.9)#143 |
| 13. | Weeki Wachee Gardens | 100.0% | 19.3%(+80.7)#13 | 18.1%(+81.9)#185 |
| 14. | Branford | 100.0% | 19.3%(+80.7)#14 | 18.1%(+81.9)#196 |
| 15. | Jennings | 100.0% | 19.3%(+80.7)#15 | 18.1%(+81.9)#229 |
| 16. | Lemon Grove | 100.0% | 19.3%(+80.7)#16 | 18.1%(+81.9)#271 |
| 17. | Reddick | 100.0% | 19.3%(+80.7)#17 | 18.1%(+81.9)#339 |
| 18. | Canal Point | 100.0% | 19.3%(+80.7)#18 | 18.1%(+81.9)#345 |
| 19. | Wausau | 100.0% | 19.3%(+80.7)#19 | 18.1%(+81.9)#413 |
| 20. | St Marks | 100.0% | 19.3%(+80.7)#20 | 18.1%(+81.9)#460 |
| 21. | Noma | 100.0% | 19.3%(+80.7)#21 | 18.1%(+81.9)#496 |
| 22. | Campbellton | 100.0% | 19.3%(+80.7)#22 | 18.1%(+81.9)#515 |
| 23. | Berrydale | 100.0% | 19.3%(+80.7)#23 | 18.1%(+81.9)#608 |
| 24. | La Crosse | 100.0% | 19.3%(+80.7)#24 | 18.1%(+81.9)#636 |
| 25. | Bayport | 100.0% | 19.3%(+80.7)#25 | 18.1%(+81.9)#746 |
| 26. | Springhill | 100.0% | 19.3%(+80.7)#26 | 18.1%(+81.9)#815 |
| 27. | Raleigh | 95.5% | 19.3%(+76.2)#27 | 18.1%(+77.4)#928 |
| 28. | Hampton | 93.3% | 19.3%(+74.1)#28 | 18.1%(+75.3)#960 |
| 29. | Silver Springs | 93.2% | 19.3%(+74.0)#29 | 18.1%(+75.1)#964 |
| 30. | Carrabelle | 92.3% | 19.3%(+73.1)#30 | 18.1%(+74.2)#980 |
| 31. | Yankeetown | 90.9% | 19.3%(+71.7)#31 | 18.1%(+72.8)#1,003 |
| 32. | Grove City | 89.2% | 19.3%(+69.9)#32 | 18.1%(+71.1)#1,039 |
| 33. | Century | 88.9% | 19.3%(+69.6)#33 | 18.1%(+70.8)#1,043 |
| 34. | Lady Lake | 87.7% | 19.3%(+68.4)#34 | 18.1%(+69.6)#1,071 |
| 35. | Wildwood | 87.5% | 19.3%(+68.3)#35 | 18.1%(+69.5)#1,073 |
| 36. | Indiantown | 84.8% | 19.3%(+65.5)#36 | 18.1%(+66.7)#1,162 |
| 37. | East Williston | 84.4% | 19.3%(+65.2)#37 | 18.1%(+66.4)#1,172 |
| 38. | Pomona Park | 81.4% | 19.3%(+62.1)#38 | 18.1%(+63.3)#1,284 |
| 39. | Quincy | 80.7% | 19.3%(+61.4)#39 | 18.1%(+62.6)#1,306 |
| 40. | Munson | 79.6% | 19.3%(+60.3)#40 | 18.1%(+61.5)#1,363 |
| 41. | Goulding | 77.4% | 19.3%(+58.2)#41 | 18.1%(+59.4)#1,426 |
| 42. | Dade City North | 76.8% | 19.3%(+57.5)#42 | 18.1%(+58.7)#1,459 |
| 43. | Mayo | 75.7% | 19.3%(+56.5)#43 | 18.1%(+57.7)#1,493 |
| 44. | Sebring | 74.7% | 19.3%(+55.4)#44 | 18.1%(+56.6)#1,563 |
| 45. | Paxton | 73.7% | 19.3%(+54.4)#45 | 18.1%(+55.6)#1,603 |
| 46. | Chiefland | 71.3% | 19.3%(+52.0)#46 | 18.1%(+53.2)#1,721 |
| 47. | Biscayne Park | 70.4% | 19.3%(+51.1)#47 | 18.1%(+52.3)#1,762 |
| 48. | Lee | 70.2% | 19.3%(+51.0)#48 | 18.1%(+52.1)#1,772 |
| 49. | Altha | 69.7% | 19.3%(+50.4)#49 | 18.1%(+51.6)#1,798 |
| 50. | Wauchula | 69.2% | 19.3%(+49.9)#50 | 18.1%(+51.1)#1,838 |
| 51. | Manatee Road | 69.1% | 19.3%(+49.9)#51 | 18.1%(+51.1)#1,842 |
| 52. | Interlachen | 68.6% | 19.3%(+49.3)#52 | 18.1%(+50.5)#1,865 |
| 53. | Malone | 68.5% | 19.3%(+49.3)#53 | 18.1%(+50.5)#1,866 |
| 54. | South Apopka | 68.4% | 19.3%(+49.2)#54 | 18.1%(+50.4)#1,871 |
| 55. | Hastings | 67.7% | 19.3%(+48.4)#55 | 18.1%(+49.6)#1,914 |
| 56. | Gretna | 67.4% | 19.3%(+48.2)#56 | 18.1%(+49.4)#1,929 |
| 57. | Fort White | 67.4% | 19.3%(+48.1)#57 | 18.1%(+49.3)#1,937 |
| 58. | Dover | 67.1% | 19.3%(+47.8)#58 | 18.1%(+49.0)#1,952 |
| 59. | Schall Circle | 66.7% | 19.3%(+47.4)#59 | 18.1%(+48.6)#1,988 |
| 60. | Moore Haven | 66.1% | 19.3%(+46.8)#60 | 18.1%(+48.0)#2,052 |
| 61. | Bokeelia | 65.8% | 19.3%(+46.5)#61 | 18.1%(+47.7)#2,065 |
| 62. | Willow Oak | 65.5% | 19.3%(+46.2)#62 | 18.1%(+47.4)#2,081 |
| 63. | Pine Air | 65.4% | 19.3%(+46.2)#63 | 18.1%(+47.4)#2,087 |
| 64. | Glen St Mary | 63.3% | 19.3%(+44.0)#64 | 18.1%(+45.2)#2,236 |
| 65. | Pierson | 63.2% | 19.3%(+43.9)#65 | 18.1%(+45.1)#2,241 |
| 66. | Frostproof | 62.7% | 19.3%(+43.5)#66 | 18.1%(+44.7)#2,273 |
| 67. | Mangonia Park | 62.5% | 19.3%(+43.2)#67 | 18.1%(+44.4)#2,290 |
| 68. | Polk City | 62.3% | 19.3%(+43.0)#68 | 18.1%(+44.2)#2,322 |
| 69. | Floral City | 62.2% | 19.3%(+42.9)#69 | 18.1%(+44.1)#2,329 |
| 70. | Cocoa West | 62.0% | 19.3%(+42.8)#70 | 18.1%(+44.0)#2,336 |
| 71. | Arcadia | 61.7% | 19.3%(+42.5)#71 | 18.1%(+43.7)#2,361 |
| 72. | Southeast Arcadia | 61.3% | 19.3%(+42.0)#72 | 18.1%(+43.2)#2,397 |
| 73. | Cedar Key | 61.1% | 19.3%(+41.9)#73 | 18.1%(+43.0)#2,415 |
| 74. | Beverly Hills | 61.0% | 19.3%(+41.8)#74 | 18.1%(+43.0)#2,425 |
| 75. | Brownsville | 59.1% | 19.3%(+39.8)#75 | 18.1%(+41.0)#2,595 |
| 76. | Trenton | 58.7% | 19.3%(+39.4)#76 | 18.1%(+40.6)#2,636 |
| 77. | East Bronson | 57.7% | 19.3%(+38.5)#77 | 18.1%(+39.7)#2,700 |
| 78. | Broadview Park | 57.2% | 19.3%(+38.0)#78 | 18.1%(+39.2)#2,743 |
| 79. | Bonifay | 56.9% | 19.3%(+37.6)#79 | 18.1%(+38.8)#2,788 |
| 80. | Tropical Park | 56.3% | 19.3%(+37.0)#80 | 18.1%(+38.2)#2,836 |
| 81. | Crystal River | 56.2% | 19.3%(+37.0)#81 | 18.1%(+38.2)#2,837 |
| 82. | Bowling Green | 55.9% | 19.3%(+36.7)#82 | 18.1%(+37.9)#2,873 |
| 83. | Thonotosassa | 55.6% | 19.3%(+36.3)#83 | 18.1%(+37.5)#2,901 |
| 84. | Starke | 54.7% | 19.3%(+35.4)#84 | 18.1%(+36.6)#2,990 |
| 85. | Indian Harbour Beach | 54.5% | 19.3%(+35.3)#85 | 18.1%(+36.5)#2,998 |
| 86. | Marianna | 54.0% | 19.3%(+34.8)#86 | 18.1%(+35.9)#3,034 |
| 87. | Lake Placid | 53.8% | 19.3%(+34.6)#87 | 18.1%(+35.8)#3,046 |
| 88. | Silver Lake | 53.6% | 19.3%(+34.4)#88 | 18.1%(+35.6)#3,070 |
| 89. | Wahneta | 52.5% | 19.3%(+33.2)#89 | 18.1%(+34.4)#3,187 |
| 90. | Bithlo | 52.5% | 19.3%(+33.2)#90 | 18.1%(+34.4)#3,189 |
| 91. | Mulberry | 51.9% | 19.3%(+32.7)#91 | 18.1%(+33.9)#3,238 |
| 92. | Bushnell | 51.7% | 19.3%(+32.4)#92 | 18.1%(+33.6)#3,267 |
| 93. | Fort Myers Shores | 51.6% | 19.3%(+32.3)#93 | 18.1%(+33.5)#3,278 |
| 94. | Gladeview | 51.5% | 19.3%(+32.2)#94 | 18.1%(+33.4)#3,285 |
| 95. | Lake Panasoffkee | 51.4% | 19.3%(+32.2)#95 | 18.1%(+33.3)#3,292 |
| 96. | Oak Hill | 50.9% | 19.3%(+31.6)#96 | 18.1%(+32.8)#3,335 |
| 97. | Florida City | 50.8% | 19.3%(+31.6)#97 | 18.1%(+32.8)#3,341 |
| 98. | Westville | 50.0% | 19.3%(+30.7)#98 | 18.1%(+31.9)#3,503 |
| 99. | Mount Dora | 49.9% | 19.3%(+30.7)#99 | 18.1%(+31.9)#3,578 |
| 100. | Moon Lake | 49.1% | 19.3%(+29.9)#100 | 18.1%(+31.1)#3,632 |
Common Questions
What are the Top 10 Cities with the Highest Poverty Level Among Children Under the Age of 5 in Florida?
Top 10 Cities with the Highest Poverty Level Among Children Under the Age of 5 in Florida are:
#1
100.0%
#2
100.0%
#3
100.0%
#4
100.0%
#5
100.0%
#6
100.0%
#7
100.0%
#8
100.0%
#9
100.0%
#10
100.0%
What city has the Highest Poverty Level Among Children Under the Age of 5 in Florida?
Siesta Key has the Highest Poverty Level Among Children Under the Age of 5 in Florida with 100.0%.
What is the Poverty Level Among Children Under the Age of 5 in the State of Florida?
Poverty Level Among Children Under the Age of 5 in Florida is 19.3%.
What is the Poverty Level Among Children Under the Age of 5 in the United States?
Poverty Level Among Children Under the Age of 5 in the United States is 18.1%.