Cities with the Highest Poverty Level Among Children Under the Age of 5 in New Hampshire
RELATED REPORTS & OPTIONS
Highest Poverty | Child 0-5
New Hampshire
Compare Cities
Map of Cities with the Highest Poverty Level Among Children Under the Age of 5 in New Hampshire
0.0%
100.0%
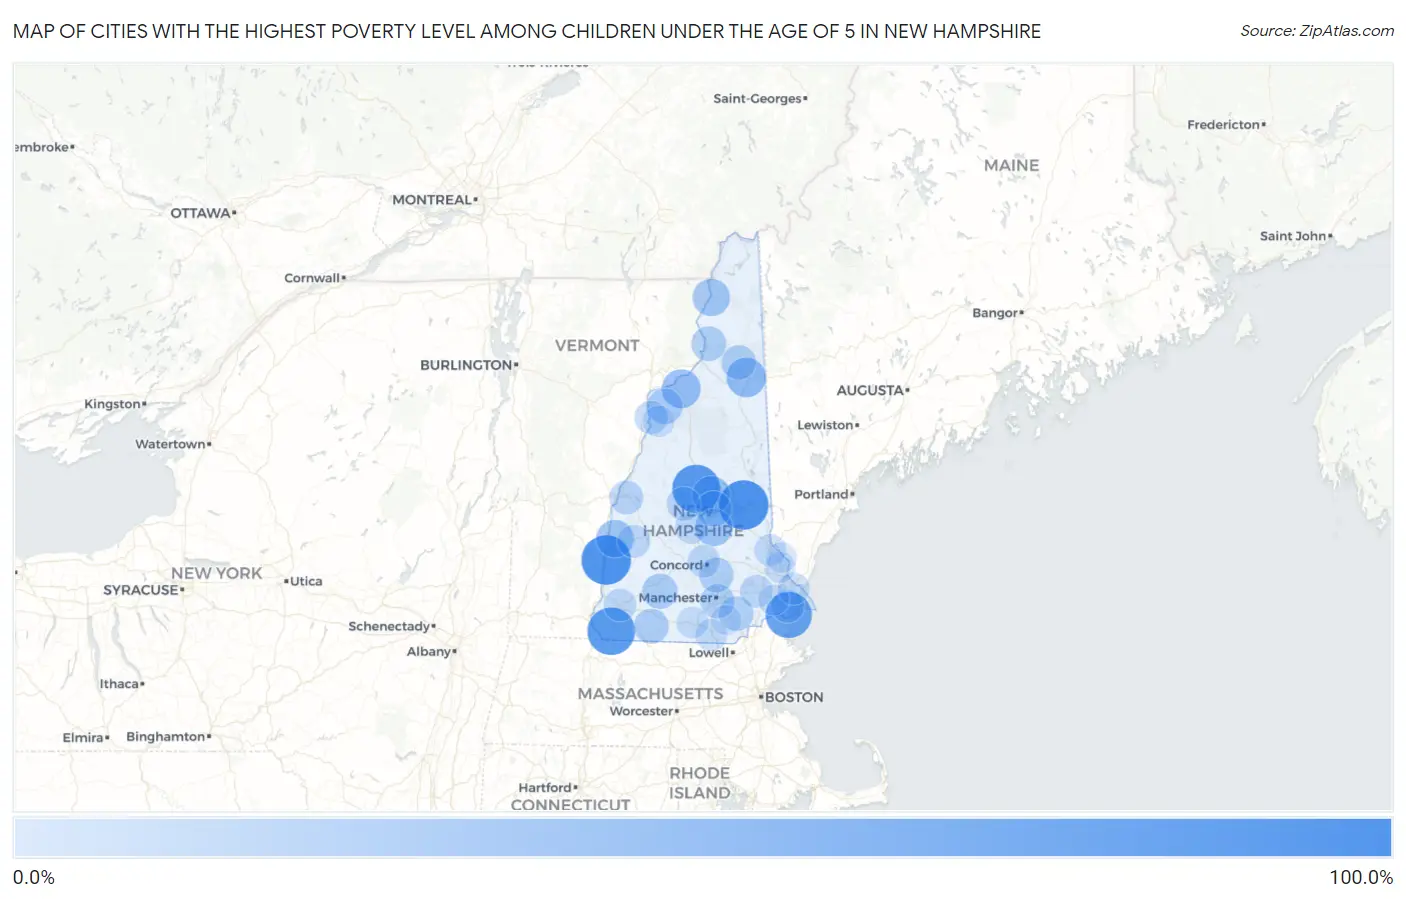
Cities with the Highest Poverty Level Among Children Under the Age of 5 in New Hampshire
| City | Child Poverty | vs State | vs National | |
| 1. | Wolfeboro | 100.0% | 9.4%(+90.6)#1 | 18.1%(+81.9)#30 |
| 2. | Charlestown | 100.0% | 9.4%(+90.6)#2 | 18.1%(+81.9)#184 |
| 3. | Ashland | 91.7% | 9.4%(+82.3)#3 | 18.1%(+73.6)#992 |
| 4. | Winchester | 89.5% | 9.4%(+80.1)#4 | 18.1%(+71.4)#1,036 |
| 5. | Seabrook Beach | 82.6% | 9.4%(+73.2)#5 | 18.1%(+64.5)#1,245 |
| 6. | Gorham | 46.8% | 9.4%(+37.4)#6 | 18.1%(+28.7)#3,895 |
| 7. | Littleton | 44.0% | 9.4%(+34.6)#7 | 18.1%(+25.9)#4,286 |
| 8. | Meredith | 39.5% | 9.4%(+30.2)#8 | 18.1%(+21.5)#4,974 |
| 9. | Claremont | 36.9% | 9.4%(+27.5)#9 | 18.1%(+18.8)#5,417 |
| 10. | Belmont | 36.7% | 9.4%(+27.3)#10 | 18.1%(+18.6)#5,450 |
| 11. | Colebrook | 36.2% | 9.4%(+26.8)#11 | 18.1%(+18.1)#5,543 |
| 12. | Laconia | 26.9% | 9.4%(+17.5)#12 | 18.1%(+8.83)#7,591 |
| 13. | Lisbon | 26.7% | 9.4%(+17.3)#13 | 18.1%(+8.60)#7,647 |
| 14. | Antrim | 25.3% | 9.4%(+16.0)#14 | 18.1%(+7.27)#7,961 |
| 15. | Jaffrey | 23.7% | 9.4%(+14.4)#15 | 18.1%(+5.67)#8,421 |
| 16. | Groveton | 23.3% | 9.4%(+13.9)#16 | 18.1%(+5.22)#8,542 |
| 17. | Derry | 22.1% | 9.4%(+12.7)#17 | 18.1%(+4.06)#8,901 |
| 18. | Suncook | 22.0% | 9.4%(+12.6)#18 | 18.1%(+3.90)#8,940 |
| 19. | Berlin | 21.5% | 9.4%(+12.1)#19 | 18.1%(+3.43)#9,095 |
| 20. | Manchester | 21.1% | 9.4%(+11.8)#20 | 18.1%(+3.08)#9,223 |
| 21. | Lebanon | 17.9% | 9.4%(+8.57)#21 | 18.1%(-0.118)#10,239 |
| 22. | Bristol | 17.5% | 9.4%(+8.14)#22 | 18.1%(-0.545)#10,375 |
| 23. | Woodsville | 15.3% | 9.4%(+5.93)#23 | 18.1%(-2.76)#11,151 |
| 24. | Hampton | 14.2% | 9.4%(+4.87)#24 | 18.1%(-3.82)#11,537 |
| 25. | Newport | 13.1% | 9.4%(+3.74)#25 | 18.1%(-4.95)#11,950 |
| 26. | Epping | 12.9% | 9.4%(+3.56)#26 | 18.1%(-5.13)#12,013 |
| 27. | Concord | 12.3% | 9.4%(+2.89)#27 | 18.1%(-5.80)#12,289 |
| 28. | Keene | 12.0% | 9.4%(+2.62)#28 | 18.1%(-6.07)#12,386 |
| 29. | Franklin | 11.6% | 9.4%(+2.18)#29 | 18.1%(-6.51)#12,544 |
| 30. | Portsmouth | 9.2% | 9.4%(-0.183)#30 | 18.1%(-8.87)#13,481 |
| 31. | Nashua | 8.6% | 9.4%(-0.821)#31 | 18.1%(-9.51)#13,763 |
| 32. | Rochester | 8.4% | 9.4%(-0.947)#32 | 18.1%(-9.64)#13,823 |
| 33. | Milford | 8.2% | 9.4%(-1.21)#33 | 18.1%(-9.90)#13,933 |
| 34. | Mountain Lakes | 6.2% | 9.4%(-3.12)#34 | 18.1%(-11.8)#14,740 |
| 35. | Exeter | 3.4% | 9.4%(-5.94)#35 | 18.1%(-14.6)#15,943 |
| 36. | Dover | 3.3% | 9.4%(-6.03)#36 | 18.1%(-14.7)#15,978 |
| 37. | Somersworth | 2.8% | 9.4%(-6.54)#37 | 18.1%(-15.2)#16,191 |
| 38. | Londonderry | 0.75% | 9.4%(-8.63)#38 | 18.1%(-17.3)#16,773 |
1
Common Questions
What are the Top 10 Cities with the Highest Poverty Level Among Children Under the Age of 5 in New Hampshire?
Top 10 Cities with the Highest Poverty Level Among Children Under the Age of 5 in New Hampshire are:
#1
100.0%
#2
100.0%
#3
91.7%
#4
89.5%
#5
82.6%
#6
46.8%
#7
44.0%
#8
39.5%
#9
36.9%
#10
36.7%
What city has the Highest Poverty Level Among Children Under the Age of 5 in New Hampshire?
Wolfeboro has the Highest Poverty Level Among Children Under the Age of 5 in New Hampshire with 100.0%.
What is the Poverty Level Among Children Under the Age of 5 in the State of New Hampshire?
Poverty Level Among Children Under the Age of 5 in New Hampshire is 9.4%.
What is the Poverty Level Among Children Under the Age of 5 in the United States?
Poverty Level Among Children Under the Age of 5 in the United States is 18.1%.