Cities with the Highest Poverty Level Among Children Under the Age of 5 in New York
RELATED REPORTS & OPTIONS
Highest Poverty | Child 0-5
New York
Compare Cities
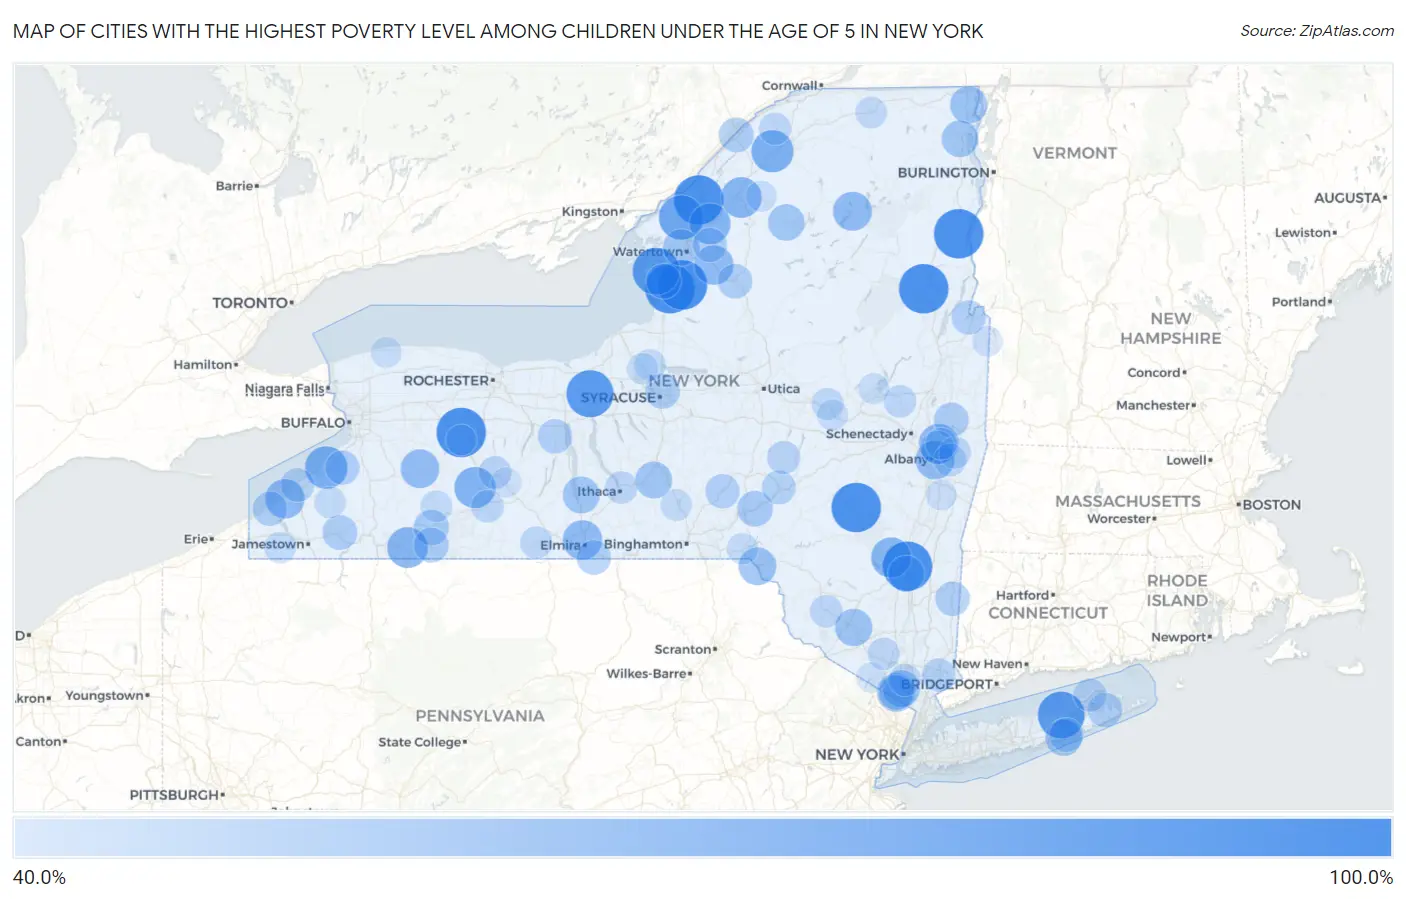
Map of Cities with the Highest Poverty Level Among Children Under the Age of 5 in New York
0.0%
100.0%
Cities with the Highest Poverty Level Among Children Under the Age of 5 in New York
| City | Child Poverty | vs State | vs National | |
| 1. | Fallsburg | 100.0% | 18.7%(+81.3)#1 | 18.1%(+81.9)#53 |
| 2. | Mineville | 100.0% | 18.7%(+81.3)#2 | 18.1%(+81.9)#125 |
| 3. | Ruby | 100.0% | 18.7%(+81.3)#3 | 18.1%(+81.9)#169 |
| 4. | Grahamsville | 100.0% | 18.7%(+81.3)#4 | 18.1%(+81.9)#355 |
| 5. | Pierrepont Manor | 100.0% | 18.7%(+81.3)#5 | 18.1%(+81.9)#392 |
| 6. | East Kingston | 100.0% | 18.7%(+81.3)#6 | 18.1%(+81.9)#425 |
| 7. | Redwood | 100.0% | 18.7%(+81.3)#7 | 18.1%(+81.9)#446 |
| 8. | Pottersville | 100.0% | 18.7%(+81.3)#8 | 18.1%(+81.9)#660 |
| 9. | Wadsworth | 100.0% | 18.7%(+81.3)#9 | 18.1%(+81.9)#661 |
| 10. | Lorraine | 100.0% | 18.7%(+81.3)#10 | 18.1%(+81.9)#725 |
| 11. | Mount Vision | 100.0% | 18.7%(+81.3)#11 | 18.1%(+81.9)#734 |
| 12. | Prattsville | 100.0% | 18.7%(+81.3)#12 | 18.1%(+81.9)#764 |
| 13. | Savannah | 93.3% | 18.7%(+74.6)#13 | 18.1%(+75.3)#961 |
| 14. | Henderson | 93.3% | 18.7%(+74.6)#14 | 18.1%(+75.3)#962 |
| 15. | Northville | 92.4% | 18.7%(+73.6)#15 | 18.1%(+74.3)#978 |
| 16. | La Fargeville | 86.0% | 18.7%(+67.2)#16 | 18.1%(+67.9)#1,129 |
| 17. | Farnham | 80.0% | 18.7%(+61.3)#17 | 18.1%(+61.9)#1,328 |
| 18. | Canton | 79.2% | 18.7%(+60.4)#18 | 18.1%(+61.1)#1,370 |
| 19. | Canaseraga | 76.3% | 18.7%(+57.6)#19 | 18.1%(+58.3)#1,474 |
| 20. | Philadelphia | 75.9% | 18.7%(+57.1)#20 | 18.1%(+57.8)#1,489 |
| 21. | Weston Mills | 75.0% | 18.7%(+56.3)#21 | 18.1%(+56.9)#1,513 |
| 22. | Hailesboro | 75.0% | 18.7%(+56.3)#22 | 18.1%(+56.9)#1,519 |
| 23. | West Hurley | 73.7% | 18.7%(+54.9)#23 | 18.1%(+55.6)#1,601 |
| 24. | Green Island | 72.4% | 18.7%(+53.6)#24 | 18.1%(+54.3)#1,660 |
| 25. | Elmira Heights | 71.7% | 18.7%(+52.9)#25 | 18.1%(+53.6)#1,684 |
| 26. | Copenhagen | 71.4% | 18.7%(+52.7)#26 | 18.1%(+53.4)#1,697 |
| 27. | Brocton | 71.3% | 18.7%(+52.5)#27 | 18.1%(+53.2)#1,723 |
| 28. | Tupper Lake | 70.4% | 18.7%(+51.7)#28 | 18.1%(+52.4)#1,759 |
| 29. | Rensselaer | 69.9% | 18.7%(+51.1)#29 | 18.1%(+51.8)#1,793 |
| 30. | Bliss | 69.2% | 18.7%(+50.5)#30 | 18.1%(+51.2)#1,830 |
| 31. | Kaser | 68.4% | 18.7%(+49.6)#31 | 18.1%(+50.3)#1,880 |
| 32. | Hancock | 66.7% | 18.7%(+47.9)#32 | 18.1%(+48.6)#1,979 |
| 33. | Chazy | 65.7% | 18.7%(+46.9)#33 | 18.1%(+47.6)#2,070 |
| 34. | Bloomingburg | 65.4% | 18.7%(+46.7)#34 | 18.1%(+47.4)#2,086 |
| 35. | New Square | 65.3% | 18.7%(+46.5)#35 | 18.1%(+47.2)#2,096 |
| 36. | Westernville | 64.7% | 18.7%(+46.0)#36 | 18.1%(+46.6)#2,143 |
| 37. | Quogue | 64.3% | 18.7%(+45.5)#37 | 18.1%(+46.2)#2,163 |
| 38. | Burdett | 64.3% | 18.7%(+45.5)#38 | 18.1%(+46.2)#2,165 |
| 39. | Virgil | 64.3% | 18.7%(+45.5)#39 | 18.1%(+46.2)#2,167 |
| 40. | Akwesasne | 63.8% | 18.7%(+45.1)#40 | 18.1%(+45.8)#2,192 |
| 41. | Plattsburgh West | 63.6% | 18.7%(+44.9)#41 | 18.1%(+45.6)#2,200 |
| 42. | Glen Park | 63.6% | 18.7%(+44.9)#42 | 18.1%(+45.6)#2,205 |
| 43. | Star Lake | 63.3% | 18.7%(+44.6)#43 | 18.1%(+45.3)#2,231 |
| 44. | Port Ewen | 62.6% | 18.7%(+43.9)#44 | 18.1%(+44.5)#2,285 |
| 45. | Unadilla | 60.9% | 18.7%(+42.1)#45 | 18.1%(+42.8)#2,440 |
| 46. | Friendship | 60.0% | 18.7%(+41.3)#46 | 18.1%(+41.9)#2,501 |
| 47. | Belleville | 59.1% | 18.7%(+40.3)#47 | 18.1%(+41.0)#2,600 |
| 48. | Monsey | 59.0% | 18.7%(+40.3)#48 | 18.1%(+41.0)#2,604 |
| 49. | Lyncourt | 59.0% | 18.7%(+40.2)#49 | 18.1%(+40.9)#2,605 |
| 50. | Ogdensburg | 58.8% | 18.7%(+40.1)#50 | 18.1%(+40.7)#2,625 |
| 51. | Schaghticoke | 58.6% | 18.7%(+39.9)#51 | 18.1%(+40.6)#2,639 |
| 52. | Richburg | 58.6% | 18.7%(+39.9)#52 | 18.1%(+40.6)#2,640 |
| 53. | East Randolph | 58.5% | 18.7%(+39.7)#53 | 18.1%(+40.4)#2,652 |
| 54. | Lowville | 58.0% | 18.7%(+39.2)#54 | 18.1%(+39.9)#2,690 |
| 55. | Northwest Harbor | 57.7% | 18.7%(+39.0)#55 | 18.1%(+39.7)#2,702 |
| 56. | Dover Plains | 57.7% | 18.7%(+38.9)#56 | 18.1%(+39.6)#2,707 |
| 57. | Wellsburg | 57.7% | 18.7%(+38.9)#57 | 18.1%(+39.6)#2,711 |
| 58. | Westfield | 57.5% | 18.7%(+38.8)#58 | 18.1%(+39.5)#2,725 |
| 59. | Oxford | 57.4% | 18.7%(+38.6)#59 | 18.1%(+39.3)#2,738 |
| 60. | North Collins | 57.1% | 18.7%(+38.4)#60 | 18.1%(+39.1)#2,751 |
| 61. | Hall | 57.1% | 18.7%(+38.4)#61 | 18.1%(+39.1)#2,767 |
| 62. | Great Bend | 56.7% | 18.7%(+38.0)#62 | 18.1%(+38.7)#2,797 |
| 63. | Whitehall | 56.5% | 18.7%(+37.8)#63 | 18.1%(+38.5)#2,813 |
| 64. | East Quogue | 56.5% | 18.7%(+37.7)#64 | 18.1%(+38.4)#2,823 |
| 65. | West End | 56.1% | 18.7%(+37.3)#65 | 18.1%(+38.0)#2,855 |
| 66. | Watervliet | 55.7% | 18.7%(+36.9)#66 | 18.1%(+37.6)#2,895 |
| 67. | Dunkirk | 55.5% | 18.7%(+36.8)#67 | 18.1%(+37.5)#2,932 |
| 68. | Bedford Hills | 54.8% | 18.7%(+36.1)#68 | 18.1%(+36.7)#2,981 |
| 69. | Hartwick | 54.2% | 18.7%(+35.4)#69 | 18.1%(+36.1)#3,025 |
| 70. | Greenport | 53.7% | 18.7%(+35.0)#70 | 18.1%(+35.7)#3,059 |
| 71. | Wayland | 53.1% | 18.7%(+34.4)#71 | 18.1%(+35.1)#3,130 |
| 72. | West Sand Lake | 52.8% | 18.7%(+34.0)#72 | 18.1%(+34.7)#3,166 |
| 73. | Monticello | 52.7% | 18.7%(+33.9)#73 | 18.1%(+34.6)#3,170 |
| 74. | North Hornell | 52.4% | 18.7%(+33.7)#74 | 18.1%(+34.4)#3,190 |
| 75. | Galway | 52.4% | 18.7%(+33.6)#75 | 18.1%(+34.3)#3,200 |
| 76. | Cayuga Heights | 52.2% | 18.7%(+33.4)#76 | 18.1%(+34.1)#3,217 |
| 77. | Addison | 51.8% | 18.7%(+33.0)#77 | 18.1%(+33.7)#3,255 |
| 78. | Madrid | 51.7% | 18.7%(+32.9)#78 | 18.1%(+33.6)#3,265 |
| 79. | West Haverstraw | 51.4% | 18.7%(+32.7)#79 | 18.1%(+33.3)#3,293 |
| 80. | Poestenkill | 51.4% | 18.7%(+32.6)#80 | 18.1%(+33.3)#3,299 |
| 81. | South Blooming Grove | 51.2% | 18.7%(+32.5)#81 | 18.1%(+33.1)#3,311 |
| 82. | St Johnsville | 50.9% | 18.7%(+32.1)#82 | 18.1%(+32.8)#3,336 |
| 83. | Malone | 50.5% | 18.7%(+31.7)#83 | 18.1%(+32.4)#3,369 |
| 84. | Troy | 50.1% | 18.7%(+31.3)#84 | 18.1%(+32.0)#3,393 |
| 85. | Sand Ridge | 50.0% | 18.7%(+31.3)#85 | 18.1%(+31.9)#3,421 |
| 86. | Belfast | 50.0% | 18.7%(+31.3)#86 | 18.1%(+31.9)#3,436 |
| 87. | South Dayton | 50.0% | 18.7%(+31.3)#87 | 18.1%(+31.9)#3,441 |
| 88. | Panama | 50.0% | 18.7%(+31.3)#88 | 18.1%(+31.9)#3,461 |
| 89. | Lisle | 50.0% | 18.7%(+31.3)#89 | 18.1%(+31.9)#3,516 |
| 90. | Deposit | 49.3% | 18.7%(+30.5)#90 | 18.1%(+31.2)#3,620 |
| 91. | Phoenix | 49.1% | 18.7%(+30.4)#91 | 18.1%(+31.1)#3,631 |
| 92. | Fort Plain | 48.7% | 18.7%(+29.9)#92 | 18.1%(+30.6)#3,677 |
| 93. | Mayfield | 48.2% | 18.7%(+29.4)#93 | 18.1%(+30.1)#3,729 |
| 94. | Edwards | 48.0% | 18.7%(+29.3)#94 | 18.1%(+29.9)#3,753 |
| 95. | Barker | 47.9% | 18.7%(+29.2)#95 | 18.1%(+29.9)#3,764 |
| 96. | Valatie | 47.5% | 18.7%(+28.7)#96 | 18.1%(+29.4)#3,809 |
| 97. | Leicester | 47.4% | 18.7%(+28.6)#97 | 18.1%(+29.3)#3,822 |
| 98. | Granville | 47.0% | 18.7%(+28.2)#98 | 18.1%(+28.9)#3,878 |
| 99. | Cohocton | 46.6% | 18.7%(+27.8)#99 | 18.1%(+28.5)#3,934 |
| 100. | Greenwood Lake | 46.2% | 18.7%(+27.5)#100 | 18.1%(+28.1)#3,980 |
Common Questions
What are the Top 10 Cities with the Highest Poverty Level Among Children Under the Age of 5 in New York?
Top 10 Cities with the Highest Poverty Level Among Children Under the Age of 5 in New York are:
#1
100.0%
#2
100.0%
#3
100.0%
#4
100.0%
#5
100.0%
#6
100.0%
#7
100.0%
#8
100.0%
#9
93.3%
#10
93.3%
What city has the Highest Poverty Level Among Children Under the Age of 5 in New York?
Mineville has the Highest Poverty Level Among Children Under the Age of 5 in New York with 100.0%.
What is the Poverty Level Among Children Under the Age of 5 in the State of New York?
Poverty Level Among Children Under the Age of 5 in New York is 18.7%.
What is the Poverty Level Among Children Under the Age of 5 in the United States?
Poverty Level Among Children Under the Age of 5 in the United States is 18.1%.