Cities with the Highest Poverty Level Among Children Under the Age of 5 in Arizona
RELATED REPORTS & OPTIONS
Highest Poverty | Child 0-5
Arizona
Compare Cities
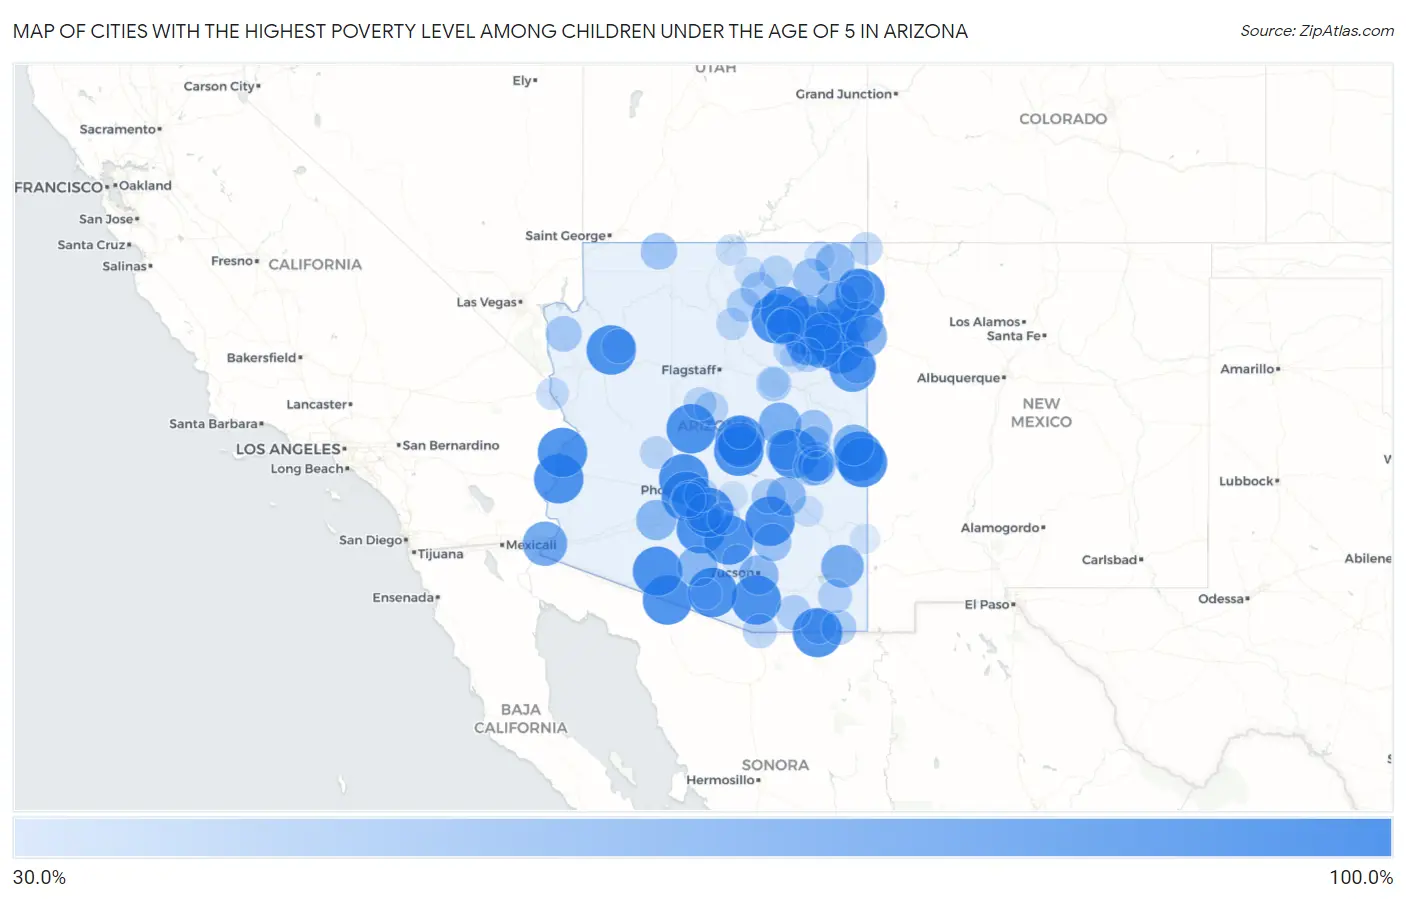
Map of Cities with the Highest Poverty Level Among Children Under the Age of 5 in Arizona
0.0%
100.0%
Cities with the Highest Poverty Level Among Children Under the Age of 5 in Arizona
| City | Child Poverty | vs State | vs National | |
| 1. | Sun City | 100.0% | 19.3%(+80.7)#1 | 18.1%(+81.9)#1 |
| 2. | Green Valley | 100.0% | 19.3%(+80.7)#2 | 18.1%(+81.9)#2 |
| 3. | Spring Valley | 100.0% | 19.3%(+80.7)#3 | 18.1%(+81.9)#92 |
| 4. | Naco | 100.0% | 19.3%(+80.7)#4 | 18.1%(+81.9)#136 |
| 5. | Ehrenberg | 100.0% | 19.3%(+80.7)#5 | 18.1%(+81.9)#163 |
| 6. | Hotevilla Bacavi | 100.0% | 19.3%(+80.7)#6 | 18.1%(+81.9)#248 |
| 7. | Maricopa Colony | 100.0% | 19.3%(+80.7)#7 | 18.1%(+81.9)#270 |
| 8. | Round Valley | 100.0% | 19.3%(+80.7)#8 | 18.1%(+81.9)#311 |
| 9. | Stanfield | 100.0% | 19.3%(+80.7)#9 | 18.1%(+81.9)#334 |
| 10. | Nutrioso | 100.0% | 19.3%(+80.7)#10 | 18.1%(+81.9)#362 |
| 11. | Picacho | 100.0% | 19.3%(+80.7)#11 | 18.1%(+81.9)#461 |
| 12. | Carrizo | 100.0% | 19.3%(+80.7)#12 | 18.1%(+81.9)#469 |
| 13. | Cornfields | 100.0% | 19.3%(+80.7)#13 | 18.1%(+81.9)#473 |
| 14. | Winkelman | 100.0% | 19.3%(+80.7)#14 | 18.1%(+81.9)#501 |
| 15. | Jeddito | 100.0% | 19.3%(+80.7)#15 | 18.1%(+81.9)#561 |
| 16. | Jakes Corner | 100.0% | 19.3%(+80.7)#16 | 18.1%(+81.9)#569 |
| 17. | Klagetoh | 100.0% | 19.3%(+80.7)#17 | 18.1%(+81.9)#628 |
| 18. | Sehili | 100.0% | 19.3%(+80.7)#18 | 18.1%(+81.9)#646 |
| 19. | Poston | 100.0% | 19.3%(+80.7)#19 | 18.1%(+81.9)#662 |
| 20. | Alpine | 100.0% | 19.3%(+80.7)#20 | 18.1%(+81.9)#682 |
| 21. | Ali Chuk | 100.0% | 19.3%(+80.7)#21 | 18.1%(+81.9)#713 |
| 22. | Hard Rock | 100.0% | 19.3%(+80.7)#22 | 18.1%(+81.9)#719 |
| 23. | Sweet Water Village | 100.0% | 19.3%(+80.7)#23 | 18.1%(+81.9)#724 |
| 24. | Truxton | 100.0% | 19.3%(+80.7)#24 | 18.1%(+81.9)#747 |
| 25. | Why | 100.0% | 19.3%(+80.7)#25 | 18.1%(+81.9)#754 |
| 26. | Chiawuli Tak | 100.0% | 19.3%(+80.7)#26 | 18.1%(+81.9)#781 |
| 27. | Sanders | 89.7% | 19.3%(+70.4)#27 | 18.1%(+71.7)#1,033 |
| 28. | Whitecone | 88.4% | 19.3%(+69.1)#28 | 18.1%(+70.3)#1,053 |
| 29. | Burnside | 86.1% | 19.3%(+66.8)#29 | 18.1%(+68.0)#1,125 |
| 30. | Gisela | 83.8% | 19.3%(+64.5)#30 | 18.1%(+65.7)#1,197 |
| 31. | Wall Lane | 83.3% | 19.3%(+64.0)#31 | 18.1%(+65.3)#1,216 |
| 32. | Nazlini | 82.9% | 19.3%(+63.6)#32 | 18.1%(+64.8)#1,241 |
| 33. | Low Mountain | 82.6% | 19.3%(+63.3)#33 | 18.1%(+64.5)#1,246 |
| 34. | Sawmill | 80.0% | 19.3%(+60.7)#34 | 18.1%(+61.9)#1,321 |
| 35. | Greasewood | 80.0% | 19.3%(+60.7)#35 | 18.1%(+61.9)#1,342 |
| 36. | Chinle | 78.0% | 19.3%(+58.7)#36 | 18.1%(+59.9)#1,404 |
| 37. | Bowie | 77.8% | 19.3%(+58.5)#37 | 18.1%(+59.7)#1,412 |
| 38. | Heber Overgaard | 77.1% | 19.3%(+57.8)#38 | 18.1%(+59.0)#1,443 |
| 39. | Window Rock | 73.9% | 19.3%(+54.6)#39 | 18.1%(+55.9)#1,587 |
| 40. | Eagar | 72.5% | 19.3%(+53.2)#40 | 18.1%(+54.4)#1,657 |
| 41. | Santa Rosa | 70.0% | 19.3%(+50.7)#41 | 18.1%(+51.9)#1,777 |
| 42. | Gila Bend | 69.9% | 19.3%(+50.6)#42 | 18.1%(+51.8)#1,792 |
| 43. | Cibecue | 69.7% | 19.3%(+50.4)#43 | 18.1%(+51.6)#1,801 |
| 44. | South Tucson | 68.0% | 19.3%(+48.7)#44 | 18.1%(+49.9)#1,895 |
| 45. | San Carlos | 67.6% | 19.3%(+48.3)#45 | 18.1%(+49.5)#1,922 |
| 46. | Rainbow City | 67.4% | 19.3%(+48.1)#46 | 18.1%(+49.3)#1,936 |
| 47. | Rock Point | 65.6% | 19.3%(+46.3)#47 | 18.1%(+47.6)#2,072 |
| 48. | Komatke | 65.5% | 19.3%(+46.2)#48 | 18.1%(+47.5)#2,077 |
| 49. | Second Mesa | 64.8% | 19.3%(+45.5)#49 | 18.1%(+46.7)#2,127 |
| 50. | Seven Mile | 63.8% | 19.3%(+44.5)#50 | 18.1%(+45.8)#2,195 |
| 51. | Casa Blanca | 62.7% | 19.3%(+43.4)#51 | 18.1%(+44.6)#2,278 |
| 52. | Chilchinbito | 61.4% | 19.3%(+42.1)#52 | 18.1%(+43.3)#2,394 |
| 53. | Mammoth | 61.2% | 19.3%(+41.9)#53 | 18.1%(+43.2)#2,406 |
| 54. | White Mountain Lake | 61.1% | 19.3%(+41.8)#54 | 18.1%(+43.1)#2,410 |
| 55. | Houck | 60.0% | 19.3%(+40.7)#55 | 18.1%(+41.9)#2,503 |
| 56. | Steamboat | 60.0% | 19.3%(+40.7)#56 | 18.1%(+41.9)#2,518 |
| 57. | Kaibab | 58.3% | 19.3%(+39.0)#57 | 18.1%(+40.3)#2,674 |
| 58. | Canyon Day | 56.6% | 19.3%(+37.3)#58 | 18.1%(+38.6)#2,808 |
| 59. | Whiteriver | 56.4% | 19.3%(+37.1)#59 | 18.1%(+38.3)#2,828 |
| 60. | Tonalea | 56.2% | 19.3%(+36.9)#60 | 18.1%(+38.2)#2,845 |
| 61. | White Hills | 55.6% | 19.3%(+36.3)#61 | 18.1%(+37.5)#2,922 |
| 62. | Bisbee | 54.1% | 19.3%(+34.8)#62 | 18.1%(+36.0)#3,027 |
| 63. | Shongopovi | 53.2% | 19.3%(+33.9)#63 | 18.1%(+35.1)#3,124 |
| 64. | Winslow West | 53.1% | 19.3%(+33.8)#64 | 18.1%(+35.1)#3,132 |
| 65. | Douglas | 53.0% | 19.3%(+33.7)#65 | 18.1%(+34.9)#3,137 |
| 66. | Huachuca City | 52.4% | 19.3%(+33.1)#66 | 18.1%(+34.3)#3,193 |
| 67. | Six Shooter Canyon | 52.1% | 19.3%(+32.8)#67 | 18.1%(+34.0)#3,226 |
| 68. | Lukachukai | 51.2% | 19.3%(+31.9)#68 | 18.1%(+33.1)#3,316 |
| 69. | Moenkopi | 50.9% | 19.3%(+31.6)#69 | 18.1%(+32.8)#3,331 |
| 70. | Peach Springs | 50.7% | 19.3%(+31.4)#70 | 18.1%(+32.7)#3,348 |
| 71. | Nogales | 50.5% | 19.3%(+31.2)#71 | 18.1%(+32.4)#3,366 |
| 72. | Guadalupe | 50.2% | 19.3%(+30.9)#72 | 18.1%(+32.1)#3,390 |
| 73. | Tsaile | 50.0% | 19.3%(+30.7)#73 | 18.1%(+31.9)#3,414 |
| 74. | St Johns | 50.0% | 19.3%(+30.7)#74 | 18.1%(+31.9)#3,464 |
| 75. | Indian Wells | 50.0% | 19.3%(+30.7)#75 | 18.1%(+31.9)#3,485 |
| 76. | Sunizona | 50.0% | 19.3%(+30.7)#76 | 18.1%(+31.9)#3,520 |
| 77. | Shonto | 49.0% | 19.3%(+29.7)#77 | 18.1%(+30.9)#3,645 |
| 78. | Lake Montezuma | 48.8% | 19.3%(+29.5)#78 | 18.1%(+30.8)#3,659 |
| 79. | Kaibab Estates West | 47.9% | 19.3%(+28.6)#79 | 18.1%(+29.9)#3,762 |
| 80. | Cottonwood | 47.4% | 19.3%(+28.1)#80 | 18.1%(+29.3)#3,826 |
| 81. | Mesa Del Caballo | 47.3% | 19.3%(+28.0)#81 | 18.1%(+29.3)#3,831 |
| 82. | Wickenburg | 46.9% | 19.3%(+27.6)#82 | 18.1%(+28.9)#3,886 |
| 83. | Teec Nos Pos | 46.7% | 19.3%(+27.4)#83 | 18.1%(+28.6)#3,918 |
| 84. | Tees Toh | 46.7% | 19.3%(+27.4)#84 | 18.1%(+28.6)#3,923 |
| 85. | Blackwater | 46.5% | 19.3%(+27.2)#85 | 18.1%(+28.4)#3,950 |
| 86. | Cameron | 45.5% | 19.3%(+26.2)#86 | 18.1%(+27.4)#4,085 |
| 87. | Arizona Village | 44.7% | 19.3%(+25.4)#87 | 18.1%(+26.7)#4,181 |
| 88. | Pinetop Lakeside | 43.7% | 19.3%(+24.4)#88 | 18.1%(+25.6)#4,342 |
| 89. | Lake Of The Woods | 43.2% | 19.3%(+23.9)#89 | 18.1%(+25.2)#4,398 |
| 90. | Sells | 41.2% | 19.3%(+21.9)#90 | 18.1%(+23.2)#4,692 |
| 91. | Lechee | 41.0% | 19.3%(+21.7)#91 | 18.1%(+22.9)#4,727 |
| 92. | Bylas | 40.7% | 19.3%(+21.4)#92 | 18.1%(+22.6)#4,769 |
| 93. | Avra Valley | 40.2% | 19.3%(+20.9)#93 | 18.1%(+22.2)#4,824 |
| 94. | Kaibito | 40.2% | 19.3%(+20.9)#94 | 18.1%(+22.1)#4,829 |
| 95. | Dilkon | 40.0% | 19.3%(+20.7)#95 | 18.1%(+21.9)#4,854 |
| 96. | Dennehotso | 38.9% | 19.3%(+19.6)#96 | 18.1%(+20.8)#5,083 |
| 97. | East Fork | 38.9% | 19.3%(+19.6)#97 | 18.1%(+20.8)#5,086 |
| 98. | Gold Canyon | 38.3% | 19.3%(+19.0)#98 | 18.1%(+20.2)#5,180 |
| 99. | Winslow | 37.9% | 19.3%(+18.6)#99 | 18.1%(+19.9)#5,227 |
| 100. | Duncan | 37.7% | 19.3%(+18.4)#100 | 18.1%(+19.6)#5,278 |
Common Questions
What are the Top 10 Cities with the Highest Poverty Level Among Children Under the Age of 5 in Arizona?
Top 10 Cities with the Highest Poverty Level Among Children Under the Age of 5 in Arizona are:
#1
100.0%
#2
100.0%
#3
100.0%
#4
100.0%
#5
100.0%
#6
100.0%
#7
100.0%
#8
100.0%
#9
100.0%
#10
100.0%
What city has the Highest Poverty Level Among Children Under the Age of 5 in Arizona?
Sun City has the Highest Poverty Level Among Children Under the Age of 5 in Arizona with 100.0%.
What is the Poverty Level Among Children Under the Age of 5 in the State of Arizona?
Poverty Level Among Children Under the Age of 5 in Arizona is 19.3%.
What is the Poverty Level Among Children Under the Age of 5 in the United States?
Poverty Level Among Children Under the Age of 5 in the United States is 18.1%.