Cities with the Highest Poverty Level Among Children Under the Age of 5 in Texas
RELATED REPORTS & OPTIONS
Highest Poverty | Child 0-5
Texas
Compare Cities
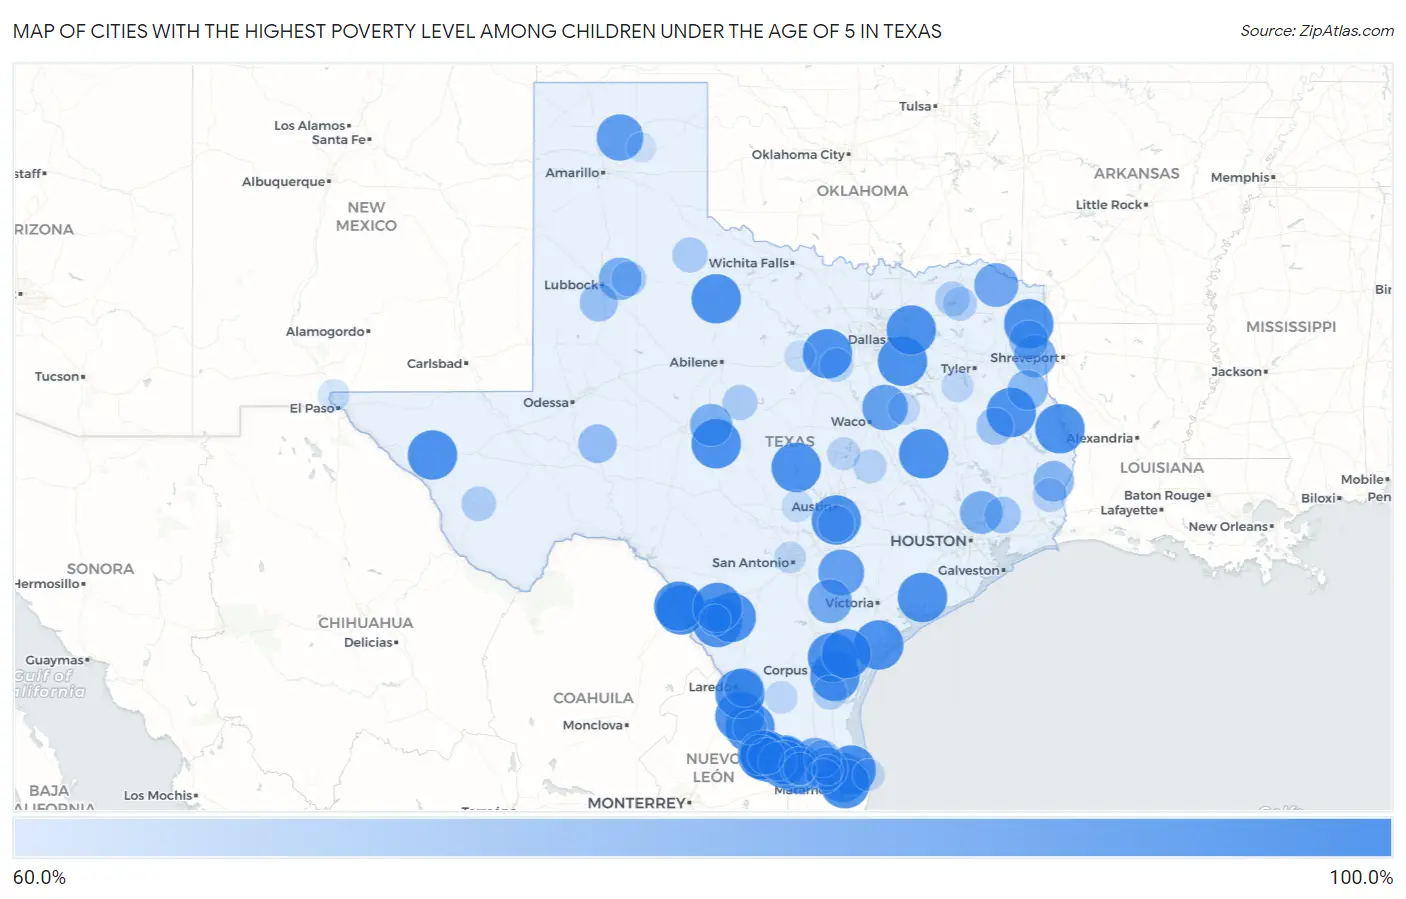
Map of Cities with the Highest Poverty Level Among Children Under the Age of 5 in Texas
0.0%
100.0%
Cities with the Highest Poverty Level Among Children Under the Age of 5 in Texas
| City | Child Poverty | vs State | vs National | |
| 1. | Van Horn | 100.0% | 21.1%(+78.9)#1 | 18.1%(+81.9)#49 |
| 2. | Abram | 100.0% | 21.1%(+78.9)#2 | 18.1%(+81.9)#54 |
| 3. | Eden | 100.0% | 21.1%(+78.9)#3 | 18.1%(+81.9)#63 |
| 4. | Cesar Chavez | 100.0% | 21.1%(+78.9)#4 | 18.1%(+81.9)#64 |
| 5. | Linden | 100.0% | 21.1%(+78.9)#5 | 18.1%(+81.9)#73 |
| 6. | Lamar | 100.0% | 21.1%(+78.9)#6 | 18.1%(+81.9)#88 |
| 7. | Milam | 100.0% | 21.1%(+78.9)#7 | 18.1%(+81.9)#89 |
| 8. | Palmer | 100.0% | 21.1%(+78.9)#8 | 18.1%(+81.9)#91 |
| 9. | Sargent | 100.0% | 21.1%(+78.9)#9 | 18.1%(+81.9)#127 |
| 10. | Carrizo Hill | 100.0% | 21.1%(+78.9)#10 | 18.1%(+81.9)#128 |
| 11. | Las Quintas Fronterizas | 100.0% | 21.1%(+78.9)#11 | 18.1%(+81.9)#156 |
| 12. | Mi Ranchito Estate | 100.0% | 21.1%(+78.9)#12 | 18.1%(+81.9)#158 |
| 13. | Falcon Lake Estates | 100.0% | 21.1%(+78.9)#13 | 18.1%(+81.9)#160 |
| 14. | Fabrica | 100.0% | 21.1%(+78.9)#14 | 18.1%(+81.9)#187 |
| 15. | Horseshoe Bend | 100.0% | 21.1%(+78.9)#15 | 18.1%(+81.9)#221 |
| 16. | Hilltop Lakes | 100.0% | 21.1%(+78.9)#16 | 18.1%(+81.9)#226 |
| 17. | La Tina Ranch | 100.0% | 21.1%(+78.9)#17 | 18.1%(+81.9)#230 |
| 18. | Driscoll | 100.0% | 21.1%(+78.9)#18 | 18.1%(+81.9)#232 |
| 19. | Grangerland | 100.0% | 21.1%(+78.9)#19 | 18.1%(+81.9)#247 |
| 20. | Bristol | 100.0% | 21.1%(+78.9)#20 | 18.1%(+81.9)#276 |
| 21. | San Ygnacio | 100.0% | 21.1%(+78.9)#21 | 18.1%(+81.9)#278 |
| 22. | Buchanan Lake Village | 100.0% | 21.1%(+78.9)#22 | 18.1%(+81.9)#297 |
| 23. | East Alto Bonito | 100.0% | 21.1%(+78.9)#23 | 18.1%(+81.9)#304 |
| 24. | Sandy Hollow Escondidas | 100.0% | 21.1%(+78.9)#24 | 18.1%(+81.9)#316 |
| 25. | Morgan Farm | 100.0% | 21.1%(+78.9)#25 | 18.1%(+81.9)#349 |
| 26. | Big Wells | 100.0% | 21.1%(+78.9)#26 | 18.1%(+81.9)#352 |
| 27. | Creedmoor | 100.0% | 21.1%(+78.9)#27 | 18.1%(+81.9)#364 |
| 28. | San Pedro | 100.0% | 21.1%(+78.9)#28 | 18.1%(+81.9)#399 |
| 29. | Redfield | 100.0% | 21.1%(+78.9)#29 | 18.1%(+81.9)#412 |
| 30. | Blessing | 100.0% | 21.1%(+78.9)#30 | 18.1%(+81.9)#415 |
| 31. | Barrera | 100.0% | 21.1%(+78.9)#31 | 18.1%(+81.9)#420 |
| 32. | Eugenio Saenz | 100.0% | 21.1%(+78.9)#32 | 18.1%(+81.9)#443 |
| 33. | Mobile City | 100.0% | 21.1%(+78.9)#33 | 18.1%(+81.9)#476 |
| 34. | Hilltop Cdp Starr County | 100.0% | 21.1%(+78.9)#34 | 18.1%(+81.9)#477 |
| 35. | La Presa | 100.0% | 21.1%(+78.9)#35 | 18.1%(+81.9)#548 |
| 36. | Loma Grande | 100.0% | 21.1%(+78.9)#36 | 18.1%(+81.9)#563 |
| 37. | North Escobares | 100.0% | 21.1%(+78.9)#37 | 18.1%(+81.9)#587 |
| 38. | El Castillo | 100.0% | 21.1%(+78.9)#38 | 18.1%(+81.9)#683 |
| 39. | Loma Vista | 100.0% | 21.1%(+78.9)#39 | 18.1%(+81.9)#720 |
| 40. | Bledsoe | 100.0% | 21.1%(+78.9)#40 | 18.1%(+81.9)#751 |
| 41. | O Brien | 100.0% | 21.1%(+78.9)#41 | 18.1%(+81.9)#784 |
| 42. | Lopeno | 100.0% | 21.1%(+78.9)#42 | 18.1%(+81.9)#870 |
| 43. | Ramos | 100.0% | 21.1%(+78.9)#43 | 18.1%(+81.9)#897 |
| 44. | Rosanky | 95.1% | 21.1%(+74.0)#44 | 18.1%(+77.0)#936 |
| 45. | Sanford | 94.7% | 21.1%(+73.7)#45 | 18.1%(+76.7)#943 |
| 46. | Smiley | 93.8% | 21.1%(+72.7)#46 | 18.1%(+75.7)#953 |
| 47. | Mount Calm | 93.1% | 21.1%(+72.0)#47 | 18.1%(+75.0)#965 |
| 48. | Doolittle | 90.8% | 21.1%(+69.7)#48 | 18.1%(+72.7)#1,009 |
| 49. | Annona | 90.5% | 21.1%(+69.4)#49 | 18.1%(+72.4)#1,017 |
| 50. | Alto Bonito Heights | 90.3% | 21.1%(+69.2)#50 | 18.1%(+72.2)#1,020 |
| 51. | Kenedy | 90.2% | 21.1%(+69.2)#51 | 18.1%(+72.2)#1,023 |
| 52. | Indian Hills | 88.9% | 21.1%(+67.8)#52 | 18.1%(+70.8)#1,042 |
| 53. | Mcleod | 88.3% | 21.1%(+67.2)#53 | 18.1%(+70.3)#1,054 |
| 54. | Woodbranch | 88.0% | 21.1%(+66.9)#54 | 18.1%(+70.0)#1,061 |
| 55. | Lorenzo | 87.8% | 21.1%(+66.7)#55 | 18.1%(+69.7)#1,068 |
| 56. | Paint Rock | 87.5% | 21.1%(+66.4)#56 | 18.1%(+69.4)#1,078 |
| 57. | Scottsville | 87.5% | 21.1%(+66.4)#57 | 18.1%(+69.4)#1,080 |
| 58. | Fronton | 84.6% | 21.1%(+63.5)#58 | 18.1%(+66.6)#1,167 |
| 59. | Kirbyville | 84.3% | 21.1%(+63.3)#59 | 18.1%(+66.3)#1,179 |
| 60. | Gary City | 83.3% | 21.1%(+62.2)#60 | 18.1%(+65.3)#1,220 |
| 61. | Salida Del Sol Estates | 82.5% | 21.1%(+61.4)#61 | 18.1%(+64.5)#1,249 |
| 62. | Jefferson | 81.9% | 21.1%(+60.8)#62 | 18.1%(+63.8)#1,263 |
| 63. | Ranchitos East | 81.6% | 21.1%(+60.5)#63 | 18.1%(+63.5)#1,280 |
| 64. | El Refugio | 81.5% | 21.1%(+60.4)#64 | 18.1%(+63.4)#1,282 |
| 65. | Perezville | 81.3% | 21.1%(+60.2)#65 | 18.1%(+63.3)#1,285 |
| 66. | Rankin | 81.0% | 21.1%(+59.9)#66 | 18.1%(+62.9)#1,297 |
| 67. | New Home | 80.0% | 21.1%(+58.9)#67 | 18.1%(+61.9)#1,333 |
| 68. | Lockett | 80.0% | 21.1%(+58.9)#68 | 18.1%(+61.9)#1,339 |
| 69. | Monte Alto | 78.8% | 21.1%(+57.7)#69 | 18.1%(+60.8)#1,379 |
| 70. | Escobares | 78.7% | 21.1%(+57.6)#70 | 18.1%(+60.6)#1,383 |
| 71. | Wells | 78.5% | 21.1%(+57.4)#71 | 18.1%(+60.4)#1,390 |
| 72. | Niederwald | 77.8% | 21.1%(+56.7)#72 | 18.1%(+59.7)#1,409 |
| 73. | Dayton Lakes | 77.8% | 21.1%(+56.7)#73 | 18.1%(+59.7)#1,420 |
| 74. | Paducah | 75.2% | 21.1%(+54.2)#74 | 18.1%(+57.2)#1,505 |
| 75. | Coleman | 75.1% | 21.1%(+54.0)#75 | 18.1%(+57.0)#1,509 |
| 76. | Ralls | 75.0% | 21.1%(+53.9)#76 | 18.1%(+56.9)#1,512 |
| 77. | Progreso | 74.9% | 21.1%(+53.8)#77 | 18.1%(+56.8)#1,561 |
| 78. | Marfa | 74.3% | 21.1%(+53.2)#78 | 18.1%(+56.2)#1,572 |
| 79. | Cooper | 74.2% | 21.1%(+53.1)#79 | 18.1%(+56.1)#1,576 |
| 80. | Ricardo | 73.8% | 21.1%(+52.7)#80 | 18.1%(+55.7)#1,598 |
| 81. | Buna | 73.6% | 21.1%(+52.5)#81 | 18.1%(+55.5)#1,609 |
| 82. | Siesta Shores | 73.4% | 21.1%(+52.3)#82 | 18.1%(+55.3)#1,617 |
| 83. | Tira | 73.3% | 21.1%(+52.2)#83 | 18.1%(+55.3)#1,621 |
| 84. | Canyon Creek | 72.6% | 21.1%(+51.5)#84 | 18.1%(+54.5)#1,653 |
| 85. | Buckholts | 72.3% | 21.1%(+51.3)#85 | 18.1%(+54.3)#1,661 |
| 86. | Nolanville | 71.7% | 21.1%(+50.7)#86 | 18.1%(+53.7)#1,681 |
| 87. | Hebbronville | 70.8% | 21.1%(+49.7)#87 | 18.1%(+52.8)#1,743 |
| 88. | Palmview South | 70.7% | 21.1%(+49.6)#88 | 18.1%(+52.7)#1,744 |
| 89. | Poynor | 70.0% | 21.1%(+48.9)#89 | 18.1%(+51.9)#1,780 |
| 90. | Tehuacana | 70.0% | 21.1%(+48.9)#90 | 18.1%(+51.9)#1,786 |
| 91. | Balcones Heights | 69.8% | 21.1%(+48.7)#91 | 18.1%(+51.7)#1,795 |
| 92. | South Padre Island | 69.7% | 21.1%(+48.7)#92 | 18.1%(+51.7)#1,797 |
| 93. | Rock Island | 69.2% | 21.1%(+48.1)#93 | 18.1%(+51.2)#1,832 |
| 94. | Johnson City | 69.1% | 21.1%(+48.1)#94 | 18.1%(+51.1)#1,840 |
| 95. | Westway | 69.0% | 21.1%(+47.9)#95 | 18.1%(+51.0)#1,845 |
| 96. | Gordon | 68.8% | 21.1%(+47.7)#96 | 18.1%(+50.7)#1,855 |
| 97. | Carrizo Springs | 68.5% | 21.1%(+47.4)#97 | 18.1%(+50.4)#1,869 |
| 98. | Heidelberg | 67.6% | 21.1%(+46.5)#98 | 18.1%(+49.5)#1,925 |
| 99. | The Homesteads | 67.0% | 21.1%(+46.0)#99 | 18.1%(+49.0)#1,954 |
| 100. | Skellytown | 66.7% | 21.1%(+45.6)#100 | 18.1%(+48.6)#1,991 |
Common Questions
What are the Top 10 Cities with the Highest Poverty Level Among Children Under the Age of 5 in Texas?
Top 10 Cities with the Highest Poverty Level Among Children Under the Age of 5 in Texas are:
#1
100.0%
#2
100.0%
#3
100.0%
#4
100.0%
#5
100.0%
#6
100.0%
#7
100.0%
#8
100.0%
#9
100.0%
#10
100.0%
What city has the Highest Poverty Level Among Children Under the Age of 5 in Texas?
Van Horn has the Highest Poverty Level Among Children Under the Age of 5 in Texas with 100.0%.
What is the Poverty Level Among Children Under the Age of 5 in the State of Texas?
Poverty Level Among Children Under the Age of 5 in Texas is 21.1%.
What is the Poverty Level Among Children Under the Age of 5 in the United States?
Poverty Level Among Children Under the Age of 5 in the United States is 18.1%.