Orosi, CA Map & Demographics
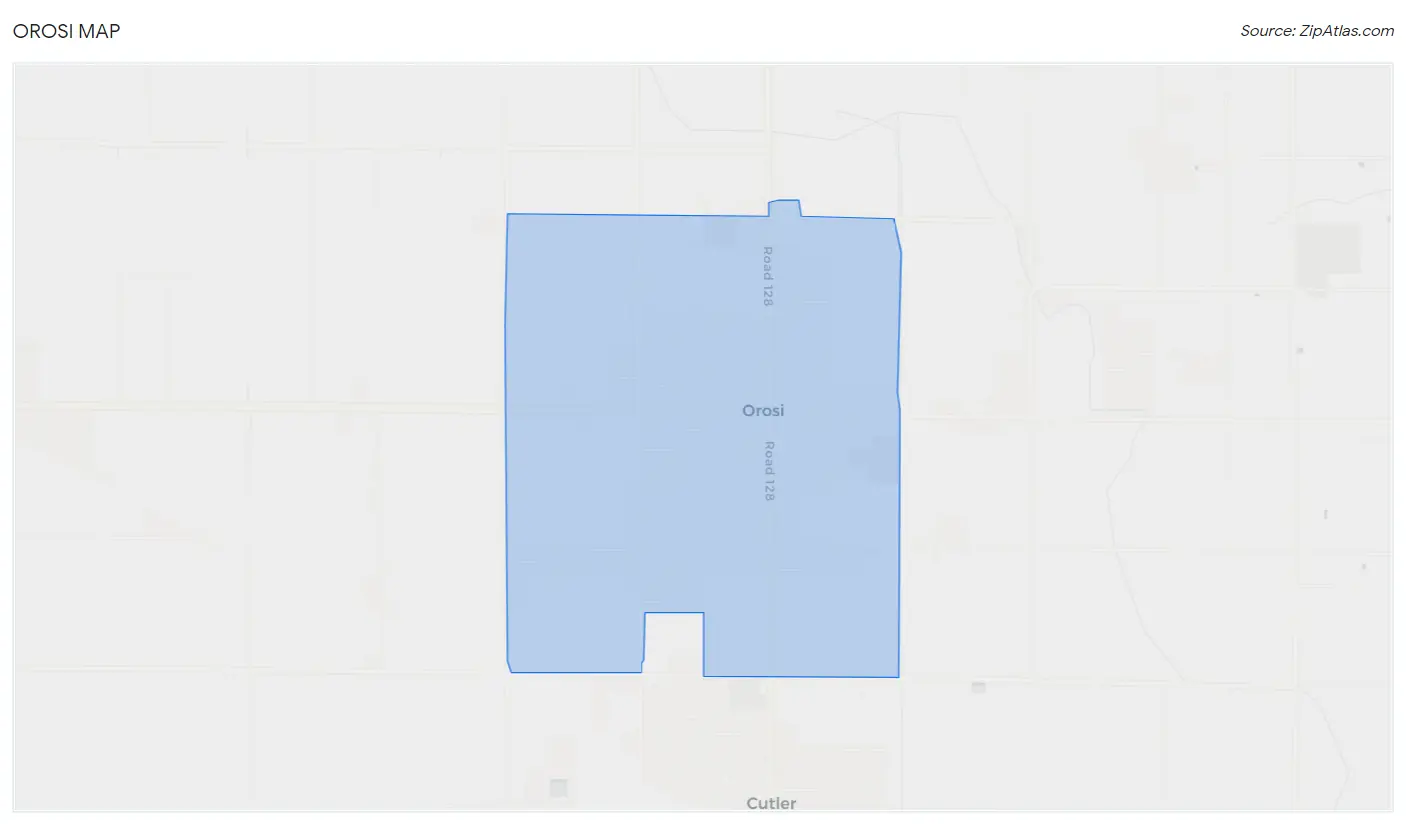
Orosi Map
Orosi Overview
$16,673
PER CAPITA INCOME
$48,558
AVG FAMILY INCOME
$52,692
AVG HOUSEHOLD INCOME
19.2%
WAGE / INCOME GAP [ % ]
80.8¢/ $1
WAGE / INCOME GAP [ $ ]
$9,616
FAMILY INCOME DEFICIT
0.40
INEQUALITY / GINI INDEX
9,100
TOTAL POPULATION
4,573
MALE POPULATION
4,527
FEMALE POPULATION
101.02
MALES / 100 FEMALES
98.99
FEMALES / 100 MALES
29.5
MEDIAN AGE
4.4
AVG FAMILY SIZE
4.3
AVG HOUSEHOLD SIZE
3,690
LABOR FORCE [ PEOPLE ]
57.6%
PERCENT IN LABOR FORCE
10.6%
UNEMPLOYMENT RATE
Orosi Zip Codes
Orosi Area Codes
Income in Orosi
Income Overview in Orosi
Per Capita Income in Orosi is $16,673, while median incomes of families and households are $48,558 and $52,692 respectively.
| Characteristic | Number | Measure |
| Per Capita Income | 9,100 | $16,673 |
| Median Family Income | 1,960 | $48,558 |
| Mean Family Income | 1,960 | $71,999 |
| Median Household Income | 2,104 | $52,692 |
| Mean Household Income | 2,104 | $75,411 |
| Income Deficit | 1,960 | $9,616 |
| Wage / Income Gap (%) | 9,100 | 19.22% |
| Wage / Income Gap ($) | 9,100 | 80.78¢ per $1 |
| Gini / Inequality Index | 9,100 | 0.40 |
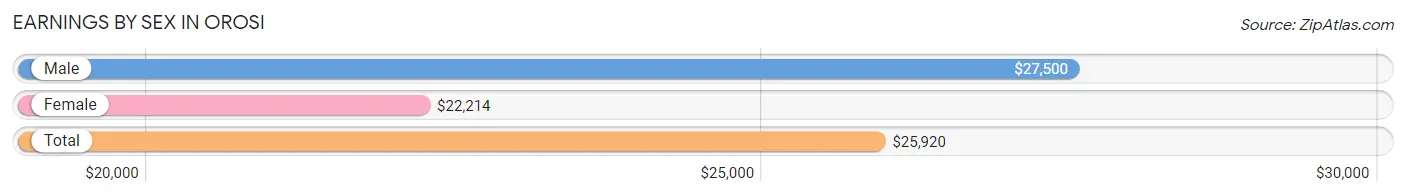
Earnings by Sex in Orosi
Average Earnings in Orosi are $25,920, $27,500 for men and $22,214 for women, a difference of 19.2%.
| Sex | Number | Average Earnings |
| Male | 2,172 (56.8%) | $27,500 |
| Female | 1,649 (43.2%) | $22,214 |
| Total | 3,821 (100.0%) | $25,920 |
Earnings by Sex by Income Bracket in Orosi
The most common earnings brackets in Orosi are $50,000 to $54,999 for men (361 | 16.6%) and $45,000 to $49,999 for women (354 | 21.5%).
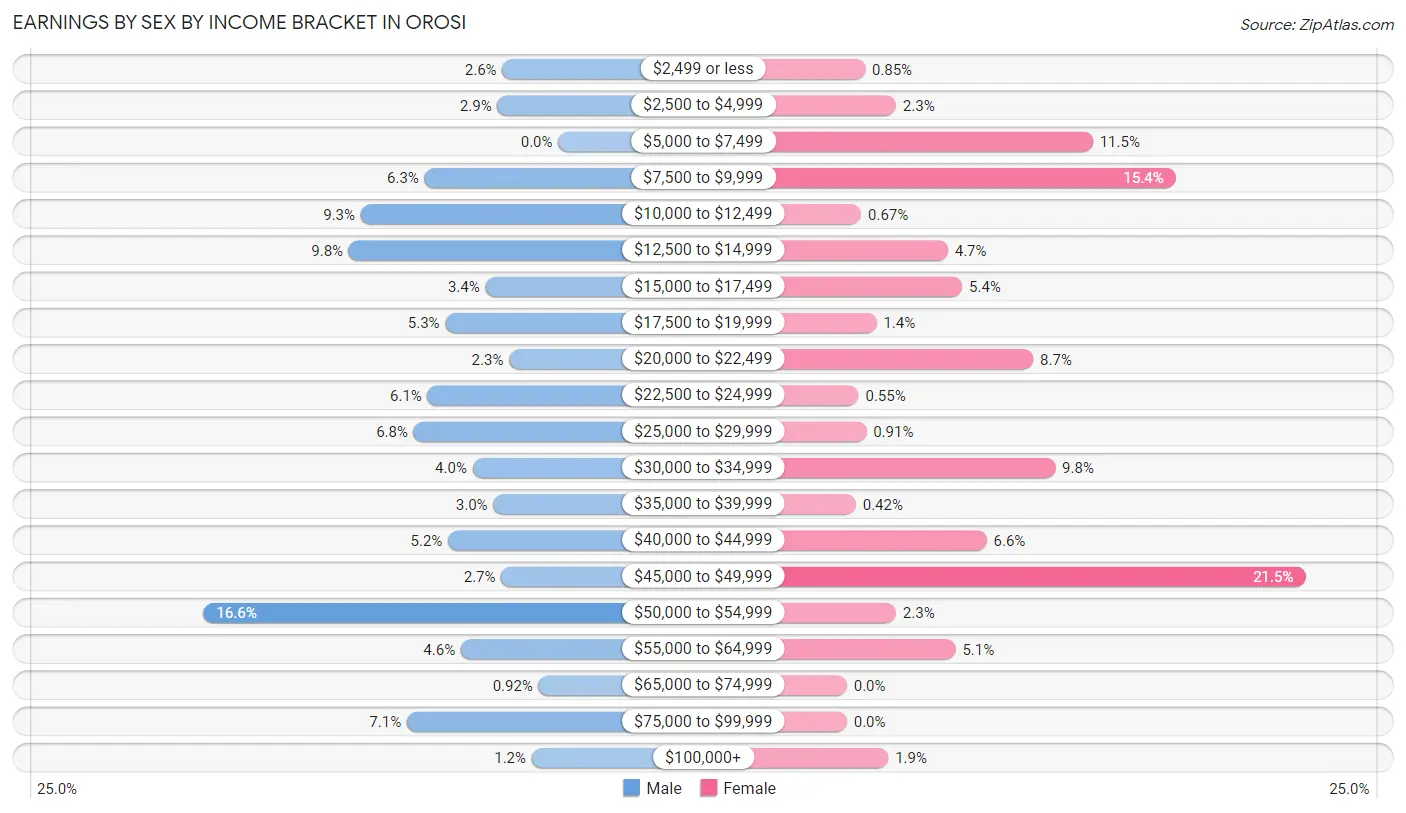
| Income | Male | Female |
| $2,499 or less | 57 (2.6%) | 14 (0.9%) |
| $2,500 to $4,999 | 62 (2.9%) | 38 (2.3%) |
| $5,000 to $7,499 | 0 (0.0%) | 190 (11.5%) |
| $7,500 to $9,999 | 136 (6.3%) | 254 (15.4%) |
| $10,000 to $12,499 | 201 (9.2%) | 11 (0.7%) |
| $12,500 to $14,999 | 213 (9.8%) | 78 (4.7%) |
| $15,000 to $17,499 | 74 (3.4%) | 89 (5.4%) |
| $17,500 to $19,999 | 115 (5.3%) | 23 (1.4%) |
| $20,000 to $22,499 | 50 (2.3%) | 144 (8.7%) |
| $22,500 to $24,999 | 133 (6.1%) | 9 (0.5%) |
| $25,000 to $29,999 | 147 (6.8%) | 15 (0.9%) |
| $30,000 to $34,999 | 87 (4.0%) | 161 (9.8%) |
| $35,000 to $39,999 | 66 (3.0%) | 7 (0.4%) |
| $40,000 to $44,999 | 112 (5.2%) | 108 (6.6%) |
| $45,000 to $49,999 | 58 (2.7%) | 354 (21.5%) |
| $50,000 to $54,999 | 361 (16.6%) | 38 (2.3%) |
| $55,000 to $64,999 | 99 (4.6%) | 84 (5.1%) |
| $65,000 to $74,999 | 20 (0.9%) | 0 (0.0%) |
| $75,000 to $99,999 | 154 (7.1%) | 0 (0.0%) |
| $100,000+ | 27 (1.2%) | 32 (1.9%) |
| Total | 2,172 (100.0%) | 1,649 (100.0%) |
Earnings by Sex by Educational Attainment in Orosi
Average earnings in Orosi are $34,253 for men and $30,682 for women, a difference of 10.4%. Men with an educational attainment of bachelor's degree enjoy the highest average annual earnings of $82,750, while those with less than high school education earn the least with $36,397. Women with an educational attainment of college or associate's degree earn the most with the average annual earnings of $45,199, while those with less than high school education have the smallest earnings of $9,203.
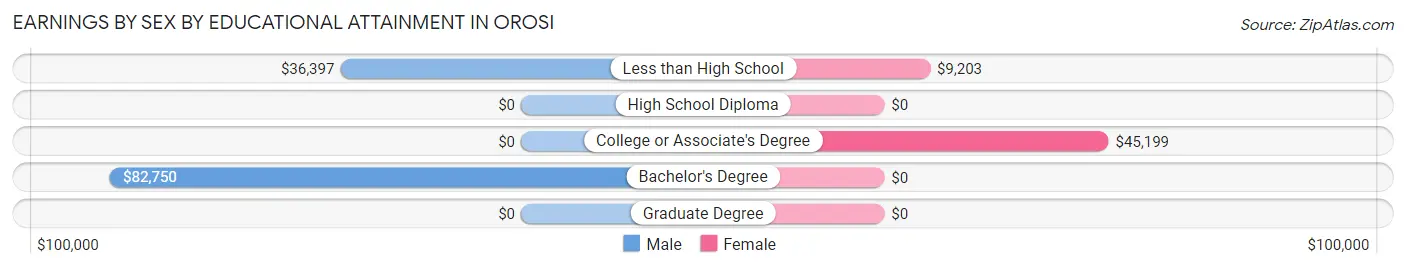
| Educational Attainment | Male Income | Female Income |
| Less than High School | $36,397 | $9,203 |
| High School Diploma | - | - |
| College or Associate's Degree | - | - |
| Bachelor's Degree | $82,750 | $0 |
| Graduate Degree | - | - |
| Total | $34,253 | $30,682 |
Family Income in Orosi
Family Income Brackets in Orosi
According to the Orosi family income data, there are 563 families falling into the $35,000 to $49,999 income range, which is the most common income bracket and makes up 28.7% of all families. Conversely, the $150,000 to $199,999 income bracket is the least frequent group with only 16 families (0.8%) belonging to this category.
| Income Bracket | # Families | % Families |
| Less than $10,000 | 41 | 2.1% |
| $10,000 to $14,999 | 63 | 3.2% |
| $15,000 to $24,999 | 304 | 15.5% |
| $25,000 to $34,999 | 84 | 4.3% |
| $35,000 to $49,999 | 563 | 28.7% |
| $50,000 to $74,999 | 319 | 16.3% |
| $75,000 to $99,999 | 171 | 8.7% |
| $100,000 to $149,999 | 239 | 12.2% |
| $150,000 to $199,999 | 16 | 0.8% |
| $200,000+ | 161 | 8.2% |
Family Income by Famaliy Size in Orosi
6-person families (203 | 10.4%) account for the highest median family income in Orosi with $75,573 per family, while 2-person families (330 | 16.8%) have the highest median income of $26,140 per family member.
| Income Bracket | # Families | Median Income |
| 2-Person Families | 330 (16.8%) | $52,279 |
| 3-Person Families | 416 (21.2%) | $46,282 |
| 4-Person Families | 507 (25.9%) | $29,152 |
| 5-Person Families | 264 (13.5%) | $73,990 |
| 6-Person Families | 203 (10.4%) | $75,573 |
| 7+ Person Families | 240 (12.2%) | $0 |
| Total | 1,960 (100.0%) | $48,558 |
Family Income by Number of Earners in Orosi
| Number of Earners | # Families | Median Income |
| No Earners | 109 (5.6%) | $0 |
| 1 Earner | 875 (44.6%) | $45,347 |
| 2 Earners | 600 (30.6%) | $70,643 |
| 3+ Earners | 376 (19.2%) | $107,647 |
| Total | 1,960 (100.0%) | $48,558 |
Household Income in Orosi
Household Income Brackets in Orosi
With 551 households falling in the category, the $35,000 to $49,999 income range is the most frequent in Orosi, accounting for 26.2% of all households. In contrast, only 42 households (2.0%) fall into the less than $10,000 income bracket, making it the least populous group.
| Income Bracket | # Households | % Households |
| Less than $10,000 | 42 | 2.0% |
| $10,000 to $14,999 | 44 | 2.1% |
| $15,000 to $24,999 | 250 | 11.9% |
| $25,000 to $34,999 | 126 | 6.0% |
| $35,000 to $49,999 | 551 | 26.2% |
| $50,000 to $74,999 | 446 | 21.2% |
| $75,000 to $99,999 | 179 | 8.5% |
| $100,000 to $149,999 | 240 | 11.4% |
| $150,000 to $199,999 | 63 | 3.0% |
| $200,000+ | 160 | 7.6% |
Household Income by Householder Age in Orosi
The median household income in Orosi is $52,692, with the highest median household income of $67,917 found in the 65+ years age bracket for the primary householder. A total of 385 households (18.3%) fall into this category. Meanwhile, the 15 to 24 years age bracket for the primary householder has the lowest median household income of $0, with 143 households (6.8%) in this group.
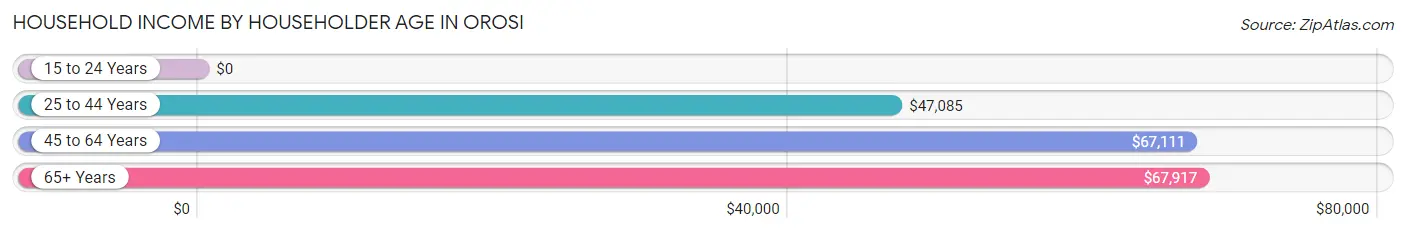
| Income Bracket | # Households | Median Income |
| 15 to 24 Years | 143 (6.8%) | $0 |
| 25 to 44 Years | 790 (37.6%) | $47,085 |
| 45 to 64 Years | 786 (37.4%) | $67,111 |
| 65+ Years | 385 (18.3%) | $67,917 |
| Total | 2,104 (100.0%) | $52,692 |
Poverty in Orosi
Income Below Poverty by Sex and Age in Orosi
With 25.1% poverty level for males and 26.7% for females among the residents of Orosi, under 5 year old males and under 5 year old females are the most vulnerable to poverty, with 349 males (64.0%) and 219 females (60.3%) in their respective age groups living below the poverty level.
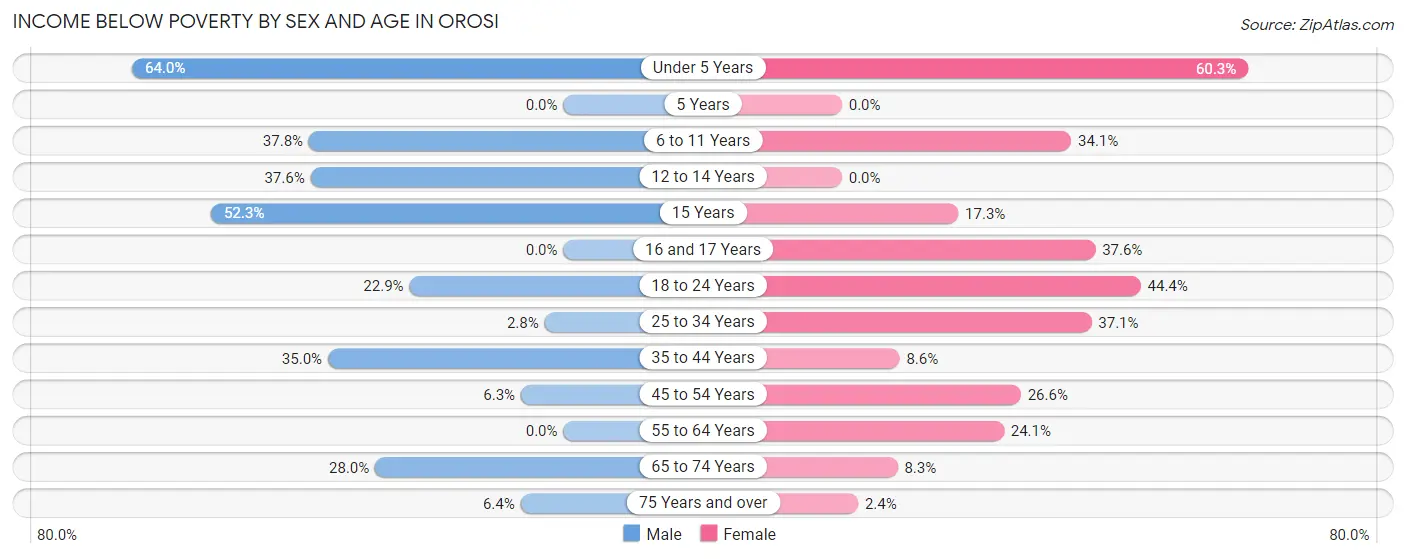
| Age Bracket | Male | Female |
| Under 5 Years | 349 (64.0%) | 219 (60.3%) |
| 5 Years | 0 (0.0%) | 0 (0.0%) |
| 6 to 11 Years | 150 (37.8%) | 189 (34.1%) |
| 12 to 14 Years | 92 (37.6%) | 0 (0.0%) |
| 15 Years | 79 (52.3%) | 14 (17.3%) |
| 16 and 17 Years | 0 (0.0%) | 35 (37.6%) |
| 18 to 24 Years | 128 (22.9%) | 209 (44.4%) |
| 25 to 34 Years | 18 (2.8%) | 229 (37.1%) |
| 35 to 44 Years | 244 (35.0%) | 57 (8.6%) |
| 45 to 54 Years | 32 (6.3%) | 127 (26.6%) |
| 55 to 64 Years | 0 (0.0%) | 90 (24.1%) |
| 65 to 74 Years | 45 (28.0%) | 34 (8.3%) |
| 75 Years and over | 12 (6.4%) | 5 (2.4%) |
| Total | 1,149 (25.1%) | 1,208 (26.7%) |
Income Above Poverty by Sex and Age in Orosi
According to the poverty statistics in Orosi, males aged 5 years and females aged 12 to 14 years are the age groups that are most secure financially, with 100.0% of males and 100.0% of females in these age groups living above the poverty line.
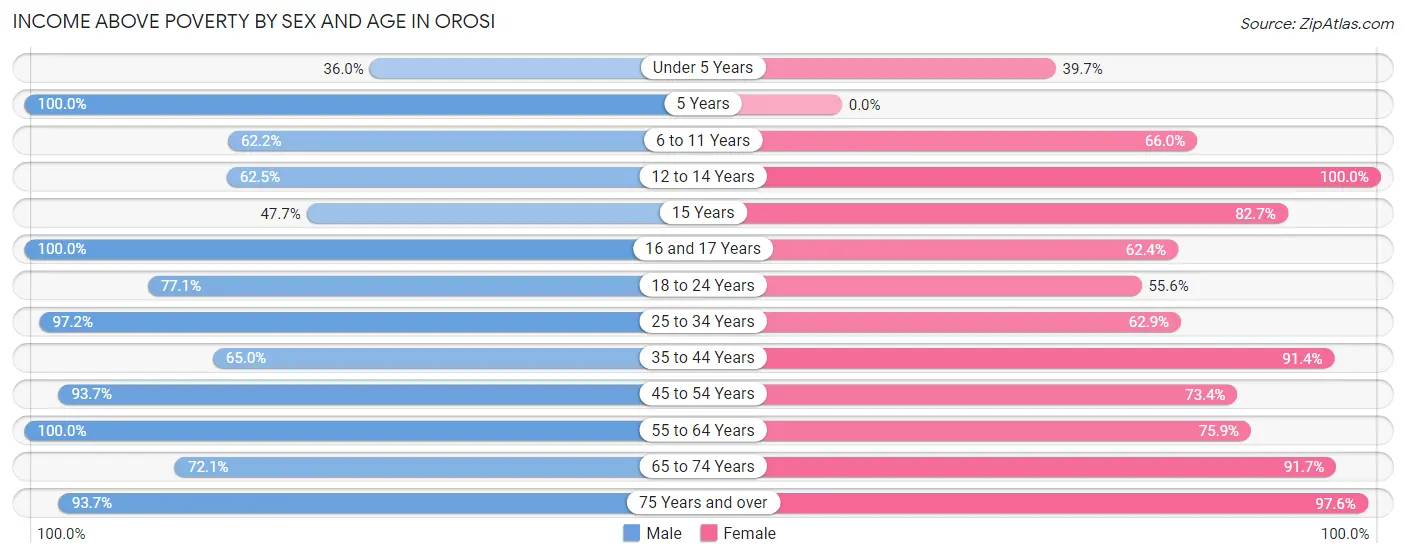
| Age Bracket | Male | Female |
| Under 5 Years | 196 (36.0%) | 144 (39.7%) |
| 5 Years | 147 (100.0%) | 0 (0.0%) |
| 6 to 11 Years | 247 (62.2%) | 366 (65.9%) |
| 12 to 14 Years | 153 (62.5%) | 209 (100.0%) |
| 15 Years | 72 (47.7%) | 67 (82.7%) |
| 16 and 17 Years | 120 (100.0%) | 58 (62.4%) |
| 18 to 24 Years | 432 (77.1%) | 262 (55.6%) |
| 25 to 34 Years | 628 (97.2%) | 389 (62.9%) |
| 35 to 44 Years | 454 (65.0%) | 609 (91.4%) |
| 45 to 54 Years | 476 (93.7%) | 351 (73.4%) |
| 55 to 64 Years | 206 (100.0%) | 284 (75.9%) |
| 65 to 74 Years | 116 (72.1%) | 377 (91.7%) |
| 75 Years and over | 177 (93.6%) | 203 (97.6%) |
| Total | 3,424 (74.9%) | 3,319 (73.3%) |
Income Below Poverty Among Married-Couple Families in Orosi
The poverty statistics for married-couple families in Orosi show that 22.6% or 263 of the total 1,162 families live below the poverty line. Families with 5 or more children have the highest poverty rate of 63.1%, comprising of 53 families. On the other hand, families with no children have the lowest poverty rate of 9.8%, which includes 45 families.
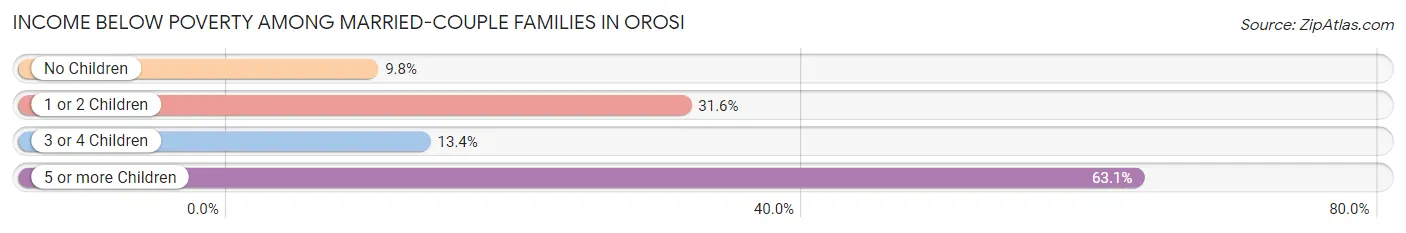
| Children | Above Poverty | Below Poverty |
| No Children | 416 (90.2%) | 45 (9.8%) |
| 1 or 2 Children | 310 (68.4%) | 143 (31.6%) |
| 3 or 4 Children | 142 (86.6%) | 22 (13.4%) |
| 5 or more Children | 31 (36.9%) | 53 (63.1%) |
| Total | 899 (77.4%) | 263 (22.6%) |
Income Below Poverty Among Single-Parent Households in Orosi
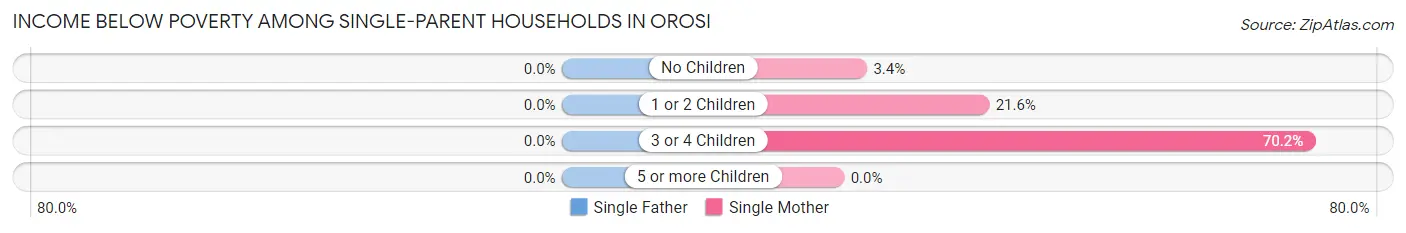
| Children | Single Father | Single Mother |
| No Children | 0 (0.0%) | 5 (3.4%) |
| 1 or 2 Children | 0 (0.0%) | 118 (21.6%) |
| 3 or 4 Children | 0 (0.0%) | 59 (70.2%) |
| 5 or more Children | 0 (0.0%) | 0 (0.0%) |
| Total | 0 (0.0%) | 182 (23.4%) |
Income Below Poverty Among Married-Couple vs Single-Parent Households in Orosi
The poverty data for Orosi shows that 263 of the married-couple family households (22.6%) and 182 of the single-parent households (22.8%) are living below the poverty level. Within the married-couple family households, those with 5 or more children have the highest poverty rate, with 53 households (63.1%) falling below the poverty line. Among the single-parent households, those with 3 or 4 children have the highest poverty rate, with 59 household (70.2%) living below poverty.
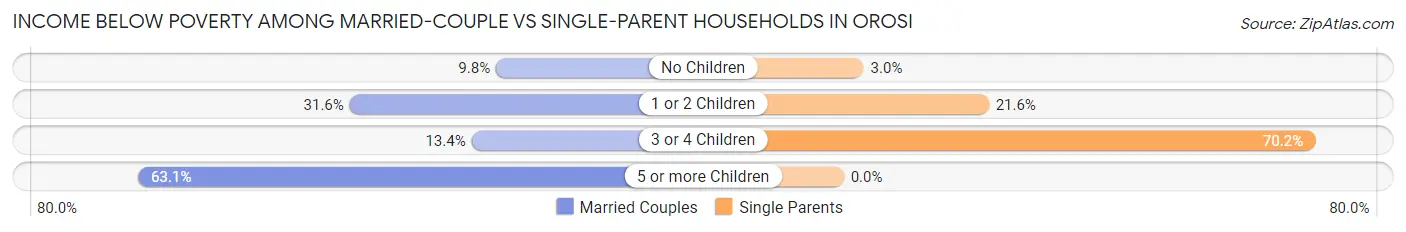
| Children | Married-Couple Families | Single-Parent Households |
| No Children | 45 (9.8%) | 5 (3.0%) |
| 1 or 2 Children | 143 (31.6%) | 118 (21.6%) |
| 3 or 4 Children | 22 (13.4%) | 59 (70.2%) |
| 5 or more Children | 53 (63.1%) | 0 (0.0%) |
| Total | 263 (22.6%) | 182 (22.8%) |
Race in Orosi
The most populous races in Orosi are Hispanic or Latino (8,143 | 89.5%), Some other Race (4,695 | 51.6%), and White / Caucasian (2,877 | 31.6%).
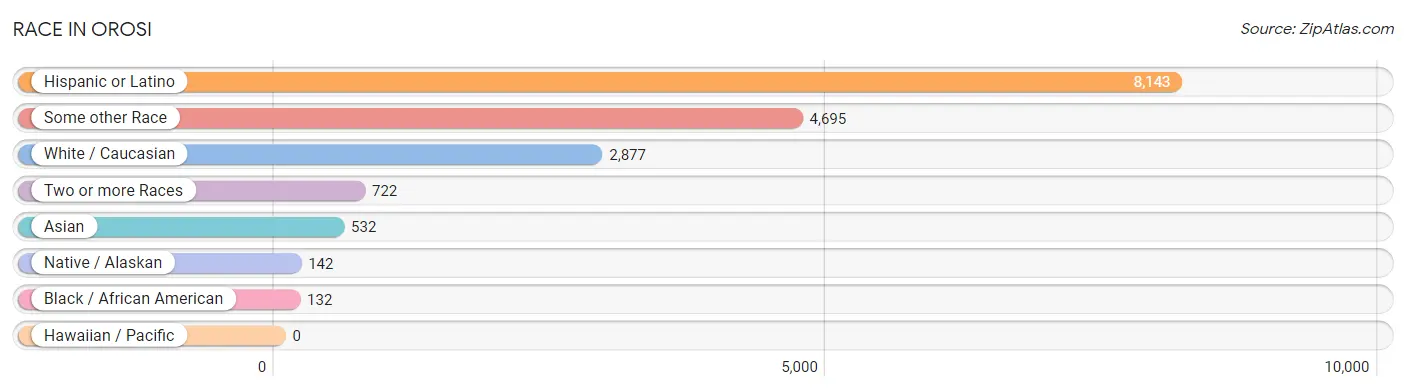
| Race | # Population | % Population |
| Asian | 532 | 5.9% |
| Black / African American | 132 | 1.5% |
| Hawaiian / Pacific | 0 | 0.0% |
| Hispanic or Latino | 8,143 | 89.5% |
| Native / Alaskan | 142 | 1.6% |
| White / Caucasian | 2,877 | 31.6% |
| Two or more Races | 722 | 7.9% |
| Some other Race | 4,695 | 51.6% |
| Total | 9,100 | 100.0% |
Ancestry in Orosi
The most populous ancestries reported in Orosi are Mexican (7,932 | 87.2%), Korean (627 | 6.9%), Central American (113 | 1.2%), Guatemalan (113 | 1.2%), and American (99 | 1.1%), together accounting for 97.6% of all Orosi residents.
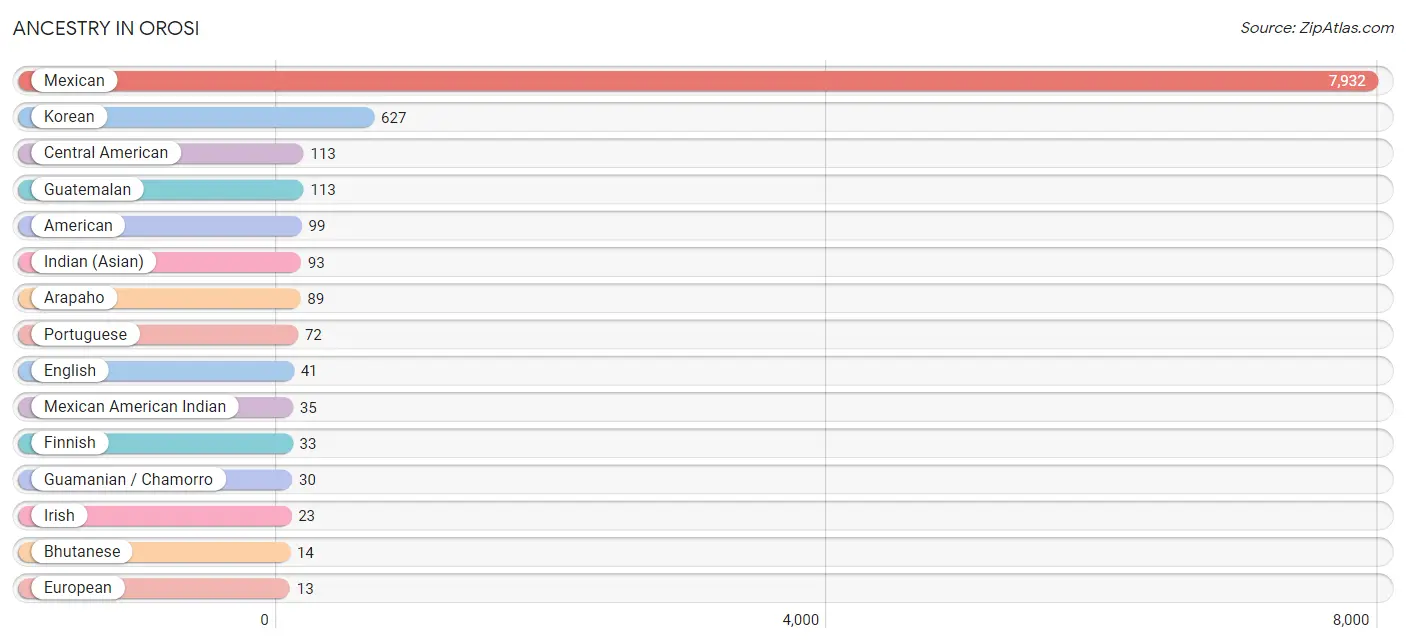
| Ancestry | # Population | % Population |
| American | 99 | 1.1% |
| Arapaho | 89 | 1.0% |
| Bhutanese | 14 | 0.2% |
| Central American | 113 | 1.2% |
| English | 41 | 0.4% |
| European | 13 | 0.1% |
| Finnish | 33 | 0.4% |
| Guamanian / Chamorro | 30 | 0.3% |
| Guatemalan | 113 | 1.2% |
| Indian (Asian) | 93 | 1.0% |
| Irish | 23 | 0.3% |
| Korean | 627 | 6.9% |
| Mexican | 7,932 | 87.2% |
| Mexican American Indian | 35 | 0.4% |
| Portuguese | 72 | 0.8% | View All 15 Rows |
Immigrants in Orosi
The most numerous immigrant groups reported in Orosi came from Central America (3,240 | 35.6%), Latin America (3,240 | 35.6%), Mexico (3,127 | 34.4%), Asia (219 | 2.4%), and Philippines (219 | 2.4%), together accounting for 110.4% of all Orosi residents.
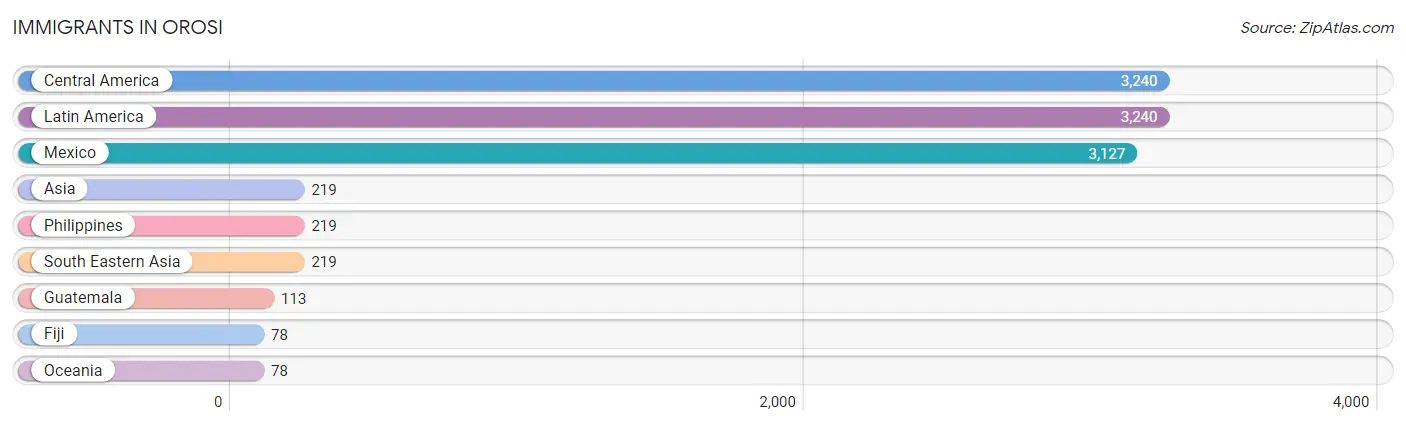
| Immigration Origin | # Population | % Population |
| Asia | 219 | 2.4% |
| Central America | 3,240 | 35.6% |
| Fiji | 78 | 0.9% |
| Guatemala | 113 | 1.2% |
| Latin America | 3,240 | 35.6% |
| Mexico | 3,127 | 34.4% |
| Oceania | 78 | 0.9% |
| Philippines | 219 | 2.4% |
| South Eastern Asia | 219 | 2.4% | View All 9 Rows |
Sex and Age in Orosi
Sex and Age in Orosi
The most populous age groups in Orosi are Under 5 Years (545 | 11.9%) for men and 5 to 9 Years (495 | 10.9%) for women.
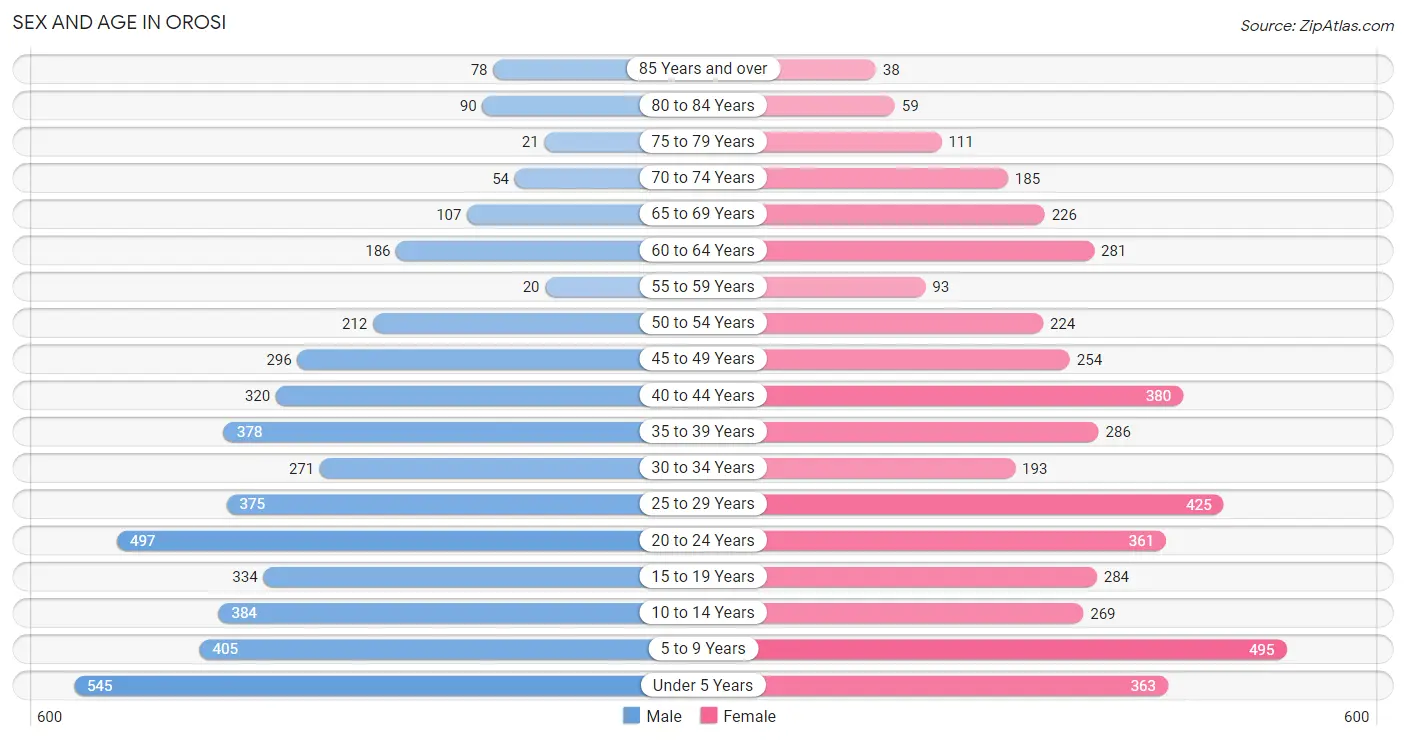
| Age Bracket | Male | Female |
| Under 5 Years | 545 (11.9%) | 363 (8.0%) |
| 5 to 9 Years | 405 (8.9%) | 495 (10.9%) |
| 10 to 14 Years | 384 (8.4%) | 269 (5.9%) |
| 15 to 19 Years | 334 (7.3%) | 284 (6.3%) |
| 20 to 24 Years | 497 (10.9%) | 361 (8.0%) |
| 25 to 29 Years | 375 (8.2%) | 425 (9.4%) |
| 30 to 34 Years | 271 (5.9%) | 193 (4.3%) |
| 35 to 39 Years | 378 (8.3%) | 286 (6.3%) |
| 40 to 44 Years | 320 (7.0%) | 380 (8.4%) |
| 45 to 49 Years | 296 (6.5%) | 254 (5.6%) |
| 50 to 54 Years | 212 (4.6%) | 224 (5.0%) |
| 55 to 59 Years | 20 (0.4%) | 93 (2.1%) |
| 60 to 64 Years | 186 (4.1%) | 281 (6.2%) |
| 65 to 69 Years | 107 (2.3%) | 226 (5.0%) |
| 70 to 74 Years | 54 (1.2%) | 185 (4.1%) |
| 75 to 79 Years | 21 (0.5%) | 111 (2.5%) |
| 80 to 84 Years | 90 (2.0%) | 59 (1.3%) |
| 85 Years and over | 78 (1.7%) | 38 (0.8%) |
| Total | 4,573 (100.0%) | 4,527 (100.0%) |
Families and Households in Orosi
Median Family Size in Orosi
The median family size in Orosi is 4.41 persons per family, with married-couple families (1,162 | 59.3%) accounting for the largest median family size of 4.99 persons per family. On the other hand, single male/father families (21 | 1.1%) represent the smallest median family size with 2.29 persons per family.
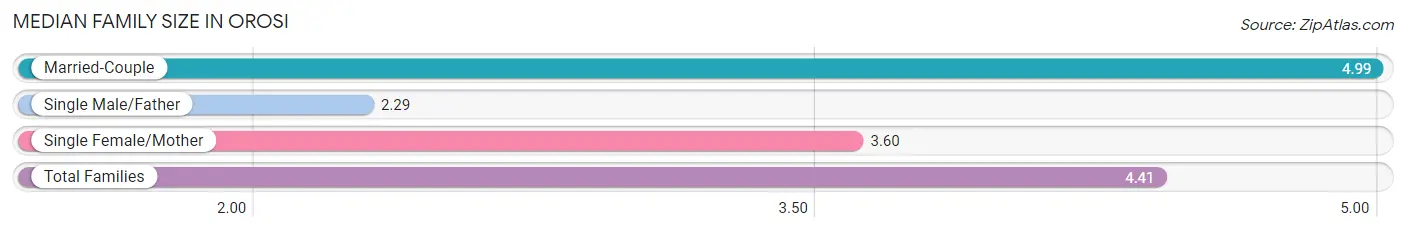
| Family Type | # Families | Family Size |
| Married-Couple | 1,162 (59.3%) | 4.99 |
| Single Male/Father | 21 (1.1%) | 2.29 |
| Single Female/Mother | 777 (39.6%) | 3.60 |
| Total Families | 1,960 (100.0%) | 4.41 |
Median Household Size in Orosi
The median household size in Orosi is 4.33 persons per household, with married-couple households (1,162 | 55.2%) accounting for the largest median household size of 4.99 persons per household. non-family households (144 | 6.8%) represent the smallest median household size with 2.13 persons per household.
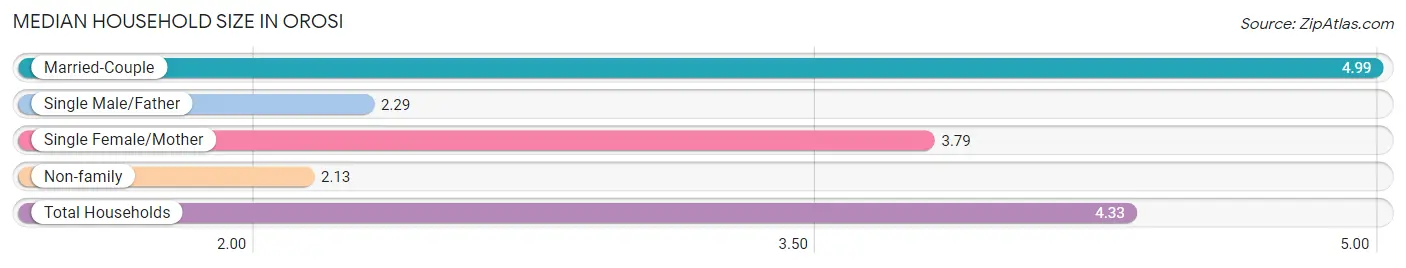
| Household Type | # Households | Household Size |
| Married-Couple | 1,162 (55.2%) | 4.99 |
| Single Male/Father | 21 (1.0%) | 2.29 |
| Single Female/Mother | 777 (36.9%) | 3.79 |
| Non-family | 144 (6.8%) | 2.13 |
| Total Households | 2,104 (100.0%) | 4.33 |
Household Size by Marriage Status in Orosi
Out of a total of 2,104 households in Orosi, 1,960 (93.2%) are family households, while 144 (6.8%) are nonfamily households. The most numerous type of family households are 4-person households, comprising 601, and the most common type of nonfamily households are 1-person households, comprising 84.
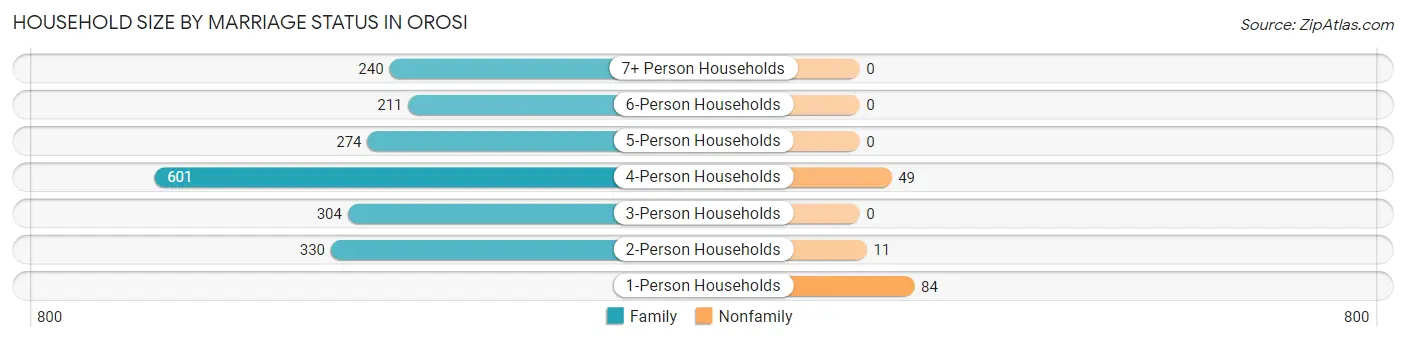
| Household Size | Family Households | Nonfamily Households |
| 1-Person Households | - | 84 (4.0%) |
| 2-Person Households | 330 (15.7%) | 11 (0.5%) |
| 3-Person Households | 304 (14.4%) | 0 (0.0%) |
| 4-Person Households | 601 (28.6%) | 49 (2.3%) |
| 5-Person Households | 274 (13.0%) | 0 (0.0%) |
| 6-Person Households | 211 (10.0%) | 0 (0.0%) |
| 7+ Person Households | 240 (11.4%) | 0 (0.0%) |
| Total | 1,960 (93.2%) | 144 (6.8%) |
Female Fertility in Orosi
Fertility by Age in Orosi
Average fertility rate in Orosi is 20.0 births per 1,000 women. Women in the age bracket of 20 to 34 years have the highest fertility rate with 47.0 births per 1,000 women. Women in the age bracket of 20 to 34 years acount for 100.0% of all women with births.
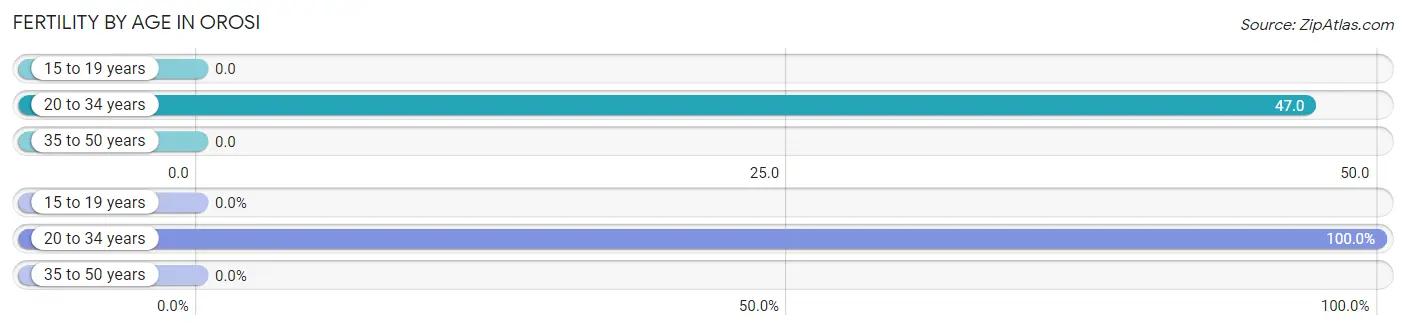
| Age Bracket | Women with Births | Births / 1,000 Women |
| 15 to 19 years | 0 (0.0%) | 0.0 |
| 20 to 34 years | 46 (100.0%) | 47.0 |
| 35 to 50 years | 0 (0.0%) | 0.0 |
| Total | 46 (100.0%) | 20.0 |
Fertility by Age by Marriage Status in Orosi
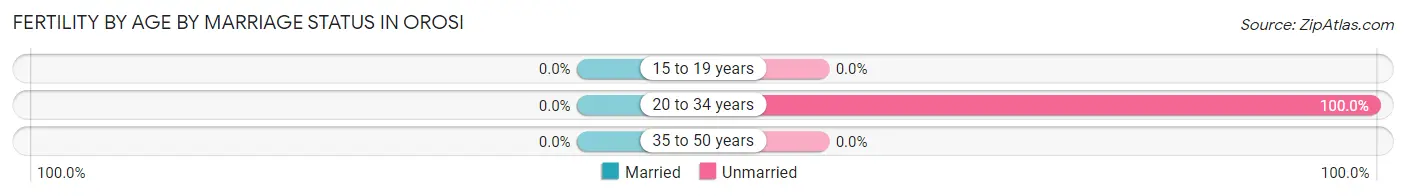
| Age Bracket | Married | Unmarried |
| 15 to 19 years | 0 (0.0%) | 0 (0.0%) |
| 20 to 34 years | 0 (0.0%) | 46 (100.0%) |
| 35 to 50 years | 0 (0.0%) | 0 (0.0%) |
| Total | 0 (0.0%) | 46 (100.0%) |
Fertility by Education in Orosi
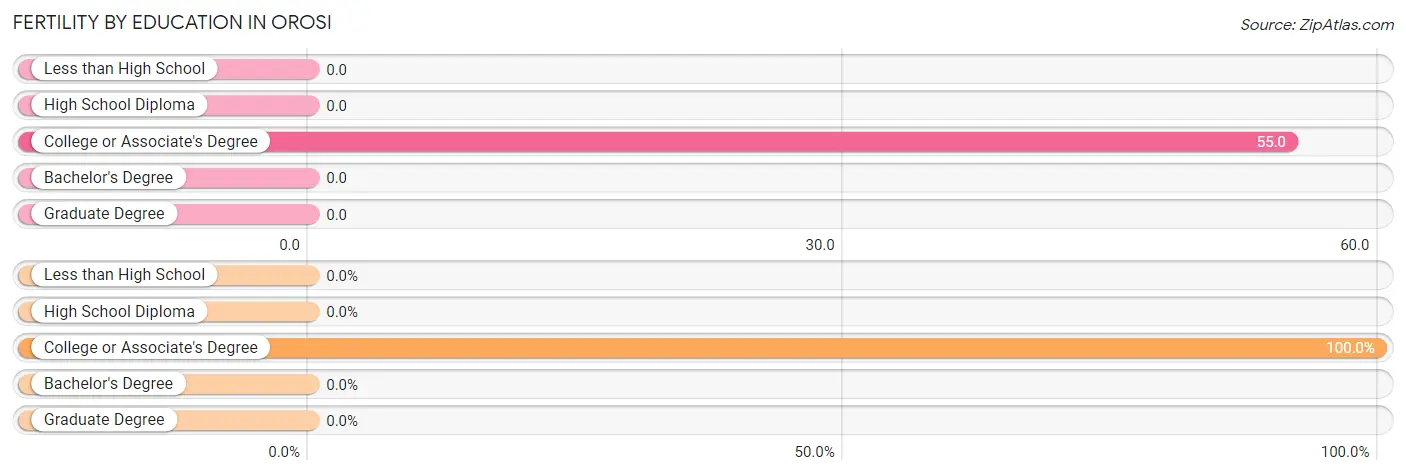
| Educational Attainment | Women with Births | Births / 1,000 Women |
| Less than High School | 0 (0.0%) | 0.0 |
| High School Diploma | 0 (0.0%) | 0.0 |
| College or Associate's Degree | 46 (100.0%) | 55.0 |
| Bachelor's Degree | 0 (0.0%) | 0.0 |
| Graduate Degree | 0 (0.0%) | 0.0 |
| Total | 46 (100.0%) | 20.0 |
Fertility by Education by Marriage Status in Orosi
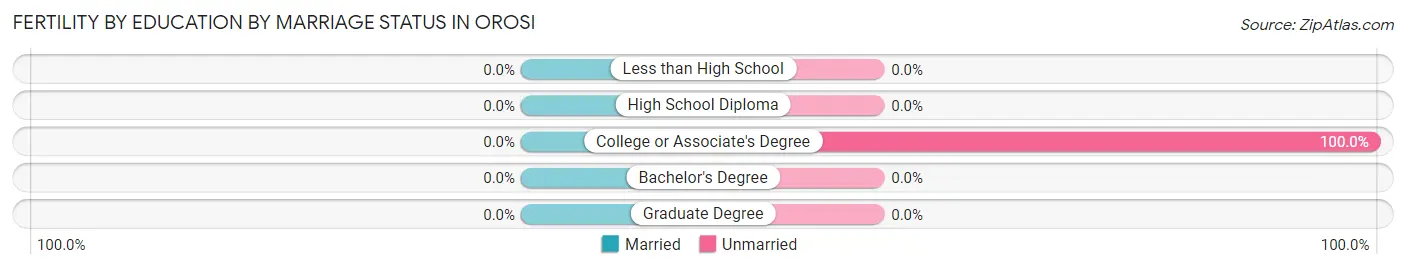
| Educational Attainment | Married | Unmarried |
| Less than High School | 0 (0.0%) | 0 (0.0%) |
| High School Diploma | 0 (0.0%) | 0 (0.0%) |
| College or Associate's Degree | 0 (0.0%) | 46 (100.0%) |
| Bachelor's Degree | 0 (0.0%) | 0 (0.0%) |
| Graduate Degree | 0 (0.0%) | 0 (0.0%) |
| Total | 0 (0.0%) | 46 (100.0%) |
Employment Characteristics in Orosi
Employment by Class of Employer in Orosi
Among the 2,985 employed individuals in Orosi, private company employees (2,573 | 86.2%), self-employed (not incorporated) (203 | 6.8%), and local government employees (154 | 5.2%) make up the most common classes of employment.
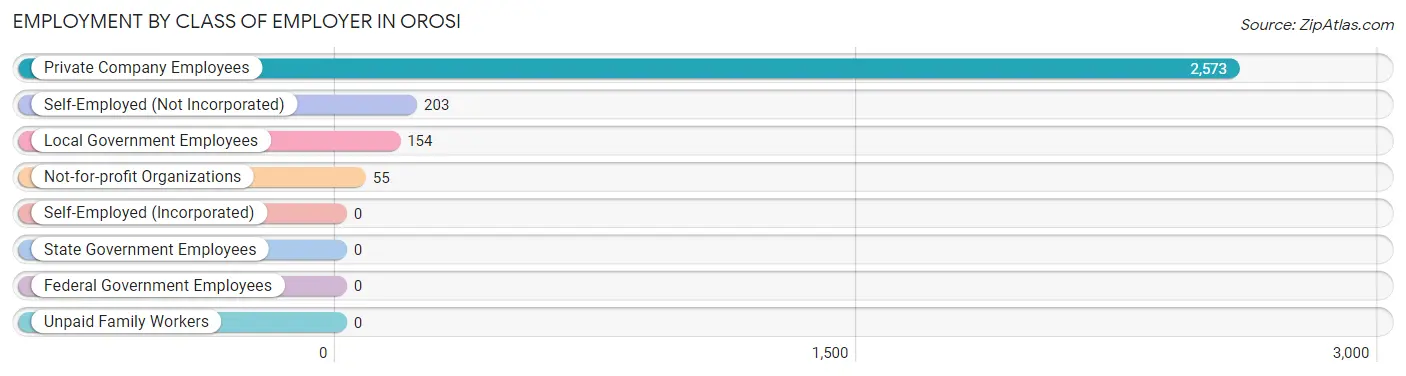
| Employer Class | # Employees | % Employees |
| Private Company Employees | 2,573 | 86.2% |
| Self-Employed (Incorporated) | 0 | 0.0% |
| Self-Employed (Not Incorporated) | 203 | 6.8% |
| Not-for-profit Organizations | 55 | 1.8% |
| Local Government Employees | 154 | 5.2% |
| State Government Employees | 0 | 0.0% |
| Federal Government Employees | 0 | 0.0% |
| Unpaid Family Workers | 0 | 0.0% |
| Total | 2,985 | 100.0% |
Employment Status by Age in Orosi
According to the labor force statistics for Orosi, out of the total population over 16 years of age (6,407), 57.6% or 3,690 individuals are in the labor force, with 10.6% or 391 of them unemployed. The age group with the highest labor force participation rate is 25 to 29 years, with 91.3% or 730 individuals in the labor force. Within the labor force, the 16 to 19 years age range has the highest percentage of unemployed individuals, with 28.2% or 58 of them being unemployed.
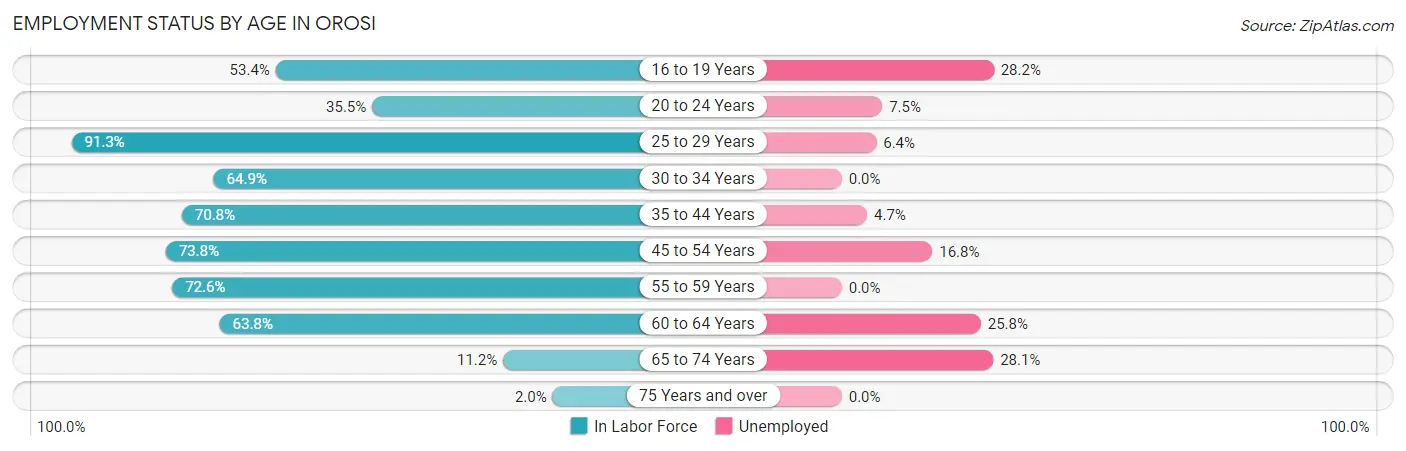
| Age Bracket | In Labor Force | Unemployed |
| 16 to 19 Years | 206 (53.4%) | 58 (28.2%) |
| 20 to 24 Years | 305 (35.5%) | 23 (7.5%) |
| 25 to 29 Years | 730 (91.3%) | 47 (6.4%) |
| 30 to 34 Years | 301 (64.9%) | 0 (0.0%) |
| 35 to 44 Years | 966 (70.8%) | 45 (4.7%) |
| 45 to 54 Years | 728 (73.8%) | 122 (16.8%) |
| 55 to 59 Years | 82 (72.6%) | 0 (0.0%) |
| 60 to 64 Years | 298 (63.8%) | 77 (25.8%) |
| 65 to 74 Years | 64 (11.2%) | 18 (28.1%) |
| 75 Years and over | 8 (2.0%) | 0 (0.0%) |
| Total | 3,690 (57.6%) | 391 (10.6%) |
Employment Status by Educational Attainment in Orosi
According to labor force statistics for Orosi, 74.0% of individuals (3,104) out of the total population between 25 and 64 years of age (4,194) are in the labor force, with 9.4% or 292 of them being unemployed. The group with the highest labor force participation rate are those with the educational attainment of bachelor's degree or higher, with 85.7% or 221 individuals in the labor force. Within the labor force, individuals with less than high school education have the highest percentage of unemployment, with 18.0% or 253 of them being unemployed.
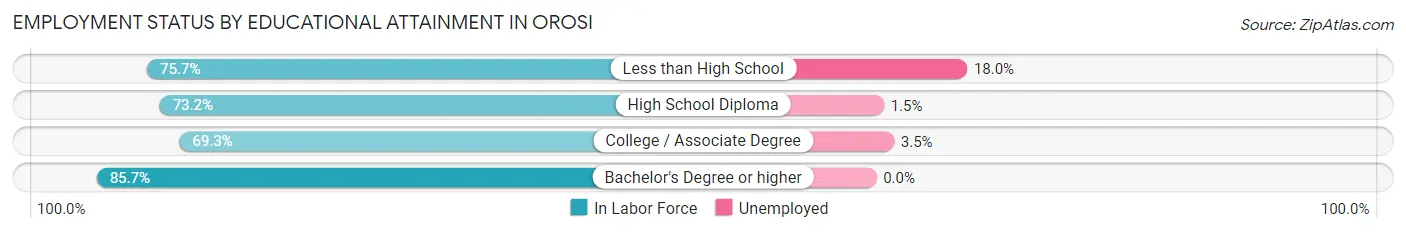
| Educational Attainment | In Labor Force | Unemployed |
| Less than High School | 1,403 (75.7%) | 334 (18.0%) |
| High School Diploma | 720 (73.2%) | 15 (1.5%) |
| College / Associate Degree | 762 (69.3%) | 38 (3.5%) |
| Bachelor's Degree or higher | 221 (85.7%) | 0 (0.0%) |
| Total | 3,104 (74.0%) | 394 (9.4%) |
Employment Occupations by Sex in Orosi
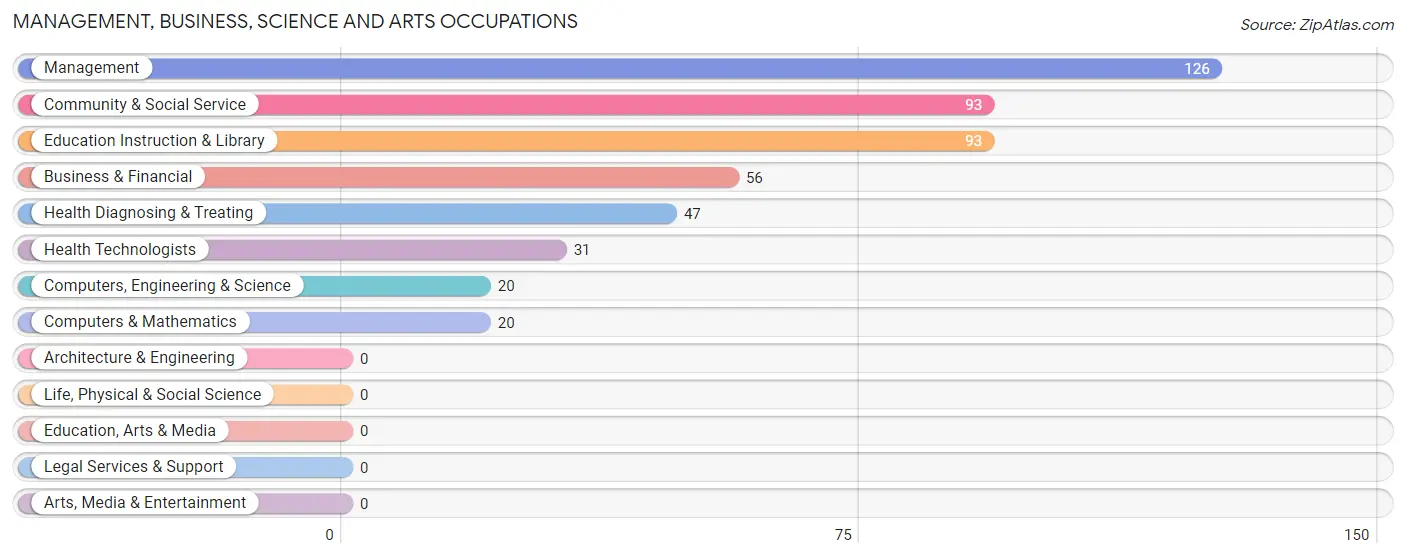
Management, Business, Science and Arts Occupations
The most common Management, Business, Science and Arts occupations in Orosi are Management (126 | 3.8%), Community & Social Service (93 | 2.8%), Education Instruction & Library (93 | 2.8%), Business & Financial (56 | 1.7%), and Health Diagnosing & Treating (47 | 1.4%).
Management, Business, Science and Arts Occupations by Sex
Within the Management, Business, Science and Arts occupations in Orosi, the most male-oriented occupations are Computers, Engineering & Science (100.0%), Computers & Mathematics (100.0%), and Business & Financial (94.6%), while the most female-oriented occupations are Community & Social Service (100.0%), Education Instruction & Library (100.0%), and Health Technologists (100.0%).
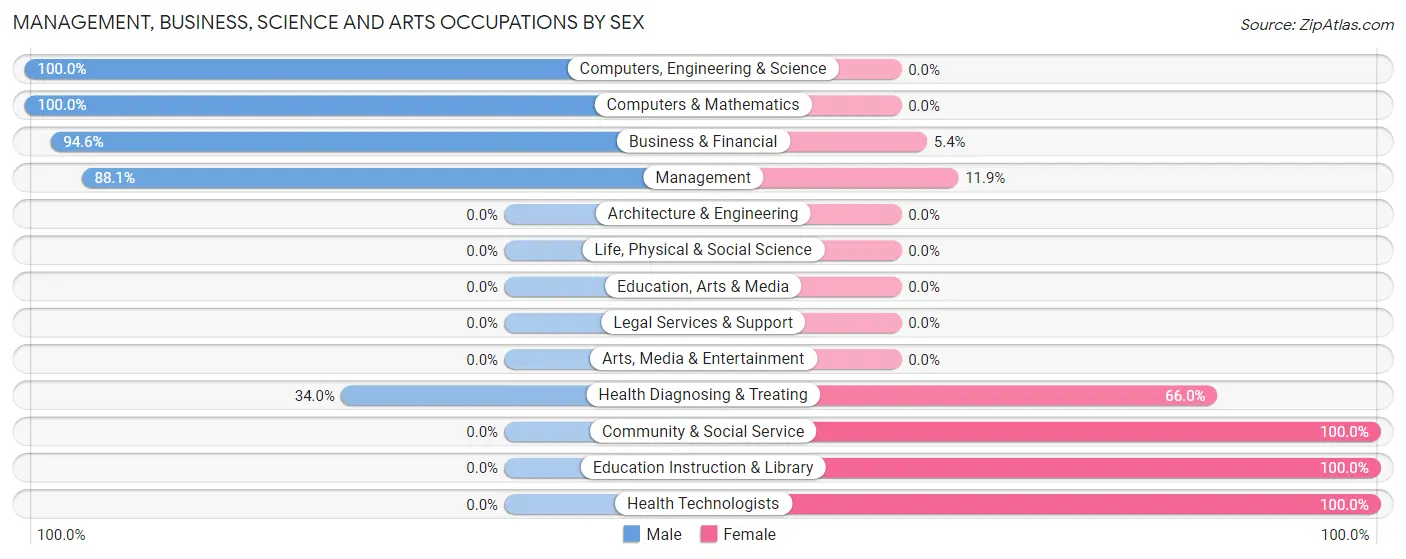
| Occupation | Male | Female |
| Management | 111 (88.1%) | 15 (11.9%) |
| Business & Financial | 53 (94.6%) | 3 (5.4%) |
| Computers, Engineering & Science | 20 (100.0%) | 0 (0.0%) |
| Computers & Mathematics | 20 (100.0%) | 0 (0.0%) |
| Architecture & Engineering | 0 (0.0%) | 0 (0.0%) |
| Life, Physical & Social Science | 0 (0.0%) | 0 (0.0%) |
| Community & Social Service | 0 (0.0%) | 93 (100.0%) |
| Education, Arts & Media | 0 (0.0%) | 0 (0.0%) |
| Legal Services & Support | 0 (0.0%) | 0 (0.0%) |
| Education Instruction & Library | 0 (0.0%) | 93 (100.0%) |
| Arts, Media & Entertainment | 0 (0.0%) | 0 (0.0%) |
| Health Diagnosing & Treating | 16 (34.0%) | 31 (66.0%) |
| Health Technologists | 0 (0.0%) | 31 (100.0%) |
| Total (Category) | 200 (58.5%) | 142 (41.5%) |
| Total (Overall) | 1,909 (57.9%) | 1,389 (42.1%) |
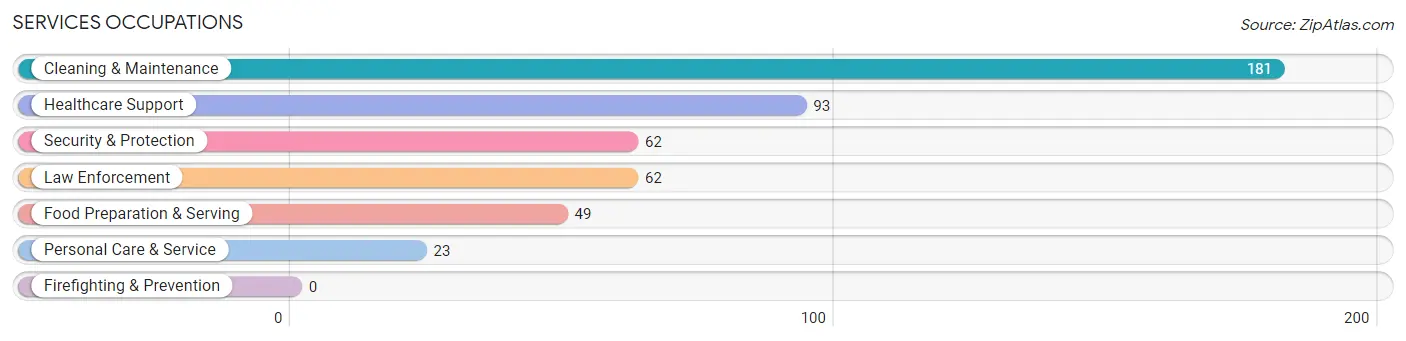
Services Occupations
The most common Services occupations in Orosi are Cleaning & Maintenance (181 | 5.5%), Healthcare Support (93 | 2.8%), Security & Protection (62 | 1.9%), Law Enforcement (62 | 1.9%), and Food Preparation & Serving (49 | 1.5%).
Services Occupations by Sex
Within the Services occupations in Orosi, the most male-oriented occupations are Security & Protection (100.0%), Law Enforcement (100.0%), and Cleaning & Maintenance (66.8%), while the most female-oriented occupations are Food Preparation & Serving (100.0%), Personal Care & Service (100.0%), and Healthcare Support (71.0%).
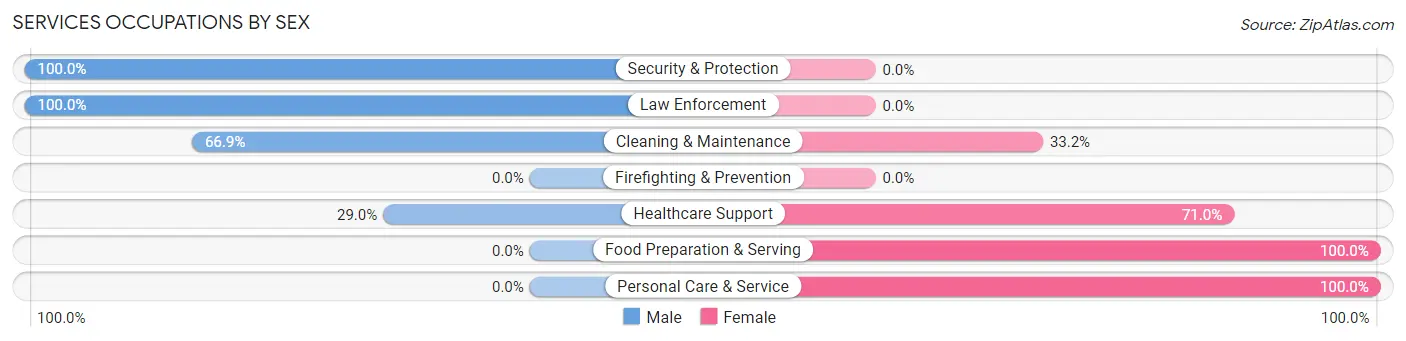
| Occupation | Male | Female |
| Healthcare Support | 27 (29.0%) | 66 (71.0%) |
| Security & Protection | 62 (100.0%) | 0 (0.0%) |
| Firefighting & Prevention | 0 (0.0%) | 0 (0.0%) |
| Law Enforcement | 62 (100.0%) | 0 (0.0%) |
| Food Preparation & Serving | 0 (0.0%) | 49 (100.0%) |
| Cleaning & Maintenance | 121 (66.8%) | 60 (33.2%) |
| Personal Care & Service | 0 (0.0%) | 23 (100.0%) |
| Total (Category) | 210 (51.5%) | 198 (48.5%) |
| Total (Overall) | 1,909 (57.9%) | 1,389 (42.1%) |
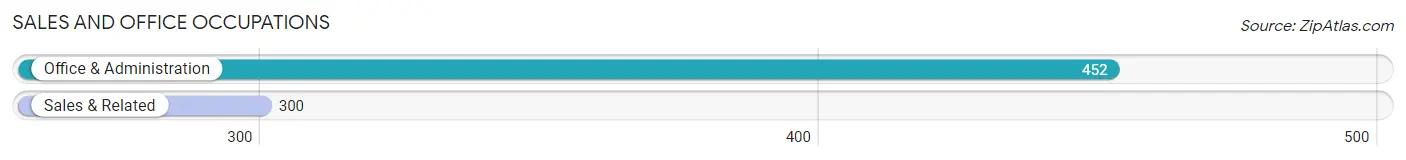
Sales and Office Occupations
The most common Sales and Office occupations in Orosi are Office & Administration (452 | 13.7%), and Sales & Related (300 | 9.1%).
Sales and Office Occupations by Sex
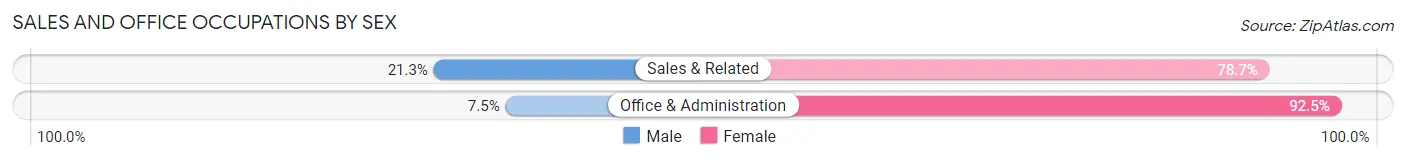
| Occupation | Male | Female |
| Sales & Related | 64 (21.3%) | 236 (78.7%) |
| Office & Administration | 34 (7.5%) | 418 (92.5%) |
| Total (Category) | 98 (13.0%) | 654 (87.0%) |
| Total (Overall) | 1,909 (57.9%) | 1,389 (42.1%) |
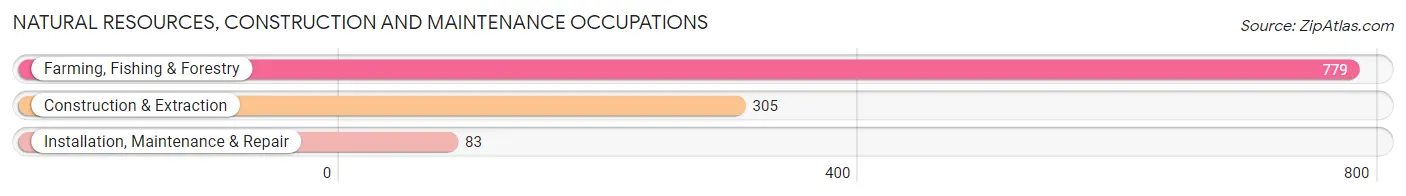
Natural Resources, Construction and Maintenance Occupations
The most common Natural Resources, Construction and Maintenance occupations in Orosi are Farming, Fishing & Forestry (779 | 23.6%), Construction & Extraction (305 | 9.2%), and Installation, Maintenance & Repair (83 | 2.5%).
Natural Resources, Construction and Maintenance Occupations by Sex
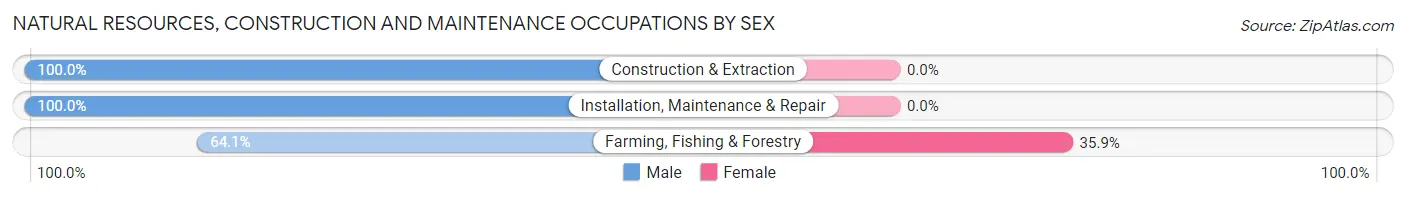
| Occupation | Male | Female |
| Farming, Fishing & Forestry | 499 (64.1%) | 280 (35.9%) |
| Construction & Extraction | 305 (100.0%) | 0 (0.0%) |
| Installation, Maintenance & Repair | 83 (100.0%) | 0 (0.0%) |
| Total (Category) | 887 (76.0%) | 280 (24.0%) |
| Total (Overall) | 1,909 (57.9%) | 1,389 (42.1%) |
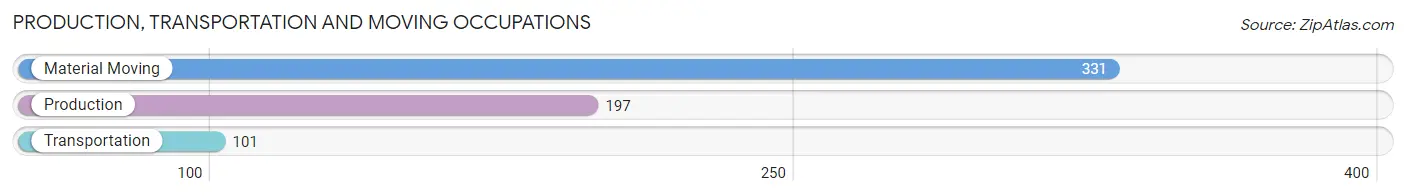
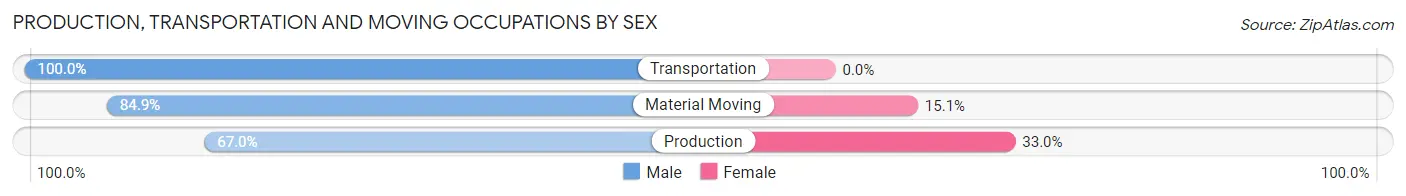
Production, Transportation and Moving Occupations
The most common Production, Transportation and Moving occupations in Orosi are Material Moving (331 | 10.0%), Production (197 | 6.0%), and Transportation (101 | 3.1%).
Production, Transportation and Moving Occupations by Sex
| Occupation | Male | Female |
| Production | 132 (67.0%) | 65 (33.0%) |
| Transportation | 101 (100.0%) | 0 (0.0%) |
| Material Moving | 281 (84.9%) | 50 (15.1%) |
| Total (Category) | 514 (81.7%) | 115 (18.3%) |
| Total (Overall) | 1,909 (57.9%) | 1,389 (42.1%) |
Employment Industries by Sex in Orosi
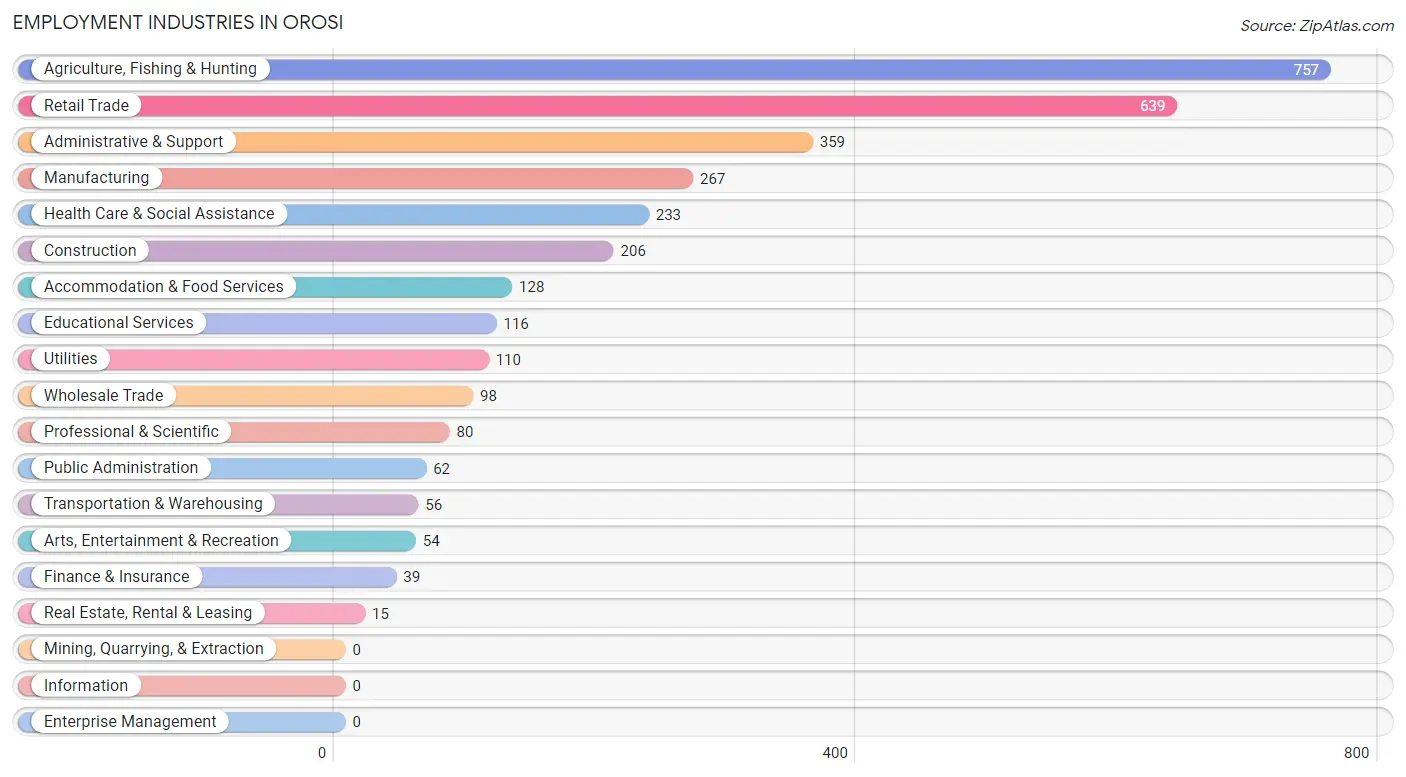
Employment Industries in Orosi
The major employment industries in Orosi include Agriculture, Fishing & Hunting (757 | 23.0%), Retail Trade (639 | 19.4%), Administrative & Support (359 | 10.9%), Manufacturing (267 | 8.1%), and Health Care & Social Assistance (233 | 7.1%).
Employment Industries by Sex in Orosi
The Orosi industries that see more men than women are Construction (100.0%), Utilities (100.0%), and Arts, Entertainment & Recreation (100.0%), whereas the industries that tend to have a higher number of women are Finance & Insurance (100.0%), Real Estate, Rental & Leasing (100.0%), and Educational Services (100.0%).
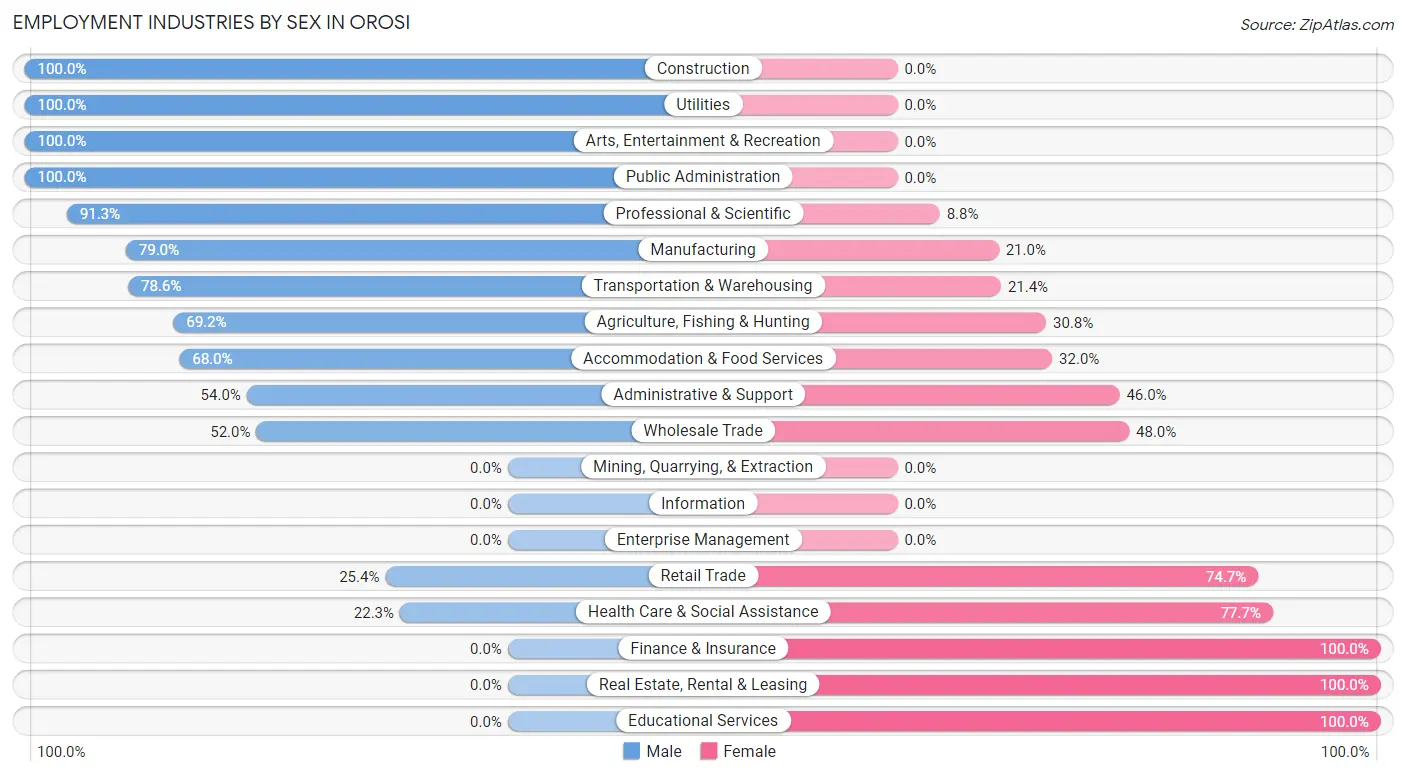
| Industry | Male | Female |
| Agriculture, Fishing & Hunting | 524 (69.2%) | 233 (30.8%) |
| Mining, Quarrying, & Extraction | 0 (0.0%) | 0 (0.0%) |
| Construction | 206 (100.0%) | 0 (0.0%) |
| Manufacturing | 211 (79.0%) | 56 (21.0%) |
| Wholesale Trade | 51 (52.0%) | 47 (48.0%) |
| Retail Trade | 162 (25.4%) | 477 (74.7%) |
| Transportation & Warehousing | 44 (78.6%) | 12 (21.4%) |
| Utilities | 110 (100.0%) | 0 (0.0%) |
| Information | 0 (0.0%) | 0 (0.0%) |
| Finance & Insurance | 0 (0.0%) | 39 (100.0%) |
| Real Estate, Rental & Leasing | 0 (0.0%) | 15 (100.0%) |
| Professional & Scientific | 73 (91.2%) | 7 (8.7%) |
| Enterprise Management | 0 (0.0%) | 0 (0.0%) |
| Administrative & Support | 194 (54.0%) | 165 (46.0%) |
| Educational Services | 0 (0.0%) | 116 (100.0%) |
| Health Care & Social Assistance | 52 (22.3%) | 181 (77.7%) |
| Arts, Entertainment & Recreation | 54 (100.0%) | 0 (0.0%) |
| Accommodation & Food Services | 87 (68.0%) | 41 (32.0%) |
| Public Administration | 62 (100.0%) | 0 (0.0%) |
| Total | 1,909 (57.9%) | 1,389 (42.1%) |
Education in Orosi
School Enrollment in Orosi
The most common levels of schooling among the 2,621 students in Orosi are elementary school (682 | 26.0%), middle school (545 | 20.8%), and high school (495 | 18.9%).
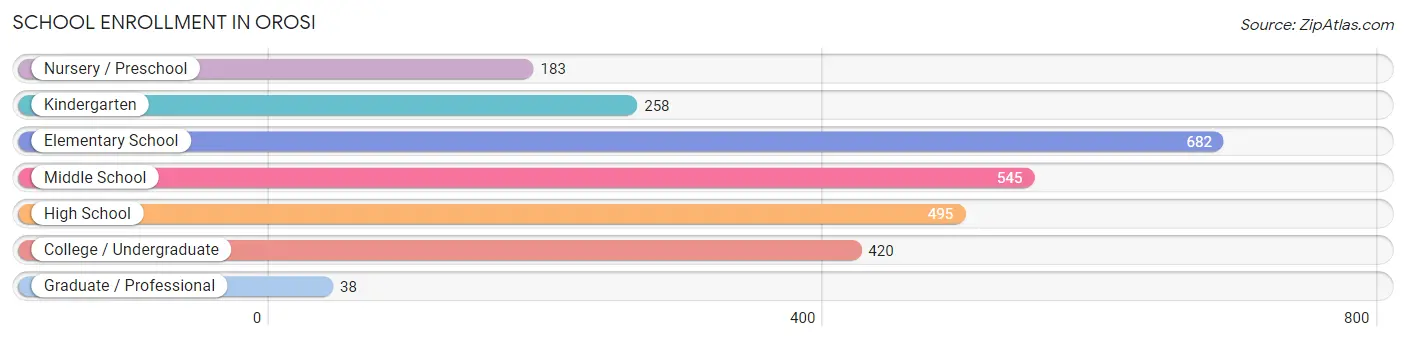
| School Level | # Students | % Students |
| Nursery / Preschool | 183 | 7.0% |
| Kindergarten | 258 | 9.8% |
| Elementary School | 682 | 26.0% |
| Middle School | 545 | 20.8% |
| High School | 495 | 18.9% |
| College / Undergraduate | 420 | 16.0% |
| Graduate / Professional | 38 | 1.5% |
| Total | 2,621 | 100.0% |
School Enrollment by Age by Funding Source in Orosi
Out of a total of 2,621 students who are enrolled in schools in Orosi, 194 (7.4%) attend a private institution, while the remaining 2,427 (92.6%) are enrolled in public schools. The age group of 18 to 19 year olds has the highest likelihood of being enrolled in private schools, with 41 (41.8% in the age bracket) enrolled. Conversely, the age group of 3 to 4 year olds has the lowest likelihood of being enrolled in a private school, with 256 (100.0% in the age bracket) attending a public institution.
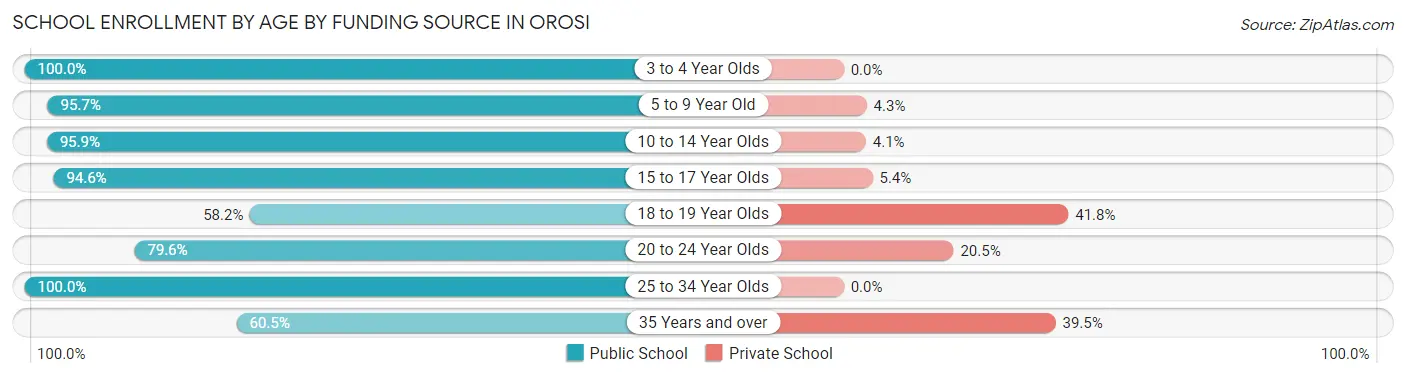
| Age Bracket | Public School | Private School |
| 3 to 4 Year Olds | 256 (100.0%) | 0 (0.0%) |
| 5 to 9 Year Old | 828 (95.7%) | 37 (4.3%) |
| 10 to 14 Year Olds | 581 (95.9%) | 25 (4.1%) |
| 15 to 17 Year Olds | 369 (94.6%) | 21 (5.4%) |
| 18 to 19 Year Olds | 57 (58.2%) | 41 (41.8%) |
| 20 to 24 Year Olds | 214 (79.5%) | 55 (20.4%) |
| 25 to 34 Year Olds | 99 (100.0%) | 0 (0.0%) |
| 35 Years and over | 23 (60.5%) | 15 (39.5%) |
| Total | 2,427 (92.6%) | 194 (7.4%) |
Educational Attainment by Field of Study in Orosi
Computers & mathematics (88 | 28.2%), social sciences (54 | 17.3%), science & technology (50 | 16.0%), communications (38 | 12.2%), and psychology (20 | 6.4%) are the most common fields of study among 312 individuals in Orosi who have obtained a bachelor's degree or higher.
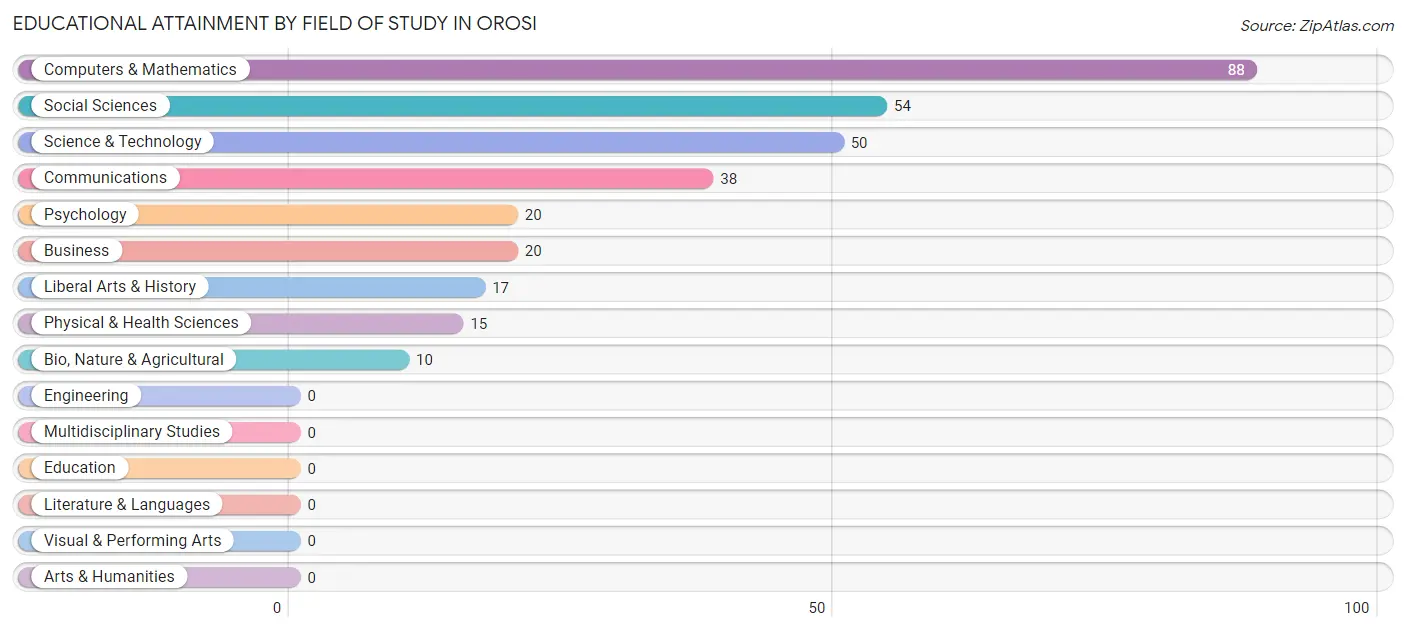
| Field of Study | # Graduates | % Graduates |
| Computers & Mathematics | 88 | 28.2% |
| Bio, Nature & Agricultural | 10 | 3.2% |
| Physical & Health Sciences | 15 | 4.8% |
| Psychology | 20 | 6.4% |
| Social Sciences | 54 | 17.3% |
| Engineering | 0 | 0.0% |
| Multidisciplinary Studies | 0 | 0.0% |
| Science & Technology | 50 | 16.0% |
| Business | 20 | 6.4% |
| Education | 0 | 0.0% |
| Literature & Languages | 0 | 0.0% |
| Liberal Arts & History | 17 | 5.4% |
| Visual & Performing Arts | 0 | 0.0% |
| Communications | 38 | 12.2% |
| Arts & Humanities | 0 | 0.0% |
| Total | 312 | 100.0% |
Transportation & Commute in Orosi
Vehicle Availability by Sex in Orosi
The most prevalent vehicle ownership categories in Orosi are males with 2 vehicles (628, accounting for 36.3%) and females with 2 vehicles (369, making up 50.0%).
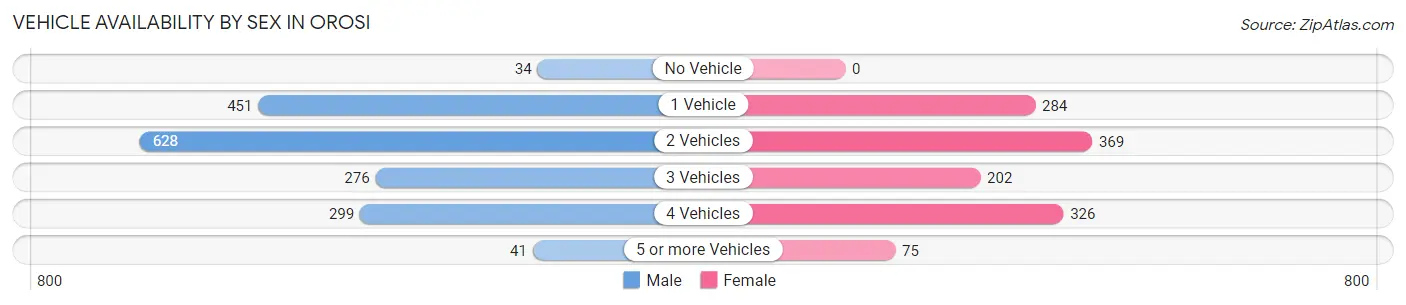
| Vehicles Available | Male | Female |
| No Vehicle | 34 (2.0%) | 0 (0.0%) |
| 1 Vehicle | 451 (26.1%) | 284 (22.6%) |
| 2 Vehicles | 628 (36.3%) | 369 (29.4%) |
| 3 Vehicles | 276 (16.0%) | 202 (16.1%) |
| 4 Vehicles | 299 (17.3%) | 326 (26.0%) |
| 5 or more Vehicles | 41 (2.4%) | 75 (6.0%) |
| Total | 1,729 (100.0%) | 1,256 (100.0%) |
Commute Time in Orosi
The most frequently occuring commute durations in Orosi are 15 to 19 minutes (524 commuters, 18.4%), 30 to 34 minutes (506 commuters, 17.7%), and 20 to 24 minutes (412 commuters, 14.4%).
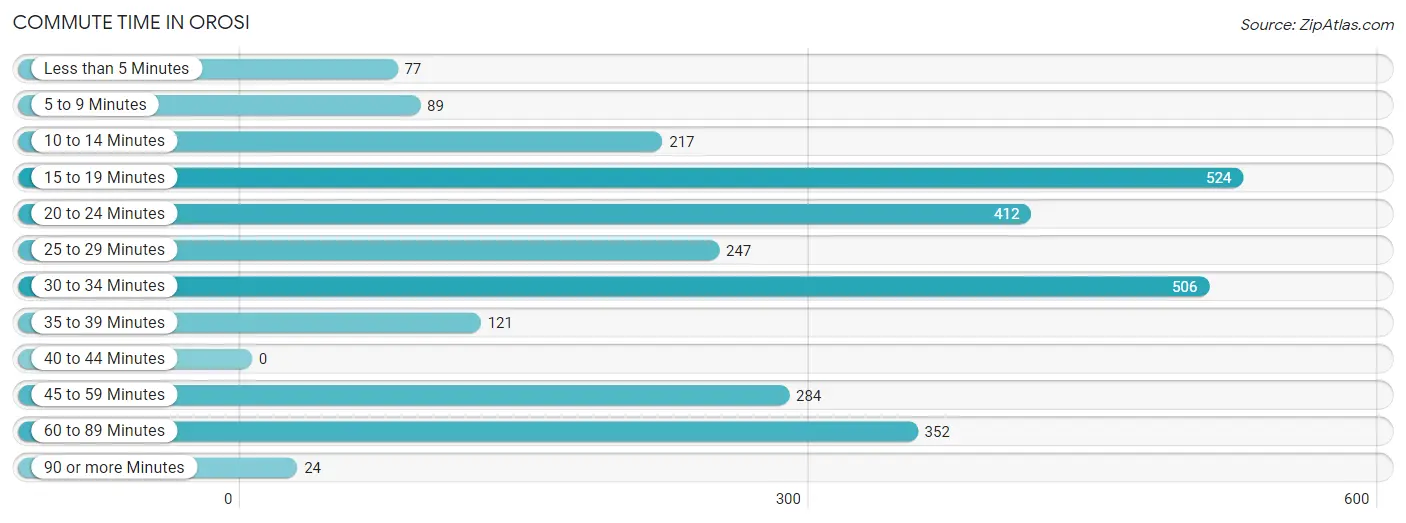
| Commute Time | # Commuters | % Commuters |
| Less than 5 Minutes | 77 | 2.7% |
| 5 to 9 Minutes | 89 | 3.1% |
| 10 to 14 Minutes | 217 | 7.6% |
| 15 to 19 Minutes | 524 | 18.4% |
| 20 to 24 Minutes | 412 | 14.4% |
| 25 to 29 Minutes | 247 | 8.7% |
| 30 to 34 Minutes | 506 | 17.7% |
| 35 to 39 Minutes | 121 | 4.2% |
| 40 to 44 Minutes | 0 | 0.0% |
| 45 to 59 Minutes | 284 | 10.0% |
| 60 to 89 Minutes | 352 | 12.3% |
| 90 or more Minutes | 24 | 0.8% |
Commute Time by Sex in Orosi
The most common commute times in Orosi are 30 to 34 minutes (340 commuters, 20.3%) for males and 15 to 19 minutes (370 commuters, 31.4%) for females.
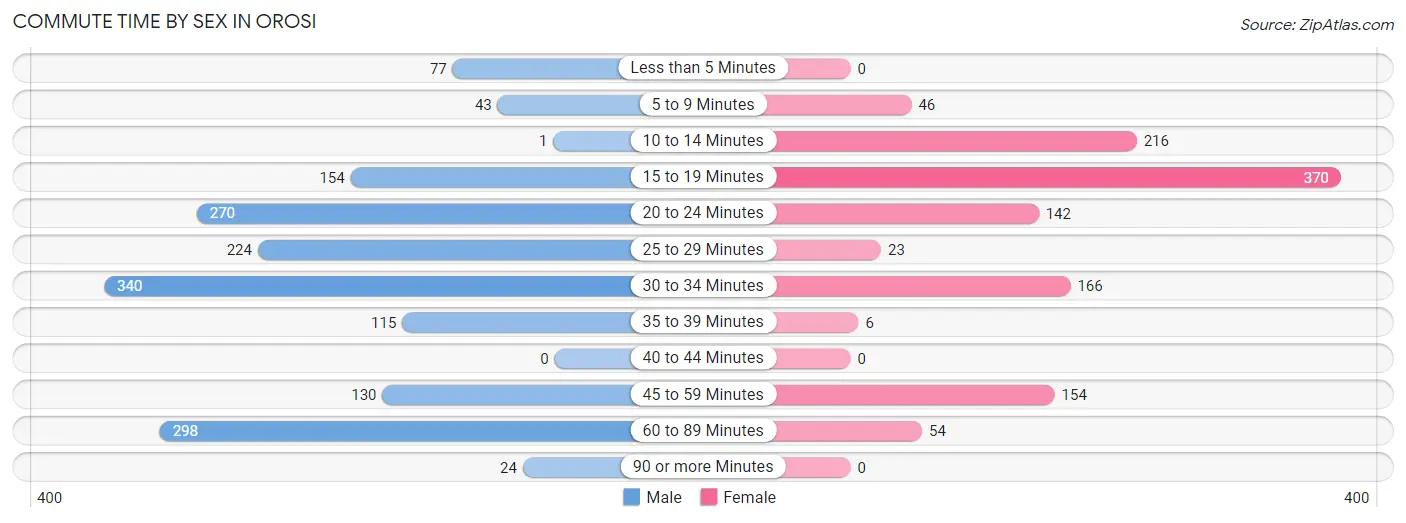
| Commute Time | Male | Female |
| Less than 5 Minutes | 77 (4.6%) | 0 (0.0%) |
| 5 to 9 Minutes | 43 (2.6%) | 46 (3.9%) |
| 10 to 14 Minutes | 1 (0.1%) | 216 (18.3%) |
| 15 to 19 Minutes | 154 (9.2%) | 370 (31.4%) |
| 20 to 24 Minutes | 270 (16.1%) | 142 (12.1%) |
| 25 to 29 Minutes | 224 (13.4%) | 23 (1.9%) |
| 30 to 34 Minutes | 340 (20.3%) | 166 (14.1%) |
| 35 to 39 Minutes | 115 (6.9%) | 6 (0.5%) |
| 40 to 44 Minutes | 0 (0.0%) | 0 (0.0%) |
| 45 to 59 Minutes | 130 (7.8%) | 154 (13.1%) |
| 60 to 89 Minutes | 298 (17.8%) | 54 (4.6%) |
| 90 or more Minutes | 24 (1.4%) | 0 (0.0%) |
Time of Departure to Work by Sex in Orosi
The most frequent times of departure to work in Orosi are 5:00 AM to 5:29 AM (383, 22.9%) for males and 7:00 AM to 7:29 AM (244, 20.7%) for females.
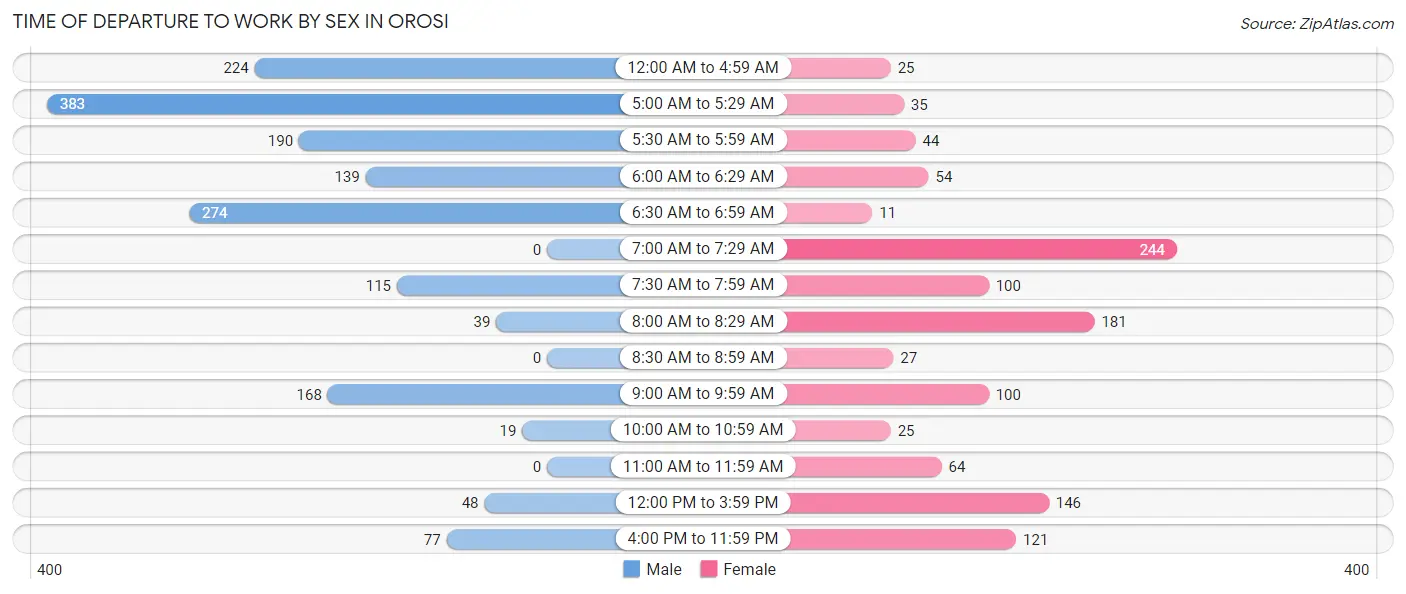
| Time of Departure | Male | Female |
| 12:00 AM to 4:59 AM | 224 (13.4%) | 25 (2.1%) |
| 5:00 AM to 5:29 AM | 383 (22.9%) | 35 (3.0%) |
| 5:30 AM to 5:59 AM | 190 (11.3%) | 44 (3.7%) |
| 6:00 AM to 6:29 AM | 139 (8.3%) | 54 (4.6%) |
| 6:30 AM to 6:59 AM | 274 (16.4%) | 11 (0.9%) |
| 7:00 AM to 7:29 AM | 0 (0.0%) | 244 (20.7%) |
| 7:30 AM to 7:59 AM | 115 (6.9%) | 100 (8.5%) |
| 8:00 AM to 8:29 AM | 39 (2.3%) | 181 (15.4%) |
| 8:30 AM to 8:59 AM | 0 (0.0%) | 27 (2.3%) |
| 9:00 AM to 9:59 AM | 168 (10.0%) | 100 (8.5%) |
| 10:00 AM to 10:59 AM | 19 (1.1%) | 25 (2.1%) |
| 11:00 AM to 11:59 AM | 0 (0.0%) | 64 (5.4%) |
| 12:00 PM to 3:59 PM | 48 (2.9%) | 146 (12.4%) |
| 4:00 PM to 11:59 PM | 77 (4.6%) | 121 (10.3%) |
| Total | 1,676 (100.0%) | 1,177 (100.0%) |
Housing Occupancy in Orosi
Occupancy by Ownership in Orosi
Of the total 2,104 dwellings in Orosi, owner-occupied units account for 1,211 (57.6%), while renter-occupied units make up 893 (42.4%).
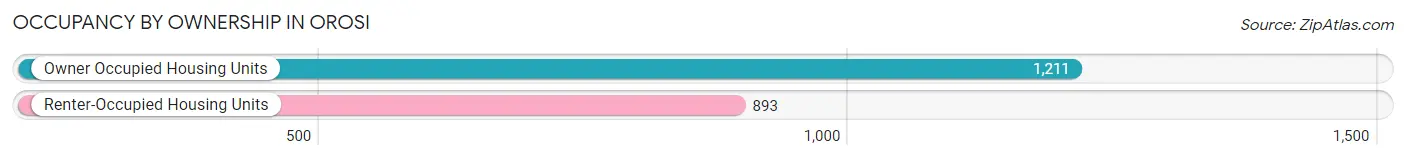
| Occupancy | # Housing Units | % Housing Units |
| Owner Occupied Housing Units | 1,211 | 57.6% |
| Renter-Occupied Housing Units | 893 | 42.4% |
| Total Occupied Housing Units | 2,104 | 100.0% |
Occupancy by Household Size in Orosi
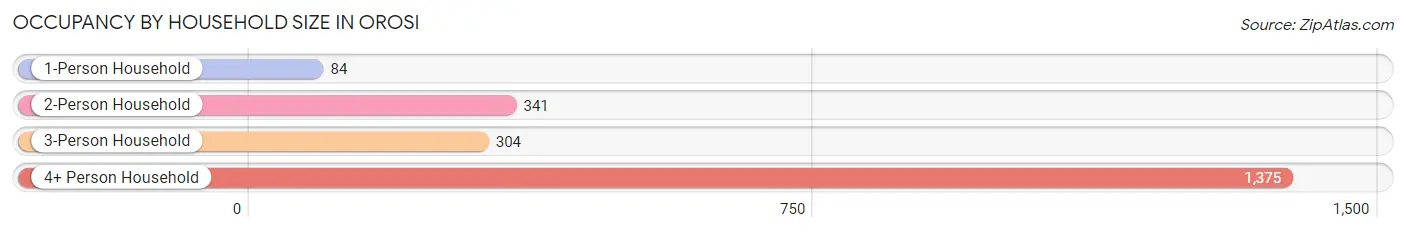
| Household Size | # Housing Units | % Housing Units |
| 1-Person Household | 84 | 4.0% |
| 2-Person Household | 341 | 16.2% |
| 3-Person Household | 304 | 14.4% |
| 4+ Person Household | 1,375 | 65.3% |
| Total Housing Units | 2,104 | 100.0% |
Occupancy by Ownership by Household Size in Orosi
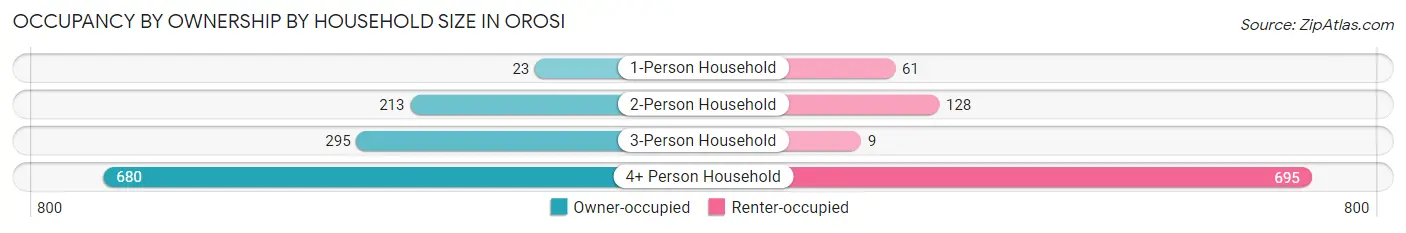
| Household Size | Owner-occupied | Renter-occupied |
| 1-Person Household | 23 (27.4%) | 61 (72.6%) |
| 2-Person Household | 213 (62.5%) | 128 (37.5%) |
| 3-Person Household | 295 (97.0%) | 9 (3.0%) |
| 4+ Person Household | 680 (49.4%) | 695 (50.5%) |
| Total Housing Units | 1,211 (57.6%) | 893 (42.4%) |
Occupancy by Educational Attainment in Orosi
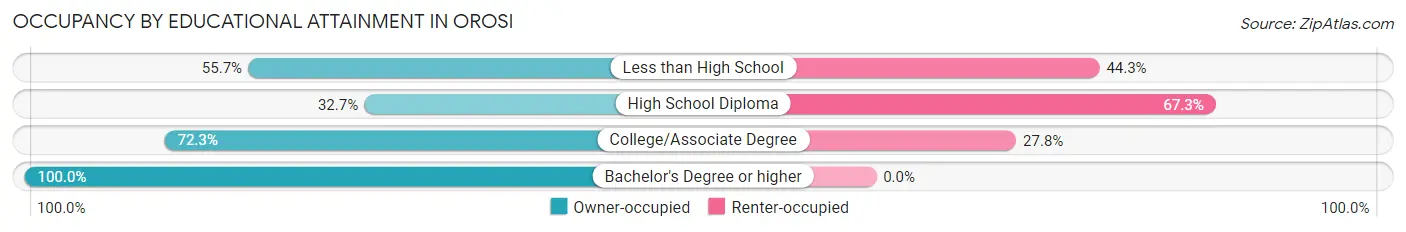
| Household Size | Owner-occupied | Renter-occupied |
| Less than High School | 545 (55.7%) | 433 (44.3%) |
| High School Diploma | 139 (32.7%) | 286 (67.3%) |
| College/Associate Degree | 453 (72.3%) | 174 (27.8%) |
| Bachelor's Degree or higher | 74 (100.0%) | 0 (0.0%) |
Occupancy by Age of Householder in Orosi
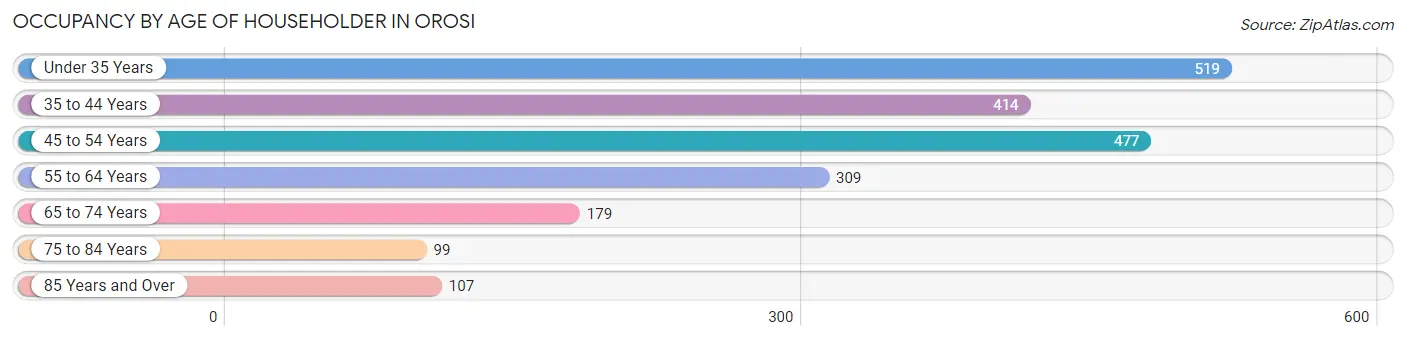
| Age Bracket | # Households | % Households |
| Under 35 Years | 519 | 24.7% |
| 35 to 44 Years | 414 | 19.7% |
| 45 to 54 Years | 477 | 22.7% |
| 55 to 64 Years | 309 | 14.7% |
| 65 to 74 Years | 179 | 8.5% |
| 75 to 84 Years | 99 | 4.7% |
| 85 Years and Over | 107 | 5.1% |
| Total | 2,104 | 100.0% |
Housing Finances in Orosi
Median Income by Occupancy in Orosi
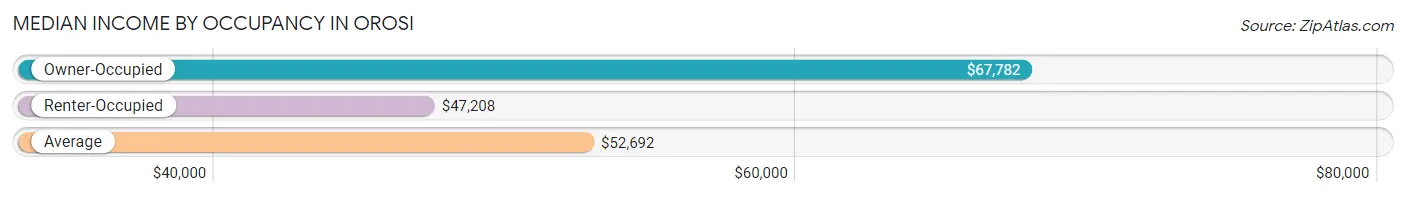
| Occupancy Type | # Households | Median Income |
| Owner-Occupied | 1,211 (57.6%) | $67,782 |
| Renter-Occupied | 893 (42.4%) | $47,208 |
| Average | 2,104 (100.0%) | $52,692 |
Occupancy by Householder Income Bracket in Orosi
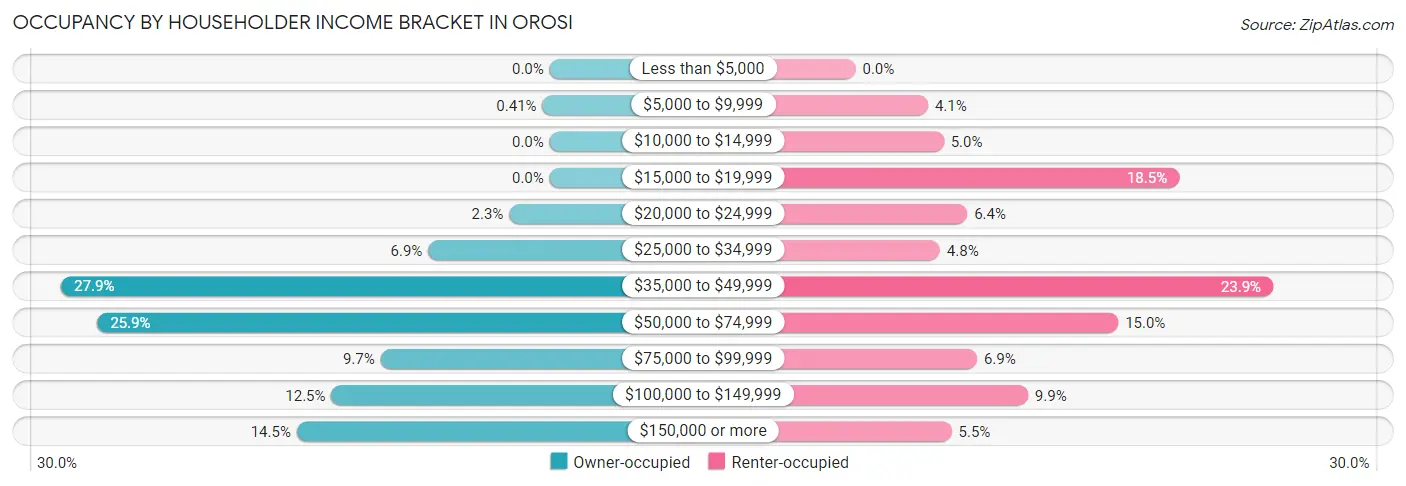
| Income Bracket | Owner-occupied | Renter-occupied |
| Less than $5,000 | 0 (0.0%) | 0 (0.0%) |
| $5,000 to $9,999 | 5 (0.4%) | 37 (4.1%) |
| $10,000 to $14,999 | 0 (0.0%) | 45 (5.0%) |
| $15,000 to $19,999 | 0 (0.0%) | 165 (18.5%) |
| $20,000 to $24,999 | 28 (2.3%) | 57 (6.4%) |
| $25,000 to $34,999 | 84 (6.9%) | 43 (4.8%) |
| $35,000 to $49,999 | 338 (27.9%) | 213 (23.8%) |
| $50,000 to $74,999 | 313 (25.9%) | 134 (15.0%) |
| $75,000 to $99,999 | 117 (9.7%) | 62 (6.9%) |
| $100,000 to $149,999 | 151 (12.5%) | 88 (9.9%) |
| $150,000 or more | 175 (14.4%) | 49 (5.5%) |
| Total | 1,211 (100.0%) | 893 (100.0%) |
Monthly Housing Cost Tiers in Orosi
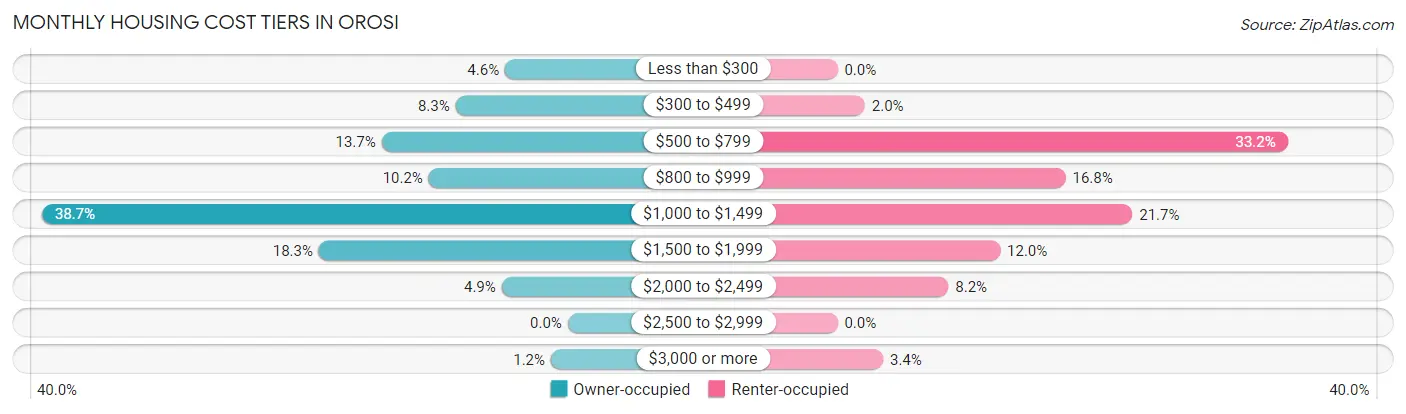
| Monthly Cost | Owner-occupied | Renter-occupied |
| Less than $300 | 56 (4.6%) | 0 (0.0%) |
| $300 to $499 | 100 (8.3%) | 18 (2.0%) |
| $500 to $799 | 166 (13.7%) | 296 (33.2%) |
| $800 to $999 | 124 (10.2%) | 150 (16.8%) |
| $1,000 to $1,499 | 469 (38.7%) | 194 (21.7%) |
| $1,500 to $1,999 | 222 (18.3%) | 107 (12.0%) |
| $2,000 to $2,499 | 59 (4.9%) | 73 (8.2%) |
| $2,500 to $2,999 | 0 (0.0%) | 0 (0.0%) |
| $3,000 or more | 15 (1.2%) | 30 (3.4%) |
| Total | 1,211 (100.0%) | 893 (100.0%) |
Physical Housing Characteristics in Orosi
Housing Structures in Orosi
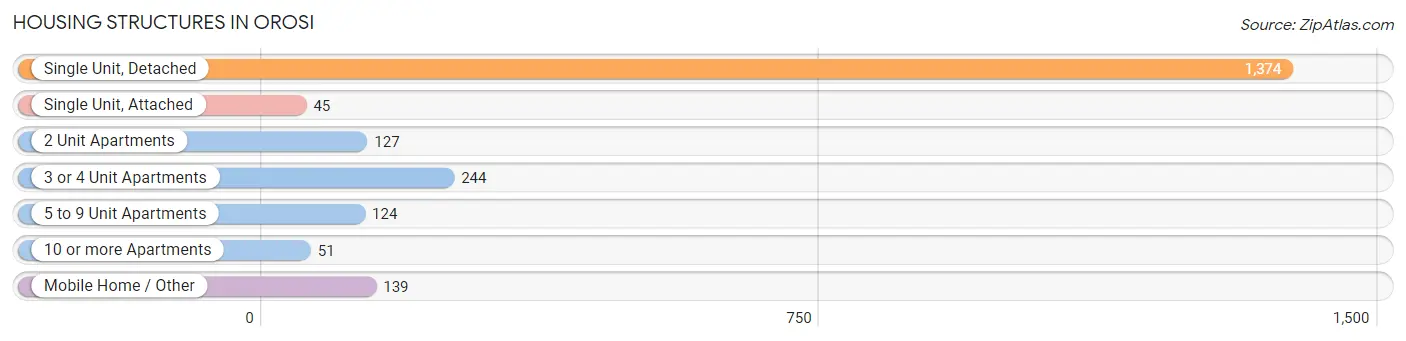
| Structure Type | # Housing Units | % Housing Units |
| Single Unit, Detached | 1,374 | 65.3% |
| Single Unit, Attached | 45 | 2.1% |
| 2 Unit Apartments | 127 | 6.0% |
| 3 or 4 Unit Apartments | 244 | 11.6% |
| 5 to 9 Unit Apartments | 124 | 5.9% |
| 10 or more Apartments | 51 | 2.4% |
| Mobile Home / Other | 139 | 6.6% |
| Total | 2,104 | 100.0% |
Housing Structures by Occupancy in Orosi
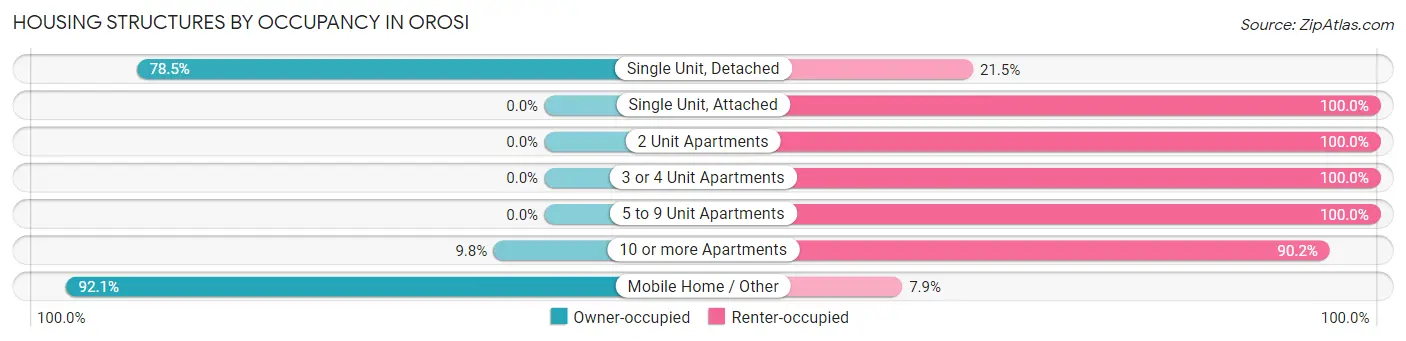
| Structure Type | Owner-occupied | Renter-occupied |
| Single Unit, Detached | 1,078 (78.5%) | 296 (21.5%) |
| Single Unit, Attached | 0 (0.0%) | 45 (100.0%) |
| 2 Unit Apartments | 0 (0.0%) | 127 (100.0%) |
| 3 or 4 Unit Apartments | 0 (0.0%) | 244 (100.0%) |
| 5 to 9 Unit Apartments | 0 (0.0%) | 124 (100.0%) |
| 10 or more Apartments | 5 (9.8%) | 46 (90.2%) |
| Mobile Home / Other | 128 (92.1%) | 11 (7.9%) |
| Total | 1,211 (57.6%) | 893 (42.4%) |
Housing Structures by Number of Rooms in Orosi
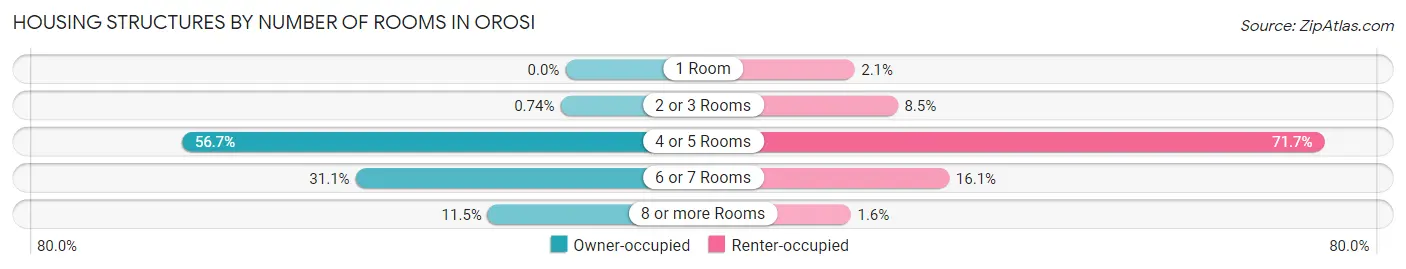
| Number of Rooms | Owner-occupied | Renter-occupied |
| 1 Room | 0 (0.0%) | 19 (2.1%) |
| 2 or 3 Rooms | 9 (0.7%) | 76 (8.5%) |
| 4 or 5 Rooms | 687 (56.7%) | 640 (71.7%) |
| 6 or 7 Rooms | 376 (31.0%) | 144 (16.1%) |
| 8 or more Rooms | 139 (11.5%) | 14 (1.6%) |
| Total | 1,211 (100.0%) | 893 (100.0%) |
Housing Structure by Heating Type in Orosi
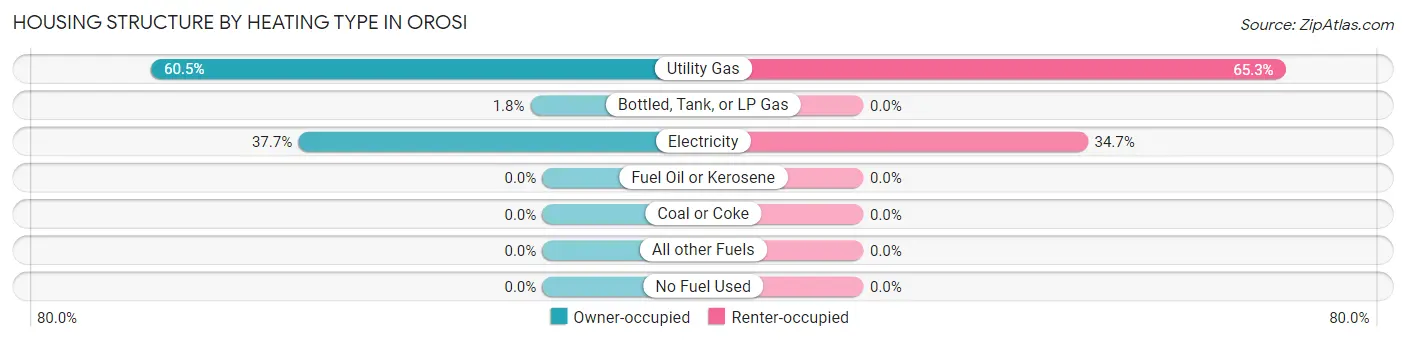
| Heating Type | Owner-occupied | Renter-occupied |
| Utility Gas | 732 (60.5%) | 583 (65.3%) |
| Bottled, Tank, or LP Gas | 22 (1.8%) | 0 (0.0%) |
| Electricity | 457 (37.7%) | 310 (34.7%) |
| Fuel Oil or Kerosene | 0 (0.0%) | 0 (0.0%) |
| Coal or Coke | 0 (0.0%) | 0 (0.0%) |
| All other Fuels | 0 (0.0%) | 0 (0.0%) |
| No Fuel Used | 0 (0.0%) | 0 (0.0%) |
| Total | 1,211 (100.0%) | 893 (100.0%) |
Household Vehicle Usage in Orosi
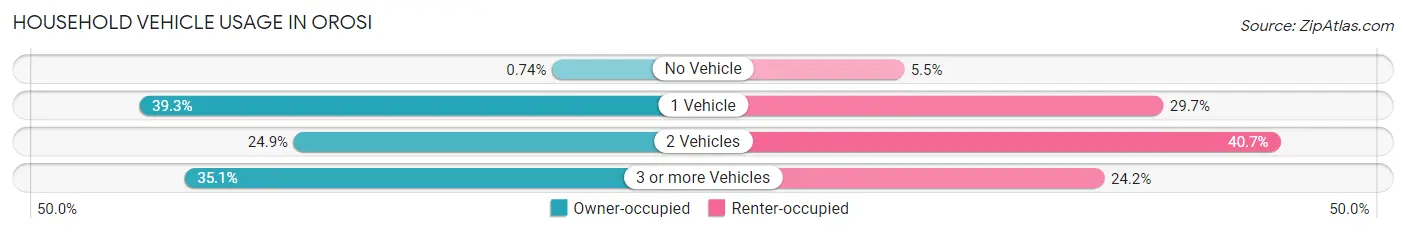
| Vehicles per Household | Owner-occupied | Renter-occupied |
| No Vehicle | 9 (0.7%) | 49 (5.5%) |
| 1 Vehicle | 476 (39.3%) | 265 (29.7%) |
| 2 Vehicles | 301 (24.9%) | 363 (40.6%) |
| 3 or more Vehicles | 425 (35.1%) | 216 (24.2%) |
| Total | 1,211 (100.0%) | 893 (100.0%) |
Real Estate & Mortgages in Orosi
Real Estate and Mortgage Overview in Orosi
| Characteristic | Without Mortgage | With Mortgage |
| Housing Units | 256 | 955 |
| Median Property Value | $164,400 | $229,600 |
| Median Household Income | $65,944 | $166 |
| Monthly Housing Costs | $465 | $15 |
| Real Estate Taxes | $1,394 | $29 |
Property Value by Mortgage Status in Orosi
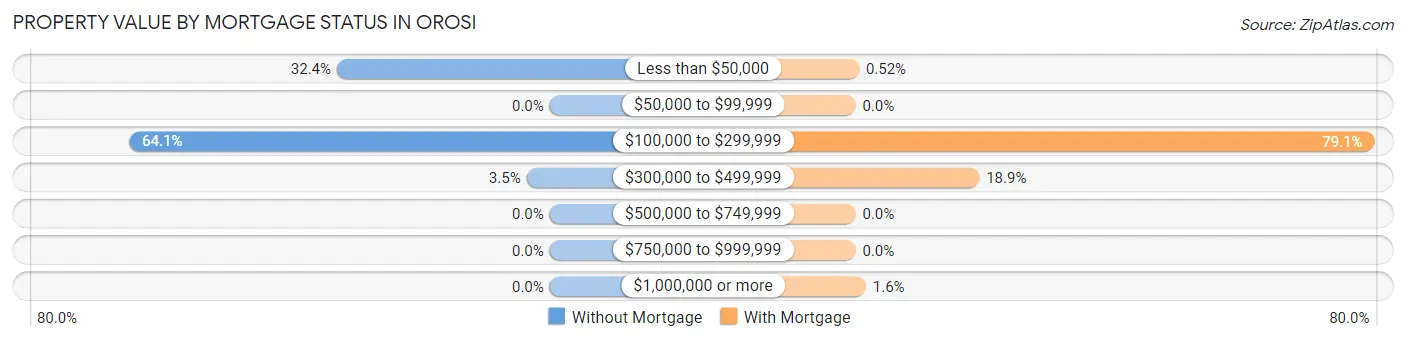
| Property Value | Without Mortgage | With Mortgage |
| Less than $50,000 | 83 (32.4%) | 5 (0.5%) |
| $50,000 to $99,999 | 0 (0.0%) | 0 (0.0%) |
| $100,000 to $299,999 | 164 (64.1%) | 755 (79.1%) |
| $300,000 to $499,999 | 9 (3.5%) | 180 (18.9%) |
| $500,000 to $749,999 | 0 (0.0%) | 0 (0.0%) |
| $750,000 to $999,999 | 0 (0.0%) | 0 (0.0%) |
| $1,000,000 or more | 0 (0.0%) | 15 (1.6%) |
| Total | 256 (100.0%) | 955 (100.0%) |
Household Income by Mortgage Status in Orosi
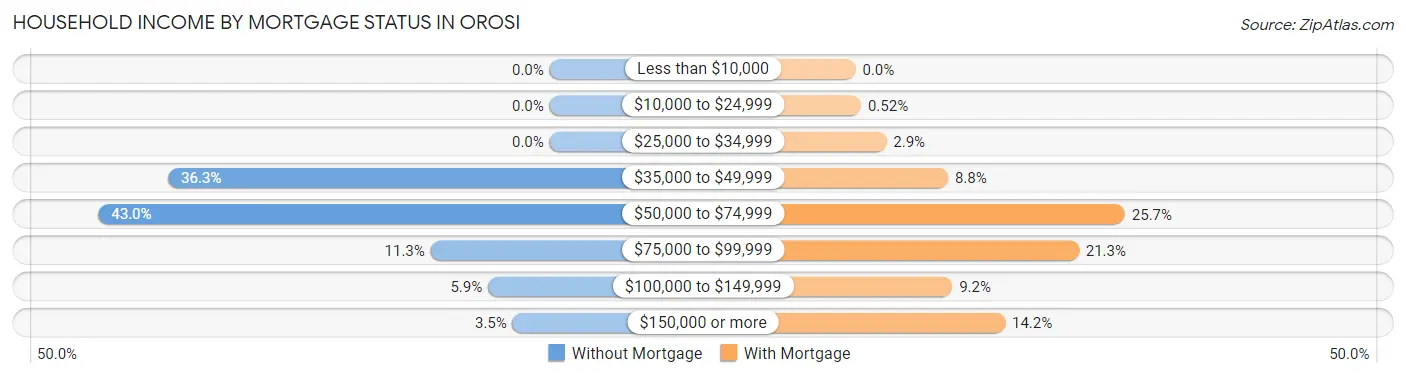
| Household Income | Without Mortgage | With Mortgage |
| Less than $10,000 | 0 (0.0%) | 0 (0.0%) |
| $10,000 to $24,999 | 0 (0.0%) | 5 (0.5%) |
| $25,000 to $34,999 | 0 (0.0%) | 28 (2.9%) |
| $35,000 to $49,999 | 93 (36.3%) | 84 (8.8%) |
| $50,000 to $74,999 | 110 (43.0%) | 245 (25.7%) |
| $75,000 to $99,999 | 29 (11.3%) | 203 (21.3%) |
| $100,000 to $149,999 | 15 (5.9%) | 88 (9.2%) |
| $150,000 or more | 9 (3.5%) | 136 (14.2%) |
| Total | 256 (100.0%) | 955 (100.0%) |
Property Value to Household Income Ratio in Orosi
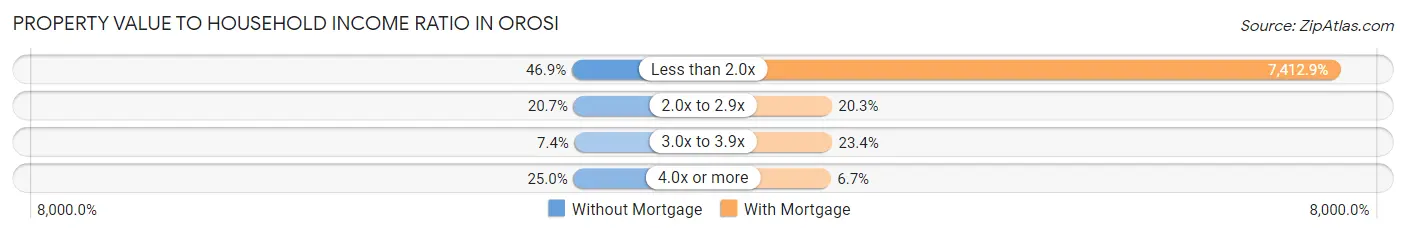
| Value-to-Income Ratio | Without Mortgage | With Mortgage |
| Less than 2.0x | 120 (46.9%) | 70,793 (7,412.9%) |
| 2.0x to 2.9x | 53 (20.7%) | 194 (20.3%) |
| 3.0x to 3.9x | 19 (7.4%) | 223 (23.4%) |
| 4.0x or more | 64 (25.0%) | 64 (6.7%) |
| Total | 256 (100.0%) | 955 (100.0%) |
Real Estate Taxes by Mortgage Status in Orosi
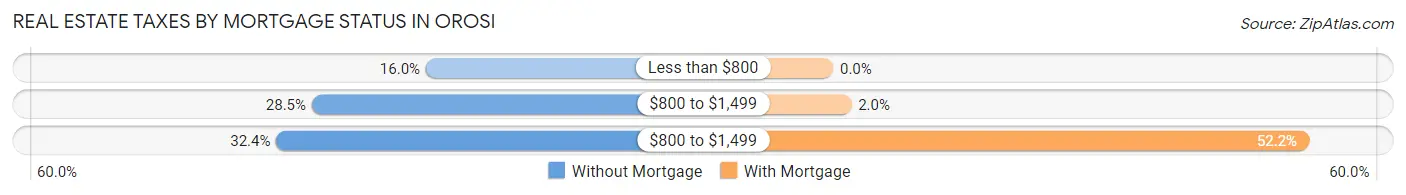
| Property Taxes | Without Mortgage | With Mortgage |
| Less than $800 | 41 (16.0%) | 0 (0.0%) |
| $800 to $1,499 | 73 (28.5%) | 19 (2.0%) |
| $800 to $1,499 | 83 (32.4%) | 498 (52.1%) |
| Total | 256 (100.0%) | 955 (100.0%) |
Health & Disability in Orosi
Health Insurance Coverage by Age in Orosi
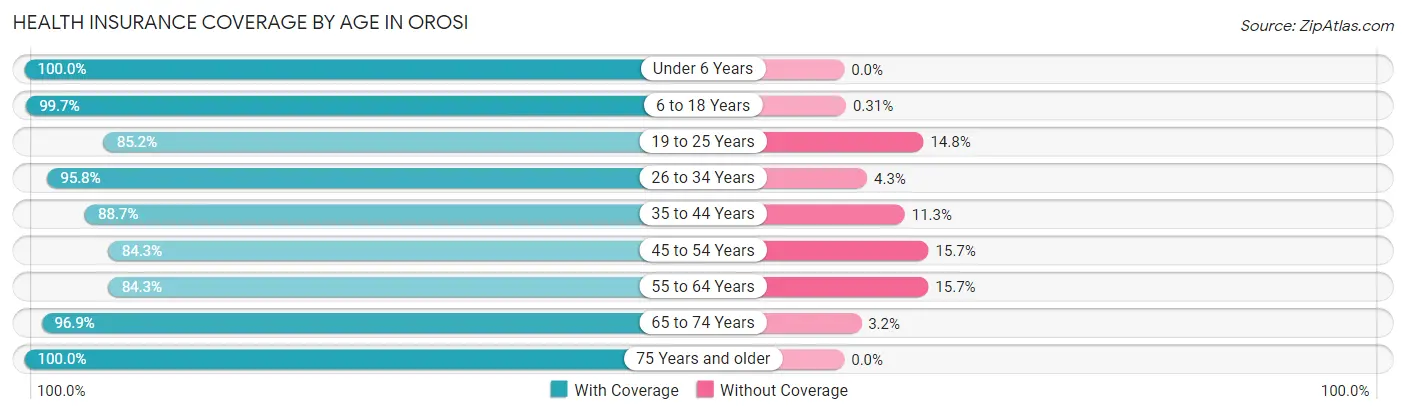
| Age Bracket | With Coverage | Without Coverage |
| Under 6 Years | 1,055 (100.0%) | 0 (0.0%) |
| 6 to 18 Years | 1,930 (99.7%) | 6 (0.3%) |
| 19 to 25 Years | 860 (85.2%) | 149 (14.8%) |
| 26 to 34 Years | 1,150 (95.8%) | 51 (4.3%) |
| 35 to 44 Years | 1,210 (88.7%) | 154 (11.3%) |
| 45 to 54 Years | 831 (84.3%) | 155 (15.7%) |
| 55 to 64 Years | 489 (84.3%) | 91 (15.7%) |
| 65 to 74 Years | 554 (96.9%) | 18 (3.2%) |
| 75 Years and older | 397 (100.0%) | 0 (0.0%) |
| Total | 8,476 (93.1%) | 624 (6.9%) |
Health Insurance Coverage by Citizenship Status in Orosi
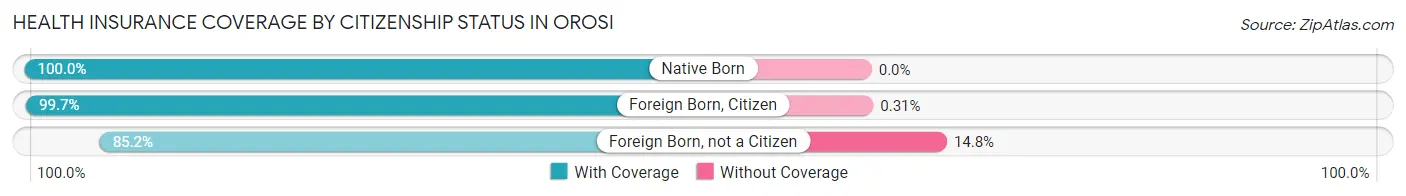
| Citizenship Status | With Coverage | Without Coverage |
| Native Born | 1,055 (100.0%) | 0 (0.0%) |
| Foreign Born, Citizen | 1,930 (99.7%) | 6 (0.3%) |
| Foreign Born, not a Citizen | 860 (85.2%) | 149 (14.8%) |
Health Insurance Coverage by Household Income in Orosi
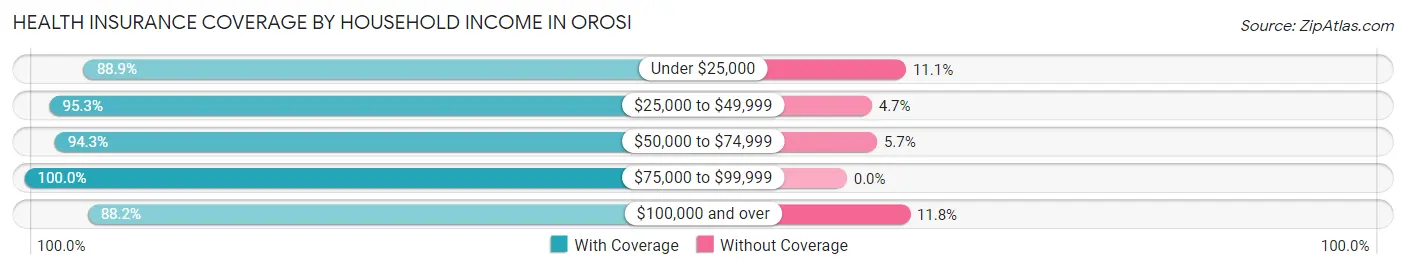
| Household Income | With Coverage | Without Coverage |
| Under $25,000 | 922 (88.9%) | 115 (11.1%) |
| $25,000 to $49,999 | 2,915 (95.3%) | 143 (4.7%) |
| $50,000 to $74,999 | 1,749 (94.3%) | 105 (5.7%) |
| $75,000 to $99,999 | 945 (100.0%) | 0 (0.0%) |
| $100,000 and over | 1,945 (88.2%) | 261 (11.8%) |
Public vs Private Health Insurance Coverage by Age in Orosi
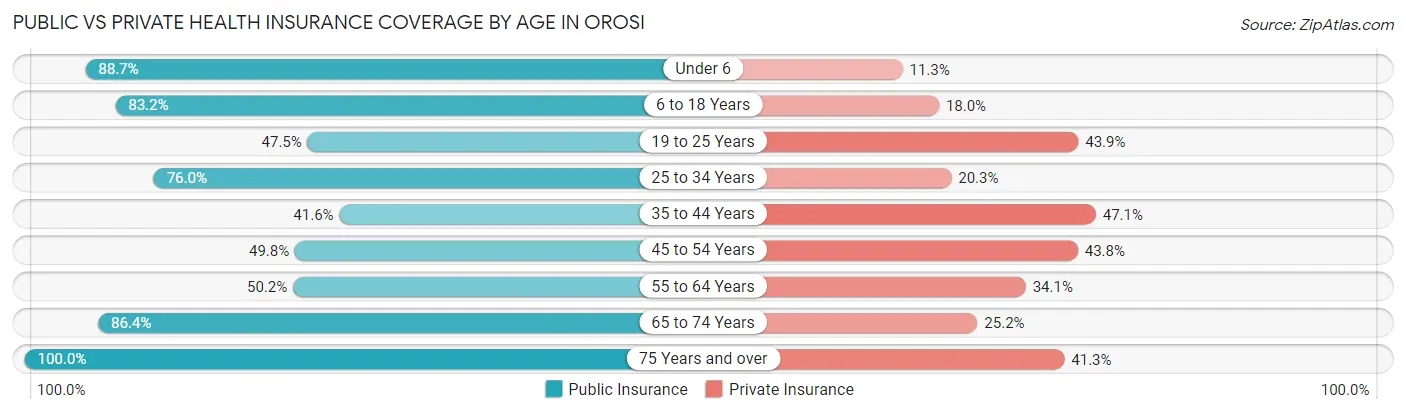
| Age Bracket | Public Insurance | Private Insurance |
| Under 6 | 936 (88.7%) | 119 (11.3%) |
| 6 to 18 Years | 1,610 (83.2%) | 349 (18.0%) |
| 19 to 25 Years | 479 (47.5%) | 443 (43.9%) |
| 25 to 34 Years | 913 (76.0%) | 244 (20.3%) |
| 35 to 44 Years | 567 (41.6%) | 643 (47.1%) |
| 45 to 54 Years | 491 (49.8%) | 432 (43.8%) |
| 55 to 64 Years | 291 (50.2%) | 198 (34.1%) |
| 65 to 74 Years | 494 (86.4%) | 144 (25.2%) |
| 75 Years and over | 397 (100.0%) | 164 (41.3%) |
| Total | 6,178 (67.9%) | 2,736 (30.1%) |
Disability Status by Sex by Age in Orosi
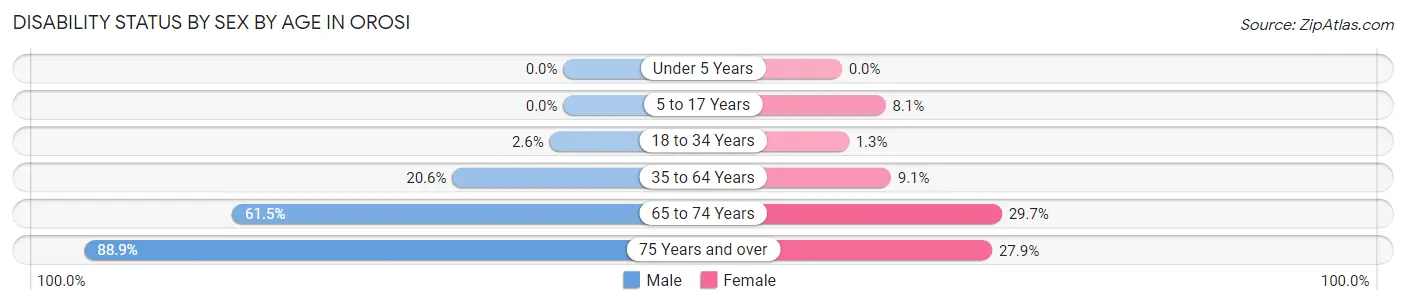
| Age Bracket | Male | Female |
| Under 5 Years | 0 (0.0%) | 0 (0.0%) |
| 5 to 17 Years | 0 (0.0%) | 76 (8.1%) |
| 18 to 34 Years | 31 (2.6%) | 14 (1.3%) |
| 35 to 64 Years | 291 (20.6%) | 138 (9.1%) |
| 65 to 74 Years | 99 (61.5%) | 122 (29.7%) |
| 75 Years and over | 168 (88.9%) | 58 (27.9%) |
Disability Class by Sex by Age in Orosi
Disability Class: Hearing Difficulty
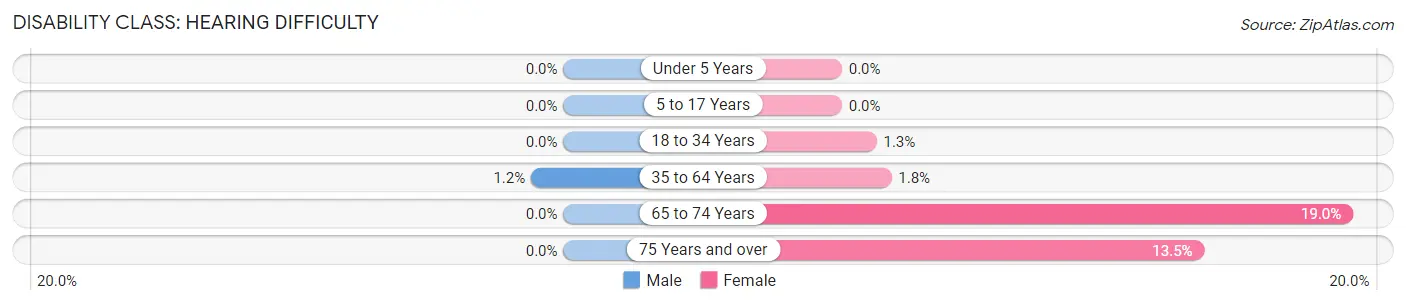
| Age Bracket | Male | Female |
| Under 5 Years | 0 (0.0%) | 0 (0.0%) |
| 5 to 17 Years | 0 (0.0%) | 0 (0.0%) |
| 18 to 34 Years | 0 (0.0%) | 14 (1.3%) |
| 35 to 64 Years | 17 (1.2%) | 28 (1.8%) |
| 65 to 74 Years | 0 (0.0%) | 78 (19.0%) |
| 75 Years and over | 0 (0.0%) | 28 (13.5%) |
Disability Class: Vision Difficulty
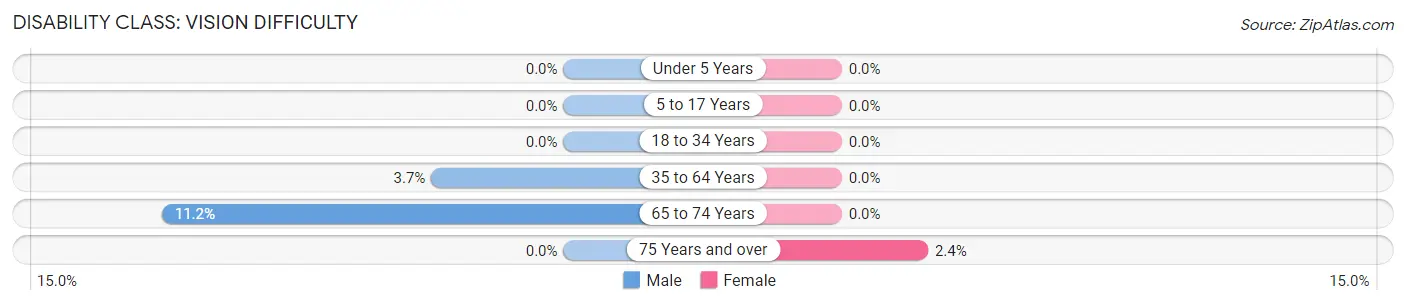
| Age Bracket | Male | Female |
| Under 5 Years | 0 (0.0%) | 0 (0.0%) |
| 5 to 17 Years | 0 (0.0%) | 0 (0.0%) |
| 18 to 34 Years | 0 (0.0%) | 0 (0.0%) |
| 35 to 64 Years | 52 (3.7%) | 0 (0.0%) |
| 65 to 74 Years | 18 (11.2%) | 0 (0.0%) |
| 75 Years and over | 0 (0.0%) | 5 (2.4%) |
Disability Class: Cognitive Difficulty
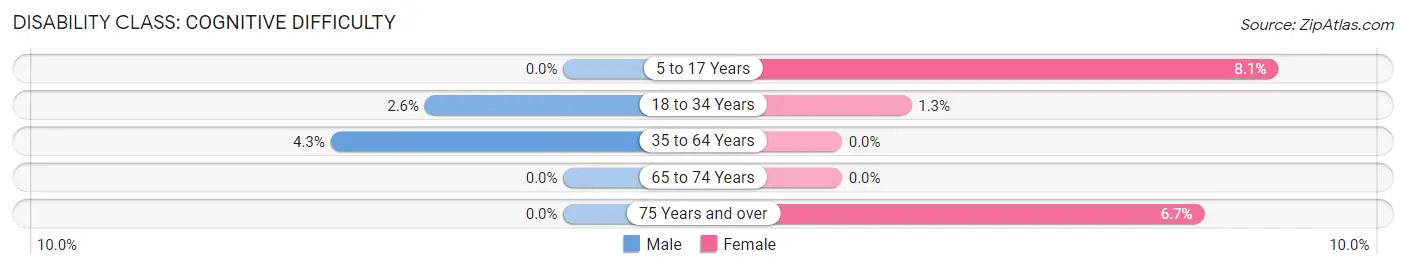
| Age Bracket | Male | Female |
| 5 to 17 Years | 0 (0.0%) | 76 (8.1%) |
| 18 to 34 Years | 31 (2.6%) | 14 (1.3%) |
| 35 to 64 Years | 61 (4.3%) | 0 (0.0%) |
| 65 to 74 Years | 0 (0.0%) | 0 (0.0%) |
| 75 Years and over | 0 (0.0%) | 14 (6.7%) |
Disability Class: Ambulatory Difficulty
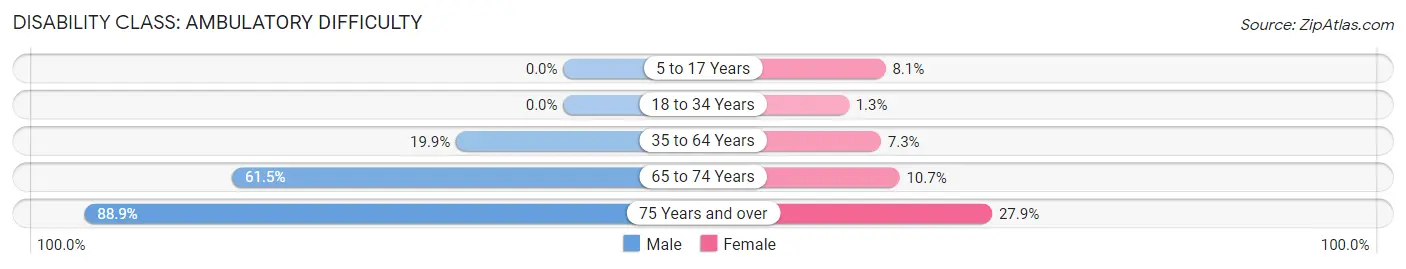
| Age Bracket | Male | Female |
| 5 to 17 Years | 0 (0.0%) | 76 (8.1%) |
| 18 to 34 Years | 0 (0.0%) | 14 (1.3%) |
| 35 to 64 Years | 281 (19.9%) | 110 (7.2%) |
| 65 to 74 Years | 99 (61.5%) | 44 (10.7%) |
| 75 Years and over | 168 (88.9%) | 58 (27.9%) |
Disability Class: Self-Care Difficulty
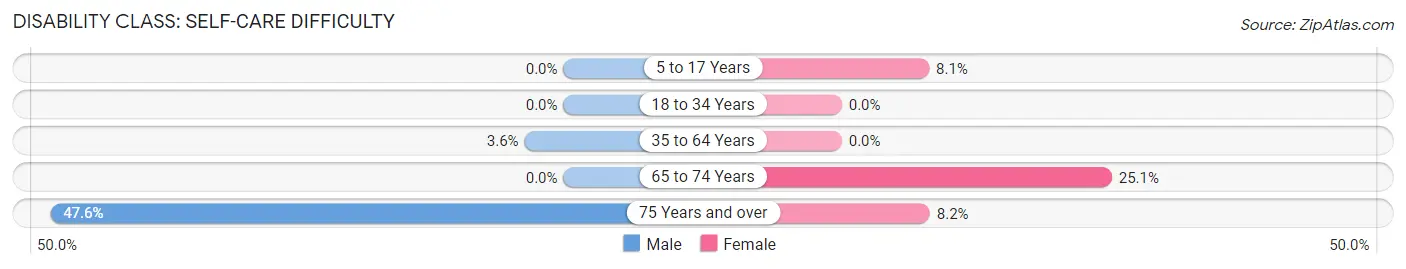
| Age Bracket | Male | Female |
| 5 to 17 Years | 0 (0.0%) | 76 (8.1%) |
| 18 to 34 Years | 0 (0.0%) | 0 (0.0%) |
| 35 to 64 Years | 51 (3.6%) | 0 (0.0%) |
| 65 to 74 Years | 0 (0.0%) | 103 (25.1%) |
| 75 Years and over | 90 (47.6%) | 17 (8.2%) |
Technology Access in Orosi
Computing Device Access in Orosi
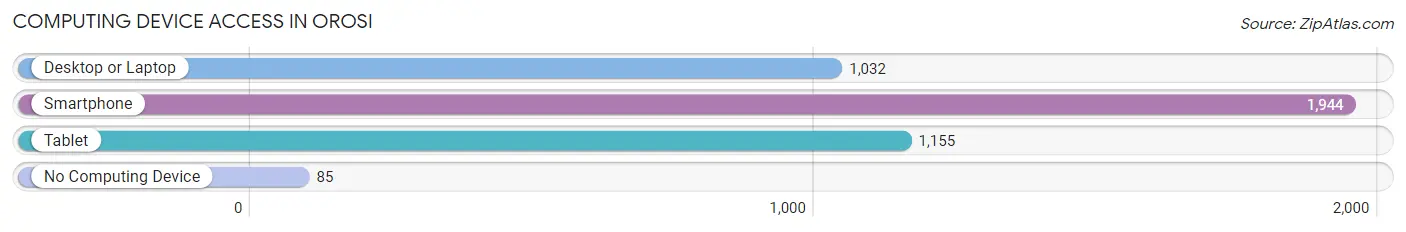
| Device Type | # Households | % Households |
| Desktop or Laptop | 1,032 | 49.0% |
| Smartphone | 1,944 | 92.4% |
| Tablet | 1,155 | 54.9% |
| No Computing Device | 85 | 4.0% |
| Total | 2,104 | 100.0% |
Internet Access in Orosi
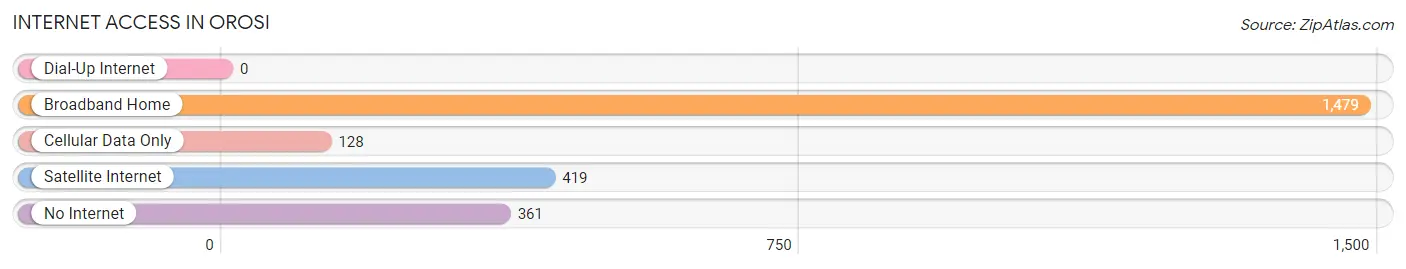
| Internet Type | # Households | % Households |
| Dial-Up Internet | 0 | 0.0% |
| Broadband Home | 1,479 | 70.3% |
| Cellular Data Only | 128 | 6.1% |
| Satellite Internet | 419 | 19.9% |
| No Internet | 361 | 17.2% |
| Total | 2,104 | 100.0% |
Orosi Summary
Orosi is a small unincorporated community located in Tulare County, California. It is situated in the foothills of the Sierra Nevada Mountains, approximately 10 miles east of Visalia. The population of Orosi was estimated to be 4,719 in 2019.
History
Orosi was founded in 1874 by a group of settlers from the Azores Islands of Portugal. The settlers named the town after the Azorean village of Orosi. The town was originally a farming community, and the main crops grown were grapes, olives, and citrus fruits. In the early 1900s, the town began to grow and develop, and by the 1920s, it had become a popular tourist destination.
Geography
Orosi is located in the foothills of the Sierra Nevada Mountains, approximately 10 miles east of Visalia. The town is situated at an elevation of 845 feet above sea level. The climate in Orosi is semi-arid, with hot summers and mild winters. The average annual precipitation is approximately 10 inches.
Economy
The economy of Orosi is largely based on agriculture. The main crops grown in the area are grapes, olives, and citrus fruits. The town also has a number of small businesses, including restaurants, grocery stores, and gas stations.
Demographics
As of 2019, the population of Orosi was estimated to be 4,719. The racial makeup of the town was 57.3% White, 0.7% African American, 0.3% Native American, 0.3% Asian, 0.1% Pacific Islander, and 40.3% from other races. The median household income in Orosi was $37,917, and the median age was 28.5 years.
Conclusion
Orosi is a small unincorporated community located in Tulare County, California. It is situated in the foothills of the Sierra Nevada Mountains, approximately 10 miles east of Visalia. The population of Orosi was estimated to be 4,719 in 2019. The economy of Orosi is largely based on agriculture, and the main crops grown in the area are grapes, olives, and citrus fruits. The racial makeup of the town was 57.3% White, 0.7% African American, 0.3% Native American, 0.3% Asian, 0.1% Pacific Islander, and 40.3% from other races. The median household income in Orosi was $37,917, and the median age was 28.5 years.
Common Questions
What is Per Capita Income in Orosi?
Per Capita income in Orosi is $16,673.
What is the Median Family Income in Orosi?
Median Family Income in Orosi is $48,558.
What is the Median Household income in Orosi?
Median Household Income in Orosi is $52,692.
What is Income or Wage Gap in Orosi?
Income or Wage Gap in Orosi is 19.2%.
Women in Orosi earn 80.8 cents for every dollar earned by a man.
What is Family Income Deficit in Orosi?
Family Income Deficit in Orosi is $9,616.
Families that are below poverty line in Orosi earn $9,616 less on average than the poverty threshold level.
What is Inequality or Gini Index in Orosi?
Inequality or Gini Index in Orosi is 0.40.
What is the Total Population of Orosi?
Total Population of Orosi is 9,100.
What is the Total Male Population of Orosi?
Total Male Population of Orosi is 4,573.
What is the Total Female Population of Orosi?
Total Female Population of Orosi is 4,527.
What is the Ratio of Males per 100 Females in Orosi?
There are 101.02 Males per 100 Females in Orosi.
What is the Ratio of Females per 100 Males in Orosi?
There are 98.99 Females per 100 Males in Orosi.
What is the Median Population Age in Orosi?
Median Population Age in Orosi is 29.5 Years.
What is the Average Family Size in Orosi
Average Family Size in Orosi is 4.4 People.
What is the Average Household Size in Orosi
Average Household Size in Orosi is 4.3 People.
How Large is the Labor Force in Orosi?
There are 3,690 People in the Labor Forcein in Orosi.
What is the Percentage of People in the Labor Force in Orosi?
57.6% of People are in the Labor Force in Orosi.
What is the Unemployment Rate in Orosi?
Unemployment Rate in Orosi is 10.6%.