Cities with the Highest Poverty Level Among Children Under the Age of 5 in the United States
RELATED REPORTS & OPTIONS
Highest Poverty | Child 0-5
United States
Compare Cities
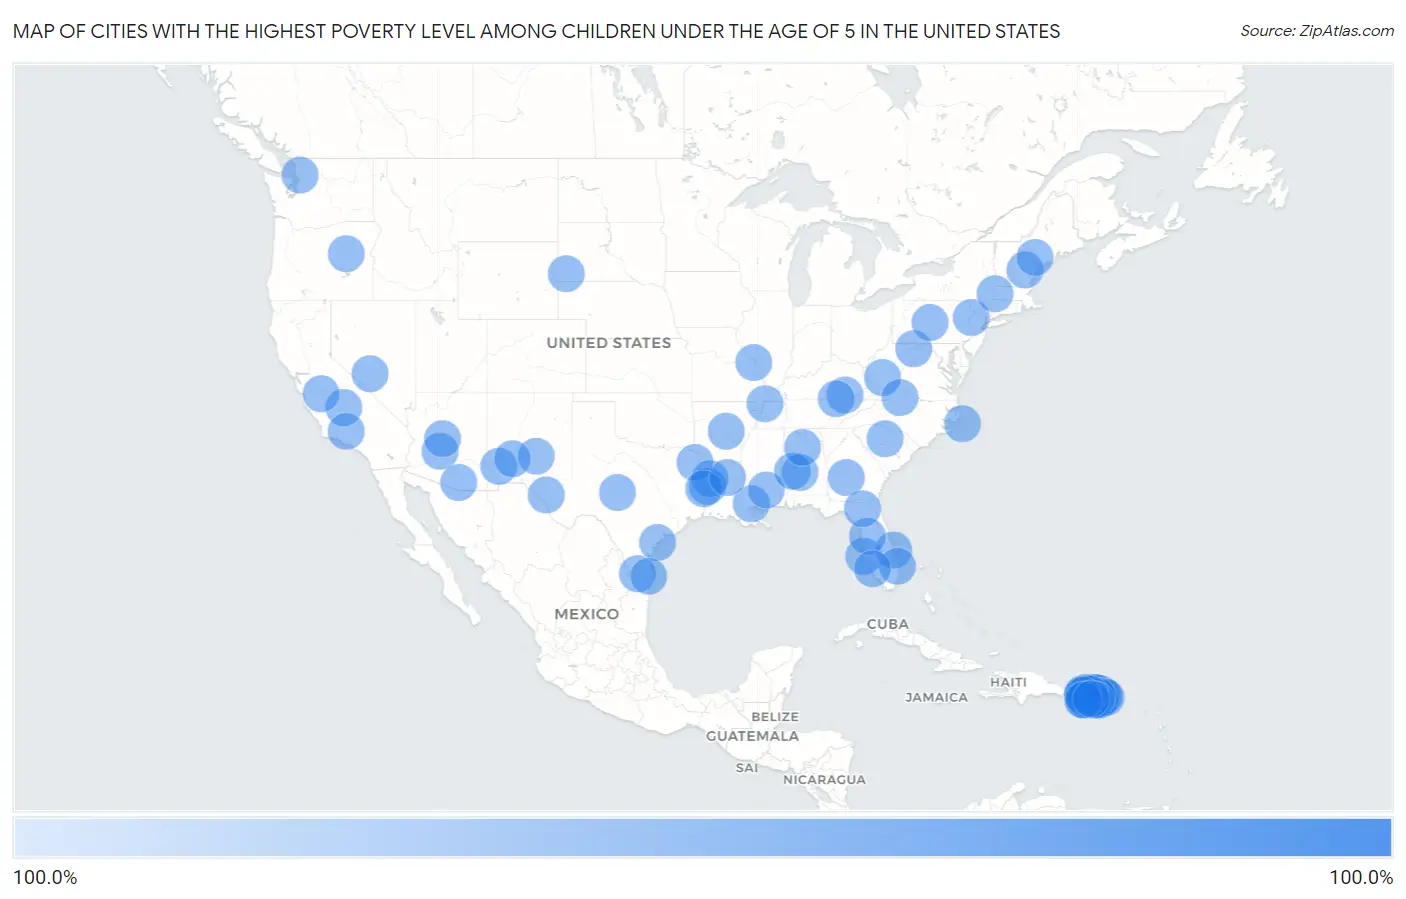
Map of Cities with the Highest Poverty Level Among Children Under the Age of 5 in the United States
0.0%
100.0%
Cities with the Highest Poverty Level Among Children Under the Age of 5 in the United States
| City | Child Poverty | vs State | vs National | |
| 1. | Sun City | 100.0% | 19.3%(+80.7)#1 | 18.1%(+81.9)#1 |
| 2. | Green Valley | 100.0% | 19.3%(+80.7)#2 | 18.1%(+81.9)#2 |
| 3. | Quebradillas | 100.0% | 61.4%(+38.6)#1 | 18.1%(+81.9)#3 |
| 4. | Siesta Key | 100.0% | 19.3%(+80.7)#1 | 18.1%(+81.9)#4 |
| 5. | Rainbow Springs | 100.0% | 19.3%(+80.7)#2 | 18.1%(+81.9)#5 |
| 6. | Keyser | 100.0% | 25.5%(+74.5)#1 | 18.1%(+81.9)#6 |
| 7. | Gifford | 100.0% | 19.3%(+80.7)#3 | 18.1%(+81.9)#7 |
| 8. | Donora Borough | 100.0% | 17.3%(+82.7)#1 | 18.1%(+81.9)#8 |
| 9. | Santa Barbara | 100.0% | 61.4%(+38.6)#2 | 18.1%(+81.9)#9 |
| 10. | Aguilita | 100.0% | 61.4%(+38.6)#3 | 18.1%(+81.9)#10 |
| 11. | Tiptonville | 100.0% | 21.4%(+78.6)#1 | 18.1%(+81.9)#11 |
| 12. | Hot Springs | 100.0% | 17.4%(+82.6)#1 | 18.1%(+81.9)#12 |
| 13. | Naranjito | 100.0% | 61.4%(+38.6)#4 | 18.1%(+81.9)#13 |
| 14. | Aguas Buenas | 100.0% | 61.4%(+38.6)#5 | 18.1%(+81.9)#14 |
| 15. | Aguada | 100.0% | 61.4%(+38.6)#6 | 18.1%(+81.9)#15 |
| 16. | Barbourville | 100.0% | 23.3%(+76.7)#1 | 18.1%(+81.9)#16 |
| 17. | Natalbany | 100.0% | 28.4%(+71.6)#1 | 18.1%(+81.9)#17 |
| 18. | Ocala Estates | 100.0% | 19.3%(+80.7)#4 | 18.1%(+81.9)#18 |
| 19. | Hill N Dale | 100.0% | 19.3%(+80.7)#5 | 18.1%(+81.9)#19 |
| 20. | Comunas | 100.0% | 61.4%(+38.6)#7 | 18.1%(+81.9)#20 |
| 21. | Pine Ridge | 100.0% | 17.3%(+82.7)#2 | 18.1%(+81.9)#21 |
| 22. | Strathmore | 100.0% | 15.6%(+84.4)#1 | 18.1%(+81.9)#22 |
| 23. | Union | 100.0% | 14.3%(+85.7)#1 | 18.1%(+81.9)#23 |
| 24. | Patillas | 100.0% | 61.4%(+38.6)#8 | 18.1%(+81.9)#24 |
| 25. | Vienna | 100.0% | 20.3%(+79.7)#1 | 18.1%(+81.9)#25 |
| 26. | Carrizales | 100.0% | 61.4%(+38.6)#9 | 18.1%(+81.9)#26 |
| 27. | Emajagua | 100.0% | 61.4%(+38.6)#10 | 18.1%(+81.9)#27 |
| 28. | La Dolores | 100.0% | 61.4%(+38.6)#11 | 18.1%(+81.9)#28 |
| 29. | Barranquitas | 100.0% | 61.4%(+38.6)#12 | 18.1%(+81.9)#29 |
| 30. | Wolfeboro | 100.0% | 9.4%(+90.6)#1 | 18.1%(+81.9)#30 |
| 31. | Frazier Park | 100.0% | 15.6%(+84.4)#2 | 18.1%(+81.9)#31 |
| 32. | Loiza | 100.0% | 61.4%(+38.6)#13 | 18.1%(+81.9)#32 |
| 33. | Potala Pastillo | 100.0% | 61.4%(+38.6)#14 | 18.1%(+81.9)#33 |
| 34. | Watertown | 100.0% | 19.3%(+80.7)#6 | 18.1%(+81.9)#34 |
| 35. | Ceiba | 100.0% | 61.4%(+38.6)#15 | 18.1%(+81.9)#35 |
| 36. | Ruidoso Downs | 100.0% | 27.4%(+72.6)#1 | 18.1%(+81.9)#36 |
| 37. | Luis Llorens Torres | 100.0% | 61.4%(+38.6)#16 | 18.1%(+81.9)#37 |
| 38. | Ingenio | 100.0% | 61.4%(+38.6)#17 | 18.1%(+81.9)#38 |
| 39. | Many | 100.0% | 28.4%(+71.6)#2 | 18.1%(+81.9)#39 |
| 40. | Bryant | 100.0% | 12.6%(+87.4)#1 | 18.1%(+81.9)#40 |
| 41. | Coto Laurel | 100.0% | 61.4%(+38.6)#18 | 18.1%(+81.9)#41 |
| 42. | Aguas Claras | 100.0% | 61.4%(+38.6)#19 | 18.1%(+81.9)#42 |
| 43. | Corazon | 100.0% | 61.4%(+38.6)#20 | 18.1%(+81.9)#43 |
| 44. | Toftrees | 100.0% | 17.3%(+82.7)#3 | 18.1%(+81.9)#44 |
| 45. | South Paris | 100.0% | 14.4%(+85.6)#1 | 18.1%(+81.9)#45 |
| 46. | Jaguas | 100.0% | 61.4%(+38.6)#21 | 18.1%(+81.9)#46 |
| 47. | Martorell | 100.0% | 61.4%(+38.6)#22 | 18.1%(+81.9)#47 |
| 48. | Piedra Gorda | 100.0% | 61.4%(+38.6)#23 | 18.1%(+81.9)#48 |
| 49. | Van Horn | 100.0% | 21.1%(+78.9)#1 | 18.1%(+81.9)#49 |
| 50. | Rawls Springs | 100.0% | 29.3%(+70.7)#1 | 18.1%(+81.9)#50 |
| 51. | Coushatta | 100.0% | 28.4%(+71.6)#3 | 18.1%(+81.9)#51 |
| 52. | Lenox | 100.0% | 12.6%(+87.4)#1 | 18.1%(+81.9)#52 |
| 53. | Fallsburg | 100.0% | 18.7%(+81.3)#1 | 18.1%(+81.9)#53 |
| 54. | Abram | 100.0% | 21.1%(+78.9)#2 | 18.1%(+81.9)#54 |
| 55. | Liborio Negron Torres | 100.0% | 61.4%(+38.6)#24 | 18.1%(+81.9)#55 |
| 56. | Mariano Colon | 100.0% | 61.4%(+38.6)#25 | 18.1%(+81.9)#56 |
| 57. | Wellston | 100.0% | 18.4%(+81.6)#1 | 18.1%(+81.9)#57 |
| 58. | Boqueron Comunidad Cabo Rojo Municipio | 100.0% | 61.4%(+38.6)#26 | 18.1%(+81.9)#58 |
| 59. | Selmont West Selmont | 100.0% | 25.1%(+74.9)#1 | 18.1%(+81.9)#59 |
| 60. | Vieques | 100.0% | 61.4%(+38.6)#27 | 18.1%(+81.9)#60 |
| 61. | Las Carolinas | 100.0% | 61.4%(+38.6)#28 | 18.1%(+81.9)#61 |
| 62. | Jauca | 100.0% | 61.4%(+38.6)#29 | 18.1%(+81.9)#62 |
| 63. | Eden | 100.0% | 21.1%(+78.9)#3 | 18.1%(+81.9)#63 |
| 64. | Cesar Chavez | 100.0% | 21.1%(+78.9)#4 | 18.1%(+81.9)#64 |
| 65. | Braddock Borough | 100.0% | 17.3%(+82.7)#4 | 18.1%(+81.9)#65 |
| 66. | Tonopah | 100.0% | 18.2%(+81.8)#1 | 18.1%(+81.9)#66 |
| 67. | Buena Vista Comunidad Arroyo Municipio | 100.0% | 61.4%(+38.6)#30 | 18.1%(+81.9)#67 |
| 68. | Royal Palm Estates | 100.0% | 19.3%(+80.7)#7 | 18.1%(+81.9)#68 |
| 69. | Uniontown | 100.0% | 25.1%(+74.9)#2 | 18.1%(+81.9)#69 |
| 70. | Santa Clara | 100.0% | 27.4%(+72.6)#2 | 18.1%(+81.9)#70 |
| 71. | La Alianza | 100.0% | 61.4%(+38.6)#31 | 18.1%(+81.9)#71 |
| 72. | Rio Lajas | 100.0% | 61.4%(+38.6)#32 | 18.1%(+81.9)#72 |
| 73. | Linden | 100.0% | 21.1%(+78.9)#5 | 18.1%(+81.9)#73 |
| 74. | Franquez | 100.0% | 61.4%(+38.6)#33 | 18.1%(+81.9)#74 |
| 75. | Harlem Heights | 100.0% | 19.3%(+80.7)#8 | 18.1%(+81.9)#75 |
| 76. | Winnsboro Mills | 100.0% | 22.4%(+77.6)#1 | 18.1%(+81.9)#76 |
| 77. | Lluveras | 100.0% | 61.4%(+38.6)#34 | 18.1%(+81.9)#77 |
| 78. | Pole Ojea | 100.0% | 61.4%(+38.6)#35 | 18.1%(+81.9)#78 |
| 79. | Jobos | 100.0% | 61.4%(+38.6)#37 | 18.1%(+81.9)#79 |
| 80. | La Playa | 100.0% | 61.4%(+38.6)#38 | 18.1%(+81.9)#80 |
| 81. | Rafael Capo | 100.0% | 61.4%(+38.6)#39 | 18.1%(+81.9)#81 |
| 82. | Mcalmont | 100.0% | 26.7%(+73.3)#1 | 18.1%(+81.9)#82 |
| 83. | Palmarejo | 100.0% | 61.4%(+38.6)#40 | 18.1%(+81.9)#83 |
| 84. | La Parguera | 100.0% | 61.4%(+38.6)#41 | 18.1%(+81.9)#84 |
| 85. | Elephant Butte | 100.0% | 27.4%(+72.6)#3 | 18.1%(+81.9)#85 |
| 86. | John Day | 100.0% | 14.6%(+85.4)#1 | 18.1%(+81.9)#86 |
| 87. | West Park | 100.0% | 14.3%(+85.7)#2 | 18.1%(+81.9)#87 |
| 88. | Lamar | 100.0% | 21.1%(+78.9)#6 | 18.1%(+81.9)#88 |
| 89. | Milam | 100.0% | 21.1%(+78.9)#7 | 18.1%(+81.9)#89 |
| 90. | Prosperity | 100.0% | 25.5%(+74.5)#2 | 18.1%(+81.9)#90 |
| 91. | Palmer | 100.0% | 21.1%(+78.9)#8 | 18.1%(+81.9)#91 |
| 92. | Spring Valley | 100.0% | 19.3%(+80.7)#3 | 18.1%(+81.9)#92 |
| 93. | Smoke Rise | 100.0% | 25.1%(+74.9)#3 | 18.1%(+81.9)#93 |
| 94. | Guayabal | 100.0% | 61.4%(+38.6)#42 | 18.1%(+81.9)#94 |
| 95. | Banks Springs | 100.0% | 28.4%(+71.6)#4 | 18.1%(+81.9)#96 |
| 96. | Palma Sola | 100.0% | 61.4%(+38.6)#43 | 18.1%(+81.9)#97 |
| 97. | Pine Knot | 100.0% | 23.3%(+76.7)#2 | 18.1%(+81.9)#98 |
| 98. | Buxton | 100.0% | 20.3%(+79.7)#1 | 18.1%(+81.9)#99 |
| 99. | South Dos Palos | 100.0% | 15.6%(+84.4)#3 | 18.1%(+81.9)#100 |
| 100. | Hudson | 100.0% | 17.3%(+82.7)#5 | 18.1%(+81.9)#101 |
Common Questions
What are the Top 10 Cities with the Highest Poverty Level Among Children Under the Age of 5 in the United States?
Top 10 Cities with the Highest Poverty Level Among Children Under the Age of 5 in the United States are:
#1
100.0%
#2
100.0%
#3
100.0%
#4
100.0%
#5
100.0%
#6
100.0%
#7
100.0%
#8
100.0%
#9
100.0%
#10
100.0%
What city has the Highest Poverty Level Among Children Under the Age of 5 in the United States?
Sun City has the Highest Poverty Level Among Children Under the Age of 5 in the United States with 100.0%.
What is the Poverty Level Among Children Under the Age of 5 in the United States?
Poverty Level Among Children Under the Age of 5 in the United States is 18.1%.