Cities with the Highest Poverty Level Among Children Under the Age of 5 in Utah
RELATED REPORTS & OPTIONS
Highest Poverty | Child 0-5
Utah
Compare Cities
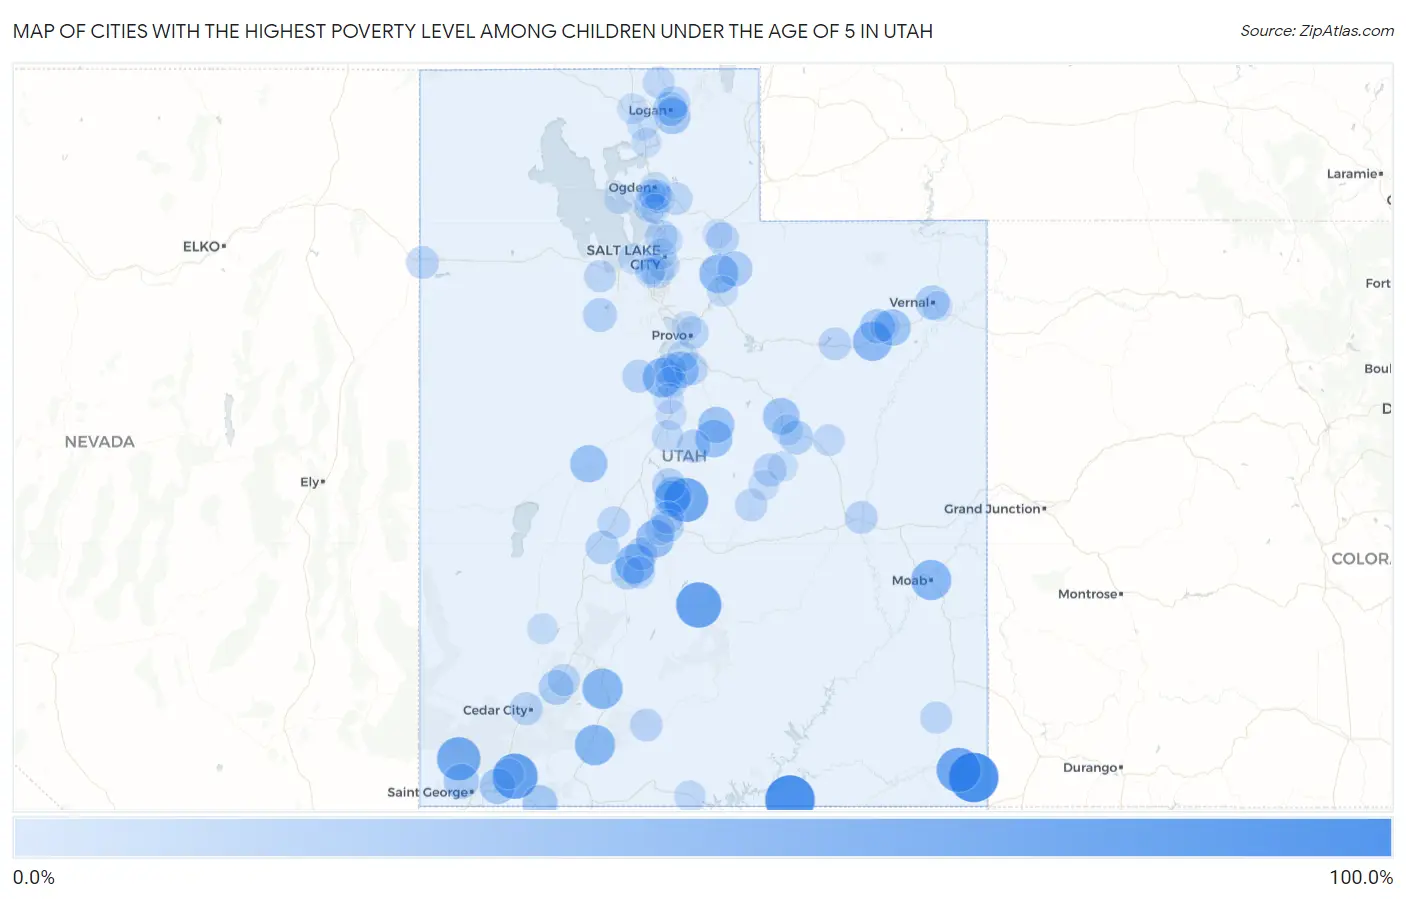
Map of Cities with the Highest Poverty Level Among Children Under the Age of 5 in Utah
0.0%
100.0%
Cities with the Highest Poverty Level Among Children Under the Age of 5 in Utah
| City | Child Poverty | vs State | vs National | |
| 1. | Navajo Mountain | 100.0% | 10.0%(+90.0)#1 | 18.1%(+81.9)#253 |
| 2. | Aneth | 100.0% | 10.0%(+90.0)#2 | 18.1%(+81.9)#409 |
| 3. | Virgin | 80.0% | 10.0%(+70.0)#3 | 18.1%(+61.9)#1,325 |
| 4. | Lyman | 80.0% | 10.0%(+70.0)#4 | 18.1%(+61.9)#1,351 |
| 5. | Montezuma Creek | 75.0% | 10.0%(+65.0)#5 | 18.1%(+56.9)#1,533 |
| 6. | Mayfield | 73.1% | 10.0%(+63.1)#6 | 18.1%(+55.0)#1,631 |
| 7. | Veyo | 70.6% | 10.0%(+60.6)#7 | 18.1%(+52.5)#1,750 |
| 8. | Panguitch | 56.5% | 10.0%(+46.5)#8 | 18.1%(+38.4)#2,822 |
| 9. | Alton | 56.2% | 10.0%(+46.3)#9 | 18.1%(+38.2)#2,841 |
| 10. | Moab | 55.6% | 10.0%(+45.7)#10 | 18.1%(+37.6)#2,898 |
| 11. | Elsinore | 52.5% | 10.0%(+42.5)#11 | 18.1%(+34.4)#3,185 |
| 12. | Goshen | 52.2% | 10.0%(+42.2)#12 | 18.1%(+34.1)#3,219 |
| 13. | Myton | 51.6% | 10.0%(+41.6)#13 | 18.1%(+33.6)#3,274 |
| 14. | Hideout | 49.6% | 10.0%(+39.6)#14 | 18.1%(+31.6)#3,597 |
| 15. | Sigurd | 45.5% | 10.0%(+35.5)#15 | 18.1%(+27.4)#4,088 |
| 16. | Delta | 42.8% | 10.0%(+32.8)#16 | 18.1%(+24.7)#4,488 |
| 17. | Mount Pleasant | 42.6% | 10.0%(+32.6)#17 | 18.1%(+24.5)#4,509 |
| 18. | Spring Lake | 41.3% | 10.0%(+31.3)#18 | 18.1%(+23.2)#4,681 |
| 19. | Gunnison | 39.8% | 10.0%(+29.8)#19 | 18.1%(+21.7)#4,944 |
| 20. | Helper | 39.5% | 10.0%(+29.5)#20 | 18.1%(+21.5)#4,981 |
| 21. | Fort Duchesne | 38.9% | 10.0%(+28.9)#21 | 18.1%(+20.8)#5,084 |
| 22. | Centerfield | 38.2% | 10.0%(+28.2)#22 | 18.1%(+20.2)#5,183 |
| 23. | Fairview | 38.1% | 10.0%(+28.1)#23 | 18.1%(+20.0)#5,196 |
| 24. | Hurricane | 35.7% | 10.0%(+25.7)#24 | 18.1%(+17.6)#5,654 |
| 25. | Millville | 35.6% | 10.0%(+25.7)#25 | 18.1%(+17.6)#5,655 |
| 26. | Ivins | 33.2% | 10.0%(+23.2)#26 | 18.1%(+15.1)#6,199 |
| 27. | Hildale | 31.9% | 10.0%(+22.0)#27 | 18.1%(+13.9)#6,403 |
| 28. | Marion | 31.6% | 10.0%(+21.6)#28 | 18.1%(+13.5)#6,467 |
| 29. | Parowan | 30.4% | 10.0%(+20.4)#29 | 18.1%(+12.3)#6,716 |
| 30. | Roosevelt | 30.3% | 10.0%(+20.3)#30 | 18.1%(+12.2)#6,735 |
| 31. | Vernal | 29.0% | 10.0%(+19.0)#31 | 18.1%(+10.9)#7,045 |
| 32. | Wellington | 27.3% | 10.0%(+17.3)#32 | 18.1%(+9.21)#7,485 |
| 33. | Rush Valley | 27.3% | 10.0%(+17.3)#33 | 18.1%(+9.21)#7,507 |
| 34. | Logan | 27.1% | 10.0%(+17.1)#34 | 18.1%(+9.05)#7,542 |
| 35. | Joseph | 26.7% | 10.0%(+16.7)#35 | 18.1%(+8.60)#7,652 |
| 36. | Kanosh | 26.1% | 10.0%(+16.1)#36 | 18.1%(+8.02)#7,782 |
| 37. | Fayette | 25.0% | 10.0%(+15.0)#37 | 18.1%(+6.94)#8,077 |
| 38. | Wales | 24.3% | 10.0%(+14.3)#38 | 18.1%(+6.26)#8,263 |
| 39. | Genola | 24.1% | 10.0%(+14.1)#39 | 18.1%(+6.04)#8,311 |
| 40. | Eureka | 23.1% | 10.0%(+13.1)#40 | 18.1%(+5.01)#8,611 |
| 41. | Cedar City | 22.8% | 10.0%(+12.9)#41 | 18.1%(+4.78)#8,677 |
| 42. | Green River | 22.5% | 10.0%(+12.5)#42 | 18.1%(+4.44)#8,779 |
| 43. | Huntington | 22.4% | 10.0%(+12.4)#43 | 18.1%(+4.34)#8,806 |
| 44. | Woodland Hills | 22.2% | 10.0%(+12.2)#44 | 18.1%(+4.16)#8,851 |
| 45. | Hoytsville | 22.2% | 10.0%(+12.2)#45 | 18.1%(+4.16)#8,854 |
| 46. | Salina | 21.9% | 10.0%(+11.9)#46 | 18.1%(+3.83)#8,962 |
| 47. | Clearfield | 21.9% | 10.0%(+11.9)#47 | 18.1%(+3.82)#8,964 |
| 48. | Redmond | 21.9% | 10.0%(+11.9)#48 | 18.1%(+3.81)#8,973 |
| 49. | Richfield | 21.9% | 10.0%(+11.9)#49 | 18.1%(+3.81)#8,978 |
| 50. | Wendover | 21.6% | 10.0%(+11.7)#50 | 18.1%(+3.59)#9,048 |
| 51. | Duchesne | 21.6% | 10.0%(+11.6)#51 | 18.1%(+3.57)#9,052 |
| 52. | West Bountiful | 21.4% | 10.0%(+11.4)#52 | 18.1%(+3.37)#9,115 |
| 53. | Cannonville | 21.4% | 10.0%(+11.4)#53 | 18.1%(+3.37)#9,138 |
| 54. | North Logan | 21.2% | 10.0%(+11.3)#54 | 18.1%(+3.18)#9,187 |
| 55. | Mountain Green | 21.2% | 10.0%(+11.2)#55 | 18.1%(+3.11)#9,211 |
| 56. | Ferron | 20.8% | 10.0%(+10.8)#56 | 18.1%(+2.69)#9,332 |
| 57. | Fillmore | 20.7% | 10.0%(+10.7)#57 | 18.1%(+2.60)#9,359 |
| 58. | Monroe | 20.2% | 10.0%(+10.2)#58 | 18.1%(+2.15)#9,485 |
| 59. | Provo | 20.1% | 10.0%(+10.1)#59 | 18.1%(+2.05)#9,506 |
| 60. | Grantsville | 19.4% | 10.0%(+9.42)#60 | 18.1%(+1.35)#9,762 |
| 61. | Blanding | 19.3% | 10.0%(+9.32)#61 | 18.1%(+1.25)#9,801 |
| 62. | Taylorsville | 19.1% | 10.0%(+9.15)#62 | 18.1%(+1.08)#9,847 |
| 63. | Paragonah | 19.0% | 10.0%(+8.98)#63 | 18.1%(+0.903)#9,903 |
| 64. | Levan | 18.2% | 10.0%(+8.19)#64 | 18.1%(+0.119)#10,145 |
| 65. | Washington Terrace | 17.9% | 10.0%(+7.87)#65 | 18.1%(-0.206)#10,254 |
| 66. | Trenton | 17.8% | 10.0%(+7.79)#66 | 18.1%(-0.285)#10,293 |
| 67. | South Salt Lake | 17.5% | 10.0%(+7.49)#67 | 18.1%(-0.585)#10,389 |
| 68. | Big Water | 17.4% | 10.0%(+7.40)#68 | 18.1%(-0.671)#10,429 |
| 69. | Rocky Ridge | 17.3% | 10.0%(+7.34)#69 | 18.1%(-0.736)#10,455 |
| 70. | East Carbon | 16.9% | 10.0%(+6.89)#70 | 18.1%(-1.18)#10,578 |
| 71. | Price | 15.2% | 10.0%(+5.24)#71 | 18.1%(-2.83)#11,172 |
| 72. | Ogden | 14.8% | 10.0%(+4.79)#72 | 18.1%(-3.28)#11,326 |
| 73. | West Valley City | 14.7% | 10.0%(+4.73)#73 | 18.1%(-3.34)#11,339 |
| 74. | Magna | 14.7% | 10.0%(+4.73)#74 | 18.1%(-3.34)#11,340 |
| 75. | Salt Lake City | 14.2% | 10.0%(+4.21)#75 | 18.1%(-3.87)#11,552 |
| 76. | Benjamin | 14.0% | 10.0%(+4.05)#76 | 18.1%(-4.03)#11,600 |
| 77. | Minersville | 13.8% | 10.0%(+3.86)#77 | 18.1%(-4.22)#11,680 |
| 78. | Heber | 13.8% | 10.0%(+3.85)#78 | 18.1%(-4.23)#11,681 |
| 79. | La Verkin | 13.6% | 10.0%(+3.62)#79 | 18.1%(-4.46)#11,781 |
| 80. | Honeyville | 13.3% | 10.0%(+3.35)#80 | 18.1%(-4.73)#11,863 |
| 81. | Castle Dale | 13.2% | 10.0%(+3.25)#81 | 18.1%(-4.83)#11,912 |
| 82. | Nephi | 13.2% | 10.0%(+3.23)#82 | 18.1%(-4.85)#11,915 |
| 83. | Sunset | 13.1% | 10.0%(+3.07)#83 | 18.1%(-5.00)#11,970 |
| 84. | Hooper | 13.0% | 10.0%(+2.97)#84 | 18.1%(-5.10)#12,006 |
| 85. | Garland | 12.8% | 10.0%(+2.82)#85 | 18.1%(-5.25)#12,067 |
| 86. | Bountiful | 12.8% | 10.0%(+2.78)#86 | 18.1%(-5.29)#12,081 |
| 87. | Aurora | 12.7% | 10.0%(+2.74)#87 | 18.1%(-5.34)#12,106 |
| 88. | Mona | 12.2% | 10.0%(+2.23)#88 | 18.1%(-5.85)#12,305 |
| 89. | Naples | 12.1% | 10.0%(+2.10)#89 | 18.1%(-5.97)#12,342 |
| 90. | Ballard | 11.9% | 10.0%(+1.88)#90 | 18.1%(-6.20)#12,424 |
| 91. | River Heights | 11.6% | 10.0%(+1.61)#91 | 18.1%(-6.47)#12,531 |
| 92. | Cleveland | 11.1% | 10.0%(+1.12)#92 | 18.1%(-6.95)#12,739 |
| 93. | Brigham City | 11.0% | 10.0%(+0.987)#93 | 18.1%(-7.09)#12,796 |
| 94. | Uintah | 10.4% | 10.0%(+0.459)#94 | 18.1%(-7.62)#13,003 |
| 95. | Coalville | 10.4% | 10.0%(+0.428)#95 | 18.1%(-7.65)#13,016 |
| 96. | Orem | 10.4% | 10.0%(+0.379)#96 | 18.1%(-7.70)#13,032 |
| 97. | South Ogden | 10.3% | 10.0%(+0.337)#97 | 18.1%(-7.74)#13,045 |
| 98. | Kearns | 10.3% | 10.0%(+0.319)#98 | 18.1%(-7.76)#13,052 |
| 99. | Riverdale | 10.1% | 10.0%(+0.101)#99 | 18.1%(-7.97)#13,132 |
| 100. | Layton | 10.1% | 10.0%(+0.064)#100 | 18.1%(-8.01)#13,144 |
Common Questions
What are the Top 10 Cities with the Highest Poverty Level Among Children Under the Age of 5 in Utah?
Top 10 Cities with the Highest Poverty Level Among Children Under the Age of 5 in Utah are:
#1
100.0%
#2
100.0%
#3
80.0%
#4
80.0%
#5
75.0%
#6
73.1%
#7
70.6%
#8
56.5%
#9
56.2%
#10
55.6%
What city has the Highest Poverty Level Among Children Under the Age of 5 in Utah?
Navajo Mountain has the Highest Poverty Level Among Children Under the Age of 5 in Utah with 100.0%.
What is the Poverty Level Among Children Under the Age of 5 in the State of Utah?
Poverty Level Among Children Under the Age of 5 in Utah is 10.0%.
What is the Poverty Level Among Children Under the Age of 5 in the United States?
Poverty Level Among Children Under the Age of 5 in the United States is 18.1%.