Zip Codes with the Highest Poverty Level Among Children Under the Age of 5 in California
RELATED REPORTS & OPTIONS
Highest Poverty | Child 0-5
California
Compare Zip Codes
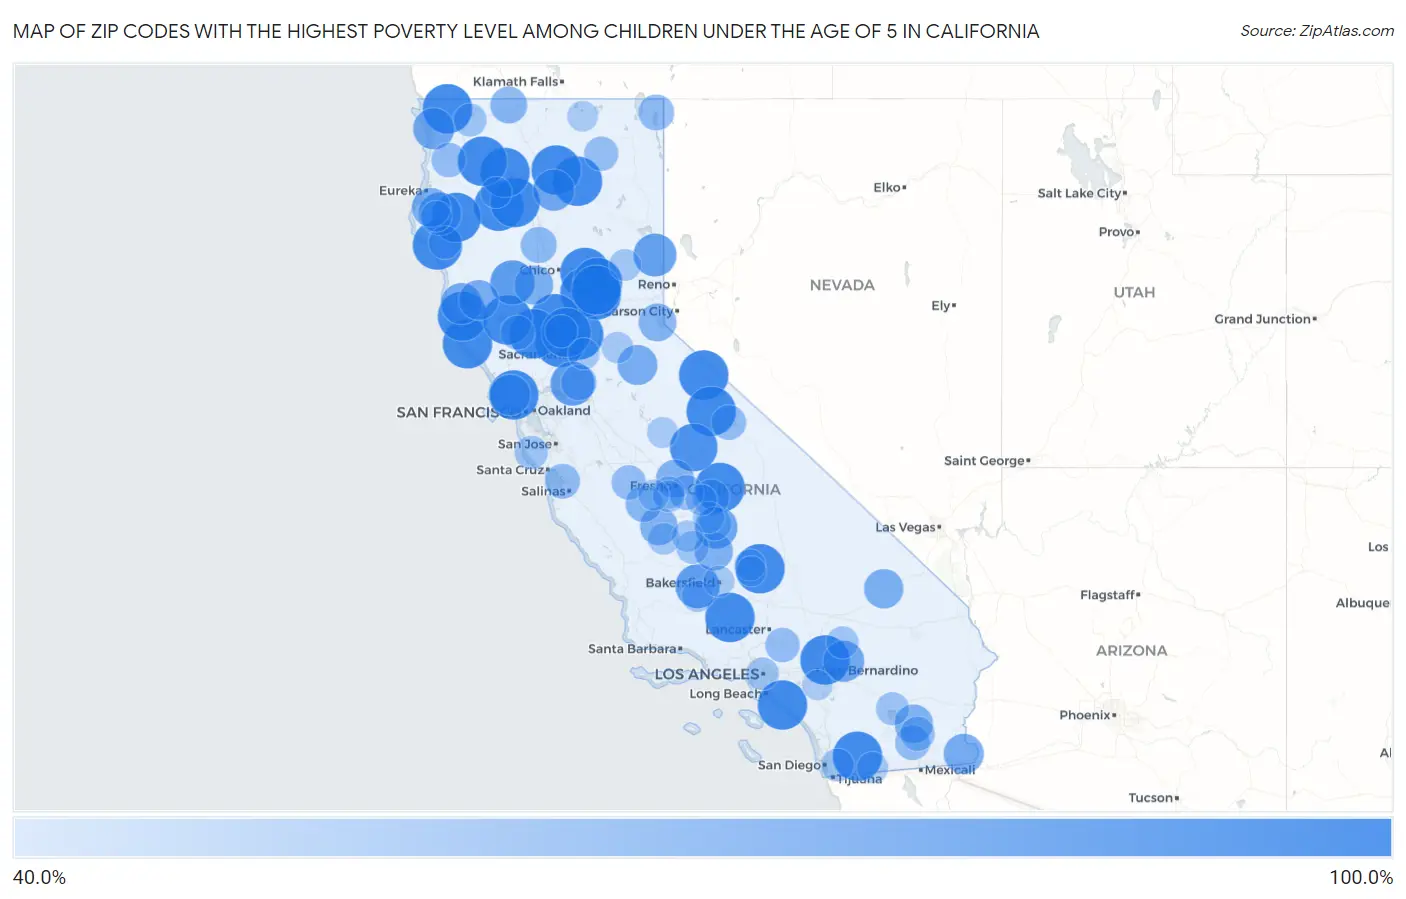
Map of Zip Codes with the Highest Poverty Level Among Children Under the Age of 5 in California
40.0%
100.0%
Zip Codes with the Highest Poverty Level Among Children Under the Age of 5 in California
| Zip Code | Child Poverty | vs State | vs National | |
| 1. | 92661 | 100.0% | 15.6%(+84.4)#1 | 18.1%(+81.9)#10 |
| 2. | 93283 | 100.0% | 15.6%(+84.4)#2 | 18.1%(+81.9)#15 |
| 3. | 94973 | 100.0% | 15.6%(+84.4)#3 | 18.1%(+81.9)#47 |
| 4. | 95497 | 100.0% | 15.6%(+84.4)#4 | 18.1%(+81.9)#69 |
| 5. | 95589 | 100.0% | 15.6%(+84.4)#5 | 18.1%(+81.9)#73 |
| 6. | 96024 | 100.0% | 15.6%(+84.4)#6 | 18.1%(+81.9)#78 |
| 7. | 93243 | 100.0% | 15.6%(+84.4)#7 | 18.1%(+81.9)#92 |
| 8. | 95916 | 100.0% | 15.6%(+84.4)#8 | 18.1%(+81.9)#94 |
| 9. | 95466 | 100.0% | 15.6%(+84.4)#9 | 18.1%(+81.9)#105 |
| 10. | 96087 | 100.0% | 15.6%(+84.4)#10 | 18.1%(+81.9)#123 |
| 11. | 92321 | 100.0% | 15.6%(+84.4)#11 | 18.1%(+81.9)#136 |
| 12. | 91931 | 100.0% | 15.6%(+84.4)#12 | 18.1%(+81.9)#145 |
| 13. | 96091 | 100.0% | 15.6%(+84.4)#13 | 18.1%(+81.9)#160 |
| 14. | 95526 | 100.0% | 15.6%(+84.4)#14 | 18.1%(+81.9)#183 |
| 15. | 93517 | 100.0% | 15.6%(+84.4)#15 | 18.1%(+81.9)#199 |
| 16. | 95668 | 100.0% | 15.6%(+84.4)#16 | 18.1%(+81.9)#228 |
| 17. | 95935 | 100.0% | 15.6%(+84.4)#17 | 18.1%(+81.9)#244 |
| 18. | 95914 | 100.0% | 15.6%(+84.4)#18 | 18.1%(+81.9)#255 |
| 19. | 95950 | 100.0% | 15.6%(+84.4)#19 | 18.1%(+81.9)#262 |
| 20. | 95930 | 100.0% | 15.6%(+84.4)#20 | 18.1%(+81.9)#270 |
| 21. | 95543 | 100.0% | 15.6%(+84.4)#21 | 18.1%(+81.9)#289 |
| 22. | 96016 | 100.0% | 15.6%(+84.4)#22 | 18.1%(+81.9)#325 |
| 23. | 93529 | 100.0% | 15.6%(+84.4)#23 | 18.1%(+81.9)#331 |
| 24. | 95697 | 100.0% | 15.6%(+84.4)#24 | 18.1%(+81.9)#345 |
| 25. | 95637 | 100.0% | 15.6%(+84.4)#25 | 18.1%(+81.9)#354 |
| 26. | 96011 | 100.0% | 15.6%(+84.4)#26 | 18.1%(+81.9)#383 |
| 27. | 93641 | 100.0% | 15.6%(+84.4)#27 | 18.1%(+81.9)#395 |
| 28. | 95443 | 100.0% | 15.6%(+84.4)#28 | 18.1%(+81.9)#425 |
| 29. | 95925 | 100.0% | 15.6%(+84.4)#29 | 18.1%(+81.9)#426 |
| 30. | 95676 | 100.0% | 15.6%(+84.4)#30 | 18.1%(+81.9)#499 |
| 31. | 96031 | 100.0% | 15.6%(+84.4)#31 | 18.1%(+81.9)#532 |
| 32. | 93643 | 95.1% | 15.6%(+79.5)#32 | 18.1%(+77.0)#579 |
| 33. | 95939 | 86.7% | 15.6%(+71.1)#33 | 18.1%(+68.6)#680 |
| 34. | 95641 | 85.7% | 15.6%(+70.1)#34 | 18.1%(+67.7)#691 |
| 35. | 93276 | 85.7% | 15.6%(+70.1)#35 | 18.1%(+67.7)#695 |
| 36. | 96109 | 82.8% | 15.6%(+67.2)#36 | 18.1%(+64.7)#750 |
| 37. | 95528 | 81.9% | 15.6%(+66.3)#37 | 18.1%(+63.8)#770 |
| 38. | 93267 | 81.1% | 15.6%(+65.5)#38 | 18.1%(+63.0)#790 |
| 39. | 96084 | 78.6% | 15.6%(+63.0)#39 | 18.1%(+60.5)#854 |
| 40. | 95548 | 78.4% | 15.6%(+62.8)#40 | 18.1%(+60.3)#860 |
| 41. | 95427 | 78.1% | 15.6%(+62.5)#41 | 18.1%(+60.1)#866 |
| 42. | 92386 | 78.0% | 15.6%(+62.4)#42 | 18.1%(+60.0)#868 |
| 43. | 94933 | 76.9% | 15.6%(+61.3)#43 | 18.1%(+58.9)#900 |
| 44. | 92283 | 75.0% | 15.6%(+59.4)#44 | 18.1%(+56.9)#955 |
| 45. | 95470 | 74.8% | 15.6%(+59.2)#45 | 18.1%(+56.7)#977 |
| 46. | 95255 | 74.7% | 15.6%(+59.1)#46 | 18.1%(+56.6)#979 |
| 47. | 92309 | 73.1% | 15.6%(+57.5)#47 | 18.1%(+55.0)#1,048 |
| 48. | 95988 | 72.3% | 15.6%(+56.7)#48 | 18.1%(+54.2)#1,073 |
| 49. | 95547 | 72.0% | 15.6%(+56.4)#49 | 18.1%(+53.9)#1,081 |
| 50. | 92257 | 71.1% | 15.6%(+55.5)#50 | 18.1%(+53.0)#1,111 |
| 51. | 93261 | 70.9% | 15.6%(+55.3)#51 | 18.1%(+52.9)#1,115 |
| 52. | 93650 | 69.6% | 15.6%(+54.0)#52 | 18.1%(+51.5)#1,165 |
| 53. | 93234 | 69.6% | 15.6%(+54.0)#53 | 18.1%(+51.5)#1,167 |
| 54. | 96142 | 69.4% | 15.6%(+53.8)#54 | 18.1%(+51.3)#1,176 |
| 55. | 96044 | 66.7% | 15.6%(+51.1)#55 | 18.1%(+48.6)#1,283 |
| 56. | 93608 | 65.5% | 15.6%(+49.9)#56 | 18.1%(+47.5)#1,363 |
| 57. | 93647 | 65.4% | 15.6%(+49.8)#57 | 18.1%(+47.4)#1,367 |
| 58. | 96035 | 64.6% | 15.6%(+48.9)#58 | 18.1%(+46.5)#1,407 |
| 59. | 96112 | 64.3% | 15.6%(+48.7)#59 | 18.1%(+46.2)#1,432 |
| 60. | 95686 | 63.0% | 15.6%(+47.4)#60 | 18.1%(+45.0)#1,500 |
| 61. | 95039 | 61.9% | 15.6%(+46.3)#61 | 18.1%(+43.8)#1,561 |
| 62. | 92281 | 61.8% | 15.6%(+46.2)#62 | 18.1%(+43.8)#1,570 |
| 63. | 93616 | 61.3% | 15.6%(+45.7)#63 | 18.1%(+43.3)#1,608 |
| 64. | 93546 | 61.2% | 15.6%(+45.5)#64 | 18.1%(+43.1)#1,616 |
| 65. | 95546 | 60.6% | 15.6%(+45.0)#65 | 18.1%(+42.5)#1,646 |
| 66. | 93622 | 60.6% | 15.6%(+45.0)#66 | 18.1%(+42.5)#1,647 |
| 67. | 93553 | 60.5% | 15.6%(+44.9)#67 | 18.1%(+42.5)#1,649 |
| 68. | 92233 | 60.4% | 15.6%(+44.7)#68 | 18.1%(+42.3)#1,656 |
| 69. | 96054 | 60.0% | 15.6%(+44.4)#69 | 18.1%(+41.9)#1,697 |
| 70. | 95457 | 59.9% | 15.6%(+44.3)#70 | 18.1%(+41.8)#1,710 |
| 71. | 93247 | 57.7% | 15.6%(+42.1)#71 | 18.1%(+39.6)#1,852 |
| 72. | 94060 | 57.4% | 15.6%(+41.8)#72 | 18.1%(+39.3)#1,870 |
| 73. | 92254 | 57.2% | 15.6%(+41.6)#73 | 18.1%(+39.2)#1,880 |
| 74. | 96039 | 56.8% | 15.6%(+41.1)#74 | 18.1%(+38.7)#1,928 |
| 75. | 95542 | 56.6% | 15.6%(+41.0)#75 | 18.1%(+38.5)#1,939 |
| 76. | 91978 | 56.3% | 15.6%(+40.7)#76 | 18.1%(+38.3)#1,962 |
| 77. | 95645 | 55.8% | 15.6%(+40.2)#77 | 18.1%(+37.7)#2,005 |
| 78. | 90017 | 55.7% | 15.6%(+40.1)#78 | 18.1%(+37.6)#2,013 |
| 79. | 93201 | 55.6% | 15.6%(+40.0)#79 | 18.1%(+37.5)#2,018 |
| 80. | 92356 | 55.0% | 15.6%(+39.4)#80 | 18.1%(+36.9)#2,067 |
| 81. | 93706 | 54.7% | 15.6%(+39.1)#81 | 18.1%(+36.6)#2,090 |
| 82. | 93239 | 53.7% | 15.6%(+38.1)#82 | 18.1%(+35.6)#2,175 |
| 83. | 96103 | 53.6% | 15.6%(+38.0)#83 | 18.1%(+35.5)#2,184 |
| 84. | 93652 | 53.3% | 15.6%(+37.7)#84 | 18.1%(+35.3)#2,224 |
| 85. | 93223 | 53.2% | 15.6%(+37.6)#85 | 18.1%(+35.1)#2,233 |
| 86. | 95825 | 52.9% | 15.6%(+37.3)#86 | 18.1%(+34.9)#2,257 |
| 87. | 93212 | 52.8% | 15.6%(+37.2)#87 | 18.1%(+34.7)#2,273 |
| 88. | 95619 | 52.7% | 15.6%(+37.1)#88 | 18.1%(+34.6)#2,277 |
| 89. | 93268 | 52.6% | 15.6%(+36.9)#89 | 18.1%(+34.5)#2,293 |
| 90. | 91905 | 52.5% | 15.6%(+36.9)#90 | 18.1%(+34.4)#2,299 |
| 91. | 96093 | 52.3% | 15.6%(+36.7)#91 | 18.1%(+34.2)#2,319 |
| 92. | 93301 | 52.3% | 15.6%(+36.7)#92 | 18.1%(+34.2)#2,320 |
| 93. | 93240 | 51.9% | 15.6%(+36.3)#93 | 18.1%(+33.9)#2,345 |
| 94. | 93666 | 51.9% | 15.6%(+36.3)#94 | 18.1%(+33.9)#2,349 |
| 95. | 95565 | 51.8% | 15.6%(+36.2)#95 | 18.1%(+33.7)#2,359 |
| 96. | 93660 | 51.5% | 15.6%(+35.9)#96 | 18.1%(+33.4)#2,383 |
| 97. | 95338 | 51.4% | 15.6%(+35.8)#97 | 18.1%(+33.3)#2,397 |
| 98. | 96134 | 50.6% | 15.6%(+35.0)#98 | 18.1%(+32.6)#2,461 |
| 99. | 93205 | 50.0% | 15.6%(+34.4)#99 | 18.1%(+31.9)#2,529 |
| 100. | 92518 | 50.0% | 15.6%(+34.4)#100 | 18.1%(+31.9)#2,543 |
Common Questions
What are the Top 10 Zip Codes with the Highest Poverty Level Among Children Under the Age of 5 in California?
Top 10 Zip Codes with the Highest Poverty Level Among Children Under the Age of 5 in California are:
What zip code has the Highest Poverty Level Among Children Under the Age of 5 in California?
92661 has the Highest Poverty Level Among Children Under the Age of 5 in California with 100.0%.
What is the Poverty Level Among Children Under the Age of 5 in the State of California?
Poverty Level Among Children Under the Age of 5 in California is 15.6%.
What is the Poverty Level Among Children Under the Age of 5 in the United States?
Poverty Level Among Children Under the Age of 5 in the United States is 18.1%.